Embed Size (px)
Citation preview

7/27/2019 Sociometry Analysis of Networks & Path Analysis - Research Methods (Psychology)
http://slidepdf.com/reader/full/sociometry-analysis-of-networks-path-analysis-research-methods-psychology 1/16
Sociometry, Network Analysis, &
Path Analysis
PSY 4603
Research Methods
7/27/2019 Sociometry Analysis of Networks & Path Analysis - Research Methods (Psychology)
http://slidepdf.com/reader/full/sociometry-analysis-of-networks-path-analysis-research-methods-psychology 2/16
• While some use the term "sociometry" to refer to all research usingquantitative scales, it is used here in its narrower meaning, sometimescalled sociography, which is a method of presenting data aboutcomplex individual relationships and networks in graph form.
• Sociometry was developed by Jacob L. Moreno in the 1930s andbecame closely associated with small group research and a focus oninterpersonal choices.
• As a largely subjective but empirical, phenomenological approach tothe study of group structure, sociometry can serve as a contrast or complement to the formal study of group structure through archivalrecords. – In addition to its social scientific purposes, discussed a bit later,
sociometric assessment of interpersonal choices also plays a role inpersonal or group growth by helping facilitate constructive change inindividuals and groups through greater interpersonal awareness.
– For this reasons, in some circles the term sociometry refers to a form of therapy related to psychodrama.

7/27/2019 Sociometry Analysis of Networks & Path Analysis - Research Methods (Psychology)
http://slidepdf.com/reader/full/sociometry-analysis-of-networks-path-analysis-research-methods-psychology 3/16
• Key Concepts and Terms
– Sociometric Tests
• Sociometric Tests are simply surveys which are
administered to subjects (typically all subjects in asmall group) to determine the direction of certain
relationships.
• This can sometimes be assessed through simple
observation. – For example, a sociometric test might ask members of a
department which other members they are most/least likely
to consult on important questions; whom they hold in
highest/lowest esteem; or with whom they most/least likely
to see face-to-face during the previous week.

7/27/2019 Sociometry Analysis of Networks & Path Analysis - Research Methods (Psychology)
http://slidepdf.com/reader/full/sociometry-analysis-of-networks-path-analysis-research-methods-psychology 4/16
– Sociometric Representation
• Sociometric representation refers to various
graphical methods of data presentation.
• Some common sociometric representations areillustrated in the next figure …

7/27/2019 Sociometry Analysis of Networks & Path Analysis - Research Methods (Psychology)
http://slidepdf.com/reader/full/sociometry-analysis-of-networks-path-analysis-research-methods-psychology 5/16
• In each representation, individuals are depicted as points.• The star representation is made up of several lines pointing
toward or away from a central point, which represents an
individual who is involved in relationships with each of the other
points, and where the arrows represent relationships such as
reciprocation, ignoring, or rejection.• Other common representations include the chain (a series of
relationships); the pair (a mutually reciprocated relationship);
the power (short for "power behind the throne," who is the
object of attraction of a few very sociometrically attractive
individuals; and the isolate (a subject not chosen by anyone).

7/27/2019 Sociometry Analysis of Networks & Path Analysis - Research Methods (Psychology)
http://slidepdf.com/reader/full/sociometry-analysis-of-networks-path-analysis-research-methods-psychology 6/16
• Inclusiveness is the percentage of non-isolated points in asociometric diagram.
• A 25-point graph with five isolated points has an inclusivenessof 0.80 (20/25 = .80).
• Density is the number of lines as a percentage of total lines
when all points are connected. – Total lines, based on probability, is nC2 = n!/(n - 2)!2!.
– For example, the number of lines connecting 6 points taken 2 at atime is 6!/[(6-2)!2!] = 720/(24*2) = 15.
– If a sociometric diagram had 10 lines, out of the possible total of 15, its density would be .67.
– This assumes a non-directed graph in which the lines are
bi-directional or non-directional.
– For a directed graph in which all lines are one-directional, the totalpossible number of lines would be twice the calculation above (30)and thus the density would be half as much (.33).
7/27/2019 Sociometry Analysis of Networks & Path Analysis - Research Methods (Psychology)
http://slidepdf.com/reader/full/sociometry-analysis-of-networks-path-analysis-research-methods-psychology 7/16
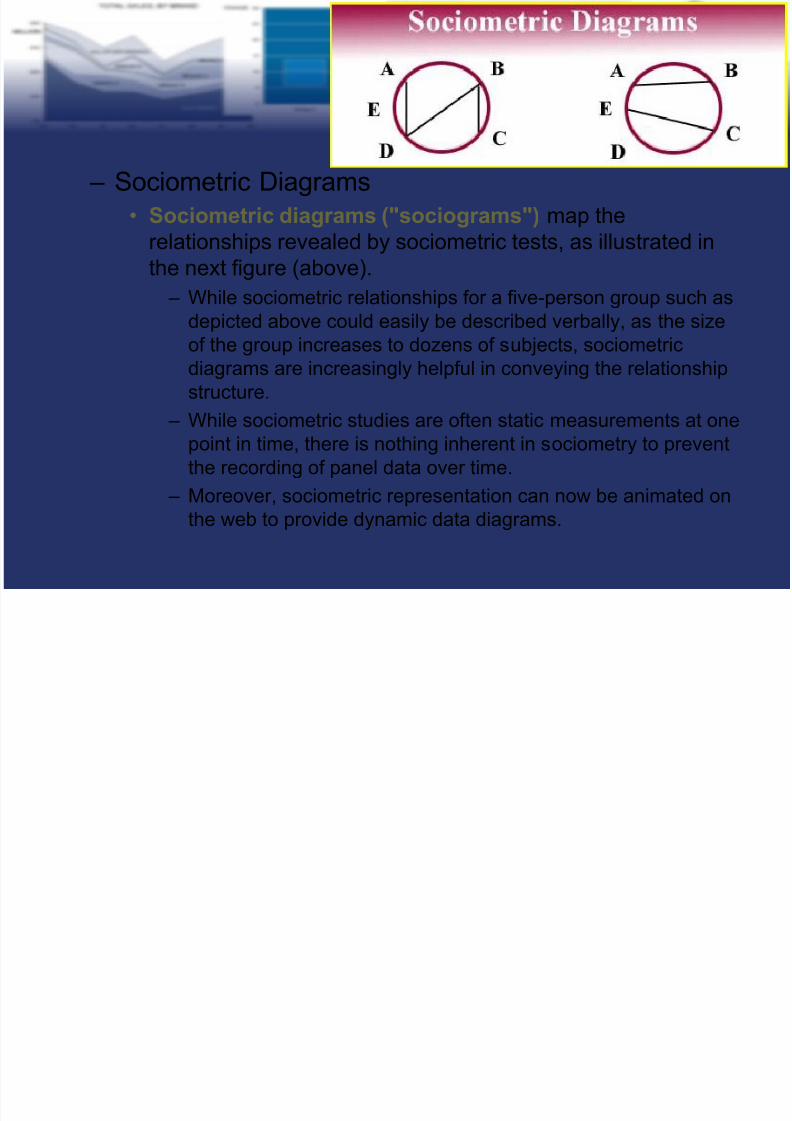
– Sociometric Diagrams
• Sociometric diagrams ("sociograms") map the
relationships revealed by sociometric tests, as illustrated in
the next figure (above). – While sociometric relationships for a five-person group such as
depicted above could easily be described verbally, as the size
of the group increases to dozens of subjects, sociometric
diagrams are increasingly helpful in conveying the relationship
structure.
– While sociometric studies are often static measurements at onepoint in time, there is nothing inherent in sociometry to prevent
the recording of panel data over time.
– Moreover, sociometric representation can now be animated on
the web to provide dynamic data diagrams.
7/27/2019 Sociometry Analysis of Networks & Path Analysis - Research Methods (Psychology)
http://slidepdf.com/reader/full/sociometry-analysis-of-networks-path-analysis-research-methods-psychology 8/16
– Sociometric Matrices• Sociometric matrices are an alternative form of data
representation, used primarily when group size makessociometric diagrams too complex.
• The matrix is an n-b-n square table representing subjects both
across the top and down the side.• For each possible pair, the range of the criterion is shown.
– For example, for the criterion "With whom do you most like towork?", the ranges might be attraction = +1, indifference=0,dislike = -1.
– This sociometric information may be used to create an index of popularity by group by comparing the proportion of memberschosen as desirable work partners in one group divided by groupsize, compared to a similar index in another group.
– An adjacency matrix is essentially similar, but cell entries are 1'sand 0's, depending on whether the pair of subjects are adjacentby some criterion.
7/27/2019 Sociometry Analysis of Networks & Path Analysis - Research Methods (Psychology)
http://slidepdf.com/reader/full/sociometry-analysis-of-networks-path-analysis-research-methods-psychology 9/16
– Network Data Diagrams• Network data diagrams exist to provide a variety of graphic representations of networks
alternative to classic sociograms: – Path diagrams, not necessarily based on actual path analysis, represent variables or groups as
circles, relationships (which may be correlations, communications, formal associations, or other interactions) as arrows, and, often, magnitude of relationship by thickness of the arrow.
– Cluster diagrams represent variables or groups as points on one or more two-dimensionalscatterplots or polar plots, with the proximity of points representing their similarity on thedimensions, and clusters of points may be highlighted by perimeter lines around each cluster
(including the possibility of intersecting perimeters where a point may belong to two or moreclusters).
– Factor plots similarly represent variables or groups as points on one or more two-dimensionalscatterplots, where the dimensions are factors (see factor analysis); optionally, factor space maybe divided into non-intersecting quadrants to highlight similarities among points.
– Centrality plots are polar plots in which the heavier the loading of the variable or group on thedimension, the closer it is located to the center of the plot.
» Optionally, concentric circles may highlight which points share a similar degree of centralityon the depicted dimension. Loadings may reflect factor loadings, path distances, or an indexof the author's devising.
» Centrality index numbers, if assigned to points, are usually coded such that heavier loadingsare represented as lower numbers.
» In centrality plots, direction of location with respect to the center (up/down, left/right) oftenhas no meaning other than aesthetics of placement, but direction can be used to depict asecond and third dimension.
– Spatial network diagrams. In the context of geographic information systems, software such as ArcView implement network analysis modules which generate map graphics depicting such thingsas shortest route between two objects, optimal route passing through a series of objects, or serviceareas (by best time or shortest distance) associated with multiple points.

7/27/2019 Sociometry Analysis of Networks & Path Analysis - Research Methods (Psychology)
http://slidepdf.com/reader/full/sociometry-analysis-of-networks-path-analysis-research-methods-psychology 10/16
• Assumptions Associated with Sociometry (Reader’sDigest version) – Measurement Inerrancy
• Measurement inerrancy. Sociometric mapping assumes, of course,that individuals respond accurately to sociometric surveys or can be
assessed accurately through observation.• However, sociometry is open to several common problems. It tendsnot to record subconscious or illicit relationships.
• It may be biased toward recording attractions rather than dislikesbecause subjects more easily reveal the attractions than the dislikes.
– Hey, no one wants to look like the mean guy.
• It is best when subjective sociometric responses can be validated
through external objective measures. – Small Group Size
• Small group size. Sociometric diagramming becomes unwieldy anddifficult for readers to interpret for very large groups.
• Also, sociometric techniques may be biased in larger groups sincesubjects tend to confine their choices to their own class range.
7/27/2019 Sociometry Analysis of Networks & Path Analysis - Research Methods (Psychology)
http://slidepdf.com/reader/full/sociometry-analysis-of-networks-path-analysis-research-methods-psychology 11/16
– Overview• Path analysis is an extension of the regression model, used to test the fit of
the correlation matrix against two or more causal models which are beingcompared by the researcher.
• The model is usually depicted in a circle-and-arrow figure in which singlearrows indicate causation.
• A regression is done for each variable in the model as a dependent on
others which the model indicates are causes. – The regression weights predicted by the model are compared with the observed
correlation matrix for the variables, and a goodness-of-fit statistic is calculated.
– The best-fitting of two or more models is selected by the researcher as the bestmodel for advancement of theory.
» Path analysis requires the usual assumptions of regression.
» It is particularly sensitive to model specification because failure to includerelevant causal variables or inclusion of extraneous variables often
substantially affects the path coefficients, which are used to assess therelative importance of various direct and indirect causal paths to thedependent variable.
» Such interpretations should be undertaken in the context of comparingalternative models, after assessing their goodness of fit used with structuralequation modeling (SEM packages are commonly used today for pathanalysis in lieu of stand-alone path analysis programs).
Path Analysis

7/27/2019 Sociometry Analysis of Networks & Path Analysis - Research Methods (Psychology)
http://slidepdf.com/reader/full/sociometry-analysis-of-networks-path-analysis-research-methods-psychology 12/16
• Key Concepts and Terms – Path Model
• A path model is a diagram relating independent, intermediary,and dependent variables.
– Single arrows indicate causation between exogenous or
intermediary variables and the dependent(s). – Arrows also connect the error terms with their respective
endogenous variables.
– Double arrows indicate correlation between pairs of exogenousvariables.
– Sometimes the width of the arrows in the path model are drawn in
a width which is proportional to the absolute magnitude of thecorresponding path coefficients (we’ll see this in a bit).

7/27/2019 Sociometry Analysis of Networks & Path Analysis - Research Methods (Psychology)
http://slidepdf.com/reader/full/sociometry-analysis-of-networks-path-analysis-research-methods-psychology 13/16
– Causal paths to a given variable include (1) the direct paths from arrowsleading to it, and (2) correlated paths from endogenous variablescorrelated with others which have arrows leading to the given variable.
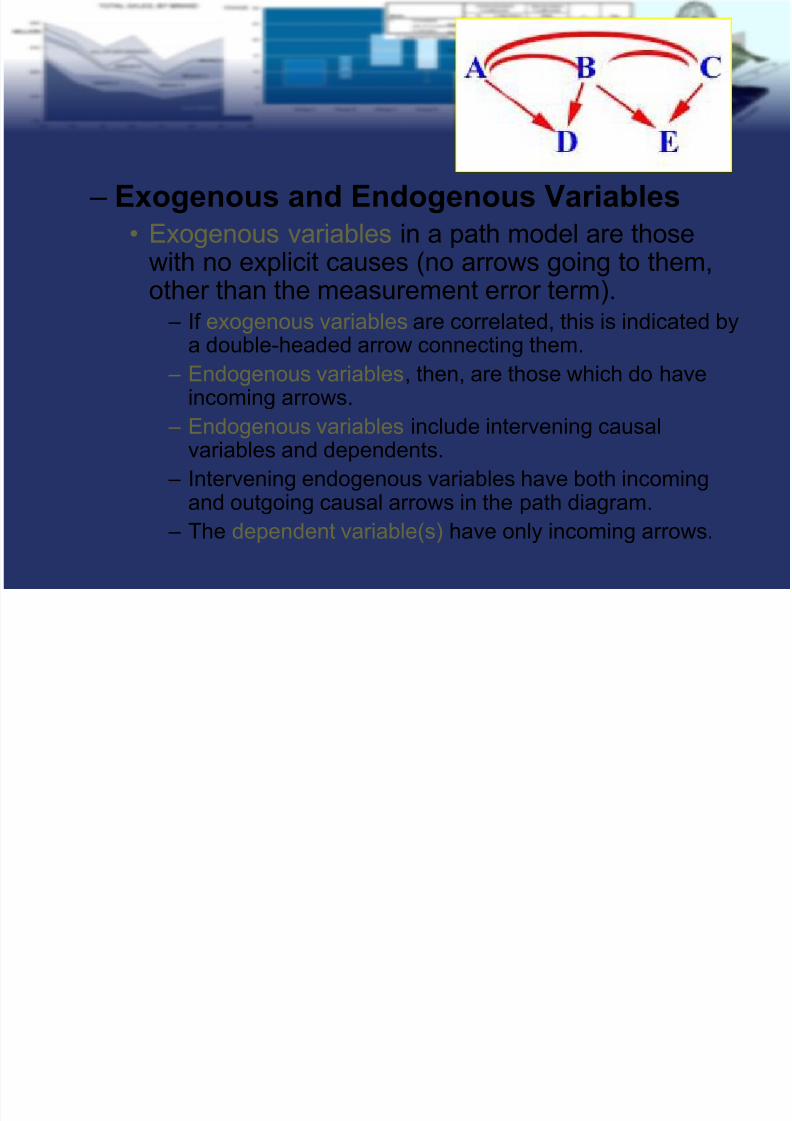
• Consider this model:
• This model has correlated exogenous variables A, B, and C, and endogenousvariables D and E.
– Error terms are not shown.
• The causal paths relevant to variable D are – the paths from A to D, from B to D, and
– the paths reflecting common anteceding causes -- the paths from B to A to D, from Cto A to D, and from C to B to D.
– Paths involving two correlations (C to B to A to D) are not relevant.
– Likewise, paths that go backward (E to B to D, or E to B to A to D) reflect commoneffects and are not relevant.
7/27/2019 Sociometry Analysis of Networks & Path Analysis - Research Methods (Psychology)
http://slidepdf.com/reader/full/sociometry-analysis-of-networks-path-analysis-research-methods-psychology 14/16
– Exogenous and Endogenous Variables• Exogenous variables in a path model are those
with no explicit causes (no arrows going to them,other than the measurement error term).
– If exogenous variables are correlated, this is indicated bya double-headed arrow connecting them.
– Endogenous variables, then, are those which do haveincoming arrows.
– Endogenous variables include intervening causalvariables and dependents.
– Intervening endogenous variables have both incomingand outgoing causal arrows in the path diagram.
– The dependent variable(s) have only incoming arrows.
7/27/2019 Sociometry Analysis of Networks & Path Analysis - Research Methods (Psychology)
http://slidepdf.com/reader/full/sociometry-analysis-of-networks-path-analysis-research-methods-psychology 15/16
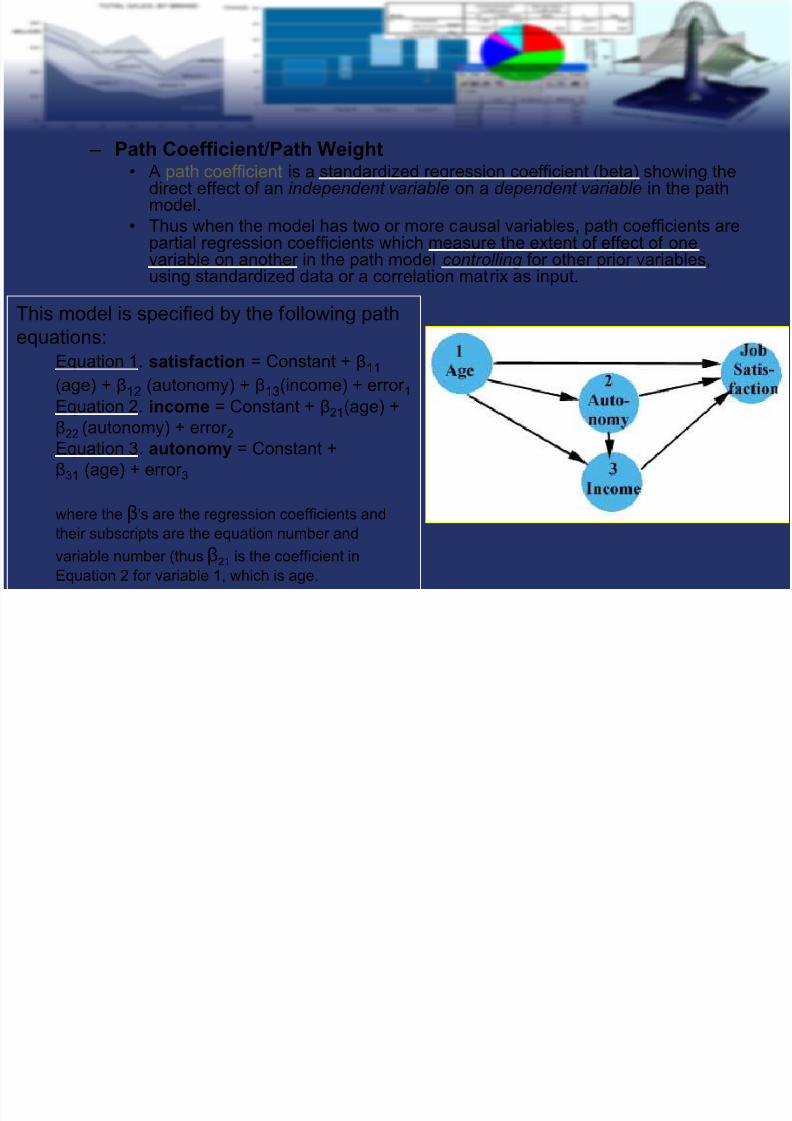
– Path Coefficient/Path Weight • A path coefficient is a standardized regression coefficient (beta) showing the
direct effect of an i ndependent variable on a dependent variable in the pathmodel.
• Thus when the model has two or more causal variables, path coefficients arepartial regression coefficients which measure the extent of effect of onevariable on another in the path model controlling for other prior variables,
using standardized data or a correlation matrix as input.
This model is specified by the following path
equations:
Equation 1. satisfaction = Constant + β11
(age) + β12 (autonomy) + β13(income) + error 1
Equation 2. income = Constant + β21
(age) +
β22 (autonomy) + error 2Equation 3. autonomy = Constant +
β31 (age) + error 3
where the β's are the regression coefficients and
their subscripts are the equation number and
variable number (thus β21 is the coefficient inEquation 2 for variable 1, which is age.

7/27/2019 Sociometry Analysis of Networks & Path Analysis - Research Methods (Psychology)
http://slidepdf.com/reader/full/sociometry-analysis-of-networks-path-analysis-research-methods-psychology 16/16
• Formerly called p coefficients, now path coefficients are called simply betaweights, based on usage in multiple regression models.
– So, … Does path analysis confirm causation in a model? • No, although this is sometimes said.
– Everitt and Dunn (1991) note, "However convincing, respectable and reasonable apath diagram... may appear, any causal inferences extracted are rarely more than aform of statistical fantasy".
– The authors are referring to the fact that ultimately path analysis deals withcorrelation, not causation of variables.
– The arrows in path models do indeed reflect hypotheses about causation. – However, many models may be consistent with a given dataset.
– Path analysis merely illuminates which of two or more competing models, derivedfrom theory, is most consistent with the pattern of correlations found in the data.
– The competing theories may be represented in separate path models with separatepath analyses, or may be combined in a single path diagram, in which case theresearcher is concerned with comparing the relative importance of different pathswithin the diagram.