Embed Size (px)
Citation preview

http://soe.sagepub.com/Sociology of Education
http://soe.sagepub.com/content/82/2/101The online version of this article can be found at:
DOI: 10.1177/003804070908200201
2009 82: 101Sociology of EducationSara Goldrick-Rab and Fabian T. Pfeffer
Beyond Access: Explaining Socioeconomic Differences in College Transfer
Published by:
http://www.sagepublications.com
On behalf of:
American Sociological Association
can be found at:Sociology of EducationAdditional services and information for
http://soe.sagepub.com/cgi/alertsEmail Alerts:
http://soe.sagepub.com/subscriptionsSubscriptions:
http://www.sagepub.com/journalsReprints.navReprints:
http://www.sagepub.com/journalsPermissions.navPermissions:
http://soe.sagepub.com/content/82/2/101.refs.htmlCitations:
at UNIV NORTH TEXAS LIBRARY on January 19, 2011soe.sagepub.comDownloaded from
Beyond Access: Explaining Socioeconomic Differences in
College Transfer
Sara Goldrick-Rab
Fabian T. PfefferUniversity of Wisconsin–Madison
Reducing socioeconomic differences in college transfer requires understanding how and why
parental education, occupational class, and family income are associated with changing col-
leges. Building on prior studies of traditional community college transfer, the authors explore
relationships between those factors and two types of transfer among four-year college stu-
dents. The results indicate that reverse transfer—the move from a four-year to a community
college—is more common among students from less-educated families partly because of lower
levels of academic performance during their freshman year. In contrast, students from advan-
taged backgrounds in terms of class and income are more likely than are others to engage in
a lateral transfer—from a four-year to a four-year college—which may reflect individual pref-
erences for changing colleges, rather than a reaction to poor academic performance.
Implications for policy and practice are discussed in light of the fact that only reverse transfer
is associated with lower rates of completion of bachelor’s degrees.
Sociology of Education 2009, Vol. 82 (April): 101–125 101
Students are usually said to make threecollege decisions: whether to go, whereto attend, and whether to finish a degree
(Manski and Wise 1983). Inequalities persistin each choice, such that children fromsocioeconomically disadvantaged families areless likely to enter college, attend elite institu-tions, and earn bachelor’s degrees (e.g.,Cabrera, Burkum, and La Nasa 2005; Hearn1991; Karen 2002; Paulsen and St. John2002). But after they access college andbefore they complete degrees, students con-front numerous additional choices that affecttheir chances of finishing school, includinghow many classes to take, whether to work,and—the focus of this article—whether totransfer colleges. Although popular concep-tion holds that the college experience takesplace at one school, nearly half of all contem-porary undergraduates attend more than one
college (McCormick 2003). Moreover, whileresearch on college transfer has traditionallyfocused on students who begin at communi-ty colleges and move to baccalaureate-grant-ing institutions, changing colleges is alsocommon among students who start at four-year schools (Goldrick-Rab 2006).
Past research has consistently identifiedlarge differences in rates of traditional com-munity college transfer between advantagedand disadvantaged students (e.g., Dougherty1987; Dougherty and Kienzl 2006; Lee andFrank 1990; Velez and Javalgi 1987). Indeed,the low rates of movement to four-year col-leges by low-income and minority communi-ty college students have caused many ana-lysts to question the value of a differentiatedhigher education system that may divert stu-dents from more opportunities than it pro-vides them (e.g., Brint and Karabel 1989;
at UNIV NORTH TEXAS LIBRARY on January 19, 2011soe.sagepub.comDownloaded from
102 Goldrick-Rab and Pfeffer
Dougherty 1994). Yet social inequalities intransfer among four-year college studentshave been identified and examined in onlyone known study, which found that evenwithin that relatively advantaged group ofstudents, those from families of lower socioe-conomic status (SES) transfer schools less suc-cessfully (Goldrick-Rab 2006). Although thatfinding confirmed other work on transfer andmay therefore be considered unsurprising, itsuggests socioeconomic variations in the rea-sons why students change colleges. Since thetransfers are not motivated by the need toattend a school that grants bachelor’sdegrees, the question is this: Do four-year col-lege students of lower SES move to other col-leges because they lack information, financialresources, or academic preparation? On theother hand, is college transfer among moreadvantaged students based more on person-al preference or educational expectationsthan on financial or academic necessity? Anyeffort to reduce social inequality in collegetransfer will rely on answers to these ques-tions. In particular, both policy interventionsand sociological theories of stratification inhigher education require a better under-standing of precisely which aspects of familybackground are linked to which kinds ofmobility and why. Generating knowledge tofacilitate that understanding is the task of thisarticle.
REVIEW OF THE LITERATURE
We begin by describing variation in how stu-dents attend college in the United States andwhat is known about the relationshipbetween family background and the collegeexperience.
Contemporary College Trajectories
The manner in which today’s studentsencounter college is complex. Nationally, 27percent of students take some time off afterthey enter school, 39 percent attend parttime, and 31 percent change their major atleast once (Ingels et al. 2002). Delayingenrollment and enrolling part time in collegeare behaviors that are more common among
less-well-off students (Adelman 1999; Bozickand DeLuca 2005). In addition, students aremoving in, out, and among colleges and uni-versities at higher rates than ever before.Between the 1970s and 1990s, the number ofschools that the average undergraduateattended increased from one to three, andthe proportion of students attending morethan one college rose from 51 percent to 57percent (Adelman 1999; Adelman, Daniel,and Berkovits 2003).1
The two primary forms of mobility amongstudents at four-year colleges are lateral trans-fer and reverse transfer. Lateral transfer ismovement to another institution of the sametype (in this study, to another four-year insti-tution), and reverse transfer is movement to acommunity college. The data used for thisstudy indicate that 19.5 percent of studentswho start at a four-year college engage in atleast one lateral transfer during their collegecareers and as many as 15.5 percent make areverse transfer (see Table 1). Nevertheless,studies of transfer have overwhelminglyfocused on entering community college stu-dents (e.g., Dougherty, 1987; Lee and Frank1990; Velez and Javalgi 1987). The literatureon reverse transfer is sparse, and the data inthose studies tend to come from a single orsmall set of institutions (e.g., Bach et al. 2000;Winter and Harris 1999), which makes it near-ly impossible to draw conclusions abouteither the background characteristics of suchstudents or their motivations for changingcolleges (Townsend and Dever 1999).
Students’ Mobility and Completionof Degrees
What, if any, consequences does changingcolleges hold for completing a degree?Following the dominant theoretical models ofstudents’ persistence in college that empha-size attendance at a single institution, mostempirical research on the completion ofdegrees has neglected to account for stu-dents’ mobility. The handful of studies that, ata minimum, controlled for the number of col-leges attended or, at best, took the directionof mobility into account (e.g., Adelman 1999,2006; McCormick and Carroll 1997) pro-
at UNIV NORTH TEXAS LIBRARY on January 19, 2011soe.sagepub.comDownloaded from
Beyond Access 103
duced mixed findings. Some found no effectof mobility, while others found relatively smallnegative effects. The variation in findings canbe attributed to the quality of the measure ofmobility (whether it was based on transcriptdata or students’ self-reports and whether thedirection of mobility was accounted for) andrestrictions placed on the sample (for exam-ple, whether all students or only those atfour-year schools were included). Further-more, the ability to draw conclusions aboutcausal effects from prior research is limited byan overall lack of consideration of selectioneffects; in other words, students who changecolleges may have important but unmea-sured characteristics that also affect theirchances of completing degrees.
In an analysis described elsewhere, weused econometric methods to estimate thecausal effects of students’ mobility by com-paring the completion of degrees by reverse-transfer and lateral-transfer students whostarted at four-year colleges as well as stu-dents who began at two-year colleges(Goldrick-Rab and Pfeffer 2007). We foundthat lateral transfer does not appear to reducestudents’ chances of completing degrees andthat while reverse transfer to a communitycollege is disadvantageous relative to stayingenrolled at a four-year college or laterallytransferring to another four-year college, itresults in higher rates of completion ofdegrees than does the alternative of startinginitially at a community college. On the basisof those findings, we believe that inequalitiesin the rates of reverse transfer (rather than inthe rates of lateral transfer) are likely to beconsequential for stratification in college out-comes.
Social Background and theDecision to Change Colleges
Effects of social background operate to makechildren from the same type of familiesappear more alike than children from differ-ent families (Jencks 1972). Persistent relation-ships between social background and highereducation outcomes, particularly access andcompletion, have been extensively docu-mented (e.g., Ellwood and Kane 2000;Haveman and Wilson 2007; Hearn 1984,
1991; Karen 2002). Students engage in thetertiary sector at different rates, enroll in dis-parate parts of the system, and reach sub-stantially stratified outcomes, depending, inpart, on their family of origin. In one nation-ally representative study, 56 percent of eighthgraders whose parents did not attend collegewent on to pursue a postsecondary educa-tion, compared to 95 percent of those whohad at least one college-educated parent(Ingels et al. 2002). More recent estimateshave identified a 50 percentage-point gap incollege going for students from the bottomand top quarters of the income distribution, agap that is only slightly smaller (about 40points) when conditioned on high schoolgraduation (Haveman and Wilson 2007).2When they do attend college, poor studentsare less likely to apply to and be accepted atfour-year institutions and elite private collegesand universities (Alon 2001; Hearn 1991;McDonough 1997; McPherson and Shapiro1991). Partly as a result, there is substantialvariation in college completion: Conditionalon going to college, 25.9 percent of studentsin the bottom 25 percent of the income dis-tribution earn a degree, compared to 59.1percent of those in the top 25 percent(Haveman and Wilson 2007). Completionrates differ even among relatively advantagedstudents who begin at four-year institutions;one national survey found a 28 percentage-point difference in earned bachelor’s degreesbetween students from the bottom and topquintiles of the income distribution and a 41percentage-point gap between students withand without parents with bachelor’s degrees(authors’ calculations based on the NationalEducational Longitudinal Study, NELS).
Sociological theory indicates that parentaleducation, parental occupation, and familyincome may exert independent and differentimpacts on how students attend college.Parental education has been consistentlyidentified as an important indicator of collegeattainment. Students with college-educatedparents are more likely to attend and com-plete school, and that advantage persistseven among children from lower-incomefamilies (Ishitani 2006; Pascarella andTerenzini 2005). The relationship betweenparental education and postsecondary
at UNIV NORTH TEXAS LIBRARY on January 19, 2011soe.sagepub.comDownloaded from
104 Goldrick-Rab and Pfeffer
schooling is usually attributed to the greaterlevels of specific and accurate informationthat college-educated parents provide theirchildren, information that can be essential tostudents’ ability to plan, prepare for, and suc-cessfully navigate their college careers.
Social-class categories signal “a complex oflife conditions that are bound together in apackage” and that may extend beyond eco-nomic or educational forces alone (Gruskyand Weeden 2006:90). A classical, thoughnot uncontroversial, approach to denotingclass status is the use of occupational posi-tions (see Wright 2005 for an overview of themost important contributions). The occupa-tion of one’s parents can be interpreted todenote the social role that the parents playoutside the home and to connote informationabout the parents’ technical and social skillsas well as current and future economicprospects (Hauser and Warren 1997; Wright2005). Thus, distinguishing among studentson the basis of their parents’ occupationsallows for an analysis of children who wereraised in advantaged and disadvantaged set-tings and their corresponding life chances.
The persistent and intensifying relationshipbetween family income and college attain-ment has been well documented (Belley andLochner 2007; Ellwood and Kane 2000;Guldi, Page, and Stevens 2007; Haveman andWilson 2007; Lochner and Monge-Naranjo2008). One theory is that low-income stu-dents attend and complete college at lowerrates—despite the large, long-term, andincreasing financial payoff—because they areunable to borrow the funds that are necessaryto cover their costs. Researchers have largelyrejected this theory, however (Dynarski andScott-Clayton 2006). There is clear evidenceof a strong and growing relationship betweenfamily income and graduation, even in theabsence of any direct costs for college atten-dance. Family income is also closely related toother factors of students’ upbringing thathave an impact on the likelihood of collegegraduation. For example, low-income stu-dents attend elementary and secondaryschools where they are taught by teacherswho are less experienced and less effective(Clotfelter, Ladd, and Vigdor 2005). They arealso more likely to be raised by parents who
lack a college education and are less able toprovide academic and other forms of supportfor their children while they are in high schoolor afterward. Some low-income families areled by single parents who, even if they couldhelp, have less time to spend with their chil-dren as they juggle the demands of work andfamily life (Lareau and Weininger 2008). But,fundamentally, the issue is not whether thereis a relationship between income and collegegraduation—there clearly is—but how publicpolicy can best address the problem. In ourstudy, we were unable to examine the rela-tionship between financial aid and collegetransfer because of the lack of measures of aidin the data set we used.3 However, we wereable to draw on a range of precollege mea-sures that may serve as valid proxies to assessthis point empirically (see the next section).
We argue that each of the discussedaspects of social background—parental edu-cation, social class, and family income—potentially affects the way in which studentsattend college. On the basis of the reviewpresented earlier, we expect independenteffects of each social background characteris-tic, but past research has not assessedwhether and why these effects occur for dif-ferent kinds of mobility. By addressing theseconcerns, we significantly expand on twoprior studies that have yielded some first evi-dence for a complex picture of social inequal-ity in students’ college careers. The first study,which used nationally representative data,found that while the overall incidence of col-lege transfer among four-year college stu-dents does not vary by a student’s SES, thereare differences in the manner in which stu-dents change colleges (Goldrick-Rab 2006).Specifically, students from the bottom socioe-conomic quintile have a higher probability ofchanging colleges while experiencing aninterruption in enrollment, whereas moreadvantaged students have a greater tendencyto move among schools fluidly without takingtime off. However, that study used a compos-ite measure of SES, which encompassed edu-cation, occupation, and family income, anddid not identify precisely which aspects ofsocial background were important to thedecision to transfer schools.4
The other study combined quantitative at UNIV NORTH TEXAS LIBRARY on January 19, 2011soe.sagepub.comDownloaded from
Beyond Access 105
and qualitative analyses of the postsecondarypathways of students in Chicago publicschools to examine the distinguishing charac-teristics of students who changed colleges incomparison to those who did not (Deil-Amenand Goldrick-Rab 2009). The researchersfound that poor urban students who changecolleges are less likely to have a strong com-mitment to their educational goals and, whatis important, lack an advocate who is invest-ed in their plans to complete a bachelor’sdegree and who can help with postsecondary“strategizing.” However, as we noted, thatstudy emphasized differences among poorstudents and was unable to make compar-isons across socioeconomic groups, since thevariation in socioeconomic standing of thesample was low.
In addition to documenting the relation-ship between different components of SESwith different types of student mobility, ourstudy also explored a set of factors that arehypothesized to explain these associations. Inthe literature, explanations for the lower lev-els of college achievement among disadvan-taged students include financial constraints(Bettinger 2004; DesJardins, Ahlburg, andMcCall 2006; Paulsen and St. John 2002),poor college preparation and academic track-ing from kindergarten to the 12th grade(Adelman 1999, 2006; Bowen, Kurzweil, andTobin 2005; Cabrera et al. 2005; Venezia andKirst 2005), inaccurate perceptions of eco-nomic returns and other informationaldeficits (Avery and Kane 2004; Beattie 2002;Grodsky and Jones 2007; McDonough andCalderone 2006; Rouse 2004), lower educa-tional aspirations (Alexander, Bozick, andEntwisle 2008; Reynolds et al., 2006), familialand peer contexts (Kim and Schneider 2005;Steelman and Powell 1989; Turley 2006),unsupportive college practices (Rosenbaum,Deil-Amen, and Person 2006; Tinto 1993),and inadequate governmental policies(Dynarski 2002; Kane 1994). There is littleconsensus about the relative importance ofeach of these mechanisms. Therefore, likemany other analysts, we rely on more thanone mechanism to explain the relationshipbetween social background and transfer.
More specifically, we examine high schoolachievement, to test whether social differ-
ences in transfer behavior arise from earlierdemonstrated ability and academic prepared-ness. On other hand, educational experiencesafter high school—early college achievementand initial college attributes—can also beexpected to play an independent role inexplaining social inequalities in students’careers. One mechanism that is more closelytied to a specific component of social back-ground is educational expectations, whichhave not only been shown to take a centralrole in mediating the general process of inter-generational transmission of advantage(Sewell, Haller, and Portes 1969), but havebeen argued to be a central factor in explain-ing educational differences pertaining tosocial class (Breen and Goldthorpe 1997).Parental education can be hypothesized totake its effects partly via the level of strategicplanning that the student may be able to real-ize on the basis of parental advice and expe-rience within the educational system. Finally,we included proxy measures for financial con-straints, which may explain possible effects offamily income. Note that although wedescribe each of these factors (strategic plan-ning, educational expectations, and financialconstraints) as potentially linked to a singleaspect of social background, in our modelswe test for the ability of each to explain anyaspect of the effects of social background. Inwhat follows, we give a detailed picture ofsocial inequalities in students’ transfer behav-ior and then go on to test the explanatorypower of these mechanisms.
DATA AND METHODS
The data for this study came from the lastthree waves of the National EducationLongitudinal Study (NELS), conducted by theU.S. Department of Education. The surveyused a national probability sample of 25,000eighth graders who were first surveyed in1988 and reinterviewed during four addition-al follow-ups. The fifth and final waveoccurred in 2000, when the students wereaged 26 or 27; at that time, 12,144 individu-als were interviewed, and requests for thepostsecondary transcripts of the 9,602 stu-dents who had attended college by 2000
at UNIV NORTH TEXAS LIBRARY on January 19, 2011soe.sagepub.comDownloaded from

106 Goldrick-Rab and Pfeffer
were submitted to the relevant institutions. Atotal of 15,562 transcripts were received for8,889 students. Thus, these students were fol-lowed for eight years after high school grad-uation, which provides a substantial windowwithin which to observe their postsecondarypathways and completion rates, even forthose who transferred colleges. Still, toreduce problems posed by right truncation ofthe data, our sample included only studentswho began their studies before 1995.
The sample used in this study was drawnfrom the 2000 wave of NELS and includedonly students who participated in the second(1992), third (1994), and fourth (2000) fol-low-ups; attended at least one postsecondaryinstitution; and had a complete transcriptrecord. Furthermore, only students whobegan college at a four-year institution wereincluded, yielding a final sample of 4,716 stu-dents. There were several substantive reasonsfor focusing on students who started at four-year colleges. First, starting college at a four-year institution is the result of a series of selec-tive processes (including applying to a four-year school, gaining admission, andenrolling) and thus represents advantage,achievement, and aspirations. Conditioningthe sample in this way therefore diminishedthe amount of unobserved heterogeneitywithin the group we examined. However, wealso know that substantial socioeconomicgaps in completion exist in the four-year pop-ulation (Goldrick-Rab 2006). We were con-cerned with drawing finer distinctions amongthe postsecondary trajectories of studentswho begin at four-year schools to gain a bet-ter understanding of their stratified out-comes.
The assessment of student transfer relieson NELS data from postsecondary transcriptsbecause these data provide more reliablemeasures of transfer than does the self-report-ed information found in the NELS basicrestricted-use file.5 In a comparison of tran-script and self-reported data from the NELS,Adelman (2004) found that students tend tounderreport the number of postsecondaryinstitutions they attend; for example, in theNELS survey, nearly 10 percent of postsec-ondary attendees failed to report at least oneinstitution. In gathering transcript data for
the NELS, survey officials first requested tran-scripts for all the institutions a student report-ed attending. They then requested transcriptsfor schools that appeared on a student’s tran-scripts but were not reported by the student(i.e., attendance at an additional school wasevidenced by transfer credits). In this way, theofficials ensured a more complete postsec-ondary history of students than if they hadrelied on students’ reports.
Measures
The appendix presents the description andcoding of all variables (dependent and inde-pendent) that were used in the analyses. Twocentral types of student mobility are distin-guished: lateral transfers, denoting the movefrom a four-year college in one year of studyto another four-year college in the followingyear of study (July to June), and reverse trans-fers, denoting the move from a four-year col-lege in one year to a two-year college in thenext year. These clear-cut distinctionsbecome somewhat more complicated whenone considers cases of simultaneous enroll-ment.6 Here, we identify lateral transfer as themovement between “primary” institutions,the latter being identified as the four-year col-lege at which the student completed themajority of credits in the given academic year.To identify genuine reverse transfer correctlyin situations of simultaneous enrollment, weimposed the restriction that the student didnot maintain any enrollment in the four-yearcollege attended in the preceding academicyear. Our measures of both lateral transferand reverse transfer recorded whether suchtransfer behavior occurred at any point in thecollege career.
The independent variables that were ofcentral interest to our analysis were threesocial background characteristics. Parentaleducation was measured as the highestdegree attained by either parent in four cate-gories ranging from high school or less tohigher than a BA degree. Our measure ofsocial class was based on students’ reports oftheir fathers’ occupation and was captured ina simplified version of the widely used EGPclass scheme (see, e.g., Breen, 2005; Erikson,Goldthorpe, and Portocarero 1979), distin-
at UNIV NORTH TEXAS LIBRARY on January 19, 2011soe.sagepub.comDownloaded from

Beyond Access 107
guishing among the working class, the self-employed, and the service class. Familyincome was reported by parents in 1988 and1992. To capture the economic well-being ofthe family more accurately and reduce mea-surement error, both reports were averaged.Additional demographic characteristics of thestudent included gender and race, whetherthe family of origin was headed by a singlemother, and the number of siblings.
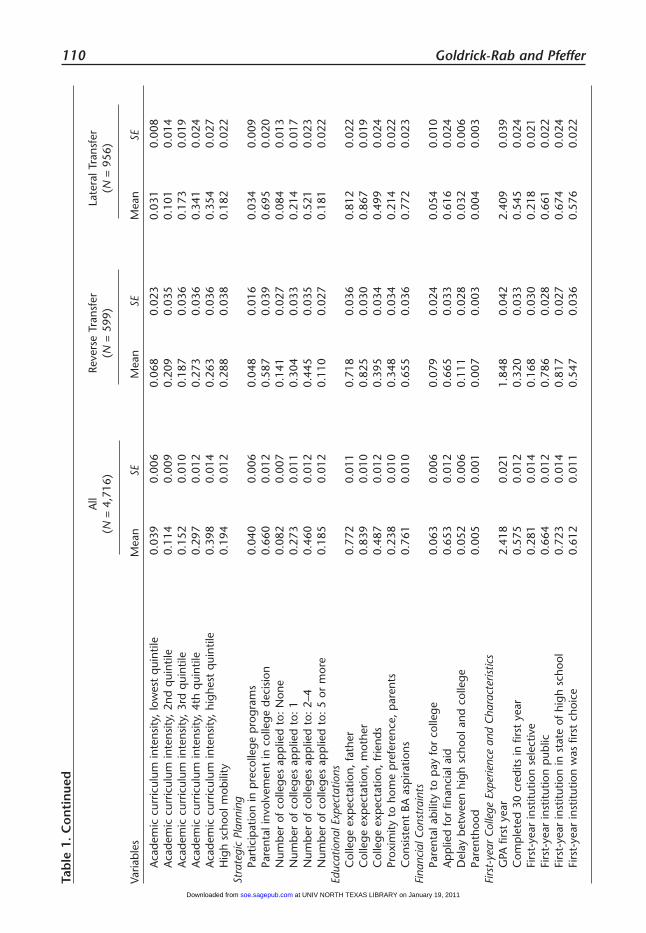
To disentangle the effects of the listedascriptive variables from differential studentachievement, the following high school mea-sures were included: tested ability (using astandardized test administered to NELSseniors), grade point average (GPA), curricu-lar intensity of the courses taken, andwhether the student ever changed highschools. Tested ability was included as a mea-sure of aptitude. GPA assessed both a stu-dent’s achievement and commitment toschool. The curricular intensity measure,which captured the degree of difficulty of thecourses a student took, was included as ameasure of college preparedness. Whether astudent changed high schools indicates boththe degree of the student’s engagement andthe negative achievement results associatedwith a change in schools (see Rumberger andLarson 1998).
Educational expectations of significant oth-ers were measured as the expectation notonly of the father and mother for the studentto attend college, but of the students’ friends’expectations. In addition, the preference forhaving the child stay home to attend collegewas included as a measure of the parents’willingness to sacrifice college expectationsfor family norms (Turley 2006). Finally,whether these expectations by significantothers translate into the student’s own edu-cational aspirations was indicated by whetherthe student consistently planned to attain abachelor’s degree in both 1990 and 1992. Asmeasures of strategic planning, we includedinformation about whether the student par-ticipated in any precollege programs,whether the student’s parents were involvedin the student’s college decision, and thenumber of colleges to which a studentapplied as a high school senior. Financial con-straints were captured by the parents’ per-
ception of whether they had enough moneyfor their eighth grader to attend college andthe parents’ report of whether their child hadapplied for financial aid in the senior year ofhigh school. Manifested financial constraintson the student side were meant to be cap-tured by an indicator of whether the studentdelayed college entrance for more than sevenmonths after high school graduation andwhether the student had a child before 1992.
A series of measures regarding early collegeexperience were also taken into account. Thestudent’s GPA in the first year of college wasincluded as a measure of performance onceenrolled. Whether a student completed atleast 30 credits in the first year of college rep-resented the first step to the timely comple-tion of a degree. Both the control and selec-tivity of the first four-year institution attendedwere measured, since students at private andhighly selective institutions have higher ratesof retention and completion of degrees(Zhang 2005). As additional characteristics ofthe first college attended, we includedwhether it was located in the same state asthe student’s high school and whether it wasthe college of his or her first choice.
We recognize the potential for endogene-ity to bias the estimates for these coefficients.For example, it is possible that a studententers college already having decided eventu-ally to transfer and therefore chooses to startcollege at a less selective school or not towork as hard in the first school. For these rea-sons, we caution readers against interpretingthe results as causal. Our purpose in includingthese variables in the models is to acknowl-edge their potential importance in mediatingthe relationship between aspects of socialclass and the decision to transfer, not toassess their individual importance in the deci-sion to transfer.
Analytic Strategy
After a detailed descriptive analysis of socio-economic differentials in transfer, we estimateda series of logistic regressions predictingwhether a student ever made a transfer of acertain type, namely, a lateral transfer and areverse transfer. Sets of covariates were enteredone at a time in groups, so as to test our
at UNIV NORTH TEXAS LIBRARY on January 19, 2011soe.sagepub.comDownloaded from
108 Goldrick-Rab and Pfeffer
hypotheses about the role of high schoolachievement, educational expectations, strate-gic planning, financial constraints, and first-year college experiences and characteristics incontributing to socioeconomic differences instudents’ mobility. We present the results ofthese analyses in terms of the increased likeli-hood of engaging in a form of mobility (givena specific student characteristic and net of oth-ers) by presenting odds ratios.
All analyses were weighted to adjust foroversampling, nonresponse, and survey attri-tion and adjusted to account for the complexsurvey design of the data set, namely, stratifi-cation and clustering.7 The Stata survey com-mands (svy) were used for this purpose.Missing values in the data were multiplyimputed using a chained equation algorithmimplemented in the Stata ice program(Royston 2004). All analyses were computedon five complete data sets, and estimatedcoefficients and standard errors were aver-aged following Rubin’s rule.
RESULTS
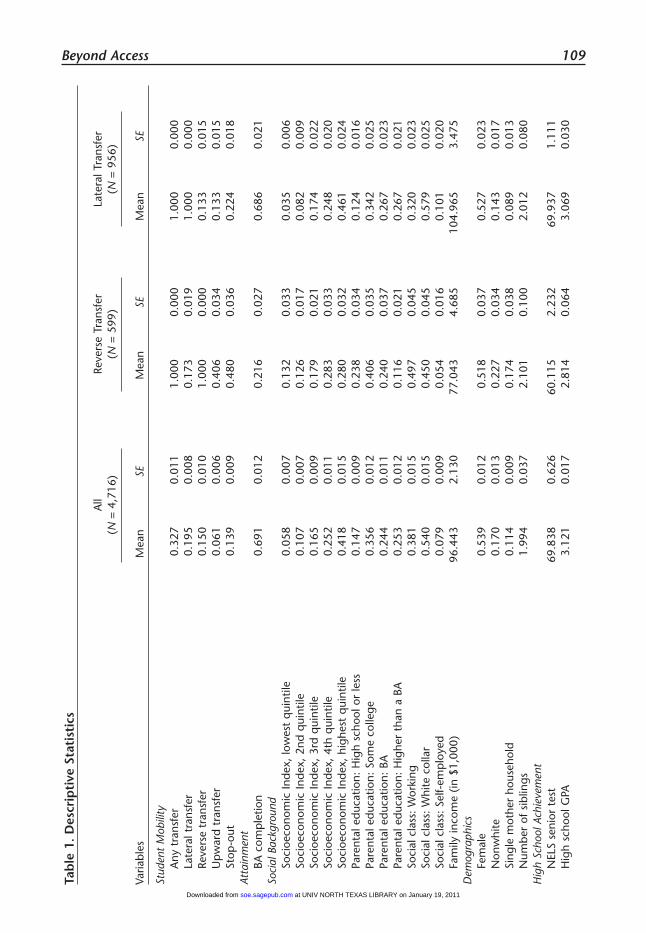
In this sample of traditional-aged studentswho began their postsecondary education byentering a four-year college or university, 33percent transferred at least once within eightyears of high school graduation. Nearly onein five (19.5 percent) transferred laterally, and15 percent transferred in reverse, at leastonce. Among the latter group, 41 percentlater returned to a four-year institution (seeTable 1).
Rates of bachelor’s degree completionwere highest among students who neverchanged colleges (79 percent). Among stu-dents who transferred, lateral transfers weremuch more likely than were reverse transfersto complete a bachelor’s degree (69 percentversus 22 percent). This finding is not surpris-ing, since most two-year colleges do not offerbachelor’s degrees, so the attainment of abachelor’s degree for a reverse transfer stu-dent is conditional on an upward transfer to afour-year college. The bachelor’s degree com-pletion rate among students who reversetransferred and subsequently moved to afour-year school was 49 percent.
The window of observation in this studywas consequential, since changing colleges insome cases was associated with taking timeoff from college (Goldrick-Rab 2006). In par-ticular, we found that while overall only 14percent of students took time off from school,the rate of stop-out was nearly 3.5 timesgreater among reverse transfer students (48percent) and, to a lesser extent, higheramong lateral transfer students (22 percent).This finding suggests that reverse transfer stu-dents have an especially hard time maintain-ing continuity in their enrollment, although itis also possible that the opposite is true—thatstudents who take time off from a four-yearcollege may be more likely then to leave thatschool to attend a community college. Ineither case, the low rates of bachelor’s degreecompletion associated with a reverse transferindicate that reverse transfer is the form ofstudent mobility most deserving of attention.
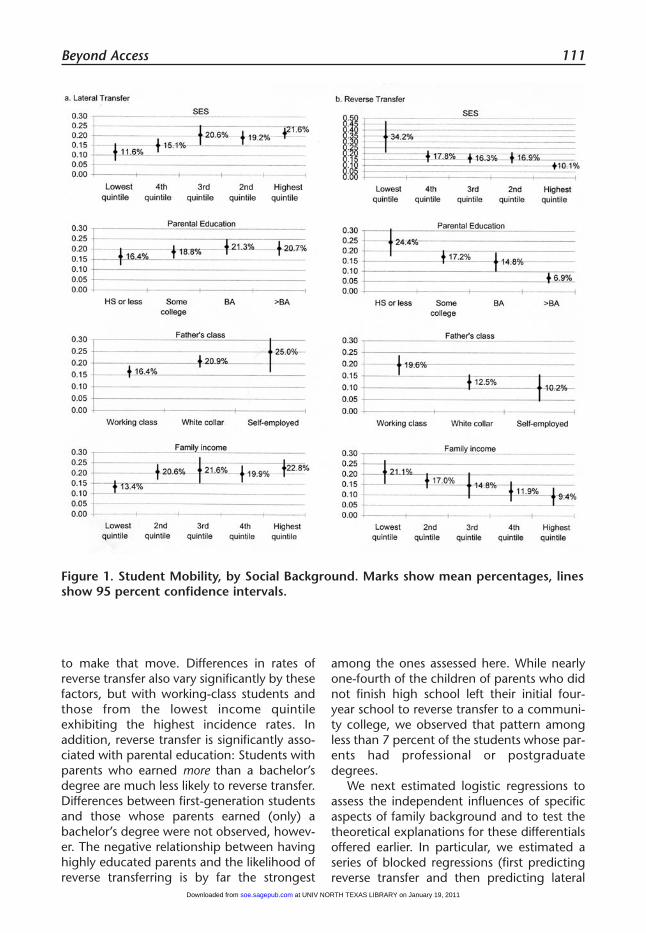
The institutional destinations of studentswho changed colleges varied according tothe individuals’ socioeconomic backgrounds.Beginning by using the composite measure ofSES, we found that the choice of a four-yearschool as a destination was somewhat lesscommon among students from the bottomtwo quintiles, while students in the bottomquintile were much more likely than weretheir more advantaged counterparts to moveto a two-year school (see Figure 1).Specifically, a student from the bottom SESquintile was about half as likely as a studentfrom the top quintile to transfer laterally butthree times more likely to reverse transfer. Theconfidence intervals around the mean esti-mates reveal that these SES differences aresignificant.
Having detected these broad SES differ-ences in the destinations of four-year transferstudents, we next assessed the role of eachcomponent of social background to illumi-nate further the shape of social inequality instudent mobility. Figure 1 also illustratestransfer rates by parental education, father’soccupational class, and family income. Thesedescriptive statistics indicate that SES differ-ences in lateral transfer are based on occupa-tional class as well as family income, withworking-class students and students from thelowest income quintile significantly less likely
at UNIV NORTH TEXAS LIBRARY on January 19, 2011soe.sagepub.comDownloaded from
Beyond Access 109Ta
ble
1.D
escr
ipti
veSt
atis
tics
All
Reve
rse
Tran
sfer
Late
ralT
rans
fer
(N=
4,71
6)(N
=59
9)(N
=95
6)
Varia
bles
Mea
nSE
Mea
nSE
Mea
nSE
Stud
ent
Mob
ility
Any
tran
sfer
0.32
70.
011
1.00
00.
000
1.00
00.
000
Late
ralt
rans
fer
0.19
50.
008
0.17
30.
019
1.00
00.
000
Reve
rse
tran
sfer
0.15
00.
010
1.00
00.
000
0.13
30.
015
Up
war
dtr
ansf
er0.
061
0.00
60.
406
0.03
40.
133
0.01
5St
op-o
ut0.
139
0.00
90.
480
0.03
60.
224
0.01
8At
tain
men
tBA
com
ple
tion
0.69
10.
012
0.21
60.
027
0.68
60.
021
Soci
alBa
ckgr
ound
Soci
oeco
nom
icIn
dex,
low
est
qui
ntile
0.05
80.
007
0.13
20.
033
0.03
50.
006
Soci
oeco
nom
icIn
dex,
2nd
qui
ntile
0.10
70.
007
0.12
60.
017
0.08
20.
009
Soci
oeco
nom
icIn
dex,
3rd
qui
ntile
0.16
50.
009
0.17
90.
021
0.17
40.
022
Soci
oeco
nom
icIn
dex,
4th
qui
ntile
0.25
20.
011
0.28
30.
033
0.24
80.
020
Soci
oeco
nom
icIn
dex,
high
est
qui
ntile
0.41
80.
015
0.28
00.
032
0.46
10.
024
Pare
ntal
educ
atio
n:H
igh
scho
olor
less
0.14
70.
009
0.23
80.
034
0.12
40.
016
Pare
ntal
educ
atio
n:So
me
colle
ge0.
356
0.01
20.
406
0.03
50.
342
0.02
5Pa
rent
aled
ucat
ion:
BA0.
244
0.01
10.
240
0.03
70.
267
0.02
3Pa
rent
aled
ucat
ion:
Hig
her
than
aBA
0.25
30.
012
0.11
60.
021
0.26
70.
021
Soci
alcl
ass:
Wor
king
0.38
10.
015
0.49
70.
045
0.32
00.
023
Soci
alcl
ass:
Whi
teco
llar
0.54
00.
015
0.45
00.
045
0.57
90.
025
Soci
alcl
ass:
Self-
emp
loye
d0.
079
0.00
90.
054
0.01
60.
101
0.02
0Fa
mily
inco
me
(in$1
,000
)96
.443
2.13
077
.043
4.68
510
4.96
53.
475
Dem
ogra
phic
sFe
mal
e0.
539
0.01
20.
518
0.03
70.
527
0.02
3N
onw
hite
0.17
00.
013
0.22
70.
034
0.14
30.
017
Sing
lem
othe
rho
useh
old
0.11
40.
009
0.17
40.
038
0.08
90.
013
Num
ber
ofsi
blin
gs1.
994
0.03
72.
101
0.10
02.
012
0.08
0H
igh
Scho
olAc
hiev
emen
tN
ELS
seni
orte
st69
.838
0.62
660
.115
2.23
269
.937
1.11
1H
igh
scho
olG
PA3.
121
0.01
72.
814
0.06
43.
069
0.03
0
at UNIV NORTH TEXAS LIBRARY on January 19, 2011soe.sagepub.comDownloaded from
110 Goldrick-Rab and PfefferTa
ble
1.C
on
tin
ued
All
Reve
rse
Tran
sfer
Late
ralT
rans
fer
(N=
4,71
6)(N
=59
9)(N
=95
6)
Varia
bles
Mea
nSE
Mea
nSE
Mea
nSE
Aca
dem
iccu
rric
ulum
inte
nsity
,lo
wes
tq
uint
ile0.
039
0.00
60.
068
0.02
30.
031
0.00
8A
cade
mic
curr
icul
umin
tens
ity,
2nd
qui
ntile
0.11
40.
009
0.20
90.
035
0.10
10.
014
Aca
dem
iccu
rric
ulum
inte
nsity
,3r
dq
uint
ile0.
152
0.01
00.
187
0.03
60.
173
0.01
9A
cade
mic
curr
icul
umin
tens
ity,
4th
qui
ntile
0.29
70.
012
0.27
30.
036
0.34
10.
024
Aca
dem
iccu
rric
ulum
inte
nsity
,hi
ghes
tq
uint
ile0.
398
0.01
40.
263
0.03
60.
354
0.02
7H
igh
scho
olm
obili
ty0.
194
0.01
20.
288
0.03
80.
182
0.02
2St
rate
gic
Plan
ning
Part
icip
atio
nin
pre
colle
gep
rogr
ams
0.04
00.
006
0.04
80.
016
0.03
40.
009
Pare
ntal
invo
lvem
ent
inco
llege
deci
sion
0.66
00.
012
0.58
70.
039
0.69
50.
020
Num
ber
ofco
llege
sap
plie
dto
:N
one
0.08
20.
007
0.14
10.
027
0.08
40.
013
Num
ber
ofco
llege
sap
plie
dto
:1
0.27
30.
011
0.30
40.
033
0.21
40.
017
Num
ber
ofco
llege
sap
plie
dto
:2–
40.
460
0.01
20.
445
0.03
50.
521
0.02
3N
umbe
rof
colle
ges
app
lied
to:
5or
mor
e0.
185
0.01
20.
110
0.02
70.
181
0.02
2Ed
ucat
iona
lExp
ecta
tions
Col
lege
exp
ecta
tion,
fath
er0.
772
0.01
10.
718
0.03
60.
812
0.02
2C
olle
geex
pec
tatio
n,m
othe
r0.
839
0.01
00.
825
0.03
00.
867
0.01
9C
olle
geex
pec
tatio
n,fr
iend
s0.
487
0.01
20.
395
0.03
40.
499
0.02
4Pr
oxim
ityto
hom
ep
refe
renc
e,p
aren
ts0.
238
0.01
00.
348
0.03
40.
214
0.02
2C
onsi
sten
tBA
asp
iratio
ns0.
761
0.01
00.
655
0.03
60.
772
0.02
3Fi
nanc
ialC
onst
rain
tsPa
rent
alab
ility
top
ayfo
rco
llege
0.06
30.
006
0.07
90.
024
0.05
40.
010
Ap
plie
dfo
rfin
anci
alai
d0.
653
0.01
20.
665
0.03
30.
616
0.02
4D
elay
betw
een
high
scho
olan
dco
llege
0.05
20.
006
0.11
10.
028
0.03
20.
006
Pare
ntho
od0.
005
0.00
10.
007
0.00
30.
004
0.00
3Fi
rst-
year
Col
lege
Expe
rienc
ean
dC
hara
cter
istic
sG
PAfir
stye
ar2.
418
0.02
11.
848
0.04
22.
409
0.03
9C
omp
lete
d30
cred
itsin
first
year
0.57
50.
012
0.32
00.
033
0.54
50.
024
Firs
t-ye
arin
stitu
tion
sele
ctiv
e0.
281
0.01
40.
168
0.03
00.
218
0.02
1Fi
rst-
year
inst
itutio
np
ublic
0.66
40.
012
0.78
60.
028
0.66
10.
022
Firs
t-ye
arin
stitu
tion
inst
ate
ofhi
ghsc
hool
0.72
30.
014
0.81
70.
027
0.67
40.
024
Firs
t-ye
arin
stitu
tion
was
first
choi
ce0.
612
0.01
10.
547
0.03
60.
576
0.02
2
at UNIV NORTH TEXAS LIBRARY on January 19, 2011soe.sagepub.comDownloaded from
Beyond Access 111
to make that move. Differences in rates ofreverse transfer also vary significantly by thesefactors, but with working-class students andthose from the lowest income quintileexhibiting the highest incidence rates. Inaddition, reverse transfer is significantly asso-ciated with parental education: Students withparents who earned more than a bachelor’sdegree are much less likely to reverse transfer.Differences between first-generation studentsand those whose parents earned (only) abachelor’s degree were not observed, howev-er. The negative relationship between havinghighly educated parents and the likelihood ofreverse transferring is by far the strongest
among the ones assessed here. While nearlyone-fourth of the children of parents who didnot finish high school left their initial four-year school to reverse transfer to a communi-ty college, we observed that pattern amongless than 7 percent of the students whose par-ents had professional or postgraduatedegrees.
We next estimated logistic regressions toassess the independent influences of specificaspects of family background and to test thetheoretical explanations for these differentialsoffered earlier. In particular, we estimated aseries of blocked regressions (first predictingreverse transfer and then predicting lateral
Figure 1. Student Mobility, by Social Background. Marks show mean percentages, linesshow 95 percent confidence intervals.
at UNIV NORTH TEXAS LIBRARY on January 19, 2011soe.sagepub.comDownloaded from

112 Goldrick-Rab and Pfeffer
transfer) that begin with the inclusion of onlyparental education, occupation, and income(Model I). In an effort to explain these socialbackground effects, the following modelsthen take into account demographic charac-teristics (Model II), high school achievement(Model III), educational expectations (ModelIV), strategic planning (Model V), financialconstraints (Model VI), and finally initial col-lege attributes as well as first-year academicperformance (Model VII). The purpose ofmodeling the regressions in this manner wasto examine the extent to which each set offactors mediates the observed socioeconomicdifferences in mobility outcomes; therefore,we placed less emphasis on the size of thecoefficient for each indicator than on thedegree of mediation of the included socialbackground effects.8
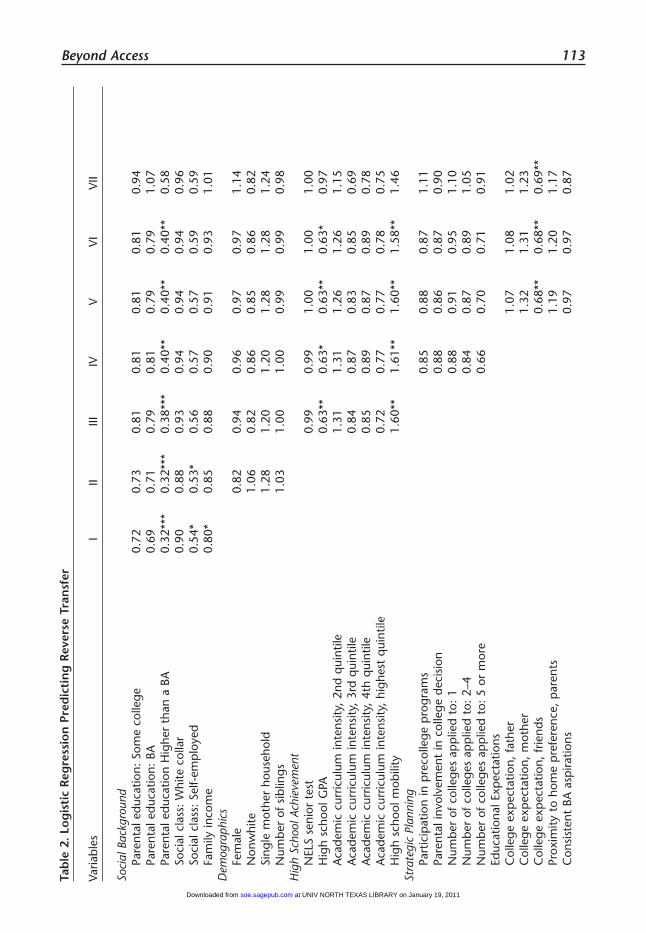
Table 2 presents the results for reversetransfer. The relationships that are indicatedin the descriptive statistics are largely borneout in the first model: Reverse transfer is sig-nificantly less common among students withhighly educated parents, wealthier parents,and students from non–working-class families(especially self-employed fathers).9 However,differences based on family income and occu-pational class position faded away when weconsidered demographic characteristics andstudents’ high school achievement (especiallyGPA), respectively (Models II and III). Whilehigh school achievement also explains someof the relationship between parental educa-tion and reverse transfer, this social differen-tial in reverse transfer persists.
Models IV–VI test the remaining mecha-nisms that we hypothesized underlie associa-tions between social background and stu-dent mobility (educational expectations,strategic planning, and financial constraints).Of these mechanisms, only one exertsnotable effects: Having more ambitious highschool friends with greater expectations forearning a college degree decreases the prob-ability of a reverse transfer. However, thisassociation fails to account for any of thelower reverse-transfer rates of children fromhighly educated households. As the nextmodel (VII), which also considers first-yearcollege performance, illustrates, both first-year college GPA and adequate progress in
the accumulation of credits show strong neg-ative associations with the probability ofreverse transfer. Of these two factors, it is col-lege GPA that mediates a large part of theeffect of parental education.10 That finalmodel, which also yields a significantimprovement in model fit, thus suggests thatthe students who are most likely to reversetransfer are the children of parents withlower levels of education and that theyreverse transfer primarily because of strug-gles during their initial transition to college(not because they were less prepared—acad-emically or financially—for college).
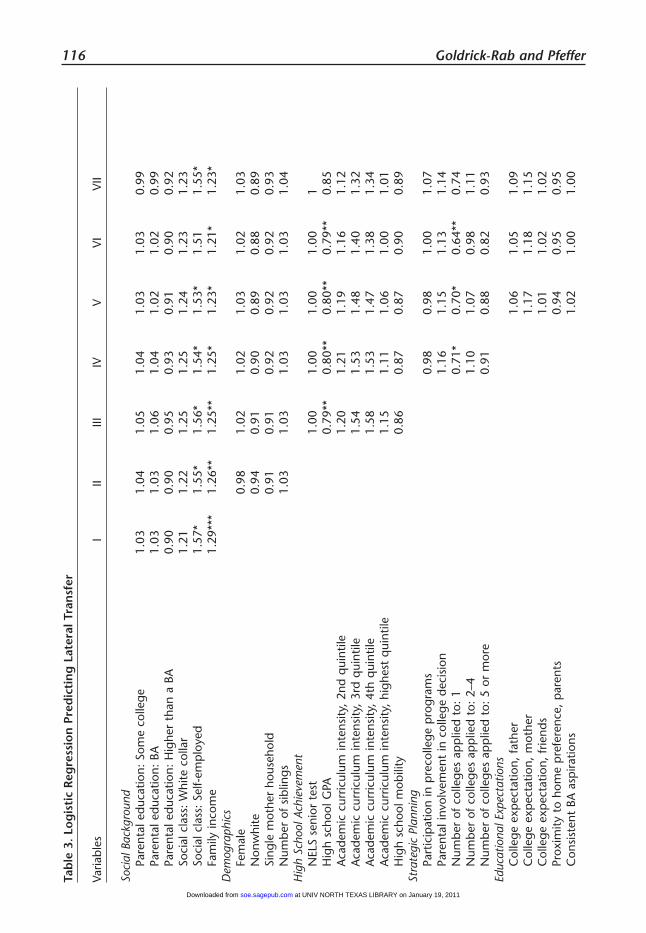
In Table 3 we present the multivariateresults for the analysis of lateral transfer. Incontrast to reverse transfer, rates of lateraltransfer do not significantly differ by parentaleducation but, rather, by parental occupa-tional class and family income (Model I),again confirming the descriptive results.These relationships are notably weaker thanthe relationship between reverse transfer andparental education, but they persist across allseven models and do not appear to be attrib-utable to advantages in academic or socialpreparation for college or college perfor-mance. Although some of the these factorsexert independent influences on the proba-bility of lateral transfer (for example, studentswho do not delay college entry, those whoattend more selective colleges, and thosewho go to out-of-state colleges are all morelikely to transfer laterally), the social differen-tials in lateral transfer remain largely unex-plained by the mechanisms we explored. Theinterpretation that lateral transfers are theresult of students’ preferences (which are atleast partly determined by occupationalclass) appears plausible, although the rea-sons for it remain hidden. Lateral transfersmay be related to behavioral differences; forinstance, the children of self-employed par-ents—parents who are potentially less riskaverse and more market oriented—may dis-play similar proclivities by shopping aroundthe marketplace of higher education foralternative four-year colleges (Goldrick-Rab2006). However, keep in mind that the real-ization of these preferences is still partlydetermined by family income and, moreover,that the overall model does a relatively poor
at UNIV NORTH TEXAS LIBRARY on January 19, 2011soe.sagepub.comDownloaded from
Beyond Access 113Ta
ble
2.Lo
gis
tic
Reg
ress
ion
Pred
icti
ng
Rev
erse
Tran
sfer
Varia
bles
III
IIIIV
VVI
VII
Soci
alBa
ckgr
ound
Pare
ntal
educ
atio
n:So
me
colle
ge0.
720.
730.
810.
810.
810.
810.
94Pa
rent
aled
ucat
ion:
BA0.
690.
710.
790.
810.
790.
791.
07Pa
rent
aled
ucat
ion
Hig
her
than
aBA
0.32
***
0.32
***
0.38
***
0.40
**0.
40**
0.40
**0.
58So
cial
clas
s:W
hite
colla
r0.
900.
880.
930.
940.
940.
940.
96So
cial
clas
s:Se
lf-em
plo
yed
0.54
*0.
53*
0.56
0.57
0.57
0.59
0.59
Fam
ilyin
com
e0.
80*
0.85
0.88
0.90
0.91
0.93
1.01
Dem
ogra
phic
sFe
mal
e0.
820.
940.
960.
970.
971.
14N
onw
hite
1.06
0.82
0.86
0.85
0.86
0.82
Sing
lem
othe
rho
useh
old
1.28
1.20
1.20
1.28
1.28
1.24
Num
ber
ofsi
blin
gs1.
031.
001.
000.
990.
990.
98H
igh
Scho
olAc
hiev
emen
tN
ELS
seni
orte
st0.
990.
991.
001.
001.
00H
igh
scho
olG
PA0.
63**
0.63
*0.
63**
0.63
*0.
97A
cade
mic
curr
icul
umin
tens
ity,
2nd
qui
ntile
1.31
1.31
1.26
1.26
1.15
Aca
dem
iccu
rric
ulum
inte
nsity
,3r
dq
uint
ile0.
840.
870.
830.
850.
69A
cade
mic
curr
icul
umin
tens
ity,
4th
qui
ntile
0.85
0.89
0.87
0.89
0.78
Aca
dem
iccu
rric
ulum
inte
nsity
,hi
ghes
tq
uint
ile0.
720.
770.
770.
780.
75H
igh
scho
olm
obili
ty1.
60**
1.61
**1.
60**
1.58
**1.
46St
rate
gic
Plan
ning
Part
icip
atio
nin
pre
colle
gep
rogr
ams
0.85
0.88
0.87
1.11
Pare
ntal
invo
lvem
ent
inco
llege
deci
sion
0.88
0.86
0.87
0.90
Num
ber
ofco
llege
sap
plie
dto
:1
0.88
0.91
0.95
1.10
Num
ber
ofco
llege
sap
plie
dto
:2–
40.
840.
870.
891.
05N
umbe
rof
colle
ges
app
lied
to:
5or
mor
e0.
660.
700.
710.
91Ed
ucat
iona
lExp
ecta
tions
Col
lege
exp
ecta
tion,
fath
er1.
071.
081.
02C
olle
geex
pec
tatio
n,m
othe
r1.
321.
311.
23C
olle
geex
pec
tatio
n,fr
iend
s0.
68**
0.68
**0.
69**
Prox
imity
toho
me
pre
fere
nce,
par
ents
1.19
1.20
1.17
Con
sist
ent
BAas
pira
tions
0.97
0.97
0.87
at UNIV NORTH TEXAS LIBRARY on January 19, 2011soe.sagepub.comDownloaded from

114 Goldrick-Rab and PfefferTa
ble
2.C
on
tin
ued
Varia
bles
III
IIIIV
VVI
VII
Fina
ncia
lCon
stra
ints
Pare
ntal
abili
tyto
pay
for
colle
ge0.
960.
93A
pp
lied
for
finan
cial
aid
1.07
1.17
Del
aybe
twee
nhi
ghan
dco
llege
1.24
1.48
Pare
ntho
od0.
850.
79Fi
rst-
year
Col
lege
Expe
rienc
ean
dC
hara
cter
istic
sG
PAfir
stye
ar0.
39**
*C
omp
lete
d30
cred
itsin
first
year
0.58
**Fi
rst-
year
inst
itutio
nse
lect
ive
0.82
Firs
t-ye
arin
stitu
tion
pub
lic1.
38Fi
rst-
year
inst
itutio
nin
stat
eof
high
scho
ol1.
20Fi
rst-
year
inst
itutio
nw
asfir
stch
oice
0.96
Con
stan
t0.
760.
602.
863.
122.
502.
021.
85
Num
ber
ofO
bser
vatio
ns4,
716
4,71
64,
716
4,71
64,
716
4,71
64,
716
Fit
Stat
istic
sLo
glik
elih
ood
-191
5.8
-190
4.3
-182
6.3
-182
0.2
-180
5.4
-180
3.0
-163
5.8
BIC
-112
-101
-198
-168
-155
-126
-410
Adj
R2(M
cFad
den)
0.03
70.
041
0.07
70.
077
0.08
20.
081
0.16
2
Not
e:*
p<
.1,
**p
<.0
5,**
*p
<.0
1;fit
stat
istic
sba
sed
onon
eco
mp
lete
and
wei
ghte
dda
tase
t(f
itsta
tco
mm
and)
.
at UNIV NORTH TEXAS LIBRARY on January 19, 2011soe.sagepub.comDownloaded from

Beyond Access 115
job of predicting the preference for lateraltransfer. In general, then, the results for lat-eral transfer leave much space for explana-tions of its determinants and its relationshipto socioeconomic background.
DISCUSSION AND CONCLUSION
This analysis expands on prior research onsocioeconomic differences in college stu-dents’ mobility, particularly to identify moreprecisely which aspects of family backgroundmatter most for transfer, and why. By exam-ining parental education, family income, andsocial-class influences separately, we devel-oped a more nuanced view of students’mobility. We also tested several potentialexplanations for differences in the types oftransfer that four-year college studentsengage in, including variation in high schoolacademic preparation, strategic planning,educational expectations, financial con-straints, and college performance.
Our results indicate that students whotransfer from four-year colleges should not betreated as a homogeneous faction. The incli-nation to group them with a label such as“swirling students” should be avoided, sincesuch a term conceals important differences inregard not only to their motivations forchanging colleges, but to differential process-es of stratification.11 Lateral transfer studentsappear to be a relatively elite set, since theirlevels of household income and parentaloccupational status are higher than average.Their motivations for changing colleges maybe based on expressions of personal prefer-ence, possibly striving to move to a “better”school, but are clearly not connected to inad-equate academic preparation in high schoolor poor performance in college. Furthermore,other research has found no differences inrates of completing degrees among studentswho begin at a four-year college and staythere and those who move to another four-year school, net of other factors (Goldrick-Raband Pfeffer 2007). If lateral transfer is thus theless pressing issue from an educational policyperspective, the failure of our models toexplain its determinants fully also appears lessproblematic.
On the other hand, reverse transfer is morecommon among students whose parents didnot receive more than a bachelor’s degree.Although much of the emphasis in highereducation is on the differences between stu-dents with and without college-educated par-ents, among the students at four-year col-leges, the most important distinction here isbetween students with “BA-plus” parents andthose without.12 Students whose parentswent to graduate school are less likely toleave their first college to attend a communi-ty college. Our hypotheses for this relation-ship, derived from stratification theory, werelargely unsuccessful; the levels of academicpreparation, informational and financialresources, and educational expectationsfound among the children of less-educatedparents do not explain these students’ ten-dency to reverse transfer. Instead, the analy-ses clearly showed that students who areequally well prepared for college but comefrom less-educated families show a higherpropensity to leave the four-year college trackbecause they struggle academically in theirfirst year of college. This finding is consistentwith other research that has identified signifi-cant challenges for first-generation students,particularly during their first year of college(Tinto 2004). It may be explained by the fail-ure of our measures of academic preparationto capture adequately the factors that arereally required for college success—althoughwe note that our measures included all thoseused by college admissions officers to predictthe ability to succeed in college (test scores,high school course work, and GPA). But thisfinding is especially interesting in light ofother recent research that has identifiedgreater cognitive gains during college among“BA-plus” students (Arum et al. 2008). Thereappear to be important advantages accruingto the children of parents who succeeded ingraduate school, including a greater propen-sity to resolve academic difficulties by stayingin the four-year sector, rather than moving toa community college.
This evidence of differentiation in the actionsof students when they leave their first collegecalls for more attention to what happens afterstudents initially access college.13 It does notappear to be the case that mobility per se is a
at UNIV NORTH TEXAS LIBRARY on January 19, 2011soe.sagepub.comDownloaded from
116 Goldrick-Rab and PfefferTa
ble
3.Lo
gis
tic
Reg
ress
ion
Pred
icti
ng
Late
ralT
ran
sfer
Varia
bles
III
IIIIV
VVI
VII
Soci
alBa
ckgr
ound
Pare
ntal
educ
atio
n:So
me
colle
ge1.
031.
041.
051.
041.
031.
030.
99Pa
rent
aled
ucat
ion:
BA1.
031.
031.
061.
041.
021.
020.
99Pa
rent
aled
ucat
ion:
Hig
her
than
aBA
0.90
0.90
0.95
0.93
0.91
0.90
0.92
Soci
alcl
ass:
Whi
teco
llar
1.21
1.22
1.25
1.25
1.24
1.23
1.23
Soci
alcl
ass:
Self-
emp
loye
d1.
57*
1.55
*1.
56*
1.54
*1.
53*
1.51
1.55
*Fa
mily
inco
me
1.29
***
1.26
**1.
25**
1.25
*1.
23*
1.21
*1.
23*
Dem
ogra
phic
sFe
mal
e0.
981.
021.
021.
031.
021.
03N
onw
hite
0.94
0.91
0.90
0.89
0.88
0.89
Sing
lem
othe
rho
useh
old
0.91
0.91
0.92
0.92
0.92
0.93
Num
ber
ofsi
blin
gs1.
031.
031.
031.
031.
031.
04H
igh
Scho
olAc
hiev
emen
tN
ELS
seni
orte
st1.
001.
001.
001.
001
Hig
hsc
hool
GPA
0.79
**0.
80**
0.80
**0.
79**
0.85
Aca
dem
iccu
rric
ulum
inte
nsity
,2n
dq
uint
ile1.
201.
211.
191.
161.
12A
cade
mic
curr
icul
umin
tens
ity,
3rd
qui
ntile
1.54
1.53
1.48
1.40
1.32
Aca
dem
iccu
rric
ulum
inte
nsity
,4t
hq
uint
ile1.
581.
531.
471.
381.
34A
cade
mic
curr
icul
umin
tens
ity,
high
est
qui
ntile
1.15
1.11
1.06
1.00
1.01
Hig
hsc
hool
mob
ility
0.86
0.87
0.87
0.90
0.89
Stra
tegi
cPl
anni
ngPa
rtic
ipat
ion
inp
reco
llege
pro
gram
s0.
980.
981.
001.
07Pa
rent
alin
volv
emen
tin
colle
gede
cisi
on1.
161.
151.
131.
14N
umbe
rof
colle
ges
app
lied
to:
10.
71*
0.70
*0.
64**
0.74
Num
ber
ofco
llege
sap
plie
dto
:2–
41.
101.
070.
981.
11N
umbe
rof
colle
ges
app
lied
to:
5or
mor
e0.
910.
880.
820.
93Ed
ucat
iona
lExp
ecta
tions
Col
lege
exp
ecta
tion,
fath
er1.
061.
051.
09C
olle
geex
pec
tatio
n,m
othe
r1.
171.
181.
15C
olle
geex
pec
tatio
n,fr
iend
s1.
011.
021.
02Pr
oxim
ityto
hom
ep
refe
renc
e,p
aren
ts0.
940.
950.
95C
onsi
sten
tBA
asp
iratio
ns1.
021.
001.
00
at UNIV NORTH TEXAS LIBRARY on January 19, 2011soe.sagepub.comDownloaded from

Beyond Access 117Ta
ble
3.C
on
tin
ued
Varia
bles
III
IIIIV
VVI
VII
Fina
ncia
lCon
stra
ints
Pare
ntal
abili
tyto
pay
for
colle
ge0.
940.
95A
pp
lied
for
finan
cial
aid
0.97
0.98
Del
aybe
twee
nhi
ghsc
hool
and
colle
ge0.
56**
0.52
**Pa
rent
hood
0.89
0.86
Firs
t-ye
arC
olle
geEx
perie
nce
and
Cha
ract
eris
tics
GPA
first
year
1.03
Com
ple
ted
30cr
edits
infir
stye
ar0.
84Fi
rst-
year
inst
itutio
nse
lect
ive
0.59
***
Firs
t-ye
arin
stitu
tion
pub
lic1.
15Fi
rst-
year
inst
itutio
nin
stat
eof
high
scho
ol0.
70**
Firs
t-ye
arin
stitu
tion
was
first
choi
ce0.
87
Con
stan
t0.
07**
*0.
07**
*0.
10**
*0.
10**
*0.
10**
*0.
14**
*0.
11**
*
Num
ber
ofO
bser
vatio
ns4,
716
4,71
64,
716
4,71
64,
716
4,71
64,
716
Fit
Stat
istic
sLo
glik
elih
ood
-230
8.2
-230
6.2
-229
3.2
-228
1.5
-227
8.5
-227
4.8
-224
9.2
BIC
838
7190
126
152
152
Adj
R2(M
cFad
den)
0.00
60.
005
0.00
80.
011
0.01
00.
010
0.01
8
Not
e:*
p<
.1,
**p
<.0
5,**
*p
<.0
1;fit
stat
istic
sba
sed
onon
eco
mp
lete
and
wei
ghte
dda
tase
t(f
itsta
tco
mm
and)
.
at UNIV NORTH TEXAS LIBRARY on January 19, 2011soe.sagepub.comDownloaded from

118 Goldrick-Rab and Pfeffer
cause for concern or ought to be prevented.Indeed, students from advantaged back-grounds appear to transfer colleges indepen-dent of financial or academic struggles at theirfirst college in a way that does not reduce theirchances for completing their degrees (sincewhen they move, they predominantly go toanother four-year school). On the other hand,mobility among the children of less-educatedparents more often leads them back to a com-munity college, and this appears to be partly aresponse to academic difficulties. Therefore,attention needs to be paid to helping studentswhose parents did not go to graduate school (asizable population) to succeed while in college,potentially by introducing high-quality manda-tory advising programs that can help studentsresolve their academic challenges while remain-ing in the four-year-college sector.
Finally, it is noteworthy that this study hasidentified rates of reverse transfer among four-year college students that appear to exceedestimates of traditional transfer among com-munity college entrants. For example, morethan one-third of socioeconomically disadvan-taged students who begin at four-year collegesreverse transfer to a community college, where-as only approximately 10 percent of low-SESstudents who start at community colleges evermove to a four-year school (Dougherty andKienzl, 2006). To be sure, even the poorest stu-dents at four-year colleges are likely to be atleast somewhat better off than their communi-ty-college peers, which may explain some ofthese differences. Yet our analysis clearly indi-cates that entry to a four-year college is far froma guarantee that socioeconomically disadvan-taged students will remain at, and complete,their education at that type of school.
NOTES
1. By the mid-1990s, nearly one-fifth ofundergraduates attended more than twoschools (Adelman et al. 2003).
2. That is, 71.2 percent of those in the topquartile attend college, compared to 21.6percent of those in the bottom quartile.Conditional on high school graduation, therates are 74.1 percent and 33.8 percent(Haveman and Wilson 2007).
3. We believe that the relationshipbetween aid and college transfer would bestbe examined using an experimental approachin which aid is distributed randomly; the firstauthor is in the midst of such a study and willreport on her findings at a later date.
4. As others have pointed out (e.g., Gruskyand Weeden 2006; Hauser and Warren 1997),such an approach can be misleading and makepoor use of information that is provided by theunderlying dimensions of social background.
5. For ease of writing, we use the termtransfer in this article but note that the NELSdoes not precisely measure formal transfer(involving a transfer of credits) as much as achange in colleges. Many students changecolleges without bringing along credits, andmany enroll in college without completingofficial transfer paperwork.
6. In the student population examinedhere, simultaneous enrollment—measured asenrollment in more than one institution with-in any academic year—is held by as many as28 percent of all students. Yet manyresearchers who have studied transfer havenot accounted for simultaneous enrollment intheir measures of transfer (for an exception,see Adelman 2006).
7. On the basis of the sample restrictionsdiscussed earlier, we used the f4f2p3wtweight (the participation weight for 12th-grade freshened panel members with com-plete postsecondary transcript records). Thisweight works to preserve the representative-ness of the sample on the basis of the level ofcertainty of postsecondary participation andthe completeness of the transcript record;incomplete and single-case records thatwould distort or bias analyses were excluded.
8. One nevertheless has to maintain theassumption that the degree to which the oddsratio estimates are affected by unobserved het-erogeneity is constant across models.
9. It is worth noting that we did not findracial differences in rates of reverse transferamong students from similar socioeconomicbackgrounds.
10. This result is based on models in whicheach variable was entered separately (availablefrom the authors). Also note that in the specifi-cation reported here, the parental educationeffect loses its statistical significance. Stability
at UNIV NORTH TEXAS LIBRARY on January 19, 2011soe.sagepub.comDownloaded from
Beyond Access 119
tests of all regression models (also availablefrom the authors) included an indicator ofwhether a student ever took time off from col-lege. Because of the issue of reverse causality forthis factor (described earlier), we are cautiousabout giving this effect much substantive inter-pretation. However, it has to be noted that withstop-out included, the statistical significance ofthe parental education effect is retained,although the virtually same drop in the size ofthe coefficient occurs. The latter result is themore important point for our conclusions.
11. For examples of uses of the term swirling,
as well as other labels, see Adelman (2004),Borden (2004), de los Santos and Wright(1990), McCormick (2003), and Rab (2004).
12. To be clear, this finding could well be areflection of the fact that we analyzed a selec-tive population of children—four-year collegestarters—among which social background dis-tinctions are at a generally higher level than inthe general population.
13. We are not the first to call for moreattention to issues of college students’ success;see, for example, Rosenbaum et al. (2006).
APPENDIX
Description of Variables
Description
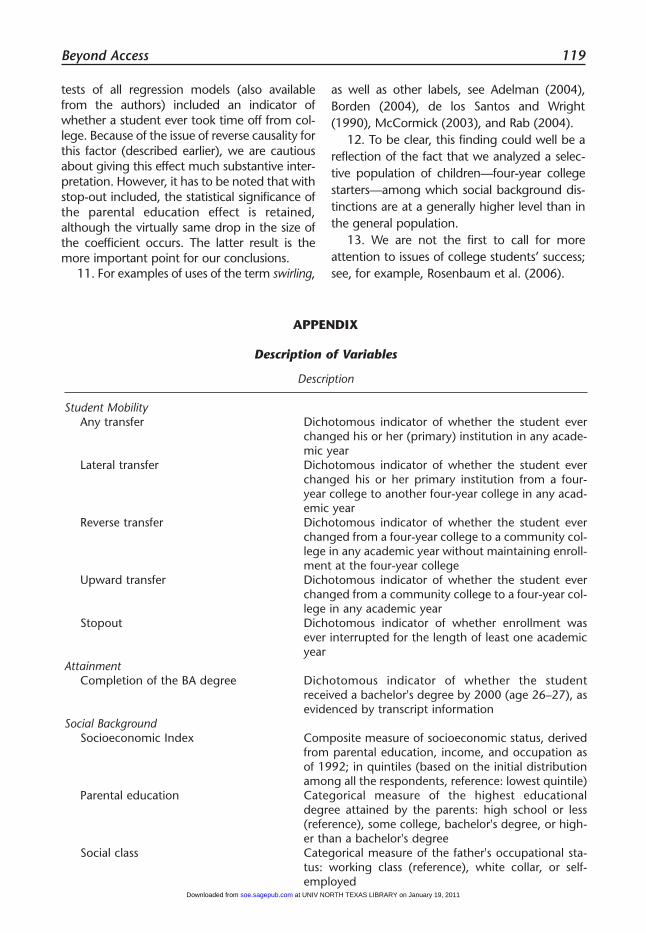
Student MobilityAny transfer Dichotomous indicator of whether the student ever
changed his or her (primary) institution in any acade-mic year
Lateral transfer Dichotomous indicator of whether the student everchanged his or her primary institution from a four-year college to another four-year college in any acad-emic year
Reverse transfer Dichotomous indicator of whether the student everchanged from a four-year college to a community col-lege in any academic year without maintaining enroll-ment at the four-year college
Upward transfer Dichotomous indicator of whether the student everchanged from a community college to a four-year col-lege in any academic year
Stopout Dichotomous indicator of whether enrollment wasever interrupted for the length of least one academicyear
AttainmentCompletion of the BA degree Dichotomous indicator of whether the student
received a bachelor's degree by 2000 (age 26–27), asevidenced by transcript information
Social BackgroundSocioeconomic Index Composite measure of socioeconomic status, derived
from parental education, income, and occupation asof 1992; in quintiles (based on the initial distributionamong all the respondents, reference: lowest quintile)
Parental education Categorical measure of the highest educationaldegree attained by the parents: high school or less(reference), some college, bachelor's degree, or high-er than a bachelor's degree
Social class Categorical measure of the father's occupational sta-tus: working class (reference), white collar, or self-employed
at UNIV NORTH TEXAS LIBRARY on January 19, 2011soe.sagepub.comDownloaded from

120 Goldrick-Rab and Pfeffer
APPENDIX CONTINUED
Description of Variables
Description
Family income Continuous measure of family income; informationfrom 1988 and 1992 averaged on the basis of themidpoints of the reported categories (standardized to2006 dollars); in thousands; logarithmic transforma-tion for regression models
DemographicsFemale Dichotomous indicator of gender; reference: maleNonwhite Dichotomous indicator of race; reference: white or
AsianSingle mother household Dichotomous indicator of whether the student
resided in a family headed by a single mother ineighth grade
Number of siblings Continuous measure of the number of siblings whenin the eighth grade
High School AchievementNELS senior test Continuous measure of the percentile score on the
test of general abilities administered to all survey par-ticipants in the 12th grade
High school GPA Categorical measure of the student’s high schoolgrade point average; in quintiles (quintile values are2.70, 3.07, 3.37, and 3.69; reference: lowest quintile)
Academic curriculum intensity Categorical measure of the rigor of the student's highschool curriculum on the basis of a score determinedby both the quality of courses taken and the numberof "hard" courses taken in multiple subjects (math,Advanced Placement courses, English, foreign lan-guage, science, social sciences, and computer sci-ences). For more on the construction of this variable,see Adelman (1999); reference: lowest quintile
High school mobility Dichotomous indicator of whether a student changedschools between the 8th and 12th grades; reference:never changed high schools
Strategic PlanningParticipation in precollege programs Dichotomous indicator of whether the student ever
participated in a precollege program, such as TalentSearch or Upward Bound
Parental involvement in college decision Dichotomous indicator of whether the decision to goto college was made mainly by or in cooperation withthe parents
Number of colleges applied to Categorical measure of the number of colleges thestudent applied to in the 12th grade; none (refer-ence), 1, 2–4, or 5 or more
Educational ExpectationsCollege expectation, father Dichotomous indicator of whether the student's
father (reportedly) thought that after high school themost important thing for the student to do wasattend college, when asked in 1990 (sophomore year)
College expectation, mother Dichotomous indicator of whether the student'smother (reportedly) thought that after high schoolthe most important thing for the student to do wasattend college, when asked in 1990 (sophomore year) at UNIV NORTH TEXAS LIBRARY on January 19, 2011soe.sagepub.comDownloaded from
Beyond Access 121
REFERENCES
Adelman, Clifford. 1999. Answers in the Tool Box:Academic Intensity, Attendance Patterns, andBachelor’s Degree Attainment. Washington,DC: U.S. Department of Education.
—-. 2004. “The Story-Lines of Multi-InstitutionalAttendance.” Paper presented at the annualforum of the Association for InstitutionalResearch, Boston.
—-. 2006. The Toolbox Revisited: Paths to Degree
Completion from High School Through College.Washington, DC: U.S. Department ofEducation.
Adelman, Clifford, Bruce Daniel, and IlonaBerkovits. 2003. Postsecondary Attainment,Attendance, Curriculum, and Performance:Selected Results from the NELS:88/2000Postsecondary Education Transcript Study(NCES 2003–394). Washington DC.: NationalCenter for Education Statistics.
Alexander, Karl, Robert Bozick, and Doris Entwisle.
APPENDIX CONTINUED
Description of Variables
Description
College expectation, friends Dichotomous indicator of whether the student'sfriends (reportedly) thought that after high school themost important thing for the student to do wasattend college, when asked in 1990 (sophomore year)
Proximity to home preference, parents Dichotomous indicator of whether the college choicewas influenced by the parents' preference for the stu-dent to live at home
Consistent BA aspirations Dichotomous indicator of whether the studentexpected to complete a bachelor's degree in 1990and 1992 (before high school graduation)
Financial ConstraintsParental ability to pay for college Dichotomous indicator of whether the parents report-
ed that they did not see any way to pay for college forthe student in the eighth grade
Applied for financial aid Dichotomous indicator of whether the parents report-ed that their child had applied for financial aid
Delay between high school and college Dichotomous indicator of whether the studentdelayed college entry for at least eight months afterhigh school graduation
Parenthood Dichotomous indicator of whether the student had achild by 1992
First-year College Experience and Characteristics
GPA in the first year Continuous measure of the student's grade pointaverage in the first year of the study
Completed 30 credits in the first year Categorical indicator of whether student completedat least 30 credits in the first year of the study
First-year institution selective Categorical indicator of whether the first collegeattended was selective or highly selective
First-year institution public Dichotomous indicator of whether the first collegeattended was public
First-year institution in the state of the high school Dichotomous indicator of whether the first college
attended was located in the same state as the highschool
First year institution was the first choice Dichotomous indicator of whether the first college attended was the student's first choice
at UNIV NORTH TEXAS LIBRARY on January 19, 2011soe.sagepub.comDownloaded from
122 Goldrick-Rab and Pfeffer
2008. “Warming Up, Cooling Out, or HoldingSteady? Persistence and Change inEducational Expectations After High School.”Sociology of Education 81:371–96.
Alon, Sigal. 2001. “Racial, Ethnic, andSocioeconomic Disparities in CollegeDestinations, 1982 and 1992” (Working paper2001-02). Princeton, NJ: Office of PopulationResearch, Princeton University.
Arum, Richard, Josipa Roska, Melissa Velez, andKim Pereira. 2008, April. “Factors AffectingCognitive Development of DisadvantagedStudents in Higher Education.” Unpublishedmanuscript, Department of AppliedPsychology, New York University.
Avery, Christopher, and Thomas J. Kane. 2004.“Student Perceptions of College Opportunities:The Boston COACH Program.” Pp. 355–91 inCollege Choices: Economics of Where to Go, Whento Go, and How to Pay for It, edited by CarolineM. Hoxby. Chicago: University of ChicagoPress.
Bach, Susan K., Melissa T. Banks, Mary K. Kinnick,Mary F. Ricks, Juliette M. Stoering, and R. DanWalleri. 2000. “Student Attendance Patternsand Performance in an Urban PostsecondaryEnvironment.” Research in Higher Education41:315–30.
Beattie, Irenee R. 2002. “Are All ‘AdolescentEconometricians’ Created Equal? Racial, Classand Gender Differences in CollegeEnrollment.” Sociology of Education 75:19–43.
Belley, Philippe, and Lance Lochner. 2007. “TheChanging Role of Family Income and Ability inDetermining Educational Achievement.”Journal of Human Capital 1:37–89.
Bettinger, Eric. 2004. “How Financial Aid AffectsPersistence.” Pp. 207–33 in College Choices:The Economics of Where to Go, When to Go, andHow to Pay for It, edited by Caroline M.Hoxby. Chicago: University of Chicago Press.
Borden, Victor. 2004. “Accommodating StudentSwirl: When Traditional Students Are NoLonger the Tradition. Change 36(2): 10.
Bowen, William G., Martin A. Kurzweil, and EugeneM. Tobin, E. 2005. Equity and Excellence inAmerican Higher Education. Charlottesville:University of Virginia Press.
Bozick, Robert, and Stephanie DeLuca. 2005.“Better Late Than Never? Delayed Enrollmentin the High School to College Transition.”Social Forces 84:527–50.
Breen, Richard. 2005. “Foundations of a Neo-Weberian Class Analysis.” Pp. 31–50 inApproaches to Class Analysis, edited by ErikOlin Wright. Cambridge, England: CambridgeUniversity Press.
Breen, Richard, and John H. Goldthorpe. 1997.“Explaining Educational Differentials: Towardsa Formal Rational Action Theory.” Rationalityand Society 9:275–305.
Brint, Steven, and Jerome Karabel. 1989. TheDiverted Dream: Community Colleges and thePromise of Educational Opportunity in America,1900–1985. New York: Oxford UniversityPress.
Cabrera, Alberto F., Kurt R. Burkum, and Steven M.La Nasa. 2005. “Pathways to a Four-YearDegree: Determinants of Transfer and DegreeCompletion.” Pp. 155–214 in College StudentRetention: A Formula for Success, edited by AlanSeidman. Westport, CT: Praeger.
Clotfelter, Charles T., Helen F. Ladd, and JacobVigdor. 2005. Who Teaches Whom? Race andthe Distribution of Novice Teachers. Economicsof Education Review 25:377–92.
de los Santos, Alfredo G., Jr., and Irene Wright.1990. “Maricopa’s Swirling Students: EarningOne-Third of Arizona State’s Bachelor’sDegrees.” Community, Technical, and JuniorCollege Journal 60(6):32–34.
Deil-Amen, Regina, and Sara Goldrick-Rab. 2009.“Institutional Transfer and the Management ofRisk in Higher Education” (Working paper).Tucson: College of Education, University ofArizona.
DesJardins, Stephen L., Dennis A. Ahlburg, andBrian Patrick McCall. 2006. “An IntegratedModel of Application, Admission, Enrollment,and Financial Aid.” Journal of Higher Education77:381–429.
Dougherty, Kevin J. 1987. “The Effects ofCommunity Colleges: Aid or Hindrance toSocioeconomic Attainment? Sociology ofEducation 60:86–103.
—-. 1994. The Contradictory College: The ConflictingOrigins, Outcomes, and Futures of theCommunity College. Albany: State University ofNew York Press.
Dougherty, Kevin, and Gregory Kienzl. 2006. “It’sNot Enough to Get Through the Open Door:Inequalities by Social Background in Transferfrom Community Colleges to Four-YearColleges. Teachers College Record 108:452–87.
Dynarski, Susan. 2002. “The Behavioral andDistributional Implications of Subsidies forCollege.” American Economic Review 92:279–85.
Dynarski, Susan, and Judith Scott-Clayton. 2006.“The Cost of Complexity in Federal StudentAid: Lessons from Optimal Tax Theory andBehavioral Economics. National Tax Journal59:319–56.
Ellwood, David T., and Thomas J. Kane. 2000. “WhoIs Getting a College Education? Family
at UNIV NORTH TEXAS LIBRARY on January 19, 2011soe.sagepub.comDownloaded from
Beyond Access 123
Background and the Growing Gaps inEnrollment.” Pp. 283–324 in Securing the Future:Investing in Children from Birth to College, editedby Sheldon Danziger and Jane Waldfogel. NewYork: Russell Sage Foundation.
Erikson, Robert, John H. Goldthorpe, and LuciennePortocarero. 1979. “Intergenerational ClassMobility in Three Western EuropeanSocieties.” British Journal of Sociology30:415–41.
Goldrick-Rab, Sara. 2006. “Following Their EveryMove: An Investigation of Social-ClassDifferences in College Pathways.” Sociology ofEducation 79:61–79.
Goldrick-Rab, Sara, and Fabian T. Pfeffer. 2007,August 11. “Does Changing Colleges Matter?The Equity Implications of Student Mobility.”Paper presented at the annual meeting of theAmerican Sociological Association, New York.
Grodsky, Eric S., and Melanie T. Jones. 2007. “Realand Imagined Barriers to College Entry:Perceptions of Cost.” Social Science Research36:745–66.
Grusky, David B., and Kim A. Weeden. 2006. “Doesthe Sociological Approach to Studying SocialMobility Have a Future?” Pp. 85–108 inMobility and Inequality: Frontiers of Researchfrom Sociology and Economics, edited byStephen Morgan, Gary Fields, and David B.Grusky. Stanford, CA: Stanford UniversityPress.
Guldi, Melanie, Marianne E. Page, and Ann HuffStevens. 2007. “Family Background andChildren’s Transitions to Adulthood: AcrossCohort Differences, 1970s through the1990s.” Pp. 261–77 in The Price ofIndependence: The Economics of EarlyAdulthood, edited by Sheldon Danziger andCecilia Rouse. New York: Russell SageFoundation.
Hauser, Robert M. and John R. Warren. 1997.“Socioeconomic Indexes of OccupationalStatus: A Review, Update, and Critique.” Pp.177–298 in Sociological Methodology, editedby Adrian Raftery. Cambridge, England:Blackwell.
Haveman, Robert, and Kathryn Wilson. 2007.“Access, Matriculation, and Graduation. Pp.17–43 in Economic Inequality and HigherEducation: Access, Persistence, and Success,edited by Stacy Dickert-Conlin and RossRubenstein. New York: Russell SageFoundation.
Hearn, James C. 1984. “The Relative Roles ofAcademic, Ascribed, and SocioeconomicCharacteristics in College Destinations.”Sociology of Education 57:22–30.
—-. 1991. “Academic and Nonacademic Influenceson the College Destinations of 1980 HighSchool Graduates.” Sociology of Education64:158–71.
Ingels, Steven J., T. R. Curtin, Phillip Kaufman,Martha N. Alt, and Xianglei Chen. 2002.Coming of Age in the 1990s: The Eighth-GradeClass of 1988 12 Years Later. Washington DC:National Center for Education Statistics.
Ishitani, Terry T. 2006. “Studying Attrition andDegree Completion Behavior Among First-Generation College Students in the UnitedStates.” Journal of Higher Education77:861–85.
Jencks, Christopher. 1972. Inequality: AReassessment of the Effect of Family andSchooling in America. New York: Basic Books.
Kane, Thomas J. 1994. “College Attendance byBlacks Since 1970: The Role of College Cost,Family Background and the Returns toEducation. Journal of Political Economy 102:878–911.
Karen, David. 2002. “Changes in Access to HigherEducation, 1980–2002.” Sociology ofEducation 75:191–210.
Kim, Doo Hwan, and Barbara Schneider. 2005.“Social Capital in Action: Alignment ofParental Support in Adolescents’ Transition toPostsecondary Education.” Social Forces84:1181–1206.
Lareau, Annette, and Elliot B. Weininger. 2008.“Class and the Transition to Adulthood.” Pp.118–151 in Social Class: How Does It Work?Edited by Annette Lareau and Dalton Conley.New York: Russell Sage Foundation.
Lee, Valerie E., and Kenneth E. Frank. 1990.“Students’ Characteristics that FacilitateTransfer From Two-Year To Four-YearColleges.” Sociology of Education 63:178–93.
Lochner, Lance J., and Alexander Monge-Naranjo.2008. “The Nature of Credit Constraints andHuman Capital (Working paper 13912).Cambridge, MA: National Bureau of EconomicResearch.
Manski, Charles F., and David A. Wise. 1983.College Choice in America. Cambridge, MA:Harvard University Press.
McCormick, Alexander C. 2003. “Swirling andDouble-Dipping: New Patterns of StudentAttendance and Their Implications for HigherEducation.” New Directions for HigherEducation 2003(121):13–24.
McCormick, Alexander C., and C. Dennis Carroll.1997. “Transfer Behavior Among BeginningPostsecondary Students: 1989–1994” (NCES97-266). Washington, DC: National Center forEducation Statistics.
at UNIV NORTH TEXAS LIBRARY on January 19, 2011soe.sagepub.comDownloaded from
124 Goldrick-Rab and Pfeffer
McDonough, Patricia M. 1997. Choosing Colleges:How Social Class and Schools StructureOpportunity. Albany: State University of NewYork Press.
McDonough, Patricia M., and Shannon Calderone.2006. “The Meaning of Money: PerceptualDifferences Between College Counselors andLow-Income Families About College Costs andFinancial Aid.” American Behavioral Scientist49:1703–18.
McPherson, Michael S., and Morton Shapiro.1991. Keeping College Affordable: Governmentand Educational Opportunity. Washington, DC:Brookings Institution Press.
Pascarella, Ernest T., and Patrick T. Terenzini. 2005.How College Affects Students: Vol. 2. A ThirdDecade of Research. San Francisco: Jossey-Bass.
Paulsen, Michael B., and Edward P. St. John. 2002.“Social Class and College Costs: Examining theFinancial Nexus Between College Choice andPersistence.” Journal of Higher Education73:189–236.
Rab, Sara. 2004, August 14. “Putting a New Spinon College Attrition: The Effect of ‘Swirling’ onDegree Completion.” Paper presented at theannual meeting of the American SociologicalAssociation, San Francisco.
Reynolds, John, Michael Stewart, Ryan MacDonald,and Lacey Sischo. 2006. “Have AdolescentsBecome Too Ambitious? High School Seniors’Educational and Occupational Plans, 1976 to2000.” Social Problems 53:186–206.
Rosenbaum, James E., Regina Deil-Amen, and AnnE. Person. 2006. After Admission: From CollegeAccess to College Success. New York: RussellSage Foundation.
Rouse, Celia Elena. 2004. “Low-Income Studentsand College Attendance: An Exploration ofIncome Expectations. Social Science Quarterly85:1299–1317.
Royston, Patrick. 2004. “Multiple Imputation ofMissing Values.” Stata Journal 4:227–41.
Rumberger, Russell W., and Katharine A. Larson.1998. “Student Mobility and the Increased
Risk of High School Dropout.” AmericanJournal of Education 107, 1–35.
Sewell, William H., Archibald O. Haller, and AlejandroPortes. 1969. “The Educational Attainment andEarly Occupational Attainment Process.”American Sociological Review 18:39–61.
Steelman, Lala Carr, and Brian Powell. 1989.“Acquiring Capital for College: TheConstraints of Family Configuration.”American Sociological Review 54:844–55.
Tinto, Vincent. 1993. Leaving College: Rethinkingthe Causes and Cures of Student Attrition (2nded.). Chicago: University of Chicago Press.
—-. 2004. Student Retention and Graduation.Washington, DC: Pell Institute.
Townsend, Barbara K., and John T. Dever. 1999.“What Do We Know About Reverse TransferStudents?” Pp. 5–14 in Understanding theImpact of Reverse Transfer Students onCommunity Colleges, New Directions forCommunity Colleges, no. 106, edited by BarbaraK. Townsend. San Francisco: Jossey-Bass.
Turley, Ruth N. 2006. “When Parents WantChildren to Stay Home for College.” Researchin Higher Education 47:823–846.
Velez, William, and Rajshekhar G. Javalgi. 1987.“Two-Year College to Four-Year College: TheLikelihood of Transfer.” American Journal ofEducation 96(1):81–94.
Venezia, Andrea, and Michael A. Kirst. 2005.“Inequitable Opportunities: How CurrentEducation Systems and Policies Undermine theChances for Student Persistence and Success inCollege.” Educational Policy 19:283–307.
Winter, Paul A., and Michael R. Harris. 1999.“Community College Reverse Transfer Students:A Field Survey of a Nontraditional StudentGroup. Community College Review 27(1), 13–29.
Wright, Erik Olin, ed. 2005. Approaches to ClassAnalysis. Cambridge, England: CambridgeUniversity Press.
Zhang, Liang. 2005. Does Quality Pay? Benefits ofAttending a High-Cost, Prestigious College. NewYork: Routledge.
Sara Goldrick-Rab, Ph.D., is Assistant Professor of educational policy studies and sociology,Department of Educational Policy Studies, University of Wisconsin–Madison. Her main fields ofinterest are higher education policy, social stratification, and community colleges. Dr. Goldrick-Rabis the codirector of the Wisconsin Scholars Longitudinal Study, a randomized trial of the effects ofneed-based financial aid on college completion.
Fabian T. Pfeffer, M.Sc., is a graduate student, Department of Sociology, University of Wisconsin-Madison. His main fields of interest are social inequality and social mobility, sociology of education,and cross-national comparisons. Mr. Pfeffer is currently working on his dissertation, which investi-gates the intergenerational effects of parental wealth in the United States and Germany.
at UNIV NORTH TEXAS LIBRARY on January 19, 2011soe.sagepub.comDownloaded from
Beyond Access 125
This research was supported by dissertation grants awarded to the first author from the SpencerFoundation and the American Educational Research Association, which receives funds for its AERAGrants Program from the National Science Foundation and the U.S. Department of Education’sNational Center for Education Statistics and the Institute of Education Sciences under NSF GrantREC-9980573, and by grants from the National Forum on Higher Education for the Public Goodand the Wisconsin Alumni Research Foundation. The authors sincerely thank Adam Gamoran, EricGrodsky, Doug Harris, You Geon Lee, Michael Olneck, and Elizabeth Vaquera for providing usefulfeedback on earlier drafts. Of course, all errors remain our own. Address correspondence to SaraGoldrick-Rab, Department of Educational Policy Studies and Sociology, University ofWisconsin–Madison, 1025 West Johnson Street, Room 575J, Madison, WI 53706; e-mail:[email protected].
at UNIV NORTH TEXAS LIBRARY on January 19, 2011soe.sagepub.comDownloaded from