Embed Size (px)
Citation preview
Socioeconomic differences in the utilisation of health care services: a European overview
Anton Kunst for the international seminar
on socioeconomic differences in health care utilisation
Brussels, 30 October 2008

How large inequalities could be: poor-rich differences in child health care in Turkey, 1990s
0
2
4
6
8
10
12
14
% died before 5th birthday
0
10
20
30
40
50
60
No professionalassistence at delivery
No full immunisation inchildhood
% o
f chi
ldre
n af
fect
ed Poor
Mid
Rich

Contents
1. Health care and health
2. Need and use of care
3. Use and accessibility of care
4. Quality of care
5. Health care programs and policies

Source of illustrations
European overviews: from the Eurothine project
data from national mortality registries, national interview surveys,
or the SHARE baseline survey
publications by Johan Mackenbach, Anton Kunst, Irina Stirbu et al
www.eurothine.org
National illustrations: from published reports and papers
Health and health care (1)
Key message
in Europe, inequalities also exist in health problems that
are potentially amenable to medical intervention
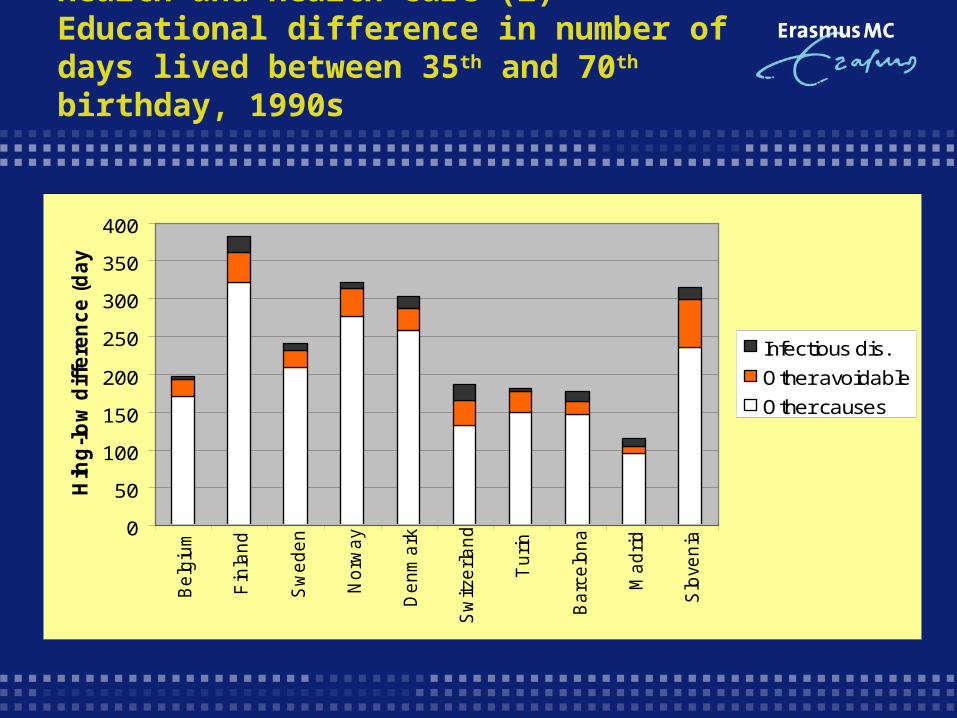
Health and health care (2) Educational difference in number of days lived between 35th and 70th birthday, 1990s
0
50
100
150
200
250
300
350
400
Be
lgiu
m
Fin
lan
d
Sw
ed
en
No
rwa
y
De
nm
ark
Sw
itze
rla
nd
Tu
rin
Ba
rce
lon
a
Ma
dri
d
Slo
ven
ia
Hih
g-l
ow
dif
fere
nc
e (
da
ys
)
Infectious dis.
Other avoidable
Other causes

Health and health care (2b) Idem, including eastern European countries
0
200
400
600
800
1000
1200
1400
1600
1800
2000
Be
lgiu
m
Fin
lan
d
Sw
ed
en
No
rwa
y
De
nm
ark
Sw
itze
rla
nd
Tu
rin
Ba
rce
lon
a
Ma
dri
d
Slo
ven
ia
Hu
ng
ary
Cze
ch R
Po
lan
d
Lith
ua
nia
Est
on
ia
Hih
g-l
ow
dif
fere
nc
e (
da
ys
)
Infectious dis.
Other avoidable
Other causes

Health and health care (3)Specific “avoidable” causes of death
The magnitude of educational inequalities in mortality from nine
causes of death (men and women 30-64 years; 16 countries)
Tuberculosis = 14.68 Pneumonia = 5.46
Leukemia = 1.32 Cervix cancer = 3.90
Stroke, hypertension = 3.30 Rheumatic heart dis = 3.54
Asthma = 4.50 Cholecistitis = 3.62
Appendicitis etc = 4.63

Health and health care (4)Cancer survival in the Netherlands, 1990s
Need and use (1)
Key message
in Europe, differences in the utilization of
most health services are according to need,
except for use of specialist visits

Need and use (2) Differences in volume of use of several types of services
Rate ratios comparing lower to higher income groups for
total volume of use of different services, Netherlands, 2003
GP visits = 1.57 Specialist visits = 1.35
Physiotherapist = 1.19 Dentist visits = 0.91
Hospital nights = 2.07 Prescribed medicines = 1.37
Mental health care = 7.01 Social work = 5.08
Family nurse = 4.02 Alternative medicine = 0.75

Need and use (3) Most differences are according to need
Educational differences in utilisation of four services before and after
control for health status
0.6
0.8
1
1.2
1.4
1.6
1.8
2
2.2
GP visits Specialist visits Prescribedmedicines
Hospitaladmissions
Rate
Rati
o l
low
vs.
hig
h e
du
cati
on
Control age sex Plus control health

Need and use (4) Difference of low vs. high educated groupsin frequency of GP visits, early 2000’s
0.85
0.90
0.95
1.00
1.05
1.10
1.15
1.20
1.25
1.30
Rati
o lo
w v
s. h
igh
Before control After control for health

Need and use (5)Difference of low vs. high educated groupsin frequency of visits to the specialist
0.40
0.50
0.60
0.70
0.80
0.90
1.00
1.10
Rati
o lo
w v
s. h
igh
Before control After control for health

Use and accessibility of care (1)
Key message
Lower socioeconomic groups face specific problems
affecting use and accessibility of services

Use and access (2) Health care foregone because of costs or unavailability, by income level, 2004
0
5
10
15
20
25
France Germany Greece Sweden
% w
ith
fo
reg
on
e c
are
Highest Mid Lowest income

Use and access (3) Summary of inequalities in the utilisation of preventive services, ca. 2004
Less than 10 percent differenceFlu vaccination
Cholesterol check
Blood pressure control
About 10 percent differenceBreast cancer screening
About 25 percent differenceEye examination
Colon cancer screening

Use and access (4)Utilization of mammography by educational level, 2004
0
0.1
0.2
0.3
0.4
0.5
0.6
0.7
0.8
% w
om
en
scre
en
ed
Low High educated

Quality of care (1)
Key message
there is evidence for inequalities in quality of care
delivered to patients from lower classes, at least for
specialized services

Quality of care (2)Treatment of MI patients in Finland
Rate ratio comparing the chance of recieving invasive cardiac
procedures within 2 years after myocardial infarction. Finland,
men (women)
Low vs. intermediate/high education = 0.86 (0.90)
Blue collar vs. white collar = 0.76 (0.91)
Low vs. high income = 0.75 (0.57)

Quality of care (3) Treatment of heart patients in Dutch GP practices
Rates of treatment for men according to educational level High/mid Low
- Diuretics and ACE inhibitors 64.8 62.7% (for heart failure patients)
- Aspirin 55.5 56.0% (for TIA, PAD and AP patients)
- Specialist referral 10.6 12.0% (for all patients groups above)
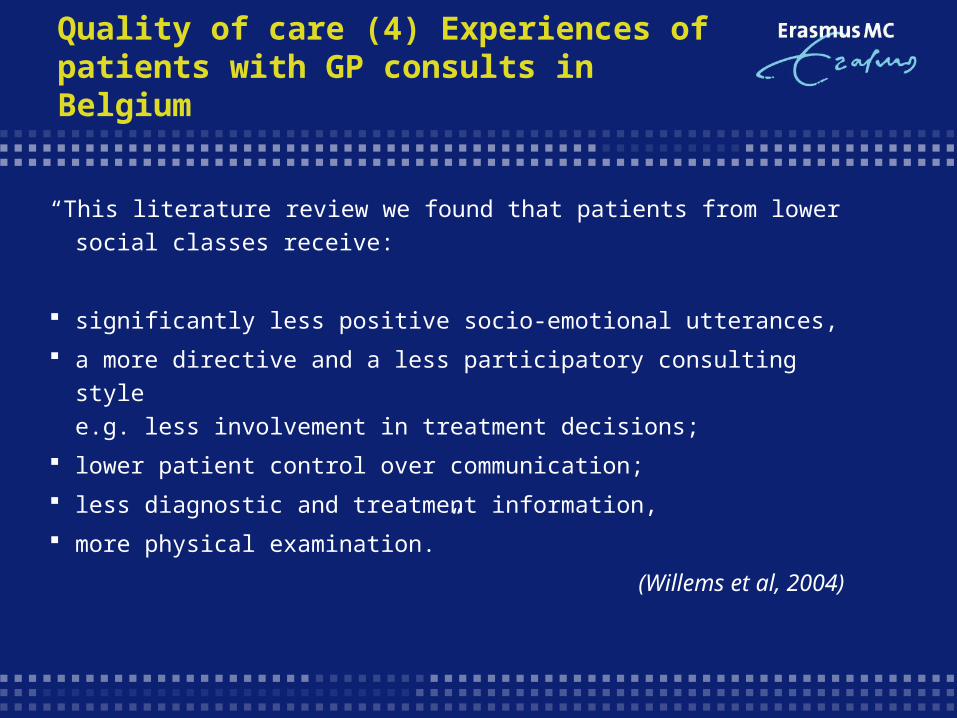
Quality of care (4) Experiences of patients with GP consults in Belgium
“This literature review we found that patients from lower social
classes receive:
significantly less positive socio-emotional utterances,
a more directive and a less participatory consulting style
e.g. less involvement in treatment decisions;
lower patient control over communication;
less diagnostic and treatment information,
more physical examination.”
(Willems et al, 2004)

Programs and policies (1)
Key message
programs and policies can have different effects among
different socioeconomic groups

Programs and policies (2) Invitation strategies for breast cancer screening
Quiz. Reviews of intervention studies showed that organised
breast cancer screening increase attendance among lower
social groups in different ways, except by
A: Promotion through primary
care physicians
C: Invitation letters with medical
explanations
B: Individual tailoring of
invitation letters
D: Removing financial constraints,
e.g. fees

Programs and policies (3) Evaluation of smoking cessation services for deprived areas in England, early 2000’s
SES (combination of education, housing tenure and living conditions)
% of smokers making a
quit attempt(1)
% quitters successful
after 1 year(2)
% of all smokerswho successfully
quitted(1) * (2)
Lowest 20% 2,3 13,0 0,42
Next 20 % 1,9 15,0 0,38
Mid 20% 1,6 14,8 0,37
Next 20% 1,5 18,8 0,47
Highest 20% 1,3 16,9 0,17
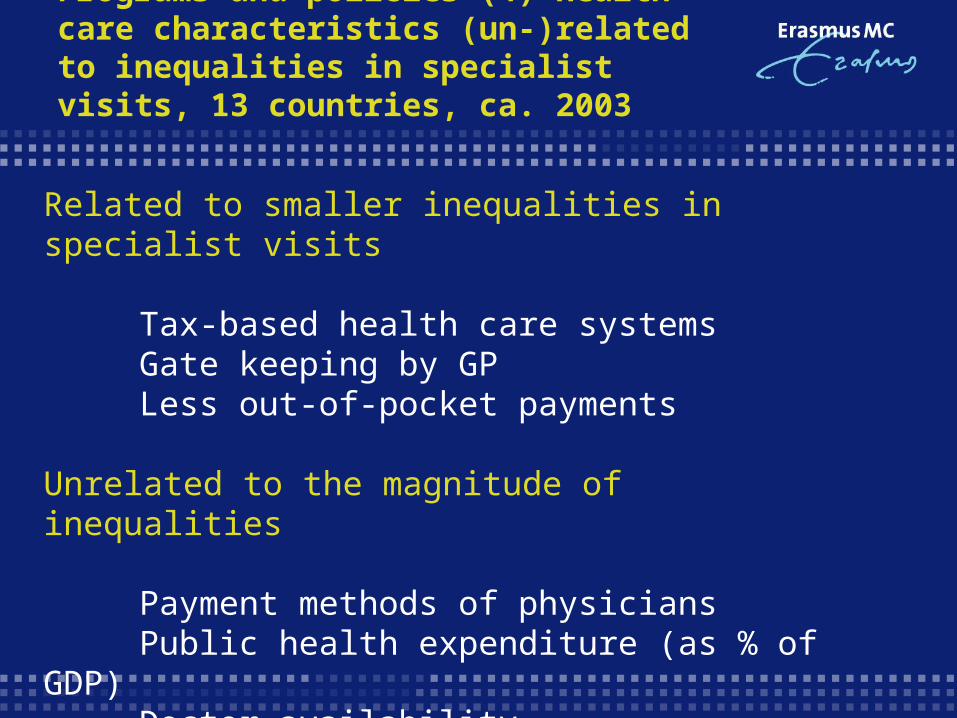
Programs and policies (4) health care characteristics (un-)related to inequalities in specialist visits, 13 countries, ca. 2003
Related to smaller inequalities in specialist visits
Tax-based health care systemsGate keeping by GPLess out-of-pocket payments
Unrelated to the magnitude of inequalities
Payment methods of physiciansPublic health expenditure (as % of GDP)Doctor availability

Summary
1. Inequalities exist for conditions amenable to medical intervention
2. Utilization of health services is generally according to need
3. Lower groups often do face specific problems with accessibility
4. Quality of care delivered to low-class patients is sometimes lower
5. Equity-oriented programs and policies can make a difference