Embed Size (px)
Citation preview
89
Socioeconomic Determinant of Livestock Products Consumption
in Urban and Rural Java, Indonesia
Mujtahidah Anggriani Ummul MUZAYYANAHGraduate Student
Graduate School for International Development and Cooperation
Hiroshima University,
1-5-1 Kagamiyama, Higashi-Hiroshima, 739-8529, Japan
E-mail: [email protected]
Keshav Lall MAHARJANProfessor
Graduate School for International Development and Cooperation
Hiroshima University,
1-5-1 Kagamiyama, Higashi-Hiroshima, 739-8529, Japan
AbstractLivestock products are important animal protein source in Indonesian diet and the consumption of these products
increase. This paper tried to to examine the socioeconomic determinant of the consumption of livestock product in
Indonesia, particularly in urban and rural Java. Analysis of livestock product consumption with some socioeconomic
characteristics of household can be estimate by using household expenditure data. Demand parameters or elasticity were
estimated by using Linear Approximation of Almost Ideal Demand System (LA/AIDS) model. The LA/AIDS model
estimate the price, expenditure elasticity of livestock products consumption and the socioeconomic variables of the
household sample. Estimation of socioeconomic variables shown that household size, age of household head, education
of wives and household head occupation has impact to the consumption of meat, egg and milk for urban household
while only occupation of household head had significant impact for rural household. All own-price elasticities are
negative and statistically significant, except egg. Negative cross-price elasticities indicate complementary relation while
positive sign indicate substitution relation. Expenditure elasticity for meat and milk product is positive, greater than one
and statistically significant at the one percent significance level, implying that they are luxury food. Negative sign in
the expenditure elasticity showed that egg classified as necessity good. The price sensitivity of household consumption
on livestock product such as own- an d cross-price elasticity can more precisely inform policy maker and producer how
consumer will respond if there is change in the price of any or some livestock product and in household income from
the estimation of expenditure elasticity.
1. Introduction
Food consumption patterns in Indonesia have changed. The proportion of expenditure on food has been steadily
【Article】
Journal of International Development and Cooperation, Vol.17, No.1, 2011, pp. 89-102

90 Mujtahidah Anggriani Ummul MUZAYYANAH and Keshav Lall MAHARJAN
declined. Urban and rural household spent about 61 percent of their income on food in 1981 and only 48 percent of the
total income of urban consumers was spent on food while their counterparts in rural areas spent more than 63 percent
on food in 1996. However, in 2002, only 36 percent urban households spent their income on food while rural household
spent more than 55 percent on food.
The food consumption patterns are changing for eating more livestock products including beef and dairy
products rather than cereals (Bond et al, 2007). The proportion of household expenditure on food fell with most of the
decline from cereal and tuberous food group (Widjajanti and Li, 1996). Share of expenditure on cereal group (rice) as
staple food decrease about 8.56 percent during 1990-2002 and only 16.02 percent from their income in 2005, while
expenditure share on livestock product such as meat, egg and milk increase about 2.01 percent (CBS, 2006). As income
increase, the variety of food eaten increase,
Beside rising incomes, socioeconomic characteristics of household have impact to the consumption of food. A
number of studies documented socioeconomic characteristics of household response such as composition of household,
age, region and occupation. The aim of this study is to examine the socioeconomic determinant of the consumption of
livestock product in Indonesia, particularly in urban and rural Java. It is important here to note that Java has contributed
about 53 percent of livestock product consumption in Indonesia (DGLS, 2007).
We organize the paper as follows. Section 2 describes the livestock product consumption in Indonesia. The model
to be used to relate livestock product consumption, data and empirical issue are described in section 3. Result and
discussion and the conclusion are covered in section 4 and 5.
2. Livestock Product Consumption in Indonesia
Livestock product is important source of animal protein in Indonesia. Consumption of animal protein from
livestock product increase about 11.84 percent while only 4.77 percent from fish during 1999-2004.
Consumption of livestock products are increase on average 37.36 percent increases from 1990 to 2005. As shown
in Figure 1, per capita consumption of livestock product in Indonesia grew slowly after economic shock in 1998. Per
capita consumption of meat, egg and milk in Indonesia has increased from 4.45 kg in 1999 to 5.57 kg in 2002 for meat
product. Between 1999 and 2002, egg consumption per person doubled, rising from 2.23 kg to 4.4 kg. This trend also
followed by milk product consumption from 5.23 kg to 7.05 kg per person in the same period (DGLS, 2006).
Figure 1: Consumption of Livestock Product (kg/cap/year)

91Socioeconomic Determinant of Livestock Product Consumption in Urban and Rural Java, Indonesia
Source: DGLS, various years.
It is shown in figure above, when the financial crisis in 1998, consumption on meat, egg, and milk decreased
and the impact of the crisis, consumption change of livestock commodities was the highest for meat, followed by eggs
and milk. Consumption of animal protein decreased substantially in 1998 and 1999 by 28.3 percent and 21.1 percent,
respectively. Contribution of meat in the protein consumption decreased by 25.9 percent in 1998 and 22.2 percent in
1999 Although egg is common commodity widely consumed by people, its protein consumption decreased by 34.20
percent in 1998 and 33.3 percent in 1999 (DGLS, 2006).
Sudaryanto et al (2002) found that the impact of the crisis on livestock product consumption is differed between
urban and rural area. The most affected are consumption on chicken meat, beef, eggs, and milk for both region but only
consumption on beef was relatively constant in rural area.
For the people who still consumed livestock commodities, the rate of their consumption reduces substantially.
For the instance in rural areas, chicken meat consumption decreased by 54.9 percent, eggs 33.6 percent and milk
23.6 percent. In urban areas, the negative change in their consumption is 51.6 percent, 32.9 percent and 23.4 percent
respectively (Ariani, 2004)
During 2004-2006, chicken meat is the highest consumption among meat product consumption of Indonesian
people (about 3.81 kg/cap/year from 4.8 kg/cap/year of the total fresh meat consumption), and chicken egg is also
highest among egg products (about 90 percent from total egg product) (DGLS, 2007). It is indicate that chicken and egg
consumption is main source of animal protein source which have cheap price and people keep consuming chicken meat
and egg.
3. Model Framework, Data and Empirical Issue
3.1. Model FrameworkAnalysis of livestock product consumption with some socioeconomic factors of household can be estimate by
using household expenditure data. Magrabi et al (1991) mentioned that expenditure data summarized information in
single statistic and convenient to use. The proper model in this study is Almost Ideal Demand System (AIDS) model
which is derived from expenditure function.
The AIDS demand function in budget share can be written as
………………………………………….. (1)
where, wi is the budget share of the ith livestock product which are i=1 for meat, i=2 for egg, and i=3 for milk, pj is the
price of the jth food that are livestock product such as meat, egg and milk, x is the total expenditure on the food, α , β,
and γ are the parameters of the variables, ei is error terms and P is Translog Price Index defined by:
……………………………………….. (2)
This price index makes the system nonlinear. To make the model linear in parameters, Deaton and Muellbauer (1980)
suggested using Stone’s price index (Stone, 1954) defined as
……………………………………………………………….. (3)

92 Mujtahidah Anggriani Ummul MUZAYYANAH and Keshav Lall MAHARJAN
The model which uses Stone’s price index is the Linear Approximate of AIDS (LA/AIDS) as follows
………………………………………………….. (4)
LA/AIDS model is widely used in many applied studies (Moschini and Meilke, 1989; Alston et al., 1994;
Rougier, 1997; Jensen and Manrique, 1998; Johnson et al., 1998; Maynard and Liu, 1999). Coefficient derived from
household budget model in the same term which one uses to describes the classical demand model is to imply that the
concept are the same (Waugh, 1932).
In this study household data are used to estimate the model then variables other than income and prices also play
important role in consumption patterns. To incorporate household socioeconomic variables, the LA/AIDS model was
specified as follows
…………………………………. (5)
where Dj is socioeconomic variables of household sample (j =1,2,..n) which are household size, age of household head,
education of wives, occupation of household head .
Parameter estimates of the LA/AIDS are used to calculate the price and expenditure elasticity. Price elasticity
is calculated in two ways; uncompensated and compensated elasticity. Uncompensated price elasticity contains both
income and price effect whereas compensated elasticity includes only price effects. Following Buse (1994) and Green
and Alston (1990), taking the derivative of equation (4) with respect to ln (pj ), uncompensated own ( j=i) and cross ( j ≠
i) price elasticities price of the LA/AIDS are calculated with the following equation:
……………………………. (6)
The compensated price elasticities become as follow:
……………………………………………. (7)
Taking the derivative of equation (4) with respect to ln (x), the expenditure elasticity can be obtained as follows:
………………………………………………………………. (8)
where wi is the average expenditure share, β̂i and γ̂ij are parameter estimates.
The own-price elasticity measures the change in quantity demanded given a one percent change in the own price
of the product. Normal goods are expected to have negative own price elasticity.
Relation between foods can be shown in the cross-price elasticity shows the competitive or complementary
relations amongst products. Substitute product can be indicated by positive cross-price elasticity, while negative cross
price elasticity represents complementary products.
Expenditure elasticity measures the expected change in quantity demanded of a specific product, as the
expenditure on livestock product is increased. If the calculated expenditure elasticity is positive and greater than one,
the product is classified as a luxury product. A positive expenditure elasticity ranging between zero and one indicates a
normal product, whereas negative expenditure elasticity is indicative of an inferior product.

93Socioeconomic Determinant of Livestock Product Consumption in Urban and Rural Java, Indonesia
3.2. DataThe analysis of livestock product consumption considering different region and income groups was determined
by using the SUSENAS (Survei Sosial Ekonomi Nasional). SUSENAS is nationally representative repeated cross-
section household survey that is conducted by Central Bureau of Statistics (CBS), The Government of Indonesia. The
SUSENAS consists of two parts. The first part collects demographic and socioeconomic characteristics of household
such as household member condition, education info, household economic activity, and especially for the ever- married
women have been asked about age when she got married, number of child, and Family Planning attitude. It is known as
Core SUSENAS and this survey is carried out yearly.
The second part of SUSENAS, called Module SUSENAS, provides data of (i) health, (ii) socio-cultural and
(iii) consumption. In other words, Module SUSENAS consists of Health Module, Social and Cultural Module and
Consumption Module. Each of these modules is published or available only once for every 3 (three) years. For example,
as our interest is of Consumption Module, it is published in (from the latest) 2005, 2002, 1999 etc.
This study is cross-section analysis which used cross-section data of household that are sampled once at a
particular time. Based on above description, our study used second part of SUSENAS that is Module SUSENAS
particularly Consumption Module data for 2005. Data cover 13 foods group includes three livestock products group:
(1) Meat including fresh meat (beef, buffalo, mutton/lamb, pork, chicken, native chicken), preserved meat (dried meat,
dried shredded meat, canned meat), others (liver, entrails, bones with a bit of adhering meat, meat with bones), (2) Egg
such as chicken egg, native-chicken egg, duck egg, quail egg, salted egg, and (3) Milk product; fresh milk, sweetened
condensed milk, powdered milk, baby powder milk, cheese. This database consist both quantities and expenditures on
food consumption for each sample household.
Table 1: Definition and descriptive statistics of variables used in LA/AIDS model
Variables Description Mean SDw1 Budget share of meat 0.05 0.06 w2 Budget share of egg 0.02 0.02 w3 Budget share of milk 0.05 0.06 p1 Price of meat 85.13 96.96 p2 Price of egg 54.95 35.41 p3 Price of milk 414.26 1,214.39 X Total expenditure on food (in Rupiah) 521,866.95 443,951.56D1 Household Size 3.97 1.55 D2 Age of household head 45.25 13.33 D3 1 for illiterate wives; 0 otherwise 1.28 1.08
D41 for household head who works in agriculture sector; 0 otherwise 0.72 0.45
Source: SUSENAS 2005. 3.3. Empirical Issue
Demand for food depends on characteristics of household since food has large share in total expenditure like
in Indonesia. Household size, occupation and location make consumption on food different. Some evidence shows
that socio economic characteristics of households are important determinant of food expenditure. Chernichovsky and
Meesok (1985) demonstrate that comparing in rural area, urban population is better in term of consumption of protein
and vitamin C and worse in term of calories and other micronutrient.
Residential locations also appear to be an important determinant of food consumption. This variable was found to
have a positively or negatively significant impact depending on the specification of the location (Mazengo et al, 1997).
94 Mujtahidah Anggriani Ummul MUZAYYANAH and Keshav Lall MAHARJAN
Education level of home decision maker (wives) was found to have positively significant impact to the food expenditure
(Jensen and Manrique ,1998). Household size was found to have significantly positive impact on household food
expenditure (Hatloy et al, 2000).
More recently, we find other relevant works about food consumption from very statistical-works, show some
characteristics of food consumer behavior. Sunarto (2000), for instance, presents animal protein consumption analysis
in West Java, Indonesia, that is change in prices of fish and egg effects to the food consumption since these two items
high price elasticity. Hutasuhut et al (2000) estimated meat consumption parameters. Consumers more adapt their
consumption pattern to chicken price changes than they will for beef price changes.
Liaskos and Lazaridis (2003) study focused on the role of socioeconomic factors on food nutrient consumption
in Greece. They found most socioeconomic factors other than income influence to the nutrient consumption. Fuller,
Beghin and Rozelle (2004); Akbay, Boz and Chern (2007) using Tobit model and Double-hurdle model, respectively,
examines the impact of socio-demographic factors on household food consumption. The factors considered are
urbanization, culture, region, employment status, household size, and income.
Armagan and Akbay (2008) investigated some socio-demographic factors on the demand of animal product.
They found that household size, education, age and the employment status of household head were impact to the
consumption of milk, cheese, meat and fish. Also, Wang et al (2004) found that age composition affects to the dairy
product consumption, family with children or elderly people tend to consume more dairy product, larger family size
tend to have lower animal product consumption and family with higher education tend to increase consume animal
product.
Most studies of consumption in Indonesia focus on staple food. Consumption on livestock product considering
household characteristics is also important to analyze. Food consumption analysis with some socioeconomic variable
commonly use classical demand models which are quantity demanded as function of price, income and other factors.
Consumption analysis can be explored by using food expenditure condition of household, not only quantity consumed
data.
4. Result and discussion
4.1. Socioeconomic characteristic of sample household Household’s characteristics in urban and rural area are reported in Table 2. Average household size is 4.00
in urban and 3.93 in rural. Compare to other province in outer Java, Javanese families tend to be small number of
household member. From 2005 population inter-census by CBS note that average household member in outer Java is
4.2. For instance, average household member was 4.5 and 4.36 in Sumatera and Sulawesi Island, respectively. Average
age of household head in urban area (45.06 years) was not statistical difference with rural area (47 years old). The
distribution among illiterate, basic education and high educational levels of wives are similar between urban and rural
area. Most wives have a basic education level, which corresponds to a senior high school level or equivalent. Rural
wives have a lower rate for attainment collage education than that of urban wives. Education is usually an indicator of
knowledge, i.e., wives in the household as decision maker of food at home with a high education level possess more
knowledge about nutrition and the impact of food consumption on health.
Agriculture sector is the most dominating occupation of the rural household head. About 45.76 percent of
household head in rural area work in agriculture sector comparing with only 10.05 percent of household head in urban
area. Most rural household head are farmer in the food crop.
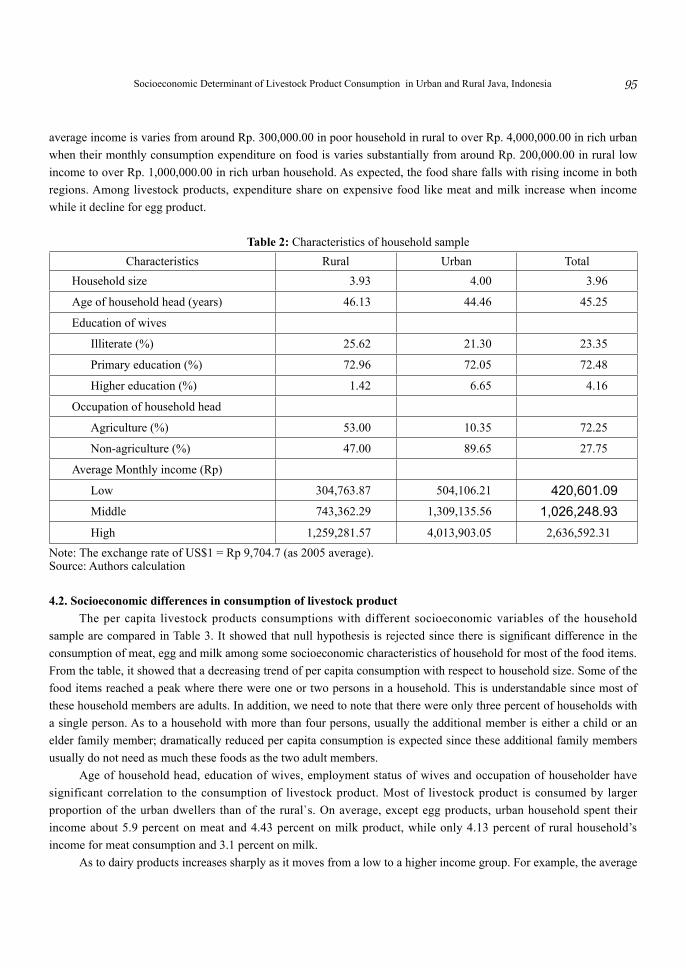
Total household expenditure as a proxy of income is given which divided household into the low, middle and high
group. It can be seen that high income group in rural area is about as much half as that in urban high income. Monthly
95Socioeconomic Determinant of Livestock Product Consumption in Urban and Rural Java, Indonesia
average income is varies from around Rp. 300,000.00 in poor household in rural to over Rp. 4,000,000.00 in rich urban
when their monthly consumption expenditure on food is varies substantially from around Rp. 200,000.00 in rural low
income to over Rp. 1,000,000.00 in rich urban household. As expected, the food share falls with rising income in both
regions. Among livestock products, expenditure share on expensive food like meat and milk increase when income
while it decline for egg product.
Table 2: Characteristics of household sample
Characteristics Rural Urban Total
Household size 3.93 4.00 3.96
Age of household head (years) 46.13 44.46 45.25
Education of wives
Illiterate (%) 25.62 21.30 23.35
Primary education (%) 72.96 72.05 72.48
Higher education (%) 1.42 6.65 4.16
Occupation of household head
Agriculture (%) 53.00 10.35 72.25
Non-agriculture (%) 47.00 89.65 27.75
Average Monthly income (Rp)
Low 304,763.87 504,106.21 420,601.09 Middle 743,362.29 1,309,135.56 1,026,248.93 High 1,259,281.57 4,013,903.05 2,636,592.31
Note: The exchange rate of US$1 = Rp 9,704.7 (as 2005 average).Source: Authors calculation
4.2. Socioeconomic differences in consumption of livestock product The per capita livestock products consumptions with different socioeconomic variables of the household
sample are compared in Table 3. It showed that null hypothesis is rejected since there is significant difference in the
consumption of meat, egg and milk among some socioeconomic characteristics of household for most of the food items.
From the table, it showed that a decreasing trend of per capita consumption with respect to household size. Some of the
food items reached a peak where there were one or two persons in a household. This is understandable since most of
these household members are adults. In addition, we need to note that there were only three percent of households with
a single person. As to a household with more than four persons, usually the additional member is either a child or an
elder family member; dramatically reduced per capita consumption is expected since these additional family members
usually do not need as much these foods as the two adult members.
Age of household head, education of wives, employment status of wives and occupation of householder have
significant correlation to the consumption of livestock product. Most of livestock product is consumed by larger
proportion of the urban dwellers than of the rural`s. On average, except egg products, urban household spent their
income about 5.9 percent on meat and 4.43 percent on milk product, while only 4.13 percent of rural household’s
income for meat consumption and 3.1 percent on milk.
As to dairy products increases sharply as it moves from a low to a higher income group. For example, the average

96 Mujtahidah Anggriani Ummul MUZAYYANAH and Keshav Lall MAHARJAN
per capita milk consumption is 1.99 Kg for the low income group but 13.16 Kg for the high income group. Over all,
income, as indicated by economic theory, has a critical influence on food consumption, particularly specific food
such as livestock product. Clearly, as income increases, both urban and rural Javanese households appear to consume
more meat, egg and milk product. This result is consistent with Utami (1984) in Sunarto (2000) which indicate meat
consumption changed as change in income of household in Java and Bali.
Among livestock product, expenditure for cheaper food was dominated by poor household. For instance, egg
consume higher in poor rural. As increasing income, household changed to expensive food. Higher-income households
allocated a larger share of their budget to meat other than egg. Particularly in rural area, family in the highest income
group spent a much larger share of their food budget (5.67 percent) on meat than that of household in the lowest group
(3.49 percent).
Consumption of livestock product as animal protein source is higher in Java than that of outer Java while fish
is mainly consumed (Ariningsih, 2004). In the previous study, Pakpahan and Suhartini (1990) note that household
expenditure on fish consumption high in South Sulawesi and Maluku.

97Socioeconomic Determinant of Livestock Product Consumption in Urban and Rural Java, Indonesia
Table 3 : Average per capita consumption of livestock products by socio-economic group (kg)
Characteristics Meat Egg Milk
Household size
Less than or equal four 0.66 2.24 5.94
More than four 0.58 1.78 5.05
t-test statistics 6.21*** 19.79** 4.87***
Age of household head
Younger than 30-year-old 0.61 2.14 8.04
Between 30 and 40-year-old 0.67 2.12 7
Between 41 and 50-year-old 0.65 2.11 4.79
Older than 50-year-old 0.6 2.04 4.41
F-test statistics 8.65*** 3.33 71.28**
Education of wives
Illiterate 0.47 2.03 4.01
Primary education 0.64 2.05 5.45
Higher education 1.44 3.18 18.07
F-test statistics 463.14*** 180.3*** 419.59***
Occupation of household head
Agriculture 0.36 1.68 2.05
Non-agriculture 0.74 2.25 7.04
t-test statistics 33.01*** 23.09*** 32.28***
Region
Urban 0.83 2.37 8.32
Rural 0.42 1.78 2.71
t-test statistics 34.81*** 25.17** 31.42***
Average Monthly income
Low 0.32 1.63 1.99
Middle 0.61 2.10 5.36
High 1.29 2.85 13.16
F-test statistics 1396.83*** 517.65* 749.39***
Note: *** , **, and * significant at 1 percent, 5 percent and 10 percent

98 Mujtahidah Anggriani Ummul MUZAYYANAH and Keshav Lall MAHARJAN
4.3. Estimation of parametersLA/AIDS model was used to calculate the elasticities and coefficients of the livestock products consumption.
Table 4 shows the estimated coefficients obtained from the model. It is obvious that although the R2 values of the
equations of each product seem low, in the studies where cross-sectional data is used, these values seem reasonable in
system equations (see Wagner, 1986; Jensen and Manrique, 1998; Armagan and Ackbay, 2008).
In this model, the impacts of socioeconomic factors on the demand for livestock products were measured with the
help of dummy variables added to the model. The impact of socioeconomic values was found to be very low particularly
in the rural household. However, likelihood ratio test statistics suggest that demographic variables have effect on food
consumption. For instance, while the size of households was statistically significant only in egg and milk consumption
in urban area, this variable was insignificant in other categories. While the number of the household members increases,
the budget share of milk in total expenditures on food decreases while increase for egg. The education levels of the
wives are statistically significant on consumption of meat and egg in urban area. On the other hand, as the education
level increases, meat consumptions increase, too. However, there is a negative relation between education level and egg
consumption.
There is no statistically significant relation between the age of the household head and the consumption of meat
and egg in different region. The coefficient of household head occupation is statistically significant to all livestock
product consumption in both regions except meat product.
To determine the sensitivity of the households towards income and prices, demand elasticities were taken into
consideration. Equations 6-8 were used to calculate the elasticities and the results were presented in Table 5.
Table 5 shows the calculated uncompensated and compensated price elasticities, and expenditure elasticites
from the estimation of LA/AIDS model. The uncompensated own price elasticities of household livestock products
in the urban and rural area show a negative sign and follow the theory of demand. Own-price elasticities of all
livestock product are significant at the 1 percent level. The uncompensated own-price elasticities of livestock product
consumption in urban and rural area shown that meat, egg and milk product consumption is sensitive to the change
of prices. Cross-price elasticity with negative sign implied that increasing price of one good causes a decreasing
consumption of another good. From the cross-price analysis, change in the meat price was statistically significant to the
change of egg and milk consumption with negative sign. Increasing price of meat caused decreasing consumption in
egg and milk product. Meat becomes important food for household especially in the urban area.
The compensated price elasticities are very similar to the uncompensated elasticities in terms of sign and
statistical significance. Own-price elasticities of household livestock product carry a negative sign and this show that
households are very sensitive to the change of price. Cross-price elasticities show competitive or complementary
relations among products. All positive cross-price elasticity indicates that there is substitute response, while negative
cross-price elasticity means that products are complements. For instance in the urban area, consumption of meat to the
price of egg (0.27) and milk price (0.418). It is also shown on the consumption of milk to the price of meat (0.13) and
egg price (0.16).
There are seven substitution relationships calculated using the compensated demand compared to only one
derived using the uncompensated demand. The positive statistically significant cross-price elasticities derived from
the uncompensated demand of egg price elasticity are inelastic and have small impacts on changes in demand for
milk products. Another difference in the compensated and uncompensated demands is the number of complementary
relationships. For the uncompensated demand, there are eleven negative cross-price elasticities compared to five
complementary relationships for compensated demand.
Comparing some empirical studies in other region of Indonesia, Sudaryanto et al (1995) found own-price
elasticity of meat, egg and milk products are negative except egg product in South Sumatera. Beef had higher value of

99Socioeconomic Determinant of Livestock Product Consumption in Urban and Rural Java, Indonesia
own-price elasticity than that of other product particularly in Aceh, North Sumatera, Central Kalimantan,West Sumatera
and West Kalimantan. Cross-price elasticity of meat, egg and milk shown substitution relationship in Aceh and all
province in Kalimantan Island and complement relation each other in North Sumatera.
Expenditure elasticity for meat and milk product is positive, greater than one and statistically significant at the
one percent significance level, implying that they are luxury food. Negative sign in the expenditure elasticity showed
that egg classified as necessity good. The higher the expenditure elasticity for meat and milk, the more sensitive
household consumption in these foods is to expenditure changes.
Table 4: Estimation from LA/AIDS model
ParametersRural Urban
Meat Egg Milk Meat Egg Milkβ 0.0116*** -0.0162*** 0.0046*** 0.0273*** -0.0077*** -0.0196***
γi1 0.0640*** -0.0402*** -0.0237*** 0.1090*** -0.0441*** -0.0650***
γi2 0.0014 0.0017 -0.0030 -0.0003 -0.0038*** 0.0042*
γi3 -0.0232*** -0.0133*** 0.0366*** -0.0315*** -0.0198*** 0.0513***
λi1 0.0006 0.0023 -0.0029 -0.0020 0.0051*** -0.0030**λi2 0.0002 0.0005* -0.0008* 0.0016*** 0.0000 -0.0015***λi3 -0.0062 -0.0040 0.0102 0.0056*** -0.0068* 0.0012λi4 0.0111** -0.0573*** 0.0462*** 0.0205 -0.0859*** 0.0654*** R2 0.1370 0.1610 0.2110 0.2760 0.2070 0.3560
Note: *** , ** significant at 1 percent and 5 percent, likelihood ratio test= -2 ln L(β) = 9.019.
Table 5: Uncompensated Elasticity, Compensated elasticity and Expenditure Elasticity
Uncompensated Elasticity Compensated Elasticity Expenditure elasticity
Meat Egg Milk Meat Egg MilkUrban Meat -0.742 -0.036 -0.098 -0.333 -0.399 0.136 1.028
Egg -0.103 -1.017 -0.046 0.272 -0.61 0.169 -0.959Milk -0.255 0.055 -0.746 0.085 0.418 -0.546 1.021
Rural Meat -0.815 -0.013 -0.077 -0.478 0.505 0.245 1.084Egg -0.0724 -0.98 -0.025 -0.405 -0.496 -0.2 -0.984Milk -0.145 -0.03 -0.794 -0.461 -0.518 -0.616 -0.887
Source: Authors calculation.
5. Conclusions
Livestock products are important animal protein source in Indonesian diet. Meat consumption growth slowly
compare with egg and milk product. Some evidence showed that consumption of these foods was sensitive to the
change of economic condition such as income. For instance, the consumption of these food decreases when the income
per capita decreases in the period of economic shock
The per capita livestock product consumptions with different socioeconomic variables of the household sample
showed a decreasing trend of per capita consumption with respect to household size. Education of wives, employment

100 Mujtahidah Anggriani Ummul MUZAYYANAH and Keshav Lall MAHARJAN
status of wives and occupation of householder show significant correlation to the consumption of livestock products.
The LA/AIDS model estimate the expenditure, price elasticity of livestock products consumption and the
socioeconomic variables of the household sample. Our estimates of elasticities suggest that changes in those variables
would produce changes in the consumption of livestock product. The selected socioeconomic variables help to
explain the consumption patterns in Java. The impact of socioeconomic variables has effect on meat, egg and milk
consumption. Family size, household head occupation, age of household head and education of wives was statistically
significant with the consumption of livestock product.
Both own- and cross-price elasticity derived from compensated and uncompensated elasticity revealed that the
sizes of calculated own-price elasticities for the compensated and uncompensated models are different in size. Most of
uncompensated elasticities are seen to be complement while more substitute relation in compensated elasticity, based
on estimates of the cross-section elasticities.
Expenditure elasticity for meat and milk product is positive, greater than one and statistically significant at the
one percent significance level, implying that they are luxury food. Negative sign in the expenditure elasticity showed
that egg classified as necessity good. The higher the expenditure elasticity for meat and milk, the more sensitive
household consumption in these foods is to expenditure changes.
The price sensitivity of household consumption on livestock product such as own- and cross-price elasticity
describe above can more precisely inform policy maker and producer how consumer will respond if there is change in
the price of any or some livestock product and in household income from the estimation of expenditure elasticity.
The conclusion should be further verified through the change in both consumption and price of the livestock
product with complete longitudinal data. Further examinations that employ more complete household panel data will be
used to study of such changes and future prediction of the consumption.
References
Akbay , C., Boz Ismet and Chern, S. Wen (2007), Household food Consumption in Turkey, European Review of
Agricultural Economics, May 2007 , 1-23.
Alston, J. M., Foster, K. A. and Green, R. D. (1994), Estimating elasticities with the linear approximate almost ideal
demand system: Some Monte Carlo results, Review of Economics and Statistics, Vol. 76, 351–356.
Ariani, M. (2004), Analisis Perkembangan Konsumsi Pangan dan Gizi (Food and Nutrition Analysis), ICASEPS
Working Paper , 67, Indonesian Center for Agricultural Socio Economic and Policy Studies.
Ariningsih (2004), Analisis Perilaku Konsumsi Pangan Sumber Protein Hewani dan Nabati Pada Masa Krisis Ekonomi
di Indonesia (Animal and vegetable base protein consumption during economic crisis in Java), ICASERD Working
Paper , 56, Pusat Penelitian dan Pengembangan Sosial Ekonomi Pertanian (Indonesian Center for Agricultural
Socio Economic Research and Development), Badan Penelitian dan Pengembangan Pertanian Departemen
Pertanian.
Armagan, G. and Akbay, C. (2008), An econometric analysis of urban household’s animal products consumption in
Turkey, Applied Economics, 40, 2025-2032.
Bond, R., Gil Rodriguez and Jammie Penm (2007), Agriculture in Indonesia: Review of consumption, production,
imports and import regulations, ABARE Conference Paper , 07.6, 13th Meeting of the Australia–Indonesia
Working Group on Agriculture, Food and Forestry Cooperation (WGAFFC), Gold Coast, Queensland, 28–31 .
Buse, A. (1994), Evaluating the linearized almost ideal demand system, American Journal of Agricultural Economics,
76, 781-793.
CBS (Central Bureau of Statistics) (2006), Percentage of Monthly Per Capita Expenditure by Commodity Group,

101Socioeconomic Determinant of Livestock Product Consumption in Urban and Rural Java, Indonesia
Indonesia from www.bps.go.id
Chernichovsky, D. and Meesok, O. A. (1985). Urban-rural Food and Nutrition Consumption Pattern in Indoensia, PHN
Technical Note 85-5 July 1985, World Bank.
Deaton, A. and Muellbauer, J. (1980), An Almost Ideal Demand System, American Economic Review, 70, 312–325.
DGLS (Directorate General of Livestock Services) (2006), Livestock Statistical Book, Jakarta, Directorate General of
Livestock Services.
DGLS (Directorate General of Livestock Services) (2007), Livestock Statistical Book, Jakarta, Directorate General of
Livestock Services.
Fuller, H. F., Beghin, C. J. and Rozelle, S. (2004), Urban Demand for Dairy Product in China: Evidence from New
Survey Data, Working Paper 04-WP 380, Center for Agricultural and Rural Development, Ames Iowa.
Green, R. and Alston, M. J. (1990), Elasticities in AIDS Model, American Journal of Agricultural Economics, 72 (2) ,
442-445.
Hatloy A., Hallund, J., et al. (2000), Food Variety, Socioeconomic status and Nutritional status in urban and rural area
in Koutiala (Mali), Public Helath Nutriition, 3(1), 57-65.
Jensen, H. H. and Manrique, J. (1998), Demand for food commodities by income groups in Indonesia, Applied
Economics, 30, 491–501.
Johnson, N. L., Hassan, J. A. and Green, R. D. (1998), Demand System Estimation: Methods and Applications, Iowa
State University Press, Ames.
Liaskos, G. and Lazaridis, P. (2003), The demand for Selected food nutrient in Greece: The Role of socioeconomic
factors, Agricultural Economics Review , 4 (2).
Magrabi, F.M., Chung, Y. S., et al. (1991), The Economics of Household Consumption, Praeger Publisher, New York.
Maynard, L. J. and Liu, D. (1999), Fragility in Dairy Product Demand Analysis, Selected Paper Presented at the Annual
AAEA Meetings, Nashville, TN.
Mazengo, M.C., Simmel, O., et al. (1997). Food Consumption in rural and urban Tanzania, Acta Tropica, (68) , 313-
326.
Moschini, G. and Meilke, K. D. (1989), Modeling the Pattern of Structural Change in U.S. Meat Demand, American
Journal of Agricultural Economics, 71, 253–61.
Pakpahan, A. and Suhartini, S. H. (1990), Perkembangan keanekaragaman konsumsi pangan rumah tangga kota di
Indonesia (Food Consumption of urban household in Indoensia), Forum Statistik , 3 , 9-24.
Rougier, J. (1997), A Simple Necessary Condition for Negativity in the Almost Ideal Demand System with the stone
price index, Applied Economics Letters, 4, 97–9.
Stone, J. R. N.(1954), Linear Expenditure Systems and Demand Analysis: An Application to the Pattern of British
Demand, Economic Journal, 64, 511–27.
Sudaryanto, T., Wayan, R. I. and Tjeppy, D. S. (2002), The Impact of the Economic Crisis and Prospects for Livestock
Industry in Indonesia, Jurnal Puslitbang Pertanian, 21 (2).
Sudaryanto, T., Sayuti, R. and Soedjana,T.D. (1995), Pendugaan Parameter Permintaan Hasil Ternak di Beberapa
Propinsi Sumatera dan Kalimantan (Estimation of Livestock Product Demand Parameter in Sumatera and
Kalimantan), Jurnal Penelitian Peternakan Indonesia ,2 , Pusat Penelitian dan Pengembangan Peternakan Bogor.
Sunarto, I. (2000), Analisis Konsumsi Rumah Tangga Untuk Komditi Pangan Protein Hewani di Propinsi Jawa Barat
(Consumption of Animal Protein Consumption in West Java), Bachelor Thesis, Faculty of Agriculture, Bogor
Agriculture Institute, Indonesia.
Wang, J.M., Zhou, Z.Y. and Yang, J. (2004), How Much Animal Product do the Chinese Consume? Empirical evidence
from household survey, Australian Agribusiness Review, 12, paper 4.

102 Mujtahidah Anggriani Ummul MUZAYYANAH and Keshav Lall MAHARJAN
Waugh, E. A. (1932), Elasticity of Demand from Budget Studies, The Quarterly Journal of Economic, 47(1), 134-137.
Widjajanti, E. and Li E. (1996), Food Expenditure Pattern in Urban and Rural Indonesia, 1981 to 1993, Australian
Agribusiness Review , 4 ,Paper 7.