Embed Size (px)
Citation preview

"9th Looking Ahead Conclave - Preparing for Turnaround“
Forecast of Automobiles Industry in FY16
ICRA Management Consulting Services Limited
Society of Indian Automobile Manufacturers
11th January 2015 New Delhi

Agenda
2
Macro -economic Environment
Sectoral Trends
Industry Outlook for FY16

Economic slowdown had a negative impact on Indian Auto
Sector
3
Parameter FY06-
FY11
FY12-
FY14
GDP Growth (%) 8.6 5.3
Manufacturing GDP growth (%) 9.1 2.6
Growth in Gross Fixed Capital Formation (GFCF)
(%) 11.4 4.3
Average Inflation rate (%) 6.2 7.4
INR vs. US$ (Rs./US$) 44.8 54.2
Annual average crude oil prices (US$/barrel) 72.3 90.1
CAGR growth in production (%)
Passenger Vehicles (PV) 17.9 (1.2)
Commercial Vehicles (CV) 14.2 (13.3)
Two Wheelers (2W) 11.9 4.6
Three Wheelers (3W) 13.0 (2.8)
Automotive Components 16.5 (3.6)
• Adverse impact on consumer sentiment
• Increase in cost of ownership – due to high fuel prices, interest rates

Domestic Sales Trends over past five years
4
0
50
100
150
200
250
Q1
FY
10
Q3F
Y10
Q1F
Y11
Q3F
Y11
Q1F
Y12
Q3F
Y12
Q1
FY
13
Q3F
Y13
Q1F
Y14
Q3F
Y14
Q1F
Y15
Un
its
(in
000s)
0.0
0.5
1.0
1.5
2.0
2.5
3.0
3.5
4.0
4.5
Q1F
Y10
Q3F
Y10
Q1F
Y11
Q3F
Y11
Q1F
Y12
Q3F
Y12
Q1F
Y13
Q3F
Y13
Q1F
Y14
Q3F
Y14
Q1F
Y15
0.0
0.3
0.5
0.8
1.0
Q1F
Y10
Q3F
Y10
Q1F
Y11
Q3F
Y11
Q1F
Y12
Q3F
Y12
Q1F
Y13
Q3F
Y13
Q1F
Y14
Q3F
Y14
Q1F
Y15
Un
its
(in
mn
)
Un
its
(in
mn
)
Source: SIAM, IMaCS analysis
FY12-FY14 (CAGR) = 5%
q-o-q (last 8 quarters) = 1.4%
Variation = 7.4%
FY12-FY14 (CAGR) = (2.6%)
q-o-q (last 8 quarters) = (0.4%)
Variation = 6.5%
FY12-FY14 (CAGR) = (11.1%)
q-o-q (last 8 quarters) = (1.7%)
Variation = 14.2%
2.0 2.5 2.6 2.7 2.5
1.9
0.5
0.7 0.8 0.8
0.6
0.6
0.4
0.5 0.5 0.5
0.5
0.4
9.4
11.8
13.4 13.8 14.8
12.1
0.0
3.0
6.0
9.0
12.0
15.0
0.0
1.0
2.0
3.0
4.0
5.0
FY10 FY11 FY12 FY13 FY14 FY15 (Apr-
Dec)
Un
its
(in
mn
)
Un
its
(in
mn
)
Passenger vehicles Commercial Vehicles
Three wheelers Two wheelers (RHS)

Three tier analytical framework of IMaCS’ demand
forecasting model
5
Mo
de
l C
om
po
ne
nts
Cau
sal P
art
s
1A) Causal Econometric model • Univariate Analysis -
economic , industrial and
other factors
• Zero order correlation
• Model / Segment specific
demand functional forms
• Forecast / In sample back
testing
• Substitution model
across categories
Price
Non-price
• ARIMA & VaR methods
Ad
ap
tive
Ad
jus
tme
nt
Mo
du
le
3) Adaptive adjustment to forecasts - based upon
Primary survey – OEMs, dealers on pent up
demand, stock position, discounts, model/ variants
discontinuities –M-M basis
Consistency check for feedback
recd. from OEMs, dealers using
statistical methods
Exogenous adjustment to
results from1+2
1B) Preference shifts - that cause
spikes in sales (e.g. new launches)
1C) Exogenous Impetus - e.g. excise
cut.
2) Time series components:
• Cyclic component - business cycles
• Seasonal component - seasonal
aberrations across every 12 month cycle
• Random Part - Correction
No
n-C
au
sal P
art

Specific models for different vehicle categories
6
IMaCS Forecasting Model – Coverage
Category Models - Category wise Coverage
Passenger Vehicles A1 A2 A3 A4,A5,
A6 UV
Two Wheelers Motorcycles Scooters Mopeds
Three Wheelers 3w Goods 3w
Passengers
LCV & MHCV SCV <3.5 LCV
MHCV 7.5
to12T MHCV Total Buses

Passenger Vehicles
7
0.00
0.02
0.04
0.06
0.08
0.10
0.12
0.14
Q1
FY
04
Q3
FY
04
Q1
FY
05
Q3
FY
05
Q1
FY
06
Q3
FY
06
Q1
FY
07
Q3
FY
07
Q1
FY
08
Q3
FY
08
Q1
FY
09
Q3
FY
09
Q1
FY
10
Q3
FY
10
Q1
FY
11
Q3
FY
11
Q1
FY
12
Q3
FY
12
Q1
FY
13
Q3
FY
13
Q1
FY
14
Q3
FY
14
Q1
FY
15
Q3
FY
15
Un
its
(in
mn
)
Mid size
0
0.1
0.2
0.3
0.4
0.5
0.6
Q1
FY
04
Q3
FY
04
Q1
FY
05
Q3
FY
05
Q1
FY
06
Q3
FY
06
Q1
FY
07
Q3
FY
07
Q1
FY
08
Q3
FY
08
Q1
FY
09
Q3
FY
09
Q1
FY
10
Q3
FY
10
Q1
FY
11
Q3
FY
11
Q1
FY
12
Q3
FY
12
Q1
FY
13
Q3
FY
13
Q1
FY
14
Q3
FY
14
Q1
FY
15
Q3
FY
15
Un
its
(in
mn
)
Micro, Mini & Compact
0
5
10
15
20
25
Q1
FY
04
Q3
FY
04
Q1
FY
05
Q3
FY
05
Q1
FY
06
Q3
FY
06
Q1
FY
07
Q3F
Y0
7
Q1F
Y0
8
Q3
FY
08
Q1
FY
09
Q3
FY
09
Q1
FY
10
Q3
FY
10
Q1
FY
11
Q3
FY
11
Q1
FY
12
Q3
FY
12
Q1F
Y1
3
Q3F
Y1
3
Q1
FY
14
Q3
FY
14
Q1
FY
15
Q3
FY
15
Un
its
(in
000s)
A4-A6
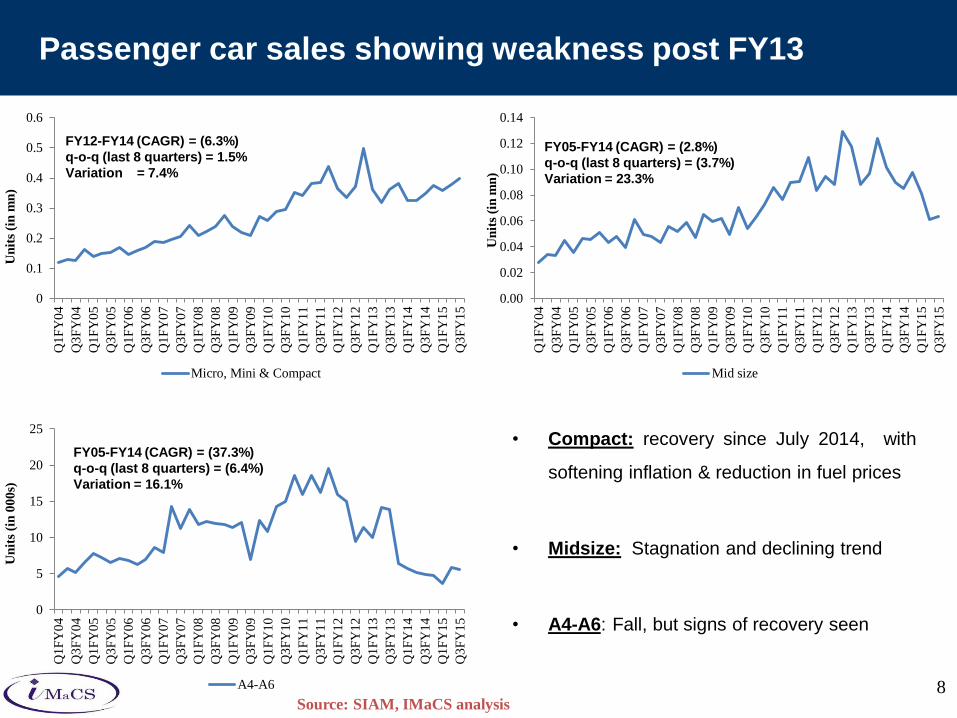
Passenger car sales showing weakness post FY13
8
FY12-FY14 (CAGR) = (6.3%)
q-o-q (last 8 quarters) = 1.5%
Variation = 7.4%
FY05-FY14 (CAGR) = (37.3%)
q-o-q (last 8 quarters) = (6.4%)
Variation = 16.1%
FY05-FY14 (CAGR) = (2.8%)
q-o-q (last 8 quarters) = (3.7%)
Variation = 23.3%
Source: SIAM, IMaCS analysis
• Compact: recovery since July 2014, with
softening inflation & reduction in fuel prices
• Midsize: Stagnation and declining trend
• A4-A6: Fall, but signs of recovery seen

0
10
20
30
40
50
60
70
Q1
FY
04
Q3
FY
04
Q1
FY
05
Q3
FY
05
Q1
FY
06
Q3
FY
06
Q1
FY
07
Q3F
Y0
7
Q1
FY
08
Q3
FY
08
Q1
FY
09
Q3
FY
09
Q1
FY
10
Q3
FY
10
Q1
FY
11
Q3
FY
11
Q1
FY
12
Q3
FY
12
Q1F
Y1
3
Q3
FY
13
Q1
FY
14
Q3
FY
14
Q1
FY
15
Q3
FY
15
Th
ou
san
ds
MPVs
0
20
40
60
80
100
120
140
160
Q1
FY
04
Q3
FY
04
Q1
FY
05
Q3
FY
05
Q1
FY
06
Q3
FY
06
Q1
FY
07
Q3
FY
07
Q1
FY
08
Q3
FY
08
Q1
FY
09
Q3
FY
09
Q1
FY
10
Q3
FY
10
Q1
FY
11
Q3
FY
11
Q1
FY
12
Q3
FY
12
Q1
FY
13
Q3
FY
13
Q1
FY
14
Q3
FY
14
Q1
FY
15
Q3
FY
15
Un
its
(in
00
0s)
MUV/SUV
New model launches have driven growth in sales of SUVs
9
• After showcasing a growth of 21%, 10%,
23% and 51% respectively from FY09 to
FY13, the segment declined by 5.1% in
FY14 and still continues to remain weak
except for the festive season
• After witnessing strong growth of 41%, 42%
and 10% respectively from FY09 to FY12
the segment has showed signs of weakness
in FY13 and FY14 on account of no new
launches in the segment
• Current Fiscal outlook also continues to
remain bleak with the 3rd quarter showing a
decline in excess of 10%
FY12-FY14 = 19.5%
q-o-q (last 8 quarters) = (0.6%)
Variation = 8.1% (last 8 quarters)
FY12-FY14 = (9.9%)
q-o-q (last 8 quarters) = (4.4%)
Variation 14.7% (last 8 quarters)
Source: SIAM, IMaCS analysis

Demand drivers
10
Economic
• GDP q-q
• Excise Rates
• Interest rates
• Weighted Fuel prices
• Private Final Consumption Expenditure
(PFCE)
• WPI – Auto-parts index
Industrial
Variables
• New model launches
• Inventory levels
Other
factors
• Substitution from other category of
vehicles (A1 and Motorcycles/Scooters )
• Substitution within the category (A2 to
A3, A2 to Compact SUV, A3 to SUV etc.)

Zero order correlation matrix – Illustrative – A1&A2
segment
11
A1
GDP at
factor cost
(Q) PFCE
Excise
Duty
Interest
Rate Fuel Price
motorcycle
sales
scooter
sales
Motorcycle
+ Scooter A1A2
Pearson
Correlatio
n
1 .758**
.760**
-.357* .125 .761
**.822
**.823
**.835
**.679
**
Sig. (2-
tailed)
.000 .000 .020 .482 .000 .000 .000 .000 .000
N 42 42 42 42 34 42 42 42 42 42
Pearson
Correlatio
n
.758** 1 .983
**-.770
** -.201 .884**
.928**
.900**
.934**
.917**
Sig. (2-
tailed)
.000 .000 .000 .254 .000 .000 .000 .000 .000
N 42 42 42 42 34 42 42 42 42 42
Pearson
Correlatio
n
.760**
.983** 1 -.760
** -.187 .901**
.937**
.914**
.944**
.872**
Sig. (2-
tailed)
.000 .000 .000 .290 .000 .000 .000 .000 .000
N 42 42 42 42 34 42 42 42 42 42
Correlations
a1
gdpfcq
pfceo
Pearson
Correlatio
n
.679**
.917**
.872**
-.785** -.335 .711
**.875
**.774
**.855
** 1
Sig. (2-
tailed)
.000 .000 .000 .000 .053 .000 .000 .000 .000
N 42 42 42 42 34 42 42 42 42 42
a1a2
**. Correlation is significant at the 0.01 level (2-tailed).
*. Correlation is significant at the 0.05 level (2-tailed).

Functional Form & Related Statistics –A1& A2 Elasticity
Model
12
Causal model explains upto 87%
variability….. NOT good enough !
Ln (A1+A2 sales) = -0.982+.1.058 Ln (PFCE)
- 0.285 * Ln (Excise)
Model Summaryb
Model R R Square Adjusted
R Square
Std. Error of
the Estimate
.932a .868 .861 .12848
a. Predictors: (Constant), lnexcise, lnpfce
b. Dependent Variable: lna1a2
Coefficientsa
Model
Unstandardized
Coefficients
Standardize
d
Coefficients t Sig.
B Std.
Error Beta
1
(Constant
) -.982 2.094 -.469 .642
lnpfce 1.058 .141 .693 7.497 .000
lnexcise -.285 .092 -.285 -3.084 .004
a. Dependent Variable: lna1a2

Causal model alone does not explain short term demand
behaviour completely – E.g. New Model Launches
13
0
100
200
300
400
500
600
700
800
900
1000
Q1F
Y05
Q3F
Y05
Q1
FY
06
Q3F
Y06
Q1F
Y07
Q3F
Y07
Q1F
Y08
Q3F
Y08
Q1F
Y09
Q3F
Y09
Q1
FY
10
Q3F
Y10
Q1F
Y11
Q3F
Y11
Q1F
Y12
Q3F
Y12
Q1F
Y13
Q3F
Y13
Q1
FY
14
Q3F
Y14
Q1F
Y15
Un
its
(in
000s)
Actual Sales (A1 + A2) Model sales (A1 + A2)
0
50
100
150
200
250
300
350
400
450
500
Q1
FY
05
Q3
FY
05
Q1
FY
06
Q3
FY
06
Q1
FY
07
Q3
FY
07
Q1
FY
08
Q3
FY
08
Q1
FY
09
Q3
FY
09
Q1
FY
10
Q3
FY
10
Q1
FY
11
Q3
FY
11
Q1
FY
12
Q3
FY
12
Q1
FY
13
Q3
FY
13
Q1
FY
14
Q3
FY
14
Q1
FY
15
Un
its
(in
00
0s)
Actual Sales (UVs) Model sales (UVs)
Launch of Maruti Suzuki Alto
K10, Hyundai next gen i10
and i20 era and Nissan Micra
Launch of Mahindra
XUV 5oo, Bolero new
generation, Maruti
Suzuki Ertiga and
Renault Duster
Source: SIAM, IMaCS analysis

Revised estimates post time series correction –Q1 FY14 to
Q2 FY15
14
Actual Sales
(A1 + A2)
Model sales
(A1 + A2)
Q2FY14 325848 313872
Q3FY14 348893 356174
Q4FY14 375558 354283
Q1FY15 359297 374935
Q2FY15 379434 370010
Source: SIAM, IMaCS analysis
- Causal and time series adjustment increases model accuracy significantly
- The above estimates does NOT take into account module 3 adjustments –
This will further improve model accuracy
Launch of Maruti Suzuki Alto
K10, Hyundai next gen i10
and i20 era and Nissan Micra
Increase in petrol prices by 25%
and diesel prices by 47% over 11
month period, firm interest rate,

Passenger Cars to grow at 4.7% in FY16 with compact segment leading
the growth ( Results of Causal Model and Time Series Correction)
15
326
326
349
376
359
379
379
389
387
397
394
404
-9%
3%
-3% -2%
10% 16%
9%
4%
8%
5% 4% 4%
Q1F
Y14
Q2F
Y14
Q3F
Y14
Q4F
Y14
Q1
FY
15
Q2F
Y15
Q3
FY
15 E
Q4
FY
15 P
Q1
FY
16 P
Q2
FY
16 P
Q3
FY
16 P
Q4
FY
16 P
6
5
5
5
4
6
8
9
9
9
9
9
-9%
3%
-3% -2%
10%
16%
9%
4%
8% 5% 4% 4%
Q1
FY
14
Q2
FY
14
Q3
FY
14
Q4
FY
14
Q1
FY
15
Q2
FY
15
Q3
FY
15 E
Q4
FY
15 P
Q1
FY
16 P
Q2
FY
16 P
Q3
FY
16 P
Q4
FY
16 P
• Recovery in GDP growth, cooling inflation lead
to reduction in interest rates and falling crude
prices to drive demand
• Compact and premium segment to benefit the
most as a slew of model launches are also
expected in those segments
• Premium segment expected to get push on
account of lower base and planned launches
102
90
85
97
81
61
68
70
71
70
70
70
-13%
1%
-12%
-21% -20%
-32%
-20%
-29%
-12%
14% 3% 1%
Q1F
Y14
Q2F
Y14
Q3F
Y14
Q4F
Y14
Q1F
Y15
Q2F
Y15
Q3F
Y15 E
Q4F
Y15 P
Q1F
Y16 P
Q2F
Y16 P
Q3F
Y16 P
Q4F
Y16 P
All quarterly sales figures are in ‘000s, Source: SIAM, IMaCS analysis
FY16 growth: 5% Micro, Mini & Compact FY16 growth: 0.5% Midsize
A4 to A6 FY16 growth: 32%

Utility Vehicles to grow at 12% in FY16 with SUV segment
leading the growth
16
124
119
142
141
129
144
148
159
149
151
176
194
5%
-14%
-4% -7%
4%
22%
4%
13% 16%
5%
19% 22%
Q1
FY
14
Q2
FY
14
Q3
FY
14
Q4
FY
14
Q1
FY
15
Q2
FY
15
Q3
FY
15 E
Q4
FY
15 P
Q1F
Y16 P
Q2F
Y16 P
Q3F
Y16 P
Q4F
Y16 P
49
53
47
42
42
46
49
48
49
48
49
40
-6%
4%
-25%
-32%
-14% -13%
4%
13% 16%
5% 2%
-15%
Q1
FY
14
Q2
FY
14
Q3
FY
14
Q4
FY
14
Q1F
Y15
Q2
FY
15
Q3
FY
15 E
Q4
FY
15 P
Q1
FY
16 P
Q2F
Y16 P
Q3
FY
16 P
Q4
FY
16 P
• SUV/MUV segment to continue its momentum in FY16 and is expected to witness strong
growth in H2FY16
• Also, there are a slew of model launches expected in the segment in the next fiscal
• MPV segment expected to shrink due to capacity constraints and now new model launch in
the category
All quarterly sales figures are in ‘000s
Source: SIAM, IMaCS analysis
FY16 growth: 15.5%
MUV/SUV
FY16 growth: 1.1% MPV

Two Wheelers
17
0.0
0.2
0.4
0.6
0.8
1.0
1.2
1.4
Q1
FY
04
Q3
FY
04
Q1
FY
05
Q3
FY
05
Q1
FY
06
Q3
FY
06
Q1
FY
07
Q3
FY
07
Q1
FY
08
Q3
FY
08
Q1
FY
09
Q3
FY
09
Q1
FY
10
Q3
FY
10
Q1
FY
11
Q3
FY
11
Q1
FY
12
Q3
FY
12
Q1
FY
13
Q3
FY
13
Q1
FY
14
Q3
FY
14
Q1
FY
15
Q3
FY
15
Un
its
(in
mn
)
Scooters
0
50
100
150
200
250
Q1
FY
04
Q3
FY
04
Q1
FY
05
Q3
FY
05
Q1
FY
06
Q3
FY
06
Q1
FY
07
Q3
FY
07
Q1
FY
08
Q3
FY
08
Q1
FY
09
Q3
FY
09
Q1
FY
10
Q3
FY
10
Q1
FY
11
Q3
FY
11
Q1
FY
12
Q3
FY
12
Q1
FY
13
Q3
FY
13
Q1
FY
14
Q3
FY
14
Q1
FY
15
Q3
FY
15
Un
its
(in
000s)
Mopeds
0.0
0.5
1.0
1.5
2.0
2.5
3.0
Q1
FY
04
Q3
FY
04
Q1
FY
05
Q3
FY
05
Q1
FY
06
Q3
FY
06
Q1
FY
07
Q3
FY
07
Q1
FY
08
Q3
FY
08
Q1
FY
09
Q3
FY
09
Q1
FY
10
Q3
FY
10
Q1
FY
11
Q3
FY
11
Q1
FY
12
Q3
FY
12
Q1
FY
13
Q3
FY
13
Q1
FY
14
Q3
FY
14
Q1
FY
15
Q3
FY
15
Un
its
(in
mn
)
Motorcycles
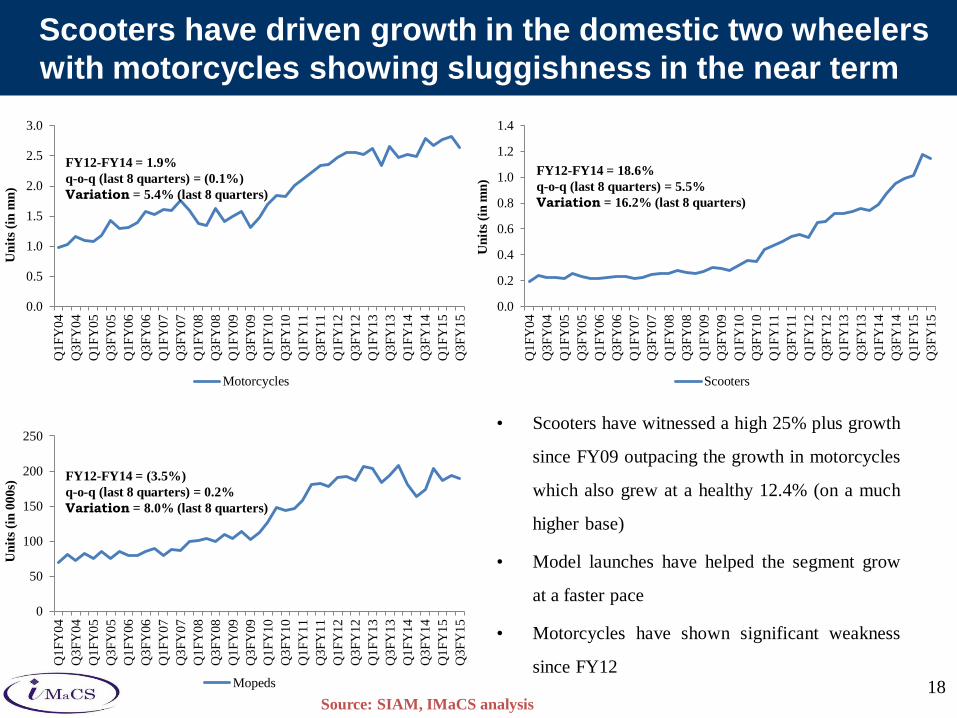
Scooters have driven growth in the domestic two wheelers
with motorcycles showing sluggishness in the near term
18
• Scooters have witnessed a high 25% plus growth
since FY09 outpacing the growth in motorcycles
which also grew at a healthy 12.4% (on a much
higher base)
• Model launches have helped the segment grow
at a faster pace
• Motorcycles have shown significant weakness
since FY12
FY12-FY14 = 1.9%
q-o-q (last 8 quarters) = (0.1%)
Variation = 5.4% (last 8 quarters)
FY12-FY14 = (3.5%)
q-o-q (last 8 quarters) = 0.2%
Variation = 8.0% (last 8 quarters)
FY12-FY14 = 18.6%
q-o-q (last 8 quarters) = 5.5%
Variation = 16.2% (last 8 quarters)
Source: SIAM, IMaCS analysis

Demand drivers
19
Economic
•Q-Q GDP
• Excise Rate
• Interest
•Weighted Fuel Price
• Private Final Consumption Expenditure (PFCE)
• Population in the age bracket of 15-29 years
•WPI – Auto-parts index
Industrial
Variables
•New model launches for scooters as well as
motorcycles
• Inventories
Other factors
• Substitution from other category of vehicles (A1 and
Motorcycles/Scooters etc.)
• Substitution within the category (scooters to
motorcycles, Motorcycles to Scooters etc.)

Zero order correlation matrix – Illustrative – Motorcycles
segment
20
Motorcycle
s Scooters Fuel Price
Excise
duty
Interest
rates
GDP at
factor cost
(Q) PFCE
Population
of age 15-
29 years
Correlations
Pearson
Correlatio
n
-.241 -.101 .059 .222 1 -.176 -.151 -.211
Sig. (2-
tailed)
.176 .576 .744 .214 .326 .401 .237
N 33 33 33 33 33 33 33 33
Interest
rates
Pearson
Correlatio
n
.912**
.946**
.889**
-.368* -.151 .971
** 1 .803**
Sig. (2-
tailed)
.000 .000 .000 .035 .401 .000 .000
N 33 33 33 33 33 33 33 33
PFCE
Pearson
Correlatio
n
1 .932**
.906** -.240 -.241 .901
**.912
**.700
**
Sig. (2-
tailed)
.000 .000 .179 .176 .000 .000 .000
N 33 33 33 33 33 33 33 33
Motorcycle
s
*. Correlation is significant at the 0.05 level (2-tailed).
**. Correlation is significant at the 0.01 level (2-tailed).

Functional Form & Related Statistics – Motorcycles
Elasticity Model
21
Causal model explains upto 91%
variability…..
Ln (motorcycle sales) = -
14.590+0.742*Ln PFCE-
0.527*Ln interest rate
+6.914*LnAge
Standardiz
ed
Coefficient
s
B Std. Error Beta
(Constant) 14.590 6.805 2.144 .041
lnpfce .742 .234 .514 3.173 .004
lnint -.527 .202 -.207 -2.614 .014
lnage 6.914 2.866 .384 2.412 .022
1
a. Dependent Variable: lnmc
Coefficientsa
Model
Unstandardized
Coefficients
t Sig.
R R Square
Adjusted
R Square
Std. Error
of the
Estimate
1 .917a .841 .824 .10485
Model Summary
Model
a. Predictors: (Constant), lnage, lnint, lnpfce
Estimates subject to time series correction !

Backtest chart post time series correction –Q1 FY13 to Q3
FY15
22
Actual sales
(scooters)
Model sales
(scooters)
Q1FY13 720884 748462
Q2FY13 734714 689707
Q3FY13 756162 806876
Q4FY13 745192 777716
Q1FY14 785591 823482
Q2FY14 872330 840310
Q3FY14 953471 975315
Q4FY14 991352 965126
Q1FY15 1010422 1035611
Q2FY15 1179929 1091614
Q3FY15 1144591 1131898
Actual sales
(Motorcycles)
Model sales
(Motor cycles)
Q1FY13 2628949 2310365
Q2FY13 2341641 2395055
Q3FY13 2647753 2665567
Q4FY13 2466590 2584419
Q1FY14 2524316 2591805
Q2FY14 2489807 2669502
Q3FY14 2793399 2943172
Q4FY14 2672295 2949180
Q1FY15 2772573 2886606
Q2FY15 2826111 2785175
Q3FY15 2641923 2834352
Source: SIAM, IMaCS analysis
- Model is accurate upto 95%
- The present estimates does NOT take into account module 3 adjustments – Expected
to further improve forecast accuracy

Revised error rate chart post time series correction –Q1
FY13 to Q3 FY15
23 Source: SIAM, IMaCS analysis
0
200000
400000
600000
800000
1000000
1200000
1400000
1600000
Actual sales (scooters) Model sales (scooters)
0
500000
1000000
1500000
2000000
2500000
3000000
3500000
4000000
Actual sales (Motorcycles) Model sales (Motor cycles)

18
1
164
17
4
20
4
18
6
19
4
19
0
197
20
7
21
8
21
1
21
6 -11% -10% -10%
-2%
3%
18%
9%
-3%
12% 12% 11% 10%
Q1
FY
14
Q2
FY
14
Q3
FY
14
Q4
FY
14
Q1
FY
15
Q2
FY
15
Q3
FY
15
Q4
FY
15
E
Q1
FY
16
P
Q2
FY
16
P
Q3
FY
16
P
Q4
FY
16
P
Two wheelers to grow at 10.5% in FY16 with scooter
segment leading the growth
24
• Scooters to continue their growth momentum
• Capacity additions to benefit scooter
manufacturers
• Motorcycles and Mopeds showing some signs of
recovery; while motorcycles are expected to
show marginal growth, mopeds are expected to
fare better
All quarterly sales figures are in ‘000s, Source: SIAM, IMaCS analysis
FY16 growth: 6.4% Motorcycles FY16 growth: 20.5% Scooters
Mopeds FY16 growth: 11.1%
78
6
87
2
95
3
99
1
1,0
10
1,1
80
1,1
45
1,1
91
1,3
27
1,3
96
1,3
48
1,3
83
9%
19%
26%
33%
29%
35%
20% 20%
31%
18% 18% 16%
Q1F
Y1
4
Q2F
Y1
4
Q3F
Y1
4
Q4F
Y1
4
Q1F
Y1
5
Q2F
Y1
5
Q3F
Y1
5
Q4F
Y1
5 E
Q1F
Y1
6 P
Q2F
Y1
6 P
Q3F
Y1
6 P
Q4F
Y1
6 P
2,5
24
2,4
90
2,7
93
2,6
72
2,7
73
2,8
26
2,6
42
2,8
84
2,9
35
2,9
87
2,9
33
2,9
85
-4%
6% 6%
8% 10%
14%
-5%
8%
6% 6%
11%
3%
Q1F
Y1
4
Q2F
Y1
4
Q3F
Y1
4
Q4F
Y1
4
Q1F
Y1
5
Q2F
Y1
5
Q3F
Y1
5
Q4F
Y1
5 E
Q1F
Y1
6 P
Q2F
Y1
6 P
Q3F
Y1
6 P
Q4F
Y1
6 P

Commercial Vehicles
25

0
20
40
60
80
100
120
140
160
Q1
FY
04
Q3
FY
04
Q1
FY
05
Q3
FY
05
Q1
FY
06
Q3
FY
06
Q1
FY
07
Q3
FY
07
Q1
FY
08
Q3
FY
08
Q1
FY
09
Q3
FY
09
Q1
FY
10
Q3
FY
10
Q1
FY
11
Q3
FY
11
Q1
FY
12
Q3
FY
12
Q1
FY
13
Q3
FY
13
Q1
FY
14
Q3
FY
14
Q1
FY
15
Q3
FY
15
Un
its
(in
00
0s)
LCVs
0
20
40
60
80
100
120
140
Q1
FY
04
Q3
FY
04
Q1
FY
05
Q3
FY
05
Q1
FY
06
Q3
FY
06
Q1
FY
07
Q3
FY
07
Q1
FY
08
Q3
FY
08
Q1
FY
09
Q3
FY
09
Q1
FY
10
Q3
FY
10
Q1
FY
11
Q3
FY
11
Q1
FY
12
Q3
FY
12
Q1
FY
13
Q3
FY
13
Q1
FY
14
Q3
FY
14
Q1
FY
15
Q3
FY
15
Un
its
(in
00
0s)
Small Commercial Vehicles
Small Commercial Vehicles have driven growth in the LCV
segment
26
• Since the creation of the Small Commercial Vehicles segment (launch of Tata Ace) in May 2005, the
segment has shown robust growth. For the first time since May 2005 the segment has showed signs of
deceleration in FY14
• Pick-up segment is showing slow and gradual recovery
• Other segments of LCV continue to remain stagnant owing to no newer options available
FY12-FY14 = 0.03%
q-o-q (last 8 quarters) = (3.5%)
Variation = 17.6% (last 8 quarters)
FY12-FY14 = (2.55%)
q-o-q (last 8 quarters) = (3.3%)
Variation = 17.2% (last 8 quarters)
Source: SIAM, IMaCS analysis

0
10
20
30
40
50
60
70
80
90
100
Q1
FY
04
Q3
FY
04
Q1
FY
05
Q3
FY
05
Q1
FY
06
Q3
FY
06
Q1
FY
07
Q3
FY
07
Q1
FY
08
Q3
FY
08
Q1
FY
09
Q3
FY
09
Q1
FY
10
Q3
FY
10
Q1
FY
11
Q3
FY
11
Q1
FY
12
Q3
FY
12
Q1
FY
13
Q3
FY
13
Q1
FY
14
Q3
FY
14
Q1
FY
15
Q3
FY
15
Un
its
(in
00
0s)
MHCVs
0
5
10
15
20
25
Q1
FY
04
Q3
FY
04
Q1
FY
05
Q3
FY
05
Q1
FY
06
Q3
FY
06
Q1
FY
07
Q3
FY
07
Q1
FY
08
Q3
FY
08
Q1
FY
09
Q3
FY
09
Q1
FY
10
Q3
FY
10
Q1
FY
11
Q3
FY
11
Q1
FY
12
Q3
FY
12
Q1
FY
13
Q3
FY
13
Q1
FY
14
Q3
FY
14
Q1
FY
15
Q3
FY
15
Un
its
(in
00
0s)
ICVs
0
5
10
15
20
25
Q1
FY
04
Q3
FY
04
Q1
FY
05
Q3
FY
05
Q1
FY
06
Q3
FY
06
Q1
FY
07
Q3
FY
07
Q1
FY
08
Q3
FY
08
Q1
FY
09
Q3
FY
09
Q1
FY
10
Q3
FY
10
Q1
FY
11
Q3
FY
11
Q1
FY
12
Q3
FY
12
Q1
FY
13
Q3
FY
13
Q1
FY
14
Q3
FY
14
Q1
FY
15
Q3
FY
15
Un
its
(in
000s)
Buses
Recovery signs visible in M&HCV post formation of new
government
27
• After a y-o-y decline for 27 straight months
since March 2012, the domestic MHCV industry
recorded a positive growth of 3% y-o-y in June
2014 and has stayed in green since then
• Sales of Heavy Commercial Vehicle (HCV)
goods (GVW >12tonnes) have outpaced that of
Intermediate Commercial Vehicle (ICV) (GVW
7.5-12tonnes)
FY12-FY14 = (21.4%)
q-o-q (last 8 quarters) = (3.0%)
Variation = 24.9% (last 8 quarters)
FY12-FY14 = (26.46%)
q-o-q (last 8 quarters) = (6.2%)
Variation = 16.1% (last 8 quarters)
x
Source: SIAM, IMaCS analysis
FY12-FY14 = (3.95%)
q-o-q (last 8 quarters) = 9.3%
Variation = 20.4% (last 8 quarters)
x
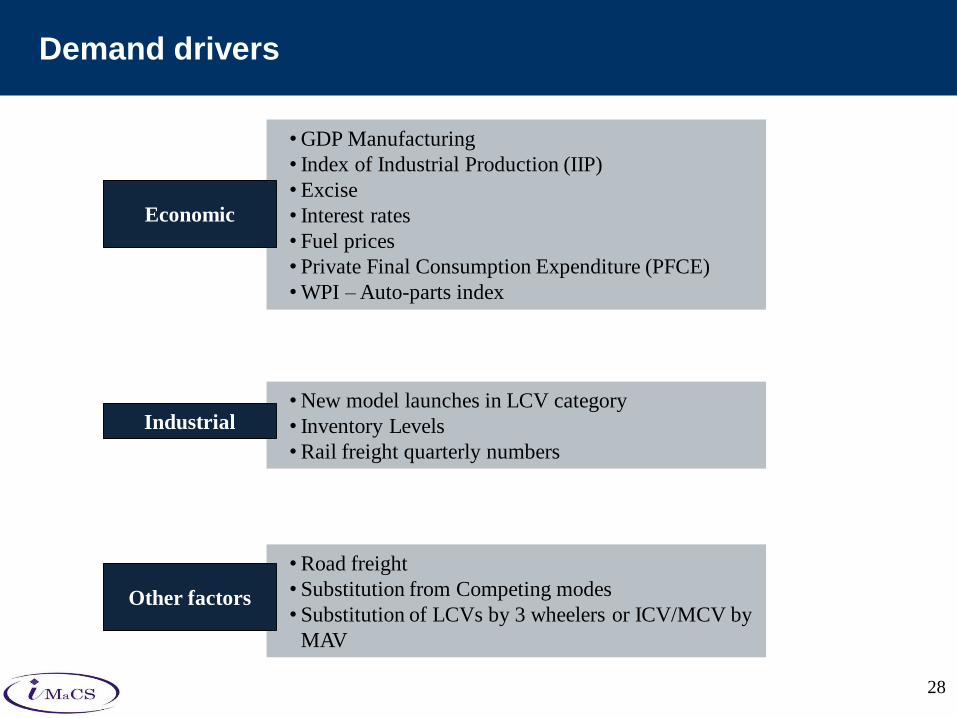
Demand drivers
28
Economic
•GDP Manufacturing
• Index of Industrial Production (IIP)
• Excise
• Interest rates
• Fuel prices
• Private Final Consumption Expenditure (PFCE)
•WPI – Auto-parts index
Industrial •New model launches in LCV category
• Inventory Levels
•Rail freight quarterly numbers
Other factors
•Road freight
• Substitution from Competing modes
• Substitution of LCVs by 3 wheelers or ICV/MCV by
MAV

Zero order correlation matrix – Illustrative – Small
Commercial Vehicles segment
29
SCV (<
3.5 T
GVW)
LCV (5 to
7T)
Diesel
prices
GDP Mfg
(Q) IIP
Freight
Movement
by rail
Interest
rates PFCE
Correlations
Pearson
Correlatio
n
.940**
-.845**
.832** 1 .988
**.974
** .082 .953**
Sig. (2-
tailed)
.000 .000 .000 .000 .000 .612 .000
N 41 41 41 41 41 41 41 41
GDP Mfg
(Q)
Pearson
Correlatio
n
1 -.791**
.801**
.940**
.900**
.905** .058 .663
**
Sig. (2-
tailed)
.000 .000 .000 .000 .000 .715 .000
N 42 42 42 41 42 42 42 42
SCV (<
3.5T GVW)

Functional Form & Related Statistics – Small Commercial
Vehicles Elasticity Model
30
R R Square
Adjusted
R Square
Std. Error
of the
Estimate
1 .977a .954 .953 .13431
Model
a. Predictors: (Constant), lngdpM
Model Summary
Standardiz
ed
Coefficient
s
B Std. Error Beta
(Constant) -8.787 .687 -12.797 .000
lngdpM 2.630 .092 .977 28.491 .000
1
a. Dependent Variable: ln3.5
Coefficientsa
Model
Unstandardized
Coefficients
t Sig.
Causal model explains upto 96%
variability….
Ln (SCV sales) = -8.787+2.630*Ln
gdpM

Forecast improves after including time series correction –
Q1 FY14 to Q3 FY15
31
Actual
sales
(SCVs)
Model sales
(SCVs)
Q1FY14 90534 79554
Q2FY14 90977 83539
Q3FY14 90383 85760
Q4FY14 88063 84592
Q1FY15 70567 73655
Q2FY15 80672 78202
Q3FY15 79828 77292
- Causal and time series adjustment get the forecast to about 96% accuracy
- The present estimates does NOT take into account module 3 adjustments – Expected
to further increase forecast accuracy

Revised error rate chart post time series correction –Q1
FY14 to Q3 FY15
32
0
20000
40000
60000
80000
100000
120000
140000
160000
180000
Q1FY14 Q2FY14 Q3FY14 Q4FY14 Q1FY15 Q2FY15 Q3FY15
Actual sales (SCVs) Model sales (SCVs)
0
10000
20000
30000
40000
50000
60000
Q4FY14 Q1FY15 Q2FY15 Q3FY15
Actual sales (MHCVs) Model sales (MHCVs)

SCVs to showcase marginal growth in FY16
33
• Small Commercial Vehicles expected to perform better on account on improvement in demand of
consumables reflected by improving PFCE
• Other segments of LCVs to continue its sluggishness
All quarterly sales figures are in ‘000s
Source: SIAM, IMaCS analysis
FY16 growth: 4.7% Small Commercial Vehicles
FY16 growth: 4.4% Other LCVs
91 91 90 88 71 81 80 77 81 81 80 81
-3%
-14%
-21%
-29%
-22%
-11% -12% -12%
15%
0.02% -0.1%
5%
Q1F
Y14
Q2F
Y14
Q3F
Y14
Q4F
Y14
Q1F
Y15
Q2F
Y15
Q3F
Y15
Q4F
Y15 E
Q1F
Y16 P
Q2F
Y16 P
Q3F
Y16 P
Q4F
Y16 P
Small Commercial Vehicles y-o-y growth
98 98 97 96 77 88 87 84 88 88 87 88
-4%
-15%
-22%
-29%
-21%
-11% -10% -12%
14%
0% 0%
5%
Q1F
Y14
Q2F
Y14
Q3F
Y14
Q4F
Y14
Q1F
Y15
Q2F
Y15
Q3F
Y15
Q4F
Y15 E
Q1F
Y16 P
Q2F
Y16 P
Q3F
Y16 P
Q4F
Y16 P
LCVs y-o-y growth

43 39 33 46 41 46 49 50 46 46 45 46
-18%
-37% -32%
-20%
-7%
16%
47%
10% 13%
0%
-9% -9%
Q1
FY
14
Q2
FY
14
Q3
FY
14
Q4
FY
14
Q1
FY
15
Q2
FY
15
Q3
FY
15
Q4
FY
15
E
Q1
FY
16
P
Q2
FY
16
P
Q3
FY
16
P
Q4
FY
16
P
13 10 9 10 8 9 10 9 8 8 8 8
-5%
-27%
-37% -40%
-36%
-12%
12%
-8%
-2%
-12%
-19%
-9%
Q1
FY
14
Q2
FY
14
Q3
FY
14
Q4
FY
14
Q1
FY
15
Q2
FY
15
Q3
FY
15
Q4
FY
15
E
Q1
FY
16
P
Q2
FY
16
P
Q3
FY
16
P
Q4
FY
16
P
MAVs to lead recovery; however buses to face
sluggishness on account of withdrawal of JNNURM
34 All quarterly sales figures are in ‘000s
Source: SIAM, IMaCS analysis
• Withdrawal of JnNURM scheme to impact the
bus segment significantly
• MHCVs expected to show strong recovery lead
by growth in MAVs
• ICVs would continue their downtrend owing to
loss of business to MCVs on account of better
cost economics
FY16 growth: (10.1%) ICV FY16 growth: (1.6%) MHCVs
FY16 growth: (11%) Buses
21 14 11 15 20 15 14 15 13 13 15 15
1%
-14%
0%
-12%
-5%
3%
37%
-3%
-32%
-10%
2% 2%
Q1
FY
14
Q2
FY
14
Q3
FY
14
Q4
FY
14
Q1
FY
15
Q2
FY
15
Q3
FY
15
Q4
FY
15
E
Q1
FY
16
P
Q2
FY
16
P
Q3
FY
16
P
Q4
FY
16
P

Three wheelers
35

0
20
40
60
80
100
120
140
160
Q1
FY
04
Q3
FY
04
Q1
FY
05
Q3
FY
05
Q1
FY
06
Q3
FY
06
Q1
FY
07
Q3
FY
07
Q1
FY
08
Q3
FY
08
Q1
FY
09
Q3
FY
09
Q1
FY
10
Q3
FY
10
Q1
FY
11
Q3
FY
11
Q1
FY
12
Q3
FY
12
Q1
FY
13
Q3
FY
13
Q1
FY
14
Q3
FY
14
Q1
FY
15
Q3
FY
15
Un
its
(in
00
0s)
3W Passengers
0
5
10
15
20
25
30
35
40
45
50
Q1
FY
04
Q3
FY
04
Q1
FY
05
Q3
FY
05
Q1
FY
06
Q3
FY
06
Q1
FY
07
Q3
FY
07
Q1
FY
08
Q3
FY
08
Q1
FY
09
Q3
FY
09
Q1
FY
10
Q3
FY
10
Q1
FY
11
Q3
FY
11
Q1
FY
12
Q3
FY
12
Q1
FY
13
Q3
FY
13
Q1
FY
14
Q3
FY
14
Q1
FY
15
Q3
FY
15
Un
its
(in
00
0s)
3W Goods
Growth driven by 3 wheeler passengers
36
• Since the launch of Tata Ace in May 2005, 3 wheeler goods have showed continuous deceleration in
growth and from Q3FY10 they have been range bound
• Growth in 3 wheelers is on account of growth in the passenger segment. Current fiscal has seen strong
growth on account of additional rickshaw permits being issued by several state governments
• 3 Wheeler passenger continues to remain a highly regulatory driven segment
FY12-FY14 = (5.9%)
q-o-q (last 8 quarters) = 1.0%
Variation = 8.9% (last 8 quarters)
FY12-FY14 = (2.7%)
q-o-q (last 8 quarters) = 0.04%
Variation = 14.7% (last 8 quarters)
Source: SIAM, IMaCS analysis

Demand drivers
37
Economic
• GDP (Q)
• Index of Industrial Production (IIP)
• Excise Rate
• Interest rates
• Fuel prices
•Growth in Private Final Consumption Expenditure
(PFCE)
•WPI – Auto-parts index
Industrial • Inventory
•New launches
Other factors
• Substitution from Small Commercial Vehicles

Zero order correlation matrix – Illustrative – 3 wheeler
passenger segment
38
3 wheeler
Goods
3 wheeler
Passenge
rs Fuel Price IIP PFCE
Interest
rates
GDP at
factor cost
Correlations
Pearson
Correlatio
n
-.584**
.948**
.883**
.912** 1 -.008 .979
**
Sig. (2-
tailed)
.000 .000 .000 .000 .960 .000
N 37 37 37 37 37 37 37
PFCE
Pearson
Correlatio-.559
**.942
**.880
**.923
**.979
** -.093 1
Sig. (2-
tailed)
.000 .000 .000 .000 .000 .556
N 37 37 39 39 37 42 42
GDP at
factor cost
(Q)
Pearson
Correlatio
n
-.495** 1 .851
**.866
**.948
** .041 .942**
Sig. (2-
tailed)
.002 .000 .000 .000 .809 .000
N 37 37 37 37 37 37 37
3 wheeler
passenge
rs
**. Correlation is significant at the 0.01 level (2-tailed).

Functional Form & Related Statistics – 3 wheeler passenger
segment Elasticity Model
39
R R Square
Adjusted
R Square
Std. Error
of the
Estimate
1 .942a .888 .882 .11957
Model Summary
Model
a. Predictors: (Constant), LNGDP, LNPFCE
Standardiz
ed
Coefficient
s
B Std. Error Beta
(Constant) -10.970 1.288 -8.515 .000
LNPFCE 1.521 .288 .869 5.276 .000
LNGDP .118 .249 .078 .473 .639
1
a. Dependent Variable: LN3WP
Coefficientsa
Model
Unstandardized
Coefficients
t Sig.
Causal model explains upto 89%
variability….. NOT good enough !
Ln (3WP sales) = -10.970+1.521*Ln
PFCE+0.118*LnGDP

Revised forecast chart post time series correction –Q1
FY14 to Q3 FY15
40
Q1F
Y07
Q3F
Y07
Q1F
Y08
Q3F
Y08
Q1F
Y09
Q3
FY
09
Q1F
Y10
Q3F
Y10
Q1F
Y11
Q3F
Y11
Q1F
Y12
Q3F
Y12
Q1
FY
13
Q3F
Y13
Q1F
Y14
Q3F
Y14
Q1F
Y15
3W passenger actual sales 3W passenger model sales
Source: SIAM, IMaCS analysis
3W
passenger
actual sales
3W
passenger
model sales
Q1FY13 89467 98333
Q2FY13 115433 117920
Q3FY13 125817 118169
Q4FY13 110401 110809
Q1FY14 87304 95113
Q2FY14 109353 98910
Q3FY14 99735 106979
Q4FY14 88531 119369
Q1FY15 98844 110521
Q2FY15 136059 127968
Q3FY15 107444 96832
- Causal and time series adjustment has reduced the error rates significantly
- The present estimates does NOT take into account module 3 adjustments – Expected
to reduce error rates significantly

3 wheeler goods would continue to remain sluggish while passenger
3W sales would decline owing to higher base ( unless exogenous
impetus – e.g. new licenses issued)
41
• 3 wheeler passenger to record marginal deceleration in growth on account of higher base of FY15
• Majority of 3 wheeler goods demand would again come only from the replacement segment as it
would continue to face stiff competition from Small Commercial Vehicles
• Another round of release of permits could lead to a reversal in deceleration of 3 wheeler
passengers growth
All quarterly sales figures are in ‘000s
Source: SIAM, IMaCS analysis
FY16 growth: (0.4%) 3 Wheeler Goods FY16 growth: (4.0%) 3 wheeler passengers
21
22
25
26
22
25
26
23
24
25
24
24
-2%
-9%
-2%
3% 6%
15%
4%
-14%
5%
-2%
-9%
5%
Q1
FY
14
Q2
FY
14
Q3
FY
14
Q4
FY
14
Q1
FY
15
Q2
FY
15
Q3
FY
15
Q4F
Y1
5 E
Q1F
Y1
6 P
Q2F
Y1
6 P
Q3F
Y1
6 P
Q4F
Y1
6 P
3W Goods y-o-y growth
87
109
100
89
99
136
107
101
104
108
107
105
-2% -5%
-21% -20%
13%
24%
8%
14%
6%
-20%
0% 5%
Q1
FY
14
Q2
FY
14
Q3
FY
14
Q4
FY
14
Q1
FY
15
Q2
FY
15
Q3
FY
15
Q4F
Y1
5 E
Q1F
Y1
6 P
Q2F
Y1
6 P
Q3F
Y1
6 P
Q4F
Y1
6 P
3W Passengers y-o-y growth

Discussions
42