Embed Size (px)
Citation preview

SOCIETY OF ACTUARIESSOCIETY OF ACTUARIES
Executive Compensation Plans:
United States and Canadian Perspectives
Compensation Theory and U.S. Practice
October 4, 2001
Executive Compensation Plans:
United States and Canadian Perspectives
Compensation Theory and U.S. Practice
October 4, 2001
Daniel J. RyterbandManaging DirectorFrederic W. Cook & Co., Inc.
2
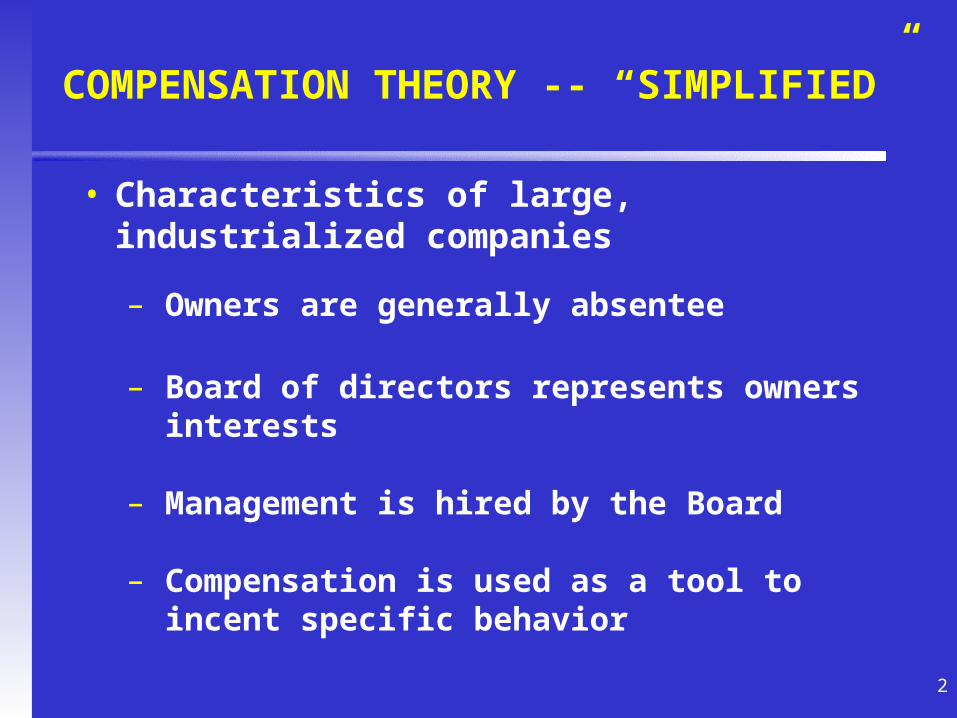
COMPENSATION THEORY -- “SIMPLIFIED”
• Characteristics of large, industrialized companies
– Owners are generally absentee
– Board of directors represents owners interests
– Management is hired by the Board
– Compensation is used as a tool to incent specific behavior

3
COMPENSATION THEORY -- “SIMPLIFIED” (cont’d.)
• Role of compensation -- unite human capital with financial capital to create value
– Owners provide financial capital, but not necessarily management skills
– Employees provide management skill, but not necessarily financial capital

4
• Compensation objectives
– Attract
– Retain
– Motivate
All compensation elements support these objectives, although to different degrees
COMPENSATION THEORY -- “SIMPLIFIED” (cont’d.)

5
COMPENSATION THEORY -- “SIMPLIFIED” (cont’d.)
Element Rationale
Salary Provide for basic living expenses Entitlement for meeting minimum performance standards
Annual Bonus Focus attention on short-term strategic and financialobjectives
Vary reward commensurate with ability to pay and short-term performance
Long-Term Incentives Focus attention on multi-year strategic and financialobjectives
Vary reward commensurate with shareholder valuecreation
Create commonality of interests between owners andemployees
Discourage excessive short-term risk taking
Benefits Protect against unexpected financial hardship Enable employees to gracefully leave workforce Capitalize on cost-efficiencies provided through tax
incentives/volume discounts

6
1. What is an appropriate level of compensation?
- Market pressures - Experience and skillset
- Size and scope of job - Criticality of position
2. How should total compensation be allocated among various elements?
- Riskiness; pay/performance relationship
- Dependence on stock price
3. What performance measures are most appropriate?
- Financial (e.g., EPS, TSR, cash flow, revenue growth)
- Strategic (e.g., market penetration, customer service, safety)
4. How should performance be measured?
- Absolute vs. relative - Internal vs. external
Bottom Line: Ensure compensation program supports fundamental objective of maximizing shareholder value
COMPENSATION THEORY -- DEVELOPMENT OF A STRATEGY

7
BASE COMPENSATION
Median Compensation Rates(1) Position 2000 1990 % Change CAGR
CEO $1,175,000 $800,000 46.9% 3.92%COO 743,000 530,000 40.2% 3.44%CFO 465,000 350,000 32.9% 2.88%Top HR 375,000 237,500 57.9% 4.67%Group VP(2) 513,000 383,400 33.8% 2.95%Group VP(3) 412,000 305,000 35.1% 3.05%
_______________(1) Source: 2000 and 1990 Group 25 Compensation Survey (39 organizations, median 2000
revenue of $20.4 billion)(2) Over $4 Billion revenue in 2000, $2 Billion in 1990(3) Under $4 Billion revenue in 2000, $2 Billion in 1990

8
BASE COMPENSATION (cont’d.)
• Observations
1. Executive salary growth rates have trailed levels implied by media
2. Government interaction has not prevented growth in salaries
3. Growth rates generally reflect change in perceived importance of position

9
ANNUAL INCENTIVE DESIGN
• All successful bonus plans share common characteristics:
1. Performance metrics are tied to critical success factors
2. Metrics are controllable by participants
3. There is careful calibration between targets and payout levels
– Reasonably achievable goals
– Perceived as fair by participants

10
ANNUAL INCENTIVE DESIGN (cont’d.)
• Two basic design approaches:
1. Target goal setting -- awards determined based on achievement of predetermined goals
– May or may not be budget-based
– May include both financial and non-financial goals
2. Formulaic approach -- pool of awards determined based on a prescribed formula relating to financial results
11
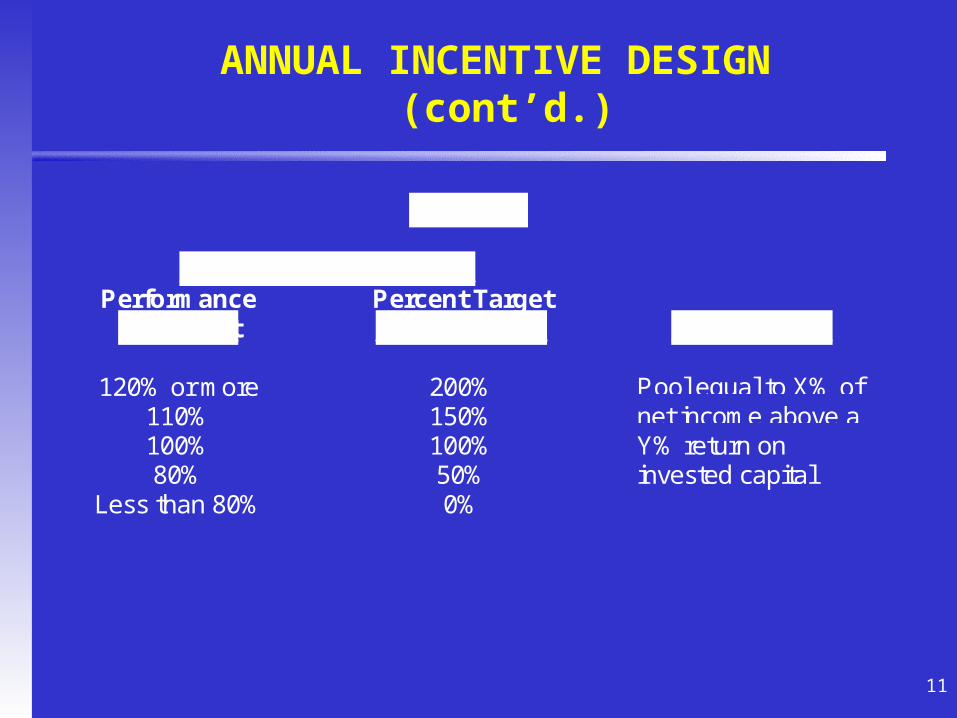
ANNUAL INCENTIVE DESIGN (cont’d.)
Examples
Target Goal Setting Plan Performance Percent Target
vs. Target Award Earned Formula Plan
120% or more 200% Pool equal to X% of110% 150% net income above a100% 100% Y% return on80% 50% invested capital
Less than 80% 0%

12
Factors to consider in selecting basic approach
1. Need to focus on specific, defined goals
2. Cyclicality of the business environment
3. Difficulty of setting specific targets at corporate and business unit levels
4. Integrity of the budget-setting process
5. Degree to which cost should be headcount driven
6. Degree to which company wants to “manage” size of payout
ANNUAL INCENTIVE DESIGN (cont’d.)

13
ANNUAL INCENTIVE DESIGN(cont’d.)
Target Bonus as % Salary(1) Implied MedianPosition 25th Percentile Median 75th Percentile Annual Cash(2)
CEO 100% 100% 125% $2,350,000COO 75% 85% 100% 1,375,000CFO 62% 72% 90% 800,000Top HR 55% 65% 87% 619,000Group VP(3) 65% 72% 95% 882,000Group VP(4) 55% 62% 71% 667,000
_______________(1) Source: Year 2000 Group 25 Compensation Survey(2) Based on median salary and median bonus for position(3) Over $4 Billion in revenue(4) Under $4 Billion in revenue

14
ANNUAL INCENTIVE DESIGN (cont’d.)
• Most common performance metrics
1. Earnings per share
2. Net income
3. Return on equity
4. Revenue
• Typical salary of lowest paid participant - $70,000 to $80,000

15
PRIMARY LONG-TERM INCENTIVEAPPROACHES
• Stock options - provides the right to purchase a prescribed number of shares at a fixed price for a specified period of time
– Value is contingent on share price appreciation
• Restricted stock - a grant of full-value stock in which receipt is generally contingent on meeting a service requirement

16
PRIMARY LONG-TERM INCENTIVE APPROACHES (cont’d.)
• Performance shares - restricted stock in which the number of shares that vest is contingent on meeting both a service requirement and achievement of prescribed performance goals
– Earn-out based on both stock price change during cycle and shares earned
– The performance cycle is typically 3 years
– Cycles can be end-to-end or overlapping
– Performance metrics are typically financial• Can be absolute or relative

17
PRIMARY LONG-TERM INCENTIVE APPROACHES (cont’d.)
• Performance units - cash bonus award structured similarly to performance shares
Prevalence ofVarious Award Types*
Stock Options 99%Restricted Stock 56%Performance Shares 32%Performance Units 17%
_______________* Based on 2000 Frederic W. Cook & Co. Top 250 Study

18
PRIMARY LONG-TERM INCENTIVE APPROACHES (cont’d.)
Annualized Grant Date Implied MedianPresent Value of Long-Term Compensation(1) Total Direct
Position 25th Percentile Median 75th Percentile Compensation(2)
CEO $5.3 million $8.4 million $12.8 million $10.75 millionCOO 1.9 5.4 7.2 6.77CFO 1.1 1.6 3.1 2.38Top HR 0.5 1.0 2.0 1.62Group VP(3) 1.1 1.7 2.9 2.58Group VP(4) 0.7 1.1 1.8 1.77
_______________(1) Source: 2000 Group 25 Compensation Survey(2) Based on implied median annual cash plus median LTI(3) Over $4 Billion in revenue(4) Under $4 Billion in revenue

19
STOCK OPTIONS - TWO BASIC TYPES
• Nonqualified stock options - used by most large, mature companies
– Provides company with favorable tax/accounting treatment
• Incentive stock options - used more commonly by less mature companies
– Common among start-ups, pre-IPO companies and those that have not yet reached profitability
• Provides favorable accounting treatment to Company and favorable tax treatment to employee
» Favorable tax treatment to employee comes at expense of tax benefit to company
20
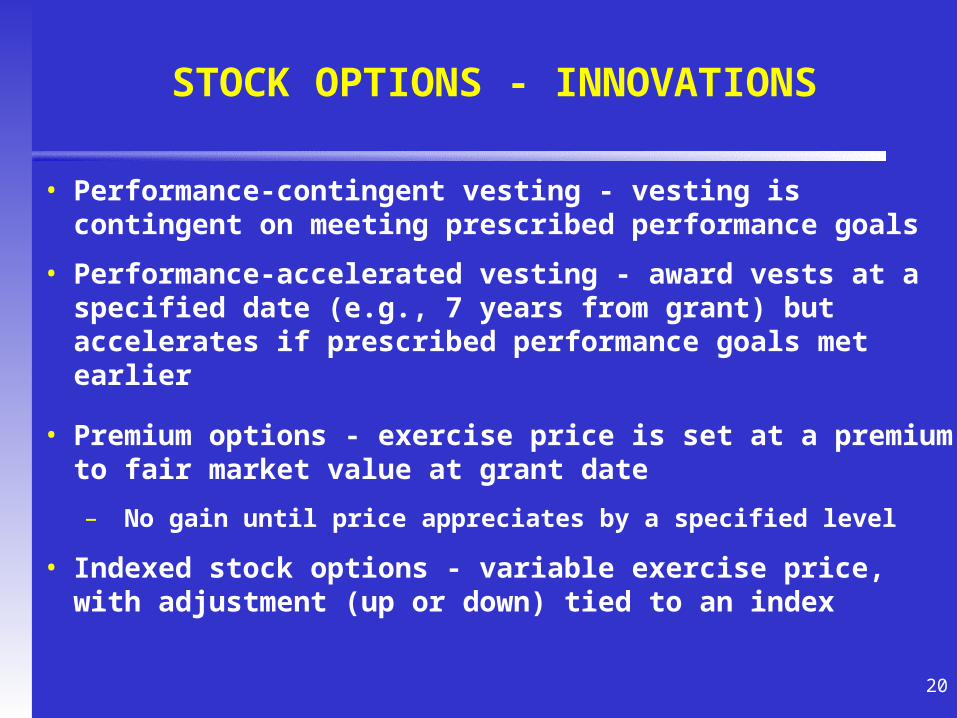
STOCK OPTIONS - INNOVATIONS
• Performance-contingent vesting - vesting is contingent on meeting prescribed performance goals
• Performance-accelerated vesting - award vests at a specified date (e.g., 7 years from grant) but accelerates if prescribed performance goals met earlier
• Premium options - exercise price is set at a premium to fair market value at grant date
– No gain until price appreciates by a specified level
• Indexed stock options - variable exercise price, with adjustment (up or down) tied to an index

21
STOCK OPTIONS - INNOVATIONS(cont’d.)
• Reload stock options - upon exercise of the original option by paying the exercise price in the form of already owned shares, a new grant is made automatically
– Number of reload shares exactly equal to number of shares tendered to pay exercise price on original grant
– Exercise price of reload grant equal to FMV on date original award exercised
– Term of reload equal to remaining term on original grant
22
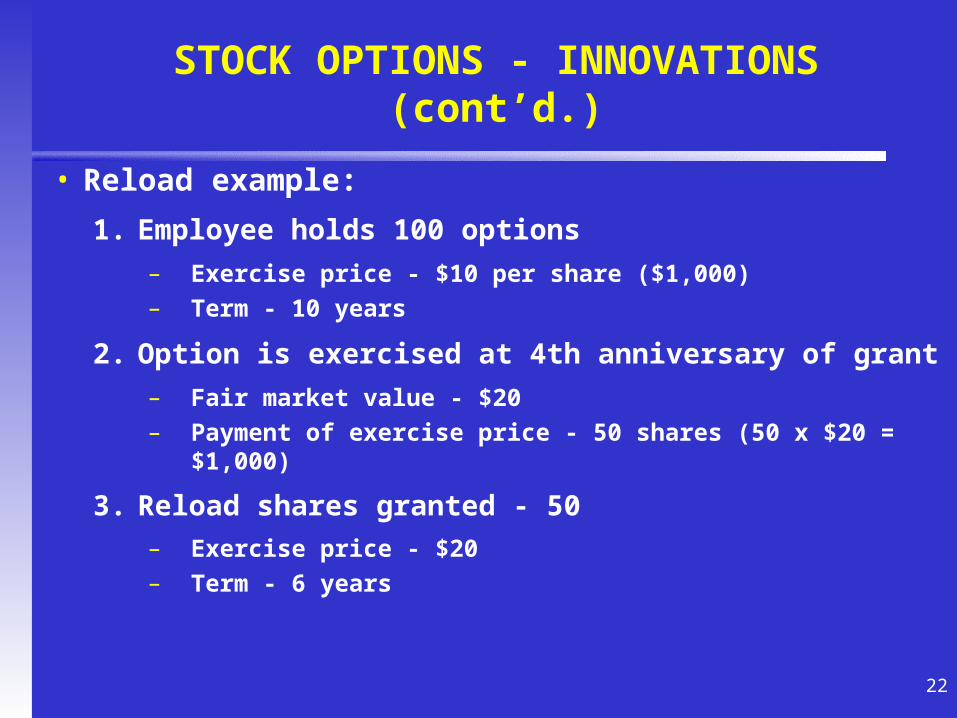
STOCK OPTIONS - INNOVATIONS(cont’d.)
• Reload example:
1. Employee holds 100 options
– Exercise price - $10 per share ($1,000) – Term - 10 years
2. Option is exercised at 4th anniversary of grant
– Fair market value - $20– Payment of exercise price - 50 shares (50 x $20 = $1,000)
3. Reload shares granted - 50
– Exercise price - $20– Term - 6 years

23
STOCK OPTIONS - INNOVATIONS(cont’d.)
• Reload Implications (Primary Benefits)
– No EPS dilution, assuming share price remains stable or appreciates after reload award triggered
Employee Company
Reduced downside risk Dividend and voting rights Capital gains taxation
Accelerated tax deduction Lower overhang Enhanced management ownership

24
STOCK OPTIONS - INNOVATIONS(cont’d.)
Prevalence of Stock Option Variations*
Performance-contingent vesting 5%Performance-accelerated vesting 14%Premium options 9%Indexed stock options <1%Reload stock options 18%_______________* Based on 2000 Frederic W. Cook & Co. Top 250 Study

25
ACCOUNTING FOR EQUITY-BASED INCENTIVES
• Two primary accounting standards
1. APB Opinion 25 - intrinsic value accounting
2. FAS 123 - fair value accounting
• Companies permitted to choose between the standards
– Virtually all companies have elected to use Opinion 25
– FAS 123 requires footnote disclosure in annual financial statements

26
ACCOUNTING FOR EQUITY-BASED INCENTIVES (cont’d.)
• Fundamentals of Opinion 25
– Expense equals the intrinsic value of an award on the measurement date
– A measurement date occurs when each of two factors are known:
1. Number of shares the grantee is entitled to receive
2. The price the grantee must pay for the shares

27
ACCOUNTING FOR EQUITY-BASED INCENTIVES (cont’d.)
– Factors that postpone the measurement date result in “variable” accounting
• For example, variability in exercise price of an option, variability in number of performance shares to be earned
• Exception for vesting based purely on continued service

28
ACCOUNTING FOR EQUITY-BASED INCENTIVES (cont’d.)
• General measure of expense under Opinion 25
Award Type Expense
Stock Option (standard vesting,performance accelerated vesting)
Option profit at grant
Stock Option (indexed,performance-contingent vesting)
Option profit at measurementdate
Restricted Stock Value of shares at grant date
Performance Shares Value of shares at payout date

29
ACCOUNTING FOR EQUITY-BASED INCENTIVES (cont’d.)
• FAS 123 compensation expense
– Fair value of award at measurement date
– Fair value determined using an option pricing model (e.g., Black-Scholes)
– Expense generally recognized over vesting period for employee awards

30
TAX TREATMENT - A BASIC OVERVIEW
Award Employee Employer
Incentive Stock Options Assuming minimum holding requirements met(2 years from grant and 1 year after exercise),option gain plus subsequent appreciationtaxed as capital gain upon sale of acquiredstock and no FICA/FUTA tax due. Optionprofit possibly taxable under AMT
No deduction unless disqualifyingdisposition occurs
Nonqualified StockOptions
Option profit taxable as ordinary income uponexercise; FICA and FUTA apply
Deduction equal to amount ofordinary income recognized byemployee*
Restricted Stock Value of shares at vesting taxable as ordinaryincome, unless Section 83(b) election made(ordinary income at grant, capital gain at sale);FICA and FUTA apply
Deduction equal to amount ofordinary income recognized byemployee*
PerformanceShares/Units
Value of award at vesting taxable as ordinaryincome; FICA and FUTA apply
Deduction equal to amount ofordinary income recognized byemployee*
____________* Assuming amounts deductible under Sections 162(m) of Internal Revenue Code

31
TAX TREATMENT - A BASIC OVERVIEW (cont’d.)
• Section 162(m)
– Limits the allowable deduction for proxy named executives to $1 million per year per executive
– Exception for “performance-based” compensation:
• Granted pursuant to a plan in which material terms are shareholder-approved
• Size of the award must fall within an individual limit specified in the plan
• Plan must be administered by a committee composed solely of 2 or more outside directors

32
PROXY STATEMENT DISCLOSURE RULES
• The SEC requires publicly-traded U.S. companies to disclose compensation paid for the prior fiscal year
– CEO and each of the 2nd through 5th highest paid executives
• Named executive officers, or NEOs
• There are 3 inter-related components:
1. Narrative description of policies, philosophy, and issues that influence compensation decisions

33
PROXY STATEMENT DISCLOSURE RULES (cont’d.)
2. Overview of pay amounts in the “Summary Compensation Table” for NEOs
3. All other tables and descriptions
• Summary Compensation Table:
– Salary and bonus paid, including deferred amounts
– Other annual compensation, including perquisites (in excess of $50,000 or 10% of base and bonus), dividends on LTIP awards (excluding R.S.), “above-market” deferred interest, tax reimbursement or gross-up payments, and discounts on purchases of company stock

34
PROXY STATEMENT DISCLOSURE RULES (cont’d.)
– Grant value of restricted stock
– Number of option shares or stock appreciation rights
– Value of LTIP awards earned
– Value of “All Other Compensation,” including split-dollar life insurance and allocations under DC retirement plans

35
PROXY STATEMENT DISCLOSURE RULES (cont’d.)
• Other tables/descriptions include:
– Option/SAR grant table - lists options or SARs granted, exercise price, expiration date, hypothetical “value”
• Value estimated based on either Black-Scholes Model or projection over term at 5% and 10% appreciation rates
– Option exercise table - lists shares covered by exercises, gain at exercise date, number of exercisable and unexercisable outstanding options, intrinsic value of exercisable and unexercisable outstanding options
36
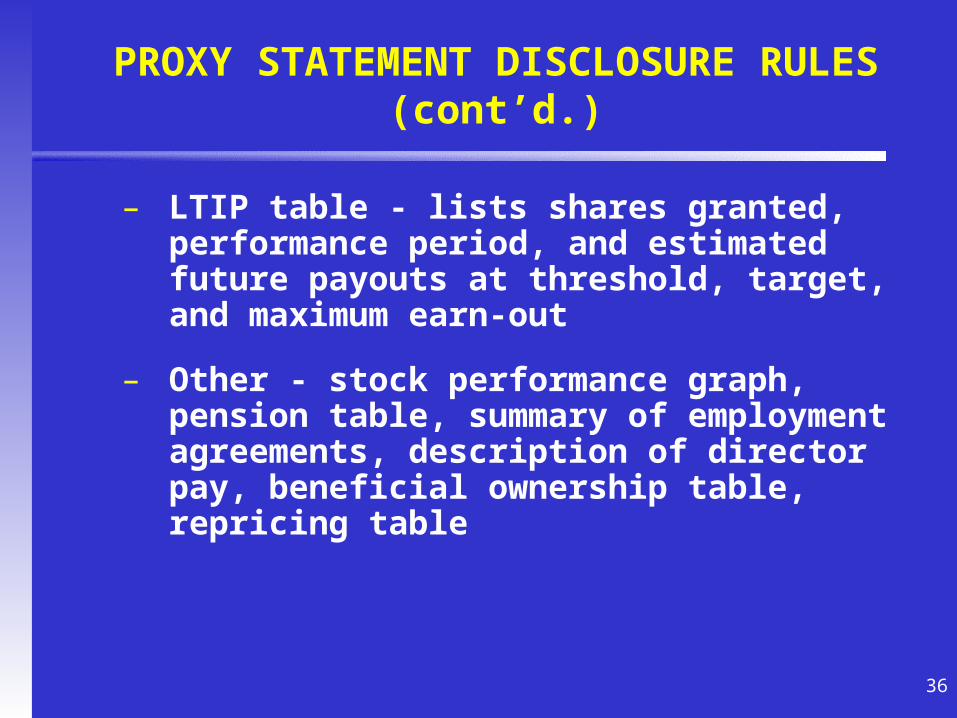
PROXY STATEMENT DISCLOSURE RULES (cont’d.)
– LTIP table - lists shares granted, performance period, and estimated future payouts at threshold, target, and maximum earn-out
– Other - stock performance graph, pension table, summary of employment agreements, description of director pay, beneficial ownership table, repricing table

37
COMPENSATION TRENDS
• The Drivers
– Revolution in communication and medical technology
– Emergence of the “New Economy”
• Increased productivity
• High growth with low inflation
• Abundant capital
• Favorable stock market conditions
– Economic slowdown and Nasdaq “correction”

38
COMPENSATION TRENDS (cont’d.)
• The Results
– Leaner organizations with higher performance-based pay
– Shareholder-value strategic focus
– Explosion in equity-pay component
• Many different forms
• Bigger values and more participants
• Higher share usage and dilution
– Increased shareholder scrutiny

39
HOT TOPICS
1. Stock Option Dilution
2. Underwater Options
3. Use of Non-Shareholder Approved Equity Plans
4. Pay for Performance Linkage
5. Stock Ownership
6. Continuing Accounting Debate

40
STOCK OPTION DILUTION
• Ways to measure dilution
1. Run rate
–Annual options granted as a percent of
outstanding
2. Overhang (diluted basis)
–Potential share dilution attributable to outstanding
options
A , where A equals outstanding options and B
A + B equals outstanding shares
-- Example: 100 outstanding shares and 10 options equals 9.1% {10/(10 + 100)}

41
STOCK OPTION DILUTION (cont’d.)
3. EPS dilution
– Difference between diluted and basic EPS
– Diluted shares outstanding include equivalent shares attributable to options
• “Net shares added” calculated under Treasury stock method
» Assumes all outstanding options are exercised and proceeds are used by company to repurchase portion of shares issued
» Proceeds equal to exercise price plus tax benefit

42
STOCK OPTION DILUTION (cont’d.)
• Financial impact of dilution on shareholders
– Reflected in diluted EPS, which translates into lower share price
– Stock price = diluted EPS x P/E ratio
• Additional options create incremental EPS dilution
• Investor concerns
– Focus is primarily on overhang, rather than EPS dilution
43
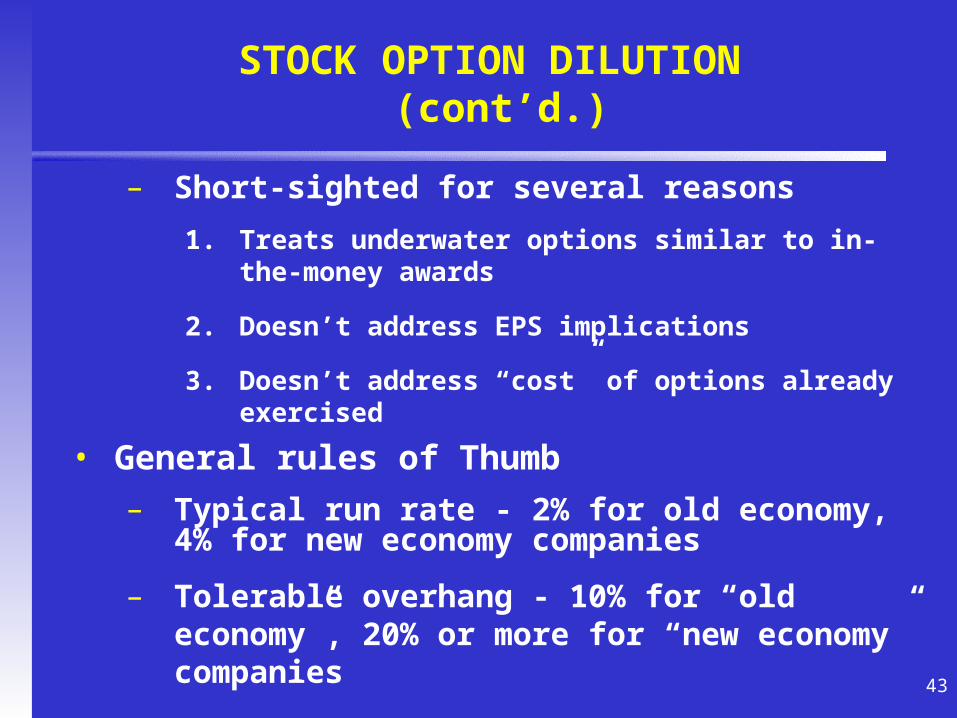
STOCK OPTION DILUTION (cont’d.)
– Short-sighted for several reasons
1. Treats underwater options similar to in-the-money awards
2. Doesn’t address EPS implications
3. Doesn’t address “cost” of options already exercised
• General rules of Thumb
– Typical run rate - 2% for old economy, 4% for new economy companies
– Tolerable overhang - 10% for “old economy”, 20% or more for “new economy” companies

44
STOCK OPTION DILUTION (cont’d)
• Growth in run rate and overhang has been substantial
Median Levels*
1999 1989
Run Rate 2.07% 1.05%
Overhang** 13.07% 6.90%
* Source: Pearl Meyer & Partners “1999 Equity Stake”
** Includes awards outstanding plus shares reserved for future grant
45
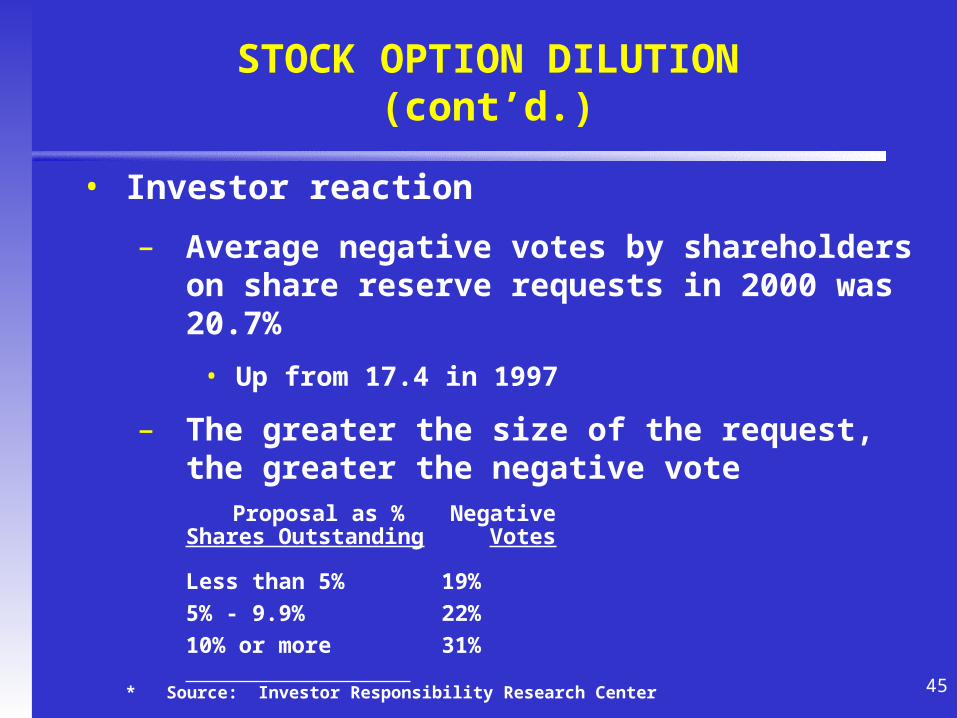
STOCK OPTION DILUTION(cont’d.)
• Investor reaction
– Average negative votes by shareholders on share reserve requests in 2000 was 20.7%
• Up from 17.4 in 1997
– The greater the size of the request, the greater the negative vote
Proposal as % NegativeShares Outstanding Votes
Less than 5% 19%
5% - 9.9% 22%
10% or more 31%
* Source: Investor Responsibility Research Center

46
UNDERWATER OPTIONS
• 1990’s bull market ended in March 2000
High Current Percent Change(10/19/01)
Nasdaq 5,049 1,528 -70%
S&P 500 1,527 1,015 -34%
DJIA 11,723 8,727 -26%
• Underwater options complications
– Reduces retention/performance incentive
– Encourages overly risky behavior
– Fosters build-up of excessive overhang

47
UNDERWATER OPTIONS (cont’d.)
• Traditional Solution - “reprice”
– Cancel and reissue, or reset exercise price
– New accounting rules result in variable expense for “repriced” options
• Alternatives for dealing with underwater options
1. Do nothing - stay the course; long-term focus

48
UNDERWATER OPTIONS(cont’d.)
2. Accelerate next year’s grant
– Takes advantage of depressed price
– May backfire if share price falls further
3. Extra, on-top grant
– Takes advantage of depressed price
– Increases overhang (can use short term to minimize) and EPS dilution
4. Selective restrictive share grants
– Restores retention/incentive value
– Creates P&L charge
49
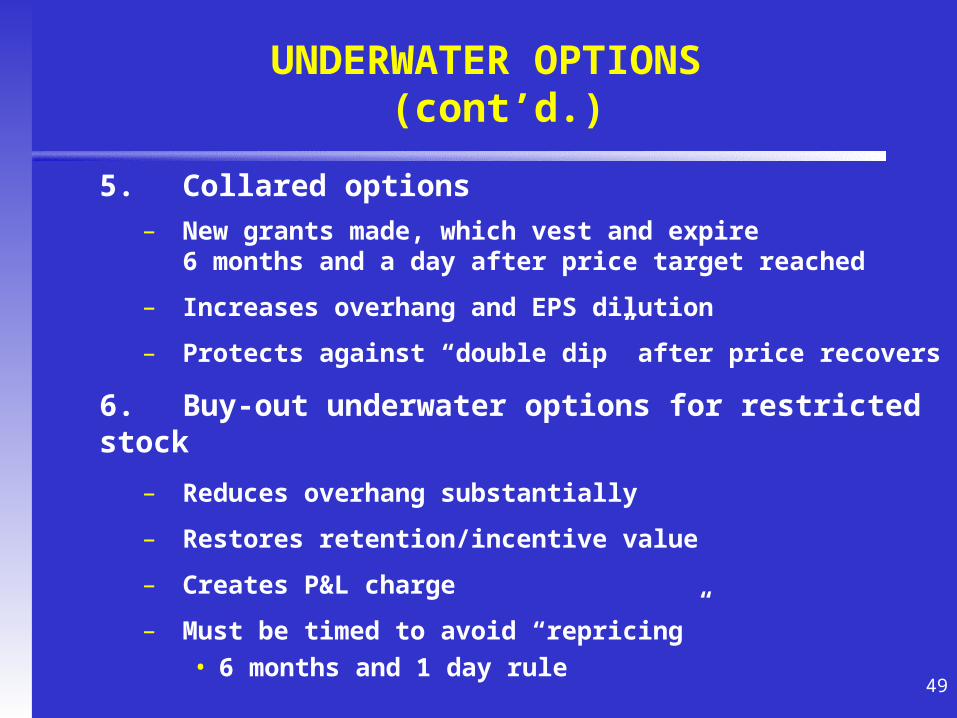
UNDERWATER OPTIONS (cont’d.)
5. Collared options
– New grants made, which vest and expire6 months and a day after price target reached
– Increases overhang and EPS dilution
– Protects against “double dip” after price recovers
6. Buy-out underwater options for restricted stock
– Reduces overhang substantially
– Restores retention/incentive value
– Creates P&L charge
– Must be timed to avoid “repricing” • 6 months and 1 day rule

50
UNDERWATER OPTIONS (cont’d)
7. Cancel now, regrant later
– Employees surrender options now in exchange for promise to grant new awards later
– Reduces overhang if exchange ratio based on economic equivalency
– Creates perverse incentive during waiting period
– Must be timed to avoid “repricing”
• 6 months and 1 day rule

51
USE OF NON-SHAREHOLDER APPROVED EQUITY PLANS
• Why get shareholder approval?
– Tax deductibility under Section 162(m)
– State law requirements
– Exchange/market-based rules
– Statutory requirements - ISOs, Section 423 plans
– Corporate governance

52
• Exchange-based rules - Nasdaq and New York Stock Exchange
– Generally require shareholder approval of plans/arrangements in which officers/directors may acquire stock
– Exceptions include:
• “Broadly based” plans
• New hire awards
• Grants made from treasury stock (NYSE only)
• Other limited arrangements
USE OF NON-SHAREHOLDER APPROVED EQUITY PLANS (cont’d.)

53
• What is “broadly based”
– Nasdaq - no specific definition
– New York Stock Exchange
1. Majority of full-time, exempt U.S. staff eligible
2. Majority of awards to non-officers/directors
• Use of broadly-based plans has increased as a result of:
– Difficulty in receiving shareholder approval for increased share authorization
– Increased lower level employee participation
USE OF NON-SHAREHOLDER APPROVED EQUITY PLANS (cont’d.)
54
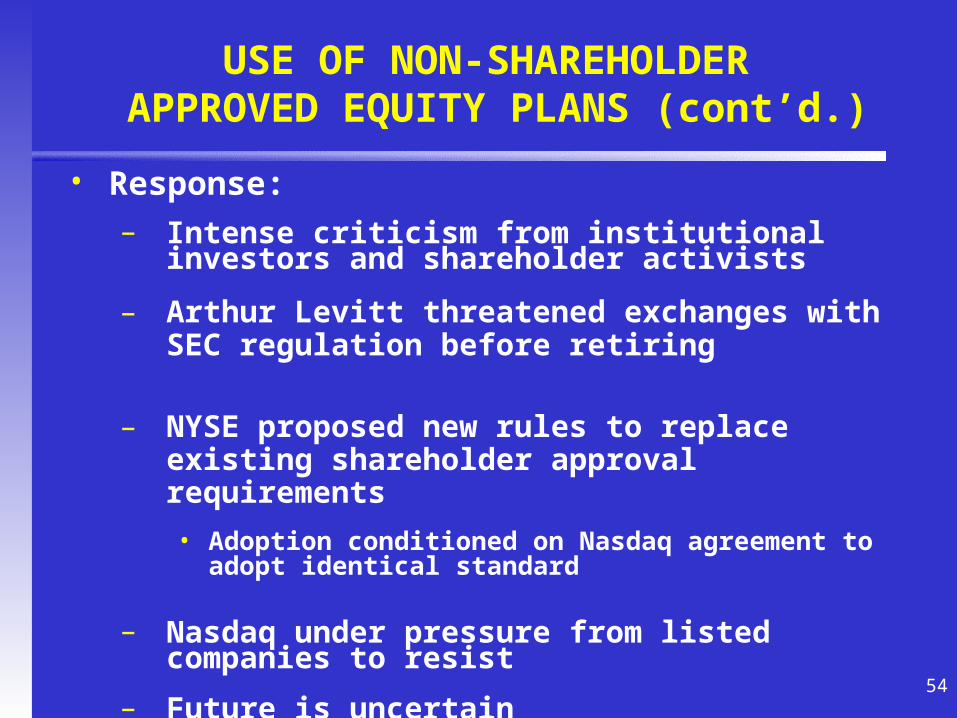
• Response:
– Intense criticism from institutional investors and shareholder activists
– Arthur Levitt threatened exchanges with SEC regulation before retiring
– NYSE proposed new rules to replace existing shareholder approval requirements
• Adoption conditioned on Nasdaq agreement to adopt identical standard
– Nasdaq under pressure from listed companies to resist
– Future is uncertain
USE OF NON-SHAREHOLDER APPROVED EQUITY PLANS (cont’d.)

55
PAY FOR PERFORMANCE LINKAGE
• Media and other critics focus on:
– Extraordinary events/specific companies
– Option gains, which may represent years of stock price appreciation
– Payment for failure (e.g., severance)
• Not truly compensation
• More like an insurance policy for executives

56
PAY FOR PERFORMANCE LINKAGE(cont’d.)
• Tolerance/patience for underperformance is extremely limited
– CEO job security has never been lower
– Market reaction to short-term earnings shortfall is extreme
• Recessionary conditions testing the pay-for-performance standard in 2001
– Many companies have already announced no bonus
• Emphasis on stock options directly ties CEO compensation to shareholder value creation

57
PAY FOR PERFORMANCE LINKAGE(cont’d.)
CEO Pay versus Company Performance -
An Alternative Method of Valuing Stock Options
($ Millions)
Stock Option Value
Business F.W. Total
Long-Term Week - Cook - Total Shareholder
Salary Incentives Gain on Change Compensation Return
Plus Excluding Exercised in Option Business F.W. over Same
Name Company Bonus Options Options Value (1)
Week Cook Period
John Reed Citigroup $5.4 $0.0 $287.6 $26.9 $293.0 $32.3 23.5%
Sanford Weill Citigroup 19.9 8.7 196.2 162.9 224.9 191.5 23.5%
Gerald Levin AOL Time Warner 11.2 0.0 152.6 (80.3) 163.8 (69.1) -4.2%
John Chambers Cisco Systems 1.3 0.0 156.0 799.5 157.3 800.9 110.7%
Henry Silverman Cendant 7.6 0.0 129.1 (515.1) 136.7 (507.5) -63.8%
L. Dennis Kozlowski Tyco International 4.2 21.2 99.9 49.1 125.3 74.4 0.6%
Jack Welch General Electric 16.8 48.7 57.1 (37.7) 122.6 27.7 -6.0%
David Peterschmidt Inktomi 0.7 0.0 106.9 187.9 107.6 188.7 90.0%
Kevin Kalkhoven JDS Uniphase 0.7 0.0 106.2 1,185.9 106.9 1,186.7 477.7%
David Wetherell CMGI 1.2 0.0 102.5 (45.5) 103.7 (44.3) -17.8%
(1) Change in Option Value = Value of unexercised options at end of year plus Value of gains realized from options exercised during
the year minus Value of unexercised options at the start of the year

58
STOCK OWNERSHIP
• Market forces strongly encourage high levels of company ownership among senior executives
– Stock sales by leadership team are viewed as a “sell signal” by investors
– “Flipping” of stock is difficult to justify when executives are receiving “mega” option grants
• Among major U.S. companies, about 65% impose stock ownership requirements
59
STOCK OWNERSHIP (cont’d.)
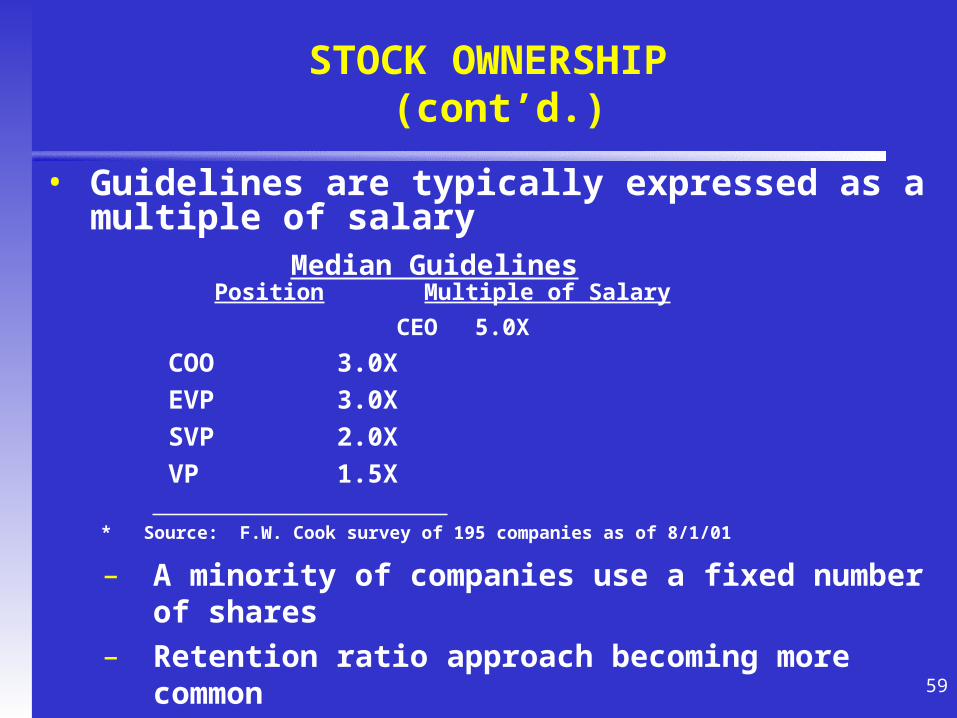
• Guidelines are typically expressed as a multiple of salary
Median Guidelines Position Multiple of Salary
CEO 5.0X
COO 3.0X
EVP 3.0X
SVP 2.0X
VP 1.5X
* Source: F.W. Cook survey of 195 companies as of 8/1/01
– A minority of companies use a fixed number of shares
– Retention ratio approach becoming more common
60
STOCK OWNERSHIP(cont’d)
• Guidelines have limitations
– Achievement of target suggests permission to sell
– Pursuit of target creates pressure for special grants/programs
– Failure to achieve target creates little consequence
61
STOCK OWNERSHIP (cont’d.)
• What is the right level of ownership?
– Academic studies have attempted to address issue
– Too much ownership makes management risk aware
– Too little ownership promotes conflict with shareholder interests
• Result: inconclusive
62
CONTINUING ACCOUNTING DEBATE
• Two primary issues
1. Interpretation of APB Opinion 25
2. Global accounting standard for stock options
• Interpretation of APB Opinion 25
– Financial Interpretation Number 44 released by FASB on 3/31/00, followed by EITF 00-23

63
CONTINUING ACCOUNTING DEBATE (cont’d.)
• Major implications (generally):
1. Opinion 25 applies only to employees and nonemployee Board members and only to stock compensation based on grantor company shares
• All other grants accounted for under FAS 123 as of vesting date
2. Repriced options subject to variable expense until exercised or forfeited

64
3. Share withholding in excess of minimum statutory rates results in variable accounting
4. Modifications to a vesting schedule result in a new measurement date
5. Direct or indirect extension of an option’s term results in a new measurement date
6. Company “call” rights and employee “put” rights permissible if repurchase occurs 6 months or more after option exercise
CONTINUING ACCOUNTING DEBATE (cont’d.)

65
7. Adding a reload feature results in variable accounting
8. Exhaustive list of additional complexity associated with special circumstances
9. Interpretation is ongoing . . .
• Reload stock options now under attack
• Global stock option accounting standard
– IASB currently reviewing development of a global standard
CONTINUING ACCOUNTING DEBATE (cont’d.)

66
– Likely direction is toward “fair value” approach
• Black-Scholes value measured as of grant date (or vest date) and recognized over vesting period
– Any proposal will be met with significant criticism
CONTINUING ACCOUNTING DEBATE (cont’d.)