Embed Size (px)
Citation preview

Society for the Study of Amphibians and Reptiles
Which Methods Are Most Effective for Surveying Rain Forest Herpetofauna?Author(s): Tiffany M. DoanSource: Journal of Herpetology, Vol. 37, No. 1 (Mar., 2003), pp. 72-81Published by: Society for the Study of Amphibians and ReptilesStable URL: http://www.jstor.org/stable/1565833 .Accessed: 17/01/2011 13:42
Your use of the JSTOR archive indicates your acceptance of JSTOR's Terms and Conditions of Use, available at .http://www.jstor.org/page/info/about/policies/terms.jsp. JSTOR's Terms and Conditions of Use provides, in part, that unlessyou have obtained prior permission, you may not download an entire issue of a journal or multiple copies of articles, and youmay use content in the JSTOR archive only for your personal, non-commercial use.
Please contact the publisher regarding any further use of this work. Publisher contact information may be obtained at .http://www.jstor.org/action/showPublisher?publisherCode=ssar. .
Each copy of any part of a JSTOR transmission must contain the same copyright notice that appears on the screen or printedpage of such transmission.
JSTOR is a not-for-profit service that helps scholars, researchers, and students discover, use, and build upon a wide range ofcontent in a trusted digital archive. We use information technology and tools to increase productivity and facilitate new formsof scholarship. For more information about JSTOR, please contact [email protected].
Society for the Study of Amphibians and Reptiles is collaborating with JSTOR to digitize, preserve and extendaccess to Journal of Herpetology.
http://www.jstor.org
Journal of Herpetology, Vol. 37, No. 1, pp. 72-81, 2003 Copyright 2003 Society for the Study of Amphibians and Reptiles
Which Methods Are Most Effective for Surveying Rain Forest Herpetofauna?
TIFFANY M. DOAN1
Department of Biology, University of Texas at Arlington, Box 19498, Arlington, Texas 76019-0498, USA
ABSTRACT.-Although several investigators have discussed different herpetofaunal sampling methodol- ogies and their effectiveness, few have quantitatively examined which methods are superior for inventorying reptiles and amphibians in rain forest habitats. I examined two years of data from Tambopata, southeastern Peru, to compare and contrast visual encounter survey (VES) and quadrat methodologies and to determine which method yields the highest number of individuals and species per sampling effort. Four separate questions were posed concerning the number of captures for short-term surveys, long-term surveys, arboreal versus terrestrial amphibian surveys, and particular taxonomic group surveys. Over most of the analyses, more individuals and species of amphibians and reptiles were captured using VES than quadrats. In addi- tion, more unique species were recorded with VES. However, particular microhabitats and taxonomic groups were better sampled with quadrats. In long-term surveys, the methods were equivalent with respect to number of individuals and species captured. This study provides quantitative data on the efficacy of the two methods and describes, for the first time, the particular instances in which the different methods are best suited for sampling rain forest herpetofauna.
Several researchers have discussed appropri- ate sampling methods for reptiles and amphib- ians (e.g., Campbell and Christman, 1982; Men- gak and Guynn, 1987; Pearman et al., 1995; Rodda et al., 2001), including the summary of amphibian sampling in Heyer et al. (1994). Ten standard methodologies were recommended in that volume (Heyer et al., 1994), with additional methods discussed there and in other works (e.g., Rodda et al., 2001). Although intended for amphibians, many of these techniques are also effective for surveying reptiles.
Few investigators have specifically discussed herpetofaunal sampling methods to be used in tropical rain forests (but see Heyer and Berven, 1973; Inger, 1980; Pearman et al., 1995). Rain for- ests challenge investigators because of the dense under- and overstory, low light conditions, ex- treme rainfall and humidity, and a generally un- comfortable environment for the observer (In- ger, 1980; Scott, 1994; Pearman et al., 1995). Some standard methods are difficult to imple- ment or are completely inappropriate for rain forest surveying. For example, because of the lack of roads in many rain forests, night driving may be impossible. Cover boards are often in- effective in rain forests because aboveground roots prevent cover boards from lying flat on the ground. In species-rich regions, audio strip transects and acoustic monitoring may be inef- fective because of the difficulty of identifying
1 Present address: Biology Department, Vassar Col- lege, Box 555, 124 Raymond Avenue, Poughkeepsie, New York 12604-0555, USA; E-mail: tiffperu@yahoo. com
species in large diverse choruses. Although drift fences with pitfall traps or funnel traps are like- ly effective, digging the trenches and holes needed for their installation in habitats with near-surface root networks requires a large in- put of time and effort that may render such techniques too time-intensive. Because of these limitations, the choice of methodology for a rain forest herpetofaunal survey is limited to a smaller number of methods.
Although many authors give advice on meth- ods for different types of data collection, few have presented quantitative data on the efficacy of the various methods implemented in a rain forest setting (but see Pearman et al., 1995). Herein, I statistically document the effectiveness of two standard methods: quadrats and visual encounter surveys (VES) for five rain forest sites in southeastern Peru. The aim of the study is to determine which method produces more am- phibian and reptile records per unit of effort. Both methodologies were used because the two methods are reported to target different species. Small frogs and leaf litter lizards should be most readily detected with quadrats, whereas faster moving lizards, most snakes, and arboreal frogs should be recorded more often with VES (Crump and Scott, 1994; pers. obs.). An inten- sive two-year sampling regime provides a quan- titative assessment of the two methods.
MATERIALS AND METHODS
Physical Setting.-The data were collected during Proyecto Tambopata, a two-year inves- tigation of the effects of tourism on a rain forest herpetofauna (Doan and Arizabal, 2000). Five

RAIN FOREST SAMPLING METHODS
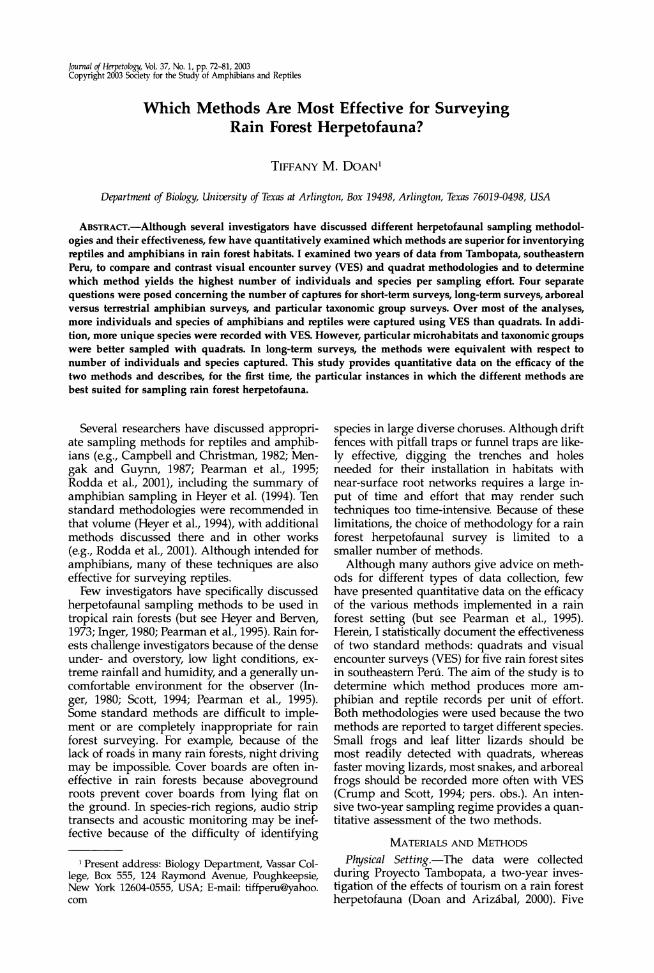
FIG. 1. Map of Madre de Dios Department, southeastern Peru, showing the Tambopata Province and five study localities. EA = EcoAmazonia, CA = Cusco Amaz6nico, El = Explorer's Inn, SC = Sachavacayoc Centre, TRC = Tambopata Research Center.
rain forest sites in Tambopata Province, south- eastern Peru, were sampled intensively to ex- amine community and population structure. The five sites are located near the town of Puerto Maldonado, the capital of the Madre de Dios Department (see Fig. 1) and are Eco- Amazonia (EA; 12?31'44"S; 68?55'58"W), Cusco Amaz6nico (CA; 12?32'28"S; 69?03'36"W), Ex- plorer's Inn (El; 12?50'18"S; 69?17'45'W), Sachav- acayoc Centre (SC; 12?51'10"S; 69?21'57"W), and Tambopata Research Center (TRC; 13?08'53"S; 69037'02"W). Four of the sites lie within the new- ly created (September 2000) buffer zone outside of the Reserva Nacional Tambopata (RNT) and the Parque Nacional Bahuaja Sonene. The fifth site, TRC, lies within RNT. All sites have rela-
tively flat terrain with some relief in the form of terraces (El) or bluffs (TRC). The forest types that occur in Tambopata have been described by Erwin (1984) and Phillips (1993, 1994). The her- petofaunal assemblages of Tambopata were de- scribed and analyzed in detail by Doan and Ar- izabal (2002).
Sampling Methods.-Each of the five sites was visited five times during the sampling period of January 1997 to November 1998. At each site, four quadrat plots and two VES plots were in- stalled. Care was taken to ensure that all of the plots at each site were placed in the same forest type to control for intrasite variation (Phillips, 1993, 1994; Doan and Arizabal, 2002), and all plots were placed at least 300 m from bodies of
73

TIFFANY M. DOAN
water. Sampling of VES and quadrat plots oc- curred on alternating days to ensure that short- term temporal variations in herpetofaunal abun- dance did not bias the study.
At each site, four 70 x 80 m plots were estab- lished, each of which contained 56 8 x 8 m quadrats. Plots were no closer than 150 m to each other (and usually much more distant). Each quadrat was centered in a 10 x 10 m square with 2 m separating adjacent quadrats and 1 m separating the external quadrats from the edge of the plot. Positions of quadrats were marked by flagging tape at each of the four cor- ners. Of the 56 quadrats per plot, half were se- lected using a random number table for sam- pling each visit. The other half was sampled during the next site visit and so on. In this way, any disturbance caused to the area by sampling did not affect future surveys of the same quad- rat because at least five months had passed be- tween subsequent samples of individual quad- rats. During the first two visits to each site, half of the quadrats were sampled during the day and half at night. Beginning with the third visit to each site, 22 of the randomly chosen quadrats per plot were sampled during the night; the oth- er six were sampled during the day. The change was made to increase the overall capture rate. A total of 112 quadrats were surveyed during each of the five site visits at each site.
To sample the quadrat, a six-person team was used; four individuals worked in the quadrat with sticks to move the leaf litter to locate and capture animals, while the other two people processed the captures. Prior to sampling, a measuring tape was wrapped around the four comers of the quadrat to indicate the borders of the 8 x 8 m square. Each of the four observers began at one of the comers of the quadrat and worked in a clockwise motion toward the mid- dle until all four met in the center. The sampling intensity was high with all vegetation, logs, and leaf litter turned over and searched thoroughly to reveal all amphibians and reptiles up to 2 m in height within the quadrat (but no substrate was removed from the quadrat area). The syn- chronized movement was designed to prevent escape from the quadrat before capture. Diurnal quadrats were completed in an average of 11.33 min, whereas nocturnal quadrats lasted a mean of 14.88 min.
Amphibians and reptiles were measured with dial calipers to the nearest 0.1 mm (SVL and tail lengths separately), weighed with a spring bal- ance to the nearest 0.25 g, and lizards and an- urans were individually toe-clipped using the Twitty scheme (1966; in Donnelly et al., 1994). Snakes and caecilians were not marked because the likelihood of recapture was very low. Am- phibians and reptiles that escaped before cap-
ture were recorded only if their species identity could be confidently determined. Identified es- capees were included in the results. Gender and reproductive state of the specimen, substrate, vertical height, and additional observations were also noted. All specimens were immedi- ately released back into the quadrat after sam- pling and processing were terminated, and logs and other large substrates were replaced in their original locations. Leaf litter depth, diameter of all trees greater than 10 cm at breast height, weather, and temperature were also recorded (but not analyzed here). See Doan and Arizabal (2000) for a complete description of environ- mental parameters collected.
Also at each site, two 1-ha visual encounter survey (VES) plots were installed. Each plot contained 24 100-m long transects that were separated by 4 m. Narrow paths were cut along the transects to facilitate sampling and to pre- vent the observers from straying into neighbor- ing transects. Each transect within each plot was sampled twice during each site visit: once dur- ing the day and once at night; the order of sam- pling was randomized. At least three days were allowed following transect installation or main- tenance before surveying; at least two days were allowed between successive surveys of the same transect.
The VES searching method used in this study differed from previous VES studies (e.g., Crump and Scott, 1994) in that we did not use VES as a time-constrained technique. Observers walked each transect at a standard pace but visually searched the entire transect using as much time as was needed to examine each area thoroughly. Because of this, nocturnal searches required more time (mean = 39.63 min per 100-m tran- sect) than diurnal ones (mean = 25.71 min). A three-person team was used to sample each transect. The first observer was an experienced coordinator (the author or another individual), the second observer was a less experienced as- sistant, and the third person did not capture but processed the specimens that were caught. Both observers on each team used Nite Lite? Wizard headlamps with gel cell rechargeable batteries. Two teams of three worked on adjacent tran- sects during each sampling day or night to max- imize efficiency and reduce the total plot sam- pling time by half. Sampling intensity was rel- atively light, confined to visual searching up to 2 m in height without disturbing the vegetation or leaf litter. Observers captured amphibians and reptiles from the transect line to 2 m away on each side, for a total width of 4 m. The lo- cation of each individual along the transect was recorded with this method. Recorded specimen data were identical to that for quadrats (see above); environmental data were the same as
74

RAIN FOREST SAMPLING METHODS
collected for quadrats except that tree diameters and leaf litter depth were not recorded (Doan and Arizabal, 2000).
Analysis.-To determine which methods are preferable (i.e., yield the highest number of in- dividuals or species) for rain forest herpetofaun- al sampling, four specific questions are ad- dressed in this paper. All statistical tests were performed with Statistica (StatSoft, rel. 4.5, Tul- sa, OK, 1993) or Systat (SPSS, vers. 6.0 for Win- dows, Prentice Hall, Upper Saddle River, NJ, 1997). An alpha level of 0.05 was considered sig- nificant for all analyses. Question 1: Which methodology yields the highest numbers in a short-term (one-day) survey? To answer this question, three diurnal surveys and three noc- turnal surveys at each site for each method were randomly chosen (using a random number ta- ble) from all of the sampling days during the rainy season of the Proyecto Tambopata data (the quantity three was selected because it was sufficiently high for statistical considerations and because of the low number of diurnal VES samples per site visit). The abundance and spe- cies richness of the 15 surveys (diurnal and noc- turnal separately) were compared between quadrats and VES using a paired t-test to de- termine whether one method is superior over the other for short-term sampling. In addition, to assess how much overlap in species richness occurred between the two methods, I calculated the number of species recorded uniquely by each method for each sampling day pair of di- urnal and nocturnal surveys. The amphibian and reptile results were separately compared using paired t-tests.
Question 2: Which method yields the highest records for a long-term survey? For this ques- tion all the individuals and species recorded with each methodology were summed by site over the entire two-year study period to deter- mine which method had the highest overall re- cords. Quadrat and VES methodologies were compared by site with Wilcoxon matched pairs signed rank tests. A nonparametric test was necessary because of the low number of sites (N = 5).
One potential problem with comparing quad- rat and VES sampling is that different amounts of time were spent on each method. To account for this, I compared total person-hours spent on each method for each site visit. For the first two visits at a site 56 diurnal and 56 nocturnal quad- rats were completed per site visit. A total of 24 diurnal quadrats and 88 nocturnal quadrats were completed for the other three visits. Dur- ing all five site visits, 48 diurnal transects and 48 nocturnal transects were completed. Using the average time per sampling method and mul- tiplying by the number of total workers per
method (six per quadrat, three per transect) re- sulted in an overall site total of 767.96 person- hours for quadrats and 784.08 person-hours for transects. By dividing, a difference of 1.021 re- sults. Thus, a correction factor must be applied by multiplying each quadrat abundance result by 1.021 for each Question 2 result to account for differential time spent per method.
To assess the amount of overlap in species richness between the two methods, species that were captured with only one of the methods were tallied for amphibians and reptiles sepa- rately by site and compared using a Wilcoxon signed rank test. The overall overlap of the methods over the two-year period for the entire Tambopata region was also calculated and com- pared using a Fisher exact test.
Question 3: Which method yields more cap- tures for arboreal amphibians and for terrestrial amphibians? To address this question, all indi- viduals and species were summed by site in their microhabitat category for each site visit. Because some species are known to spend part of their diel activity in trees and part on the ground, species were classified by which verti- cal microhabitat they were encountered in most often based on the vertical position data collect- ed in this study. Total numbers of anurans re- corded during quadrat and VES methodologies were compared, for arboreal and terrestrial am- phibian abundance and species richness sepa- rately, using paired t-tests. Additionally, be- cause sites seemed to differ in relative abun- dance and richness of anuran species in the two microhabitat categories, ANOVAs were per- formed to examine whether site differences con- tributed to the variance in species richness and abundance. The LSD posthoc test was used to compare among sites.
Similar to Question 2, a correction factor must be applied to adjust for the different amounts of time spent conducting quadrat and VES methodologies. However, because Question 3 used data from 25 separate site visits, an overall correction would not suffice. For the first two visits at each site, each quadrat result was mul- tiplied by 1.068 to account for more time spent conducting VES surveys. For the third, fourth, and fifth site visits, each VES result was multi- plied by 1.008 to account for more time spent conducting quadrats.
Question 4: Which method yields more re- cords for particular families or genera of am- phibians and reptiles? For this question all of the individuals and species of six taxonomic groups of amphibians, three groups of lizards, and one family of snakes were summed by site over the two-year period. The taxonomic groups chosen were the most common species, even though other taxa were present (Doan and Arizabal,
75

TIFFANY M. DOAN
TABLE 1. Summary results of each of the four questions posed in this study. VES = visual encounter surveys greater than quadrats, Q = quadrats greater than VES, NS = not significant. Significance levels: * < 0.05, ** < 0.01, *** < 0.001.
Question Taxa Survey type Abundance Richness
1-Short-term Amphibians Diurnal VES** NS Amphibians Nocturnal NS VES** Reptiles Diurnal NS NS Reptiles Nocturnal VES** NS
2-Long-term Amphibians NS NS Reptiles NS VES*
3-Microhabitat Amphibians Arboreal VES** VES*** Amphibians Terrestrial Q* Q***
4-Taxonomic group Hylids VES* VES** Eleutherodactylus spp. VES* Terrestrial Leptodactylids NS Q* Microhylids Q* Bufonids NS Dendrobatids Q** Anolis spp. VES** Gymnophthalmids Q* Gekkonids Q* Colubrids VES*** VES***
2002). For anurans, the groups examined were hylids, Eleutherodactylus spp., terrestrial lepto- dactylids, microhylids, bufonids, and dendro- batids. The reptiles examined were Anolis spp., gymnophthalmids, gekkonids, and colubrids. The total abundances for each site visit (five per site) for VES and quadrat methodologies were compared using paired t-tests. For all groups except the gekkonids, all sites were examined; for gekkonids only EA and CA were examined because the other sites had virtually no records of gekkonids in the plots. Species richness was compared only for those taxonomic groups that had, on average, more than seven species per site for the two-year study period. These groups were hylids, terrestrial leptodactylids, and col- ubrids. Quadrats versus VES for each group were compared using paired t-tests. Each result was adjusted using the same correction factor as Question 3. To assess overlap in species rich- ness between the methods, the numbers of unique species per method for each taxonomic group by site were compared using Wilcoxon signed rank tests. To determine whether sites differed in their abundances and richness of her- petofaunal taxa, ANOVAs were performed.
RESULTS
The number of individuals detected over the entire study period was 19,957: 18,146 amphib- ians and 1811 reptiles. The total number of spe- cies detected during sampling was 87 anurans, one caecilian, one turtle, 23 lizards, and 32 snakes. Many other individuals and species were captured outside of standard sampling (in-
cluding one salamander species and one am- phisbaenian species), but those will not be dis- cussed here. Doan and Arizabal (2002) provide a checklist of the entire herpetofaunal commu- nity.
Throughout the 23-month period, a total of 3336 quadrats were examined, 2176 during the night and 1160 during daylight. In addition, 2832 straight-line transects were completed, half during the night and half during the day. In all cases, more reptiles and amphibians were re- corded during nocturnal sampling than diurnal sampling (80.6% at night). In terms of effort, 2027.65 person-hours were spent on nocturnal quadrats, 848.99 person-hours on diurnal quad- rats, 1902.20 person-hours on nocturnal VES, and 1234.08 person-hours on diurnal VES. The total person-hours for the entire study equaled 6012.92. See Table 1 for a summary of results for each question.
Question 1: Short-Term Surveys.-For diurnal surveys, amphibian abundance differed signifi- cantly between methodologies (t = -2.833, df = 14, P = 0.013) with more individuals record- ed in VES than quadrats. Reptile abundance did not differ significantly between methods (t = -0.551, df = 14, P = 0.590), although higher numbers were recorded in VES than quadrats. For both amphibians and reptiles, species rich- ness did not differ significantly between meth- ods. Visual encounter surveys accounted for more unique species than quadrats, but neither the amphibian nor reptile results were signifi- cantly different (Table 2).
For nocturnal surveys, both reptiles and am-
76

RAIN FOREST SAMPLING METHODS
TABLE 2. Total number of species detected and number of species found uniquely by each method for diurnal
short-term surveys (Question 1).
Number of species Total number of found only with this species detected method
Amphibian Reptile Amphibian Reptile Date
Quad- Quad- Quad- Quad- Site Quadrat VES rat VES rat VES rat VES rat VES
EcoAmazonia 29 Mar 1998 31 Mar 1998 7 7 2 4 3 0 3 1 21 Mar 1998 24 Mar 1998 5 19 3 8 3 2 6 2 19 Sep 1998 27 Mar 1998 5 7 1 2 1 0 3 3
Cusco Amazonico 6 Feb 1998 4 Feb 1998 5 8 1 3 1 1 4 3 30 Jan 1998 26 Jan 1998 7 8 2 1 2 2 3 1
9 Sep 1997 2 Feb 1998 10 6 6 1 5 1 4 1 Explorer's Inn 18 Oct 1998 27 Oct 1998 7 8 3 0 4 2 4 0
13 Oct 1998 8 Oct 1998 3 2 0 0 3 2 0 0 24 Mar 1997 16 Oct 1998 9 6 1 2 5 1 3 2
Sachavacayoc Centre 15 Nov 1997 22 Nov 1997 7 6 1 2 3 1 2 2 25 Nov 1997 19 Nov 1997 6 4 1 3 2 1 0 3 11 Mar 1997 28 Nov 1997 2 6 1 3 0 0 4 2
Tambopata Research Center 1 Dec 1997 13 Dec 1997 6 7 1 1 4 1 5 1 13 Feb 1998 16 Feb 1998 7 10 1 2 2 1 6 2 23 Feb 1998 21 Feb 1998 6 7 2 0 3 2 4 0
phibians were more abundant in VES surveys, and reptiles were more species-rich in VES sur- but only reptile abundance was significantly dif- veys. In addition, more amphibian and reptile ferent between methods (t = -2.902, df = 14, species were uniquely detected during the night P = 0.012), whereas amphibian abundance was with VES, but only the amphibian results were not (t = -2.030, df = 14, P = 0.062). However, significant (t = -2.986, df = 14, P = 0.010; Table there were significant differences in amphibian 3). species richness between methods (t = -2.924, Question 2: Two Years.-Abundances of am- df = 14, P = 0.011), whereas reptile species rich- phibians and reptiles detected with the two ness did not differ (t = -1.167, df = 14, P = methods were not significantly different over 0.263). As with abundance, both amphibians the two-year period (Z = 0.674-1.214, df = 4, P
TABLE 3. Total number of species detected and number of species found uniquely by each method for nocturnal short-term surveys (Question 1).
Number of species Total number of found only with this species detected method
Amphibian Reptile Amphibian Reptile Date
Quad- Quad- Quad- Quad- Site Quadrat VES rat VES rat VES rat VES rat VES
EcoAmazonia 20 Mar 1998 24 Mar 1998 11 17 4 7 1 7 1 4 18 Mar 1998 26 Mar 1998 14 20 5 3 2 9 2 1 19 Mar 1998 28 Mar 1998 12 15 5 9 3 6 3 4
Cusco Amazonico 24 Jan 1998 2 Feb 1998 9 14 2 5 2 7 1 4 26 Jan 1998 29 Jan 1998 8 13 1 3 4 8 1 2 23 Jan 1998 5 Feb 1998 10 16 5 3 2 8 3 1
Explorer's Inn 8 Oct 1998 11 Oct 1998 5 4 0 1 4 2 0 1 12 Oct 1998 14 Oct 1998 9 5 0 0 6 2 0 0 27 Oct 1998 21 Oct 1998 6 14 1 2 1 8 0 2
Sachavacayoc Centre 12 Nov 1997 21 Nov 1997 8 17 1 4 1 8 0 5 13 Nov 1997 15 Nov 1997 11 13 2 1 0 3 2 1 26 Nov 1997 27 Nov 1997 11 12 6 1 1 3 3 0
Tambopata Research Center 8 Dec 1997 12 Dec 1997 12 14 1 1 6 8 1 1 17 Feb 1998 23 Feb 1998 13 8 2 4 7 2 2 4 22 Feb 1998 24 Feb 1998 15 18 2 4 4 8 1 3
77

TIFFANY M. DOAN
TABLE 4. Total number of species detected and number of species found uniquely by each method over the entire two-year study period (Question 2).
Total number of Number of species found species detected only with this method
Amphibian Reptile Amphibian Reptile
Site Quadrat VES Quadrat VES Quadrat VES Quadrat VES
EcoAmazonia 36 42 25 28 3 11 6 9 Cusco Amazonico 30 41 20 25 1 12 6 12 Explorer's Inn 34 37 9 15 7 8 4 9 Sachavacayoc Centre 36 40 18 24 3 9 6 11 Tambopata Research Center 45 44 21 22 9 8 6 7
Overall 63 74 42 43 3 14 5 6
= 0.225-0.500). The VES method, however, yielded significantly more reptile species re- cords than quadrats (Z = 2.023, df = 4, P =
0.043). Species richness of amphibians did not differ significantly between methods (Z = 1.000, df = 4, P = 0.080). Additionally, more species were uniquely recorded from VES surveys than quadrats (Table 4). However, the differences were not significant (Fisher P = 0.1998).
Question 3: Microhabitat.-Quadrat and VES methodologies differed greatly in terms of re- cords of terrestrial versus arboreal amphibians. Significant differences were found for arboreal abundance (t = -2.690, df = 24, P = 0.013), terrestrial abundance (t = 2.443, df = 24, P =
0.022), arboreal species richness (t = -4.098, df = 24, P < 0.001), and terrestrial richness (t = 3.942, df = 24, P = 0.001). In terms of both abundance and richness, arboreal anurans were captured more often overall using VES, whereas terrestrial anurans were captured more often using quadrats.
The ANOVAs comparing sites for arboreal and terrestrial anuran abundance were signifi- cant, showing that site differences did contrib- ute to the variance in abundance between the methods (P < 0.001; Table 5). With respect to species richness, the ANOVA was significant for terrestrial quadrats only (F = 6.806; df = 4, 20; P = 0.001), whereas all other ANOVAs were not significant (Table 5).
TABLE 5. Results of ANOVAs testing the differenc- es among sites for arboreal and terrestrial anuran abundance and species richness (Question 3).
Probability Micro- habitat Measure Quadrat VES
Arboreal Abundance 0.0005 0.0012 Richness 0.0544 0.0915
Terrestrial Abundance 0.0013 0.0014 Richness 0.0013 0.3115
Question 4: Taxonomic Groups.-All taxonomic groups differed significantly in abundance be- tween methods except terrestrial leptodactylids and bufonids (Table 6). Of those that differed, hylids, Eleutherodactylus spp., Anolis spp., and colubrids were recorded more often with VES, whereas microhylids, dendrobatids, gymno- phthalmids, and gekkonids were detected more often in quadrats. Both terrestrial leptodactylids and bufonids were also recorded more often in quadrats, although not significantly so. All three taxonomic groups examined differed signifi- cantly in species richness between quadrat and VES methods. Species richness of hylids and colubrids was higher in VES, whereas terrestrial leptodactylids were richer in quadrat samples (Table 6). When assessing species richness over- lap, only hylids, terrestrial leptodactylids, bu- fonids, and colubrids could be analyzed because of low species number of other groups. Num- bers of unique hylids and colubrids differed sig- nificantly (Z = 2.023, df = 4, P = 0.043, for both groups) and were higher in VES. When all sites were combined, number of unique species was not significantly different between methods (Z = 1.153, df = 9, P = 0.249; Table 6). Hylids were the only group to have a high number of unique species in VES. Additionally, sites differed sig- nificantly in the abundance and species richness of reptile and amphibian groups examined (Ap- pendix 1).
DISCUSSION
This study demonstrates that no single meth- od is better for censusing all rain forest herpe- tofauna. Both methods have strengths and weaknesses that must be explored before decid- ing on the methods for a particular study. In selecting between the two methods, researchers must decide whether sampling a smaller area intensively or a larger area with less intensity better would serve their goals. In general, VES yielded more records for most of the questions proposed in this study. However, particular an-
78

RAIN FOREST SAMPLING METHODS
TABLE 6. Total number of species and individuals detected and number of species found uniquely by each method for each taxonomic group (Question 4).
Total species Total individuals Unique species
Taxon Quadrat VES Quadrat VES Quadrat VES
Hylids 26 35 732 1273 1 10 Eleutherodactylus spp. 8 10 1339 1710 0 2 Terrestrial Leptodactylids 14 13 3751 2875 1 0 Microhylids 5 5 2750 1781 0 0 Bufonids 3 4 416 292 0 1 Dendrobatids 5 5 626 435 0 0 Anolis spp. 4 4 180 291 0 0 Gymnophthalmids 6 5 214 125 1 0 Gekkonids 3 3 304 167 1 1 Colubrids 18 19 74 135 2 3 Totals 92 103 10386 9084 6 17
imal groups and microhabitats were better sam- pled using quadrats. Additionally, the two methods performed equally well in many cases.
For short-term surveys (Question 1) of am- phibians, the verdict is split. In the current study, higher abundance was obtained during diurnal surveys using VES, whereas nocturnal surveys did not differ between methods. If the object of a short-term study is high numbers of species, VES yielded more captures at night, but the methods did not differ during the day. For reptiles, the results were more complex. Al- though VES was more effective for reptile abun- dance at night, the methods did not differ dur- ing the day; species richness was equivalent for both methods at both survey periods. Visual en- counter surveys documented more unique spe- cies of amphibians at night and may serve as the most appropriate method for amphibian in- ventory surveys. However, VES surveys appear to have more daily variation in species detected (Tables 1-2), which may render population es- timates calculated from VES less reliable. Based on these considerations, researchers who wish to conduct short-term surveys must weigh their options and available manpower before choos- ing which method or methods to implement.
For long-term studies (Question 2), similar numbers of reptile and amphibian individuals were recorded with both methods. Reptile spe- cies richness, however, was higher for VES sam- ples. Detecting rare species generally requires long-term studies and both methods seem to document such species with similar effective- ness. However, if the primary goal is to record a high number of reptile species, one should choose VES as it performed better in this two- year study.
The results of Question 3 (microhabitat dif- ferences) match the expectations of many re- searchers (Crump and Scott, 1994; Jaeger and Inger, 1994). Quadrats searches detected signif-
icantly higher numbers of individuals and spe- cies of terrestrial amphibians, whereas VES re- corded significantly more individuals and spe- cies of arboreal amphibians. The choice is ob- vious to researchers targeting a particular microhabitat. It should be noted, however, that the five sites included in this study differed sig- nificantly with respect to the abundance of ar- boreal and terrestrial amphibians (as demon- strated by the ANOVA results). Even though the sites were from a relatively small geographic area, their anuran compositions contrasted sharply (Doan and Arizabal, 2002). This high- lights the importance of site selection as well as sampling methodology in targeting particular herpetofaunal microhabitats.
Question 4 (taxonomic group differences) yielded some interesting results that are impor- tant for researchers targeting particular taxo- nomic groups. Of the 10 taxonomic groups ex- amined, eight differed significantly between sampling methods. Researchers who wish to conduct population studies on rain forest mem- bers of Hylidae, Colubridae, the leptodactylid genus Eleutherodactylus, and the polychrotid ge- nus Anolis should use VES sampling. These de- cisions are based on high numbers of individ- uals recorded and higher number of unique species detected with VES. To investigate pop- ulations of Microhylidae, Dendrobatidae, Gym- nophthalmidae, and Gekkonidae, quadrats are preferable.
It is important to note that the anuran family Leptodactylidae was divided into its terrestrial and semiarboreal (Eleutherodactylus) counter- parts. Without this partitioning the true trend would have been masked because the family contains two distinct groups that use two dis- tinct vertical portions of the habitat. Eleuthero- dactylus were significantly more abundant in VES surveys, whereas the exclusively terrestrial leptodactylids did not differ between methods.
79

TIFFANY M. DOAN
A similar partitioning could have divided the Gekkonidae. In Tambopata, the family is made up of one abundant arboreal gecko, Gonatodes humeralis, one abundant terrestrial gecko, Pseu- dogonatodes guianensis, and two rarer arboreal species (Doan and Arizabal, 2002). It is likely that, if this family were partitioned in a similar fashion as the leptodactylids, the two species would have differed in their abundance for the two methods.
Conclusions.-Choice of survey methods de- pends on the scope of the study, target taxa, and particular study objectives (Corn and Bury, 1990). By presenting quantitative data on the ef- ficacy of two herpetofaunal sampling methods, we may now understand more clearly how the methods differ depending on the goals of cer- tain investigations. Many methods of terrestrial vertebrate sampling are inherently associated with biases that are difficult to remove or spe- cifically account for (Mengak and Guynn, 1987). The existence of strong biases in sampling methods has remained an important issue con- cerning investigations of both diversity and abundance. The present analysis outlines some significant patterns of bias of common methods used in rain forest habitats. Thus, future re- searchers may not only be aware but may em- ploy the attributes and biases of each method to promote research objectives. Rain forest field studies can be both challenging and expensive and are often tightly constrained by time. Given the results presented here, limited resources can be maximized to design sampling regimens that accomplish research goals most efficiently. Ad- ditional studies of this kind are needed for other methods and different habitats so that research- ers will be able to choose from the multitude of potential methods and efficiently obtain the most rigorous data possible.
Although this study concentrated on the sam- pling methods that yielded the highest number of records, researchers must consider other fac- tors as well. Different sampling methods may also impact the habitats in varied ways, and this fact should be considered. Of the two methods discussed in this paper, quadrat sampling can be quite disruptive to the habitat. Visual en- counter surveys impact the habitat to a lesser degree, with destructive activities confined to the installation and maintenance of VES plots, and sampling itself consisting of walking qui- etly along paths. In fragile habitats, researchers must weigh the costs and benefits of consistent- ly intrusive methods such as quadrats before deciding on which methods will be most appro- priate.
In a time when amphibian populations and faunal species diversity are declining at an un- precedented rate (Soule, 1987; Houlahan et al.,
2000), it is extremely important to know which methods will render the most valid results for a particular type of study. The current study may serve to arm researchers working in rain forest habitats with sufficient information to use the strengths and limitations of quadrat and VES methodologies to efficiently investigate patterns of decline. Only with standardized sampling set on a solid framework will studies be compara- ble so that phenomena such as global amphibian population decline cannot only be documented, but also quantified.
Acknowledgments.-My greatest thanks go to W. Arizabal Arriaga who captured many of the reptiles and amphibians for this study and with whom I have had meaningful conversations about methods for rain forest surveying. H. Lloyd, J. I. Watling, C. Kirkby, A. Curo Miranda, J. A. Ochoa Camara, A. Palomino Marin, A. Cor- nejo Farfan, and many assistants made the field- work possible. T A. Castoe, J. I. Watling, C. L. Spencer, E. N. Smith, W. E. Schargel, and J. M. Meik reviewed various versions of the manu- script. This work was partially supported by a grant from the Percy Sladen Memorial Fund.
LITERATURE CITED
CAMPBELL, H. W., AND S. P. CHRISTMAN. 1982. The herpetofaunal components of Florida sandhill and sand pine scrub associations. In N. J. Scott Jr. (ed.), Herpetological Communities, pp. 163-171. U.S. De- partment of the Interior, Washington, DC.
CORN, P. S., AND R. B. BURY. 1990. Sampling methods for terrestrial amphibians and reptiles. U.S. De- partment of Agriculture General Technical Report PNW-GTR-256.
CRUMP, M. L., AND N. J. SCOTT JR. 1994. Visual en- counter surveys. In W. R. Heyer, M. A. Donnelly, R. W. McDiarmid, L. C. Hayek, and M. S. Foster (eds.), Measuring and Monitoring Biological Di- versity: Standard Methods for Amphibians, pp. 84-92. Smithsonian Institution Press, Washington, DC.
DOAN, T. M., AND W ARIZABAL A. 2000. The impact of tourism on the herpetofauna of Tambopata, south-eastern Peru. In C. A. Kirkby, T. M. Doan, H. Lloyd, A. Comejo E, W Arizabal A., and A. Pal- omino M. (eds.), Tourism Development and the Status of Neotropical Lowland Wildlife in Tam- bopata, South-eastern Peru: Recommendations for Tourism and Conservation/El Desarrollo Turfstico, su Impacto sobre la Fauna Neotropical de Tam- bopata, Sureste del Peru: Recomendaciones para el Turismo y la Conservaci6n, pp. 63-76. Tambopata Reserve Society, London.
. 2002. Microgeographic variation in species composition of the herpetofaunal communities of Tambopata Region, Peru. Biotropica 34:101-117.
DONNELLY, M. A., C. GUYER, J. E. JUTERBOCK, AND R. A. ALFORD. 1994. Techniques for marking am- phibians. In W. R. Heyer, M. A. Donnelly, R. W. McDiarmid, L. C. Hayek, and M. S. Foster (eds.), Measuring and Monitoring Biological Diversity:
80

RAIN FOREST SAMPLING METHODS
Standard Methods for Amphibians, pp. 275-284. Smithsonian Institution Press, Washington, DC.
ERWIN, T. L. 1984. Tambopata Reserved Zone, Madre de Dios, Peru: history and description of the Re- serve. Revista Peruana de Entomologfa 27:1-8.
HEYER, W. R., AND K. A. BERVEN. 1973. Species di- versities of herpetofaunal samples from similar mi- crohabitats at two tropical sites. Ecology 54:642- 645.
HEYER, W. R., M. A. DONNELLY, R. W. MCDIARMID, L. C. HAYEK, AND M. S. FOSTER. (EDS.). 1994. Mea- suring and Monitoring Biological Diversity: Stan- dard Methods for Amphibians. Smithsonian Insti- tution Press, Washington, DC.
HOULAHAN, J. E., C. S. FINDLAY, B. R. SCHMIDT, A. H. MEYER, AND S. L. KUZMIN. 2000. Quantitative ev- idence for global amphibian population declines. Nature 404:752-755.
INGER, R. F 1980. Densities of floor-dwelling frogs and lizards in lowland forests of Southeast Asia and Central America. American Naturalist 115: 761-770.
JAEGER, R. G., AND R. F INGER. 1994. Quadrat sam- pling. In W R. Heyer, M. A. Donnelly, R. W. McDiarmid, L. C. Hayek, and M. S. Foster (eds.), Measuring and Monitoring Biological Diversity: Standard Methods for Amphibians, pp. 97-102. Smithsonian Institution Press, Washington, DC.
MENGAK, M. T., AND D. C. GUYNN. 1987. Pitfalls and snap traps for sampling small mammals and her- petofauna. American Midland Naturalist 118:284- 288.
PEARMAN, P. B., A. M. VELASCO, AND A. LOPEZ. 1995. Tropical amphibian monitoring: a comparison of methods for detecting inter-site variation in species composition. Herpetologica 51:325-337.
PHILLIPS, 0. L. 1993. Comparative valuation of tropi- cal forests in Amazonian Peru. Unpubl. Ph.D. diss., Washington Univ., St. Louis, MO.
. 1994. Summary of the vegetation of Explor- er's Inn Reserve. In R. B. Foster, T. A. Parker III, A. H. Gentry, L. H. Emmons, A. Chicch6n, T. Schu- lenberg, L. Rodriguez, G. Lamas, H. Ortega, J. Ico- chea, W Wust, M. Romo, J. A. Castillo, 0. Phillips, C. Reynel, A. Kratter, P. K. Donahue, and L. J. Bar- kley (eds.), The Tambopata-Candamo Reserved Zone of Southeastern Peru: A Biological Assess- ment, pp. 52-54. Conservation International, Wash- ington, DC.
RODDA, G. H., E. W. CAMPBELL III, AND T. H. FRITTS. 2001. A high validity census technique for herpe- tofaunal assemblages. Herpetological Review 32: 24-30.
SCOTT JR., N. J. 1994. Complete species inventories. In W. R. Heyer, M. A. Donnelly, R. W. McDiarmid, L. C. Hayek, and M. S. Foster (eds.), Measuring and Monitoring Biological Diversity: Standard Meth- ods for Amphibians, pp. 78-84. Smithsonian Insti- tution Press, Washington, DC.
SOULE, M. E. (ED.). 1987. Viable Populations for Con- servation. Cambridge Univ. Press, Cambridge.
TWITTY, V. C. 1966. Of scientists and salamanders. Freeman, San Francisco, CA.
Accepted: 26 April 2002.
APPENDIX 1. Results of ANOVAs testing the differences among sites for abundance and species richness of particular taxonomic groups (Question 4).
Probability
Taxon Measure Quadrat VES
Hylids Abundance 0.0008 0.0111 Richness 0.0896 0.0054
Eleutherodactylus spp. Abundance 0.0002 0.0000 Terrestrial Leptodactylids Abundance 0.0000 0.0858
Richness 0.0384 0.4357 Microhylids Abundance 0.0025 0.0000 Bufonids Abundance 0.0077 0.0000 Dendrobatids Abundance 0.0000 0.0000 Anolis spp. Abundance 0.3443 0.0018 Gymnophthalmids Abundance 0.0000 0.0000 Gekkonids Abundance 0.0241 0.0290 Colubrids Abundance 0.0581 0.0057
Richness 0.0897 0.0049
81