Embed Size (px)
Citation preview

Advanced Electric Vehicle Architectures
Collaborative Project
Grant Agreement Number 265898
Deliverable D1.1
Societal scenarios and available technologies for electric vehicle architectures in 2020
Confidentiality level: Public
Status: Final
Executive Summary The objective of WP1 of ELVA is to provide the framework to develop the different vehicle
concepts in WP2 and WP3. For this purpose a review of existing future societal and
technological developments has been carried out in WP 1.1. The results of this review are
reported in this deliverable.
The review is divided into two parts:
A review of European and global roadmaps, strategy papers etc. for future road
transport in order to identify the main drivers and trends in our society with relation to
future traffic and vehicle concepts
An analysis of the state-of-the art and future trends of the vehicle technology and
standards concerning lightweight and functional materials, lightweight vehicle
architectures, electromagnetic compatibility, structural electric storage systems,
electric drive train technology, brake system technology as well as active and passive
safety
Preliminary findings of the review have been presented and discussed during a workshop
attended by ELVA partners, members of the Advisory Board as well as other stakeholders.
The feedback received during this workshop is incorporated in this report.

Deliverable D1.1
ELVA 2 SCP0-GA-2010-265898
Document Name
ELVA-110331-D11-V10-FINAL
Version Chart
Version Date Comment
0.1 7 April 2011 First draft version
0.2 11 April 2011 Updated version for review by all partners
1.0 28 April 2011 Final version
Authors
The following participants contributed to this deliverable:
Name Company Chapters
J. Wismans SAFER/Chalmers all
E.-M. Malmek SAFER/Chalmers 2
C. Karlsson SAFER/SP 4
N. Depner, M. Funcke, L. Ickert IKA 3, 7
M. Lesemann IKA all
B. Bayer, W. Schindler Continental 5, 6
G. Monfrino CRF all
M. Petiot Renault 5, 6
C. Ntchouzou VW 3
Coordinator
Dipl.-Ing. Micha Lesemann
RWTH Aachen University – Institut für Kraftfahrzeuge
Steinbachstraße 7 – 52074 Aachen – Germany
Phone +49 241 80 27535
Fax +49 241 80 22147
E-mail [email protected]
Copyright
© ELVA Consortium 2011

Deliverable D1.1
ELVA 3 SCP0-GA-2010-265898
Table of Contents
1 Introduction .................................................................................................................... 7
2 Driving forces and societal scenarios ............................................................................. 8
2.1 Introduction .............................................................................................................. 8
2.2 Scenarios ................................................................................................................ 9
2.3 Main driving forces ................................................................................................. 11
2.3.1 Environment and economy ................................................................................. 11
2.3.1.1 Economic growth......................................................................................... 12
2.3.1.2 Energy and resources ................................................................................. 16
2.3.1.3 Climate Change .......................................................................................... 20
2.3.1.4 Sustainability matters .................................................................................. 21
2.3.1.5 Efficiency – downsizing ............................................................................... 21
2.3.1.6 Business models ......................................................................................... 23
2.3.2 Society & Culture ............................................................................................... 23
2.3.2.1 Population Growth ....................................................................................... 23
2.3.2.2 Urbanisation ................................................................................................ 24
2.3.2.3 Values, attitudes and lifestyle ...................................................................... 24
2.3.2.4 Demand on cities ........................................................................................ 25
2.3.2.5 Demand on mobility solutions ..................................................................... 25
2.3.3 Public Policies and market trends ...................................................................... 26
2.4 Trends in the market for xEVs ............................................................................... 27
2.5 Discussions and conclusions ................................................................................. 32
3 Light weight material concepts and vehicle architectures ............................................. 34
3.1 Introduction ............................................................................................................ 34
3.2 Body in white material concepts and architectures................................................. 34
3.2.1 State of the Art ................................................................................................... 35
3.2.1.1 Large volume: Shell construction ................................................................ 35
3.2.1.2 Midsize and small volume: Aluminium space frame .................................... 36
3.2.1.3 High performance cars: Small volume with monocoque .............................. 37
3.2.2 Future trends beyond 2020 ................................................................................ 38
3.2.2.1 Large series ................................................................................................ 38
3.2.2.2 Midsize volume and small volume ............................................................... 39

Deliverable D1.1
ELVA 4 SCP0-GA-2010-265898
3.2.3 Summary ............................................................................................................ 41
3.2.4 Integration of the battery system ........................................................................ 42
3.2.5 Further future body concepts for weight reduction and functional integration ..... 43
3.3 Chassis material concepts ..................................................................................... 44
3.4 Interior material concepts ....................................................................................... 45
3.5 Conclusion ............................................................................................................. 46
4 State-of-the-art and outlook EMC ................................................................................ 48
4.1 Introduction to EMC and EMF ................................................................................ 48
4.2 State of the Art ....................................................................................................... 48
4.2.1 Overview of existing EMC standards .................................................................. 48
4.2.1.1 ISO ............................................................................................................. 49
4.2.1.2 IEC/CISPR .................................................................................................. 49
4.2.1.3 OEM standards ........................................................................................... 50
4.2.2 Electromagnetic Fields (EMF) ............................................................................ 50
4.2.2.1 Directives and ICNIRP ................................................................................ 50
4.3 General technology outlook up to 2030+................................................................ 51
4.3.1 EMC ................................................................................................................... 51
4.3.1.1 EMC test in charging phase ........................................................................ 51
4.3.1.2 Conducted EMC for power electronics ........................................................ 51
4.3.1.3 Magnetic fields ............................................................................................ 51
4.3.1.4 Composites and plastics ............................................................................. 51
4.3.1.5 Wireless inductive charging ......................................................................... 51
4.3.2 EMF ................................................................................................................... 52
4.3.2.1 Scientific development and trends ............................................................... 52
4.3.2.2 Product standards ....................................................................................... 52
4.3.2.3 Measurement technology LF magnetic fields .............................................. 52
4.4 Assessment ........................................................................................................... 53
4.5 Discussion and conclusions ................................................................................... 53
5 Electric Storage Systems and Electric Drive Train Technology .................................... 54
5.1 Introduction ............................................................................................................ 54
5.2 State-of-the-Art ...................................................................................................... 54
5.2.1 Battery ............................................................................................................... 54

Deliverable D1.1
ELVA 5 SCP0-GA-2010-265898
5.2.2 Drive train and brakes ........................................................................................ 56
5.2.3 Charging ............................................................................................................ 60
5.2.4 Thermal management ........................................................................................ 64
5.3 General technology outlook up to 2030+................................................................ 66
5.3.1 Market Analysis .................................................................................................. 66
5.3.2 Battery ............................................................................................................... 68
5.3.3 Drive train and brakes ........................................................................................ 69
5.3.4 Charging ............................................................................................................ 70
5.3.5 Thermal management ........................................................................................ 71
5.4 Discussion and Conclusions .................................................................................. 72
6 Brake System Technology and Related Active Safety ................................................. 74
6.1 Introduction ............................................................................................................ 74
6.2 State-of-the-Art ...................................................................................................... 74
6.3 General Technology Outlook up to 2030+ .............................................................. 75
6.4 Stability Control Functions and Driver Assistance Systems ................................... 79
6.5 Discussion and Conclusions .................................................................................. 81
7 State-of-the-art and trends in active and passive safety ............................................... 83
7.1 Introduction ............................................................................................................ 83
7.2 Active Safety .......................................................................................................... 85
7.2.1 DAS and ADAS systems .................................................................................... 85
7.2.2 Assessment methods ......................................................................................... 86
7.3 Passive safety ....................................................................................................... 87
7.3.1 Structural Components of Vehicles .................................................................... 87
7.3.2 Compatibility and Restraint Systems .................................................................. 89
7.3.3 Crash Standards ................................................................................................ 92
7.3.4 Requirements on electric vehicles and systems ................................................. 95
7.4 Discussion: outlook for 2020+ ................................................................................ 98
8 Discussion and Conclusions ...................................................................................... 100
8.1 Main drivers and trends ....................................................................................... 100
8.2 Light weight design .............................................................................................. 101
8.3 EMC .................................................................................................................... 102
8.4 Electric storage and drive train technology .......................................................... 102

Deliverable D1.1
ELVA 6 SCP0-GA-2010-265898
8.5 Brake technology ................................................................................................. 103
8.6 Vehicle safety ...................................................................................................... 103
9 Glossary .................................................................................................................... 105
10 Literature ................................................................................................................... 107

Deliverable D1.1
ELVA 7 SCP0-GA-2010-265898
1 Introduction
The objectives of WP1 of ELVA are to:
Identify societal and technological scenarios for 2020 and beyond
Identify future market needs and customer requirements for the EV in 2020 and
beyond
Translate input collected into vehicle specification supporting the development of
electric vehicle concepts in WP2 and 3
In this way WP 1 provides the framework to develop the different vehicle concepts which is
the core objective of the project. This report deals with the first objective of WP1 ―Identify
societal and technological scenarios for 2020 and beyond‖ and for this purpose a review of
existing future societal and technological developments has been carried out. The results of
this review are reported in the following chapters.
The review is divided into two parts:
A review of European and global roadmaps, strategy papers etc. for future road
transport in order to identify the main drivers and trends in our society. This review
will be presented in chapter 2.
An analysis of the state-of-the art and future trends of the vehicle technology and
standards in some specific areas relevant for the development of future EVs. This
analysis is based on various technology studies and discussions with experts in the
relevant technology fields. This analyses is presented in the chapters 3-7 and
concerns the following topics:
o Light weight material concepts and vehicle architectures (chapter 3)
o Electro-magnetic compatibility (EMC) (chapter 4)
o Electric storage systems and electric drive train technology (chapter 5)
o Brake system technology with recuperation management and related active
safety (chapter 6)
o Active and passive safety including crash compatibility (chapter 7)
It should be noted here that technology is one of the important drivers in our society and
consequently also in chapter 2 some technology trends are included. However, they are
presented on a more general/generic level than in the technology focused chapters.
Preliminary findings of the review have been presented at a workshop in Brussels on 28
February 2011 attended by ELVA partners, members of the Advisory Board as well as other
stakeholders. The feedback received during this workshop is incorporated in this report.
A discussion and conclusion section concludes this report.

Deliverable D1.1
ELVA 8 SCP0-GA-2010-265898
2 Driving forces and societal scenarios
2.1 Introduction
The review in this chapter is based on more than 40 reports and studies describing the future
development of societies. The main purpose of this report is to summarise and structure the
material, analyse and define the main driving forces as well as describe basic interactions
and some of the relations. It also describes some fact and figures of the society by 2020 and
later, based upon the reports.
Most of the reports are based on the work of teams of experts, predicting the most likely
trends for various aspects included in the reports. Some other reports define targets for
instance for the year 2050 and may be defining extreme scenarios and back-casting from
that what will happen in the meantime. The findings from our study will serve as inspiration
and guidelines for the continued work in the ELVA project.
In section 2.2 the most important societal scenarios will be discussed. In section 2.3 the main
driving forces included in the various studies will be presented. They have been organised in
a structure similar to the ERTRAC report [1] (see also Annex A): Environment & Economy,
Society & Culture, Public Policies and Technology. Since Technology is also covered in the
remaining chapters of this report it will not be addressed as a separate sub-section under
driving forces. Trends in the market for electric vehicles will be presented in section 2.4.
Discussions and conclusions are included in chapter 2.5.
Fig. 2-1: A sustainable transport system is safe, energy efficient with no or low emissions,
and affordable [6]

Deliverable D1.1
ELVA 9 SCP0-GA-2010-265898
2.2 Scenarios
Several of the reports studied have the time frame 2030-2050, but the time frame for ELVA is
shorter: 2020+. To predict or describe a scenario 20-40 years ahead is associated with a
very high uncertainty. Several reports argue that on the other hand 10 years may be a short
period and not much may happen to our society by 2020. But it should be realized that the
actions taken (or rather not taken) today (year 2011) will effect and shape the future society.
In spite of that may be for 2020 not too much will change in our society it is good to look
ahead since cars developed for 2020+ may still be around up to 2040 and some of the long
term predictions may already influence the design which enters the market 2020+.
The reports studied are in general rather consistent as far as predictions are concerned. One
reason might be that the source material origins from traditional information channels and the
other reason might be that most of the predictions are based on extrapolations from today.
Most businesses today have long-term strategies in place which are based on the most
likely, foreseeable future developments. However, recent history has proven that contingency
planning based on different scenarios is gaining importance. Extreme scenarios can help
broaden decision makers‘ awareness of future developments which are not very likely, but
which could potentially have a fundamental impact on the industry or on specific companies.
Some of the most applicable scenario references for the ELVA-project are ERTRAC [1] and
SEVS [6] both with year 2030+ as time frame, as well as the ―Roadmap 2050, a practical
guide to a prosperous low-carbon Europe‖ [4] and the ―Shell energy scenario‘s to 2050‖ [7].
The methodologies used in these studies are rather different (forecasting vs. so-called back
casting), but they are quite unified regarding the driving forces. For example there is a
consensus regarding relation between population and economic growth and the urbanisation
trends (especially in the emerging countries and toward the development of mega cities).
Other important driving forces are the politician‘s pro-activity regarding incentives and
disincentives that will have a huge impact on customer‘s choice of transportation solutions
and in turn the penetrations of more energy efficient solutions like EVs. Individual values,
attitudes and lifestyle will also have a strong impact not only on the product and services
used by themselves but also on the business operations and the service providers. There is
also a common concern regarding climate change, congestions, safety and security and
limited energy resources.
In 2009 EU and G8 leaders agreed that CO2 emissions must be cut by 80 % by 2050, if
atmospheric CO2 is to stabilise at 450 PPM- and global warming stay below the safe level 2
degrees C. But 80 % decarbonisation overall by 2050 may require 95 % decarbonisation of
the road transport sector [4]. With the number of cars set to rise to 2.5 billion worldwide by
2050 (according EC 2010 [3]), this is not achievable through improvements of ICE. Ref. [4]
uses the back casting methodology and concludes that it is possible to fulfil the above targets
by 2050 but the transition needs to start immediately. They also conclude that there is not a
single solution, but rather a mix of both technologies and societal aspects.
The ERTRAC scenarios were prepared by ERTRAC stakeholders and other technical
experts, and are based on a comprehensive review of previously published information
related to energy, environment and mobility. The scenarios foresees (i) the most likely
outcome, called the ‗common sense‘ scenario; (ii) a more ‘enthusiastic’ alternative; and

Deliverable D1.1
ELVA 10 SCP0-GA-2010-265898
(iii) a more ‘pessimistic’ alternative. Fig. 2-2 illustrates the ERTRAC scenario process and the
3 resulting scenarios for 2030.
Fig. 2-2: ERTRAC scenario process [1]
The ―‖Shell energy scenario‘s to 2050‖ [7] report identifies 2 possible scenarios for 2050:
- The Scramble scenario that outlines the future consequences of pursuing the path
of least resistance now and postponing decisions to the future
- The Blueprints scenario that indicates a more pro-active approach based on supply
concerns, environmental interest and associated entrepreneurial opportunities
resulting in a significantly more positive outcome.
In the SEVS project [6], 4 societal scenarios have been specified that are illustrated in Fig. 2-
3. The scenario process in SEVS is the result of a detailed analysis of groups of driving
forces including demographic trends, life style changes, politics, environmental impact etc…
Two of the driving force groups namely ―politics‖ and ―personal values‖ were identified as
drivers with the largest uncertainty and with the largest impact on a future sustainable and
safe transport system. The 4 resulting scenarios have been based on these two groups of
drivers. The x-axis corresponds to personal values (in particular concerning travelling) and
the outcome of this driving force varies from no change (left) to radical change in
transportation patters (right). The y-axis corresponds to politics (in particular concerning
transportation legislation and incentives) and varies from political passive (bottom) and
proactive political control (top). The resulting scenarios in the 4 quadrants are denoted:
Incremental development, eco political, eco individual and radicalism in harmony,
respectively.

Deliverable D1.1
ELVA 11 SCP0-GA-2010-265898
Fig. 2-3: Four different societal scenarios resulting from the SEVS project [6]
The conclusion is that the scenarios included in the various reports are of interest as a
reference platform for ELVA but that the underlying driving forces, societal as well as
technology, and how they relate to each other, are even of greater interest. The four extreme
scenarios defined in the SEVS project might be good as a reference platform when
discussing the timeframe and the actions to take in ELVA.
2.3 Main driving forces
Based on the reports reviewed a large number of driving forces were identified. They have
been structured taking the four ERTRAC categories (Environment & economy, Society &
Culture, Public Policies and Technology) as a basis [1]. Annex A illustrates the selected
structure were it should be realized that the positioning of some of the sub (and sub-sub etc.)
categories is rather arbitrary. For instance ―increased mobility needs‖ which is a sub-sub
category under the sub category ―economic growth‖ could have been put also under ―Society
and Culture‖. In fact many of the categories are strongly related and will influence each other.
Since ―Technology‖ is also covered in the remaining chapters of this report it will not be
addressed as a separate sub section under driving forces in this chapter 2.
2.3.1 Environment and economy
Regulatory actions taken by governments worldwide are now clearly pushing the auto
industry toward much more aggressive adoption of vehicle electrification. Many of these
initiatives can be traced back to rising concerns about greenhouse gas concentrations, and
the Kyoto Protocol of 1997.
In 2006 Sir David Stern published the first major research [14] which looked into the
economic consequences of climate change and rising GHG emissions. Stern concluded that
a rise of global temperature by more than 2°C would inevitably change global economic
conditions and could result in irrevocable changes to the way people live, work and
consume. The review argued that to prevent this from happening immediate policy change is
Deliverable D1.1
ELVA 12 SCP0-GA-2010-265898
required. An IEA (International Energy Agency) report published in 2008 indicated that in
order to limit the global increase in temperature to 2°C, atmospheric CO2 levels would need
to be limited to 450 parts per million by 2030 [25].
The transportation sector would need to pursue dramatic change, as it accounts for 44 % of
total CO2 emissions. To achieve the ―Scenario 450‖, light vehicles would need to reduce CO2
emissions by at least 49 % by 2030. In order to achieve this average output for the total light
vehicle stock, new vehicles would need to reduce emissions to an even larger extent. On
July 8, 2009 all members of the G8, pledged to adopt regulations which would limit the rise in
global temperature to 2°C [14].
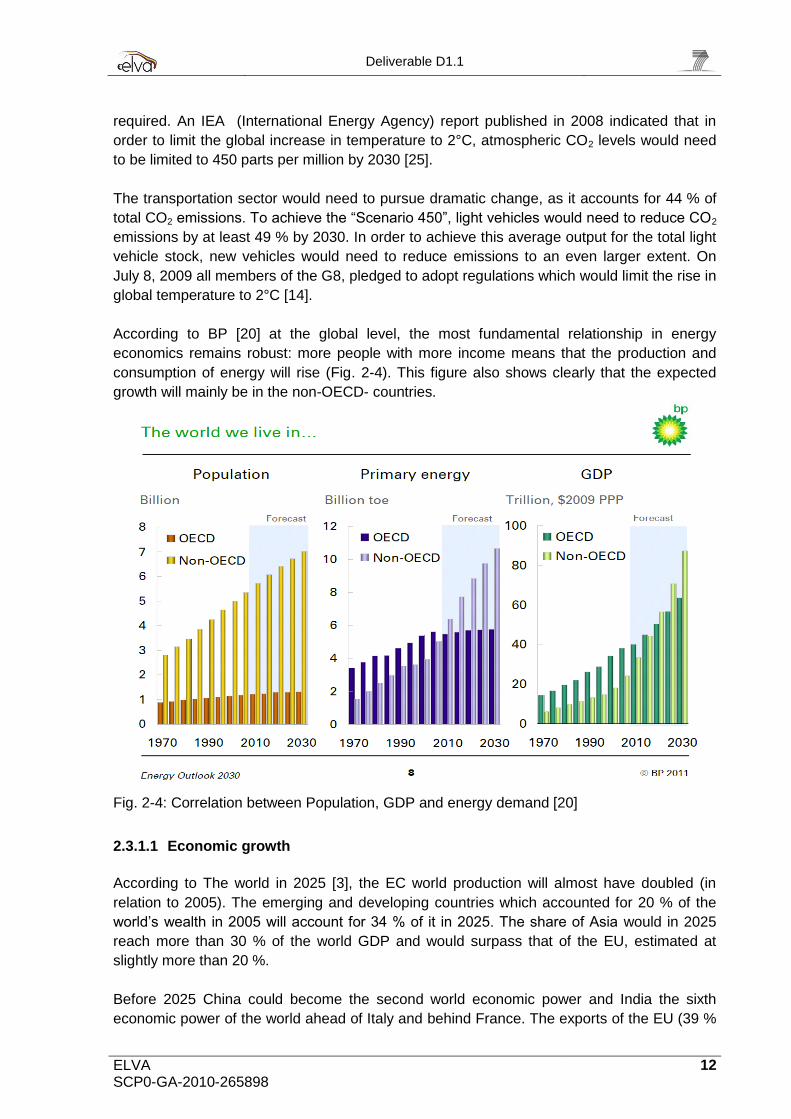
According to BP [20] at the global level, the most fundamental relationship in energy
economics remains robust: more people with more income means that the production and
consumption of energy will rise (Fig. 2-4). This figure also shows clearly that the expected
growth will mainly be in the non-OECD- countries.
Fig. 2-4: Correlation between Population, GDP and energy demand [20]
2.3.1.1 Economic growth
According to The world in 2025 [3], the EC world production will almost have doubled (in
relation to 2005). The emerging and developing countries which accounted for 20 % of the
world‘s wealth in 2005 will account for 34 % of it in 2025. The share of Asia would in 2025
reach more than 30 % of the world GDP and would surpass that of the EU, estimated at
slightly more than 20 %.
Before 2025 China could become the second world economic power and India the sixth
economic power of the world ahead of Italy and behind France. The exports of the EU (39 %
Deliverable D1.1
ELVA 13 SCP0-GA-2010-265898
of the world volume in 2005) could account for 32 % while the share of Asia increases from
29 % to 35 % [3]. Asia catches up with the US and EU in the area of research.
Globalization
In coming years the gap between emerging and developed countries in terms of trade power
will narrow. Logistics service providers in emerging markets will need to prepare for new
market structures. As logistics costs, as a proportion of total costs, continue to rise,
investments in improving efficiency will continue to gain momentum.
The establishment of free trade zones and resulting increases in foreign direct investment
will lead to above-average growth of the transportation and logistics industry in emerging
markets. In 2010 China and ASEAN1 established the world‘s third largest free-trade area
after the EU and the NAFTA. Foreign direct investment represents the most important source
of capital for emerging markets. In the emerging markets, the number of free trade zones is
expanding rapidly. Free trade zones have also been established in Brazil, China, Mexico,
Russia, South Africa, Turkey and additional emerging markets. China and some other
emerging countries outside of BRIC are increasingly making investments within other
emerging markets.
Privatisation will continue to be critical in emerging markets. The courier, express and parcel
(CEP) market is one of the strongest growing sectors of the T&L industry in a number of
emerging markets.
According to PWC [26], China has the world‘s largest population and India has the world‘s
fastest growing population. China currently holds a strong advantage, with significantly
superior infrastructure in place compared to India, and a respectable ranking of #27 on the
World Bank‘s Logistics Performance Index2. Seven of the world‘s twenty largest ports are
located in China. China is Brazil‘s largest trading partner.
The Transport & Logistic industry plays a crucial role in the China‘s future economic
development and promises strong and stable growth opportunities through 2030 [26].
China‘s emergence as a global economic player has been accompanied by a major internal
transformation. The economy has shifted from complete reliance on state-owned and
collective enterprises to a mixed economy where private enterprise plays an important role
and the number of state-owned enterprises has declined significantly.
China is the most important contributor to the enormous growth potential of the Asian CEP
market and the logistics sector is expected to growth [26].
The private sector is likely to play an increasingly important role in India’s transportation and
logistics industry in the future [26]. Goods transportation by road is almost entirely in private
1 The Association of Southeast Asian Nations (ASEAN), originally including Brunei, Indonesia, Malaysia,
Philippines, Singapore and Thailand, established the ASEAN Free Trade Area (AFTA) in 1992. 2The Logistics Performance Index is based on a worldwide survey of operators on the ground (global freight
forwarders and express carriers), providing feedback on the logistics ―friendliness‖ of the countries in which they operate and those with which they trade. They combine in-depth knowledge of the countries in which they operate with informed qualitative assessments of other countries with which they trade, and experience of global logistics environment.

Deliverable D1.1
ELVA 14 SCP0-GA-2010-265898
hands while bus operations are mostly in government hands. Levels of dissatisfaction about
the reliability, punctuality and quality of services from these organisations seem to be on the
rise among users. Attractive business opportunities will arise not only due to the increasing
demand for logistics services, but also from the market‘s high inefficiency and fragmentation
[26].
The establishment of free trade zones in Brazil has fostered strong economic growth, as
these have realised above national average growth and accelerated transport flows in the
designated regions [26]. Logistics service providers will profit from the upcoming mega-
events and the increased investment flows in the short and medium term.
Multinationals dominate the logistics demand in Mexico and have driven its growth
significantly. Mexico‘s logistics market will continue to expand in upcoming years. According
to PWC [26] more than 90 % of Mexican trade is under free trade agreements with more than
40 countries and regions, including the EU, Japan, Israel and much of Central and South
America. At the national level, greater attention to policies for regional development, anti-
corruption and bribery and functioning law enforcement would drive important and
sustainable growth for the logistics industry in Mexico.
In the future the logistics industry in Russia may benefit more from its geographic location
connecting East Asia and Europe. Introduction of port special economic zones will stimulate
internal and external trade flows between Asia, Europe and North America [26]. Russia today
is not considered as an important transportation corridor, as the main trade between Europe
and Asia takes on seaways. Russia will aim to take advantage of its beneficial position in the
future. In order to realise this vision, Russia needs to develop its railways and roads in order
to ensure rapid and cost-effective transportation options.
The Russian government is drafting policies directed at changing the state‘s export structure
from exporting primary products and resources to exporting integrated and advanced
technology products and services. This will stimulate the development of new transportation
corridors.
South Africa will become the starting point of a new transport corridor to Asia. Significant
investments in transport infrastructure and the logistics industry in Africa are needed since
the emergence of China as one of South Africa‘s main trading partners. African logistics
service providers who actively operate on the new transport corridor Africa - Asia will be able
to profit from growth. South African road-based logistics service providers are affected by
consolidation processes driven by the fast-moving consumer goods sector. Other modes of
transport are still dominated by a state-owned enterprise [26].
Turkey has a great deal of potential with its young population and its dynamic market
conditions. Turkey basically aims at minimising state involvement in industrial and
commercial activities and maximising private sector participation. The privatisation process
will mainly be completed by 2020, meanwhile being a market opportunity for investors in
transport infrastructure or for transport operators. The country‘s strategic geographic location
ensures a prominent role within future transit networks [26].

Deliverable D1.1
ELVA 15 SCP0-GA-2010-265898
Infrastructure
The quantity of goods needed to serve the world's rapidly growing global population will
increase over the next twenty years [26]. At present, industrialised countries look likely to
continue to keep a leading position in terms of transport infrastructure provision. While many
emerging countries are recording record levels of investment in transport infrastructure, they
are unlikely to bridge the existing gap completely by 2030. Currently transport infrastructure
investments tend to follow global capital flows; in practice this means transport infrastructure
investments focus on urban areas, and fast growing cities and mega cities.
Governments will need to take actions which help manage demand, including regulatory
measures such as road tolls or congestion charges, as an attempt of reducing traffic volumes
and by generating funds to reinvest in transport infrastructure.
With regards to the growth prospects of emerging countries, large investments are needed in
transport infrastructure development since today logistics service providers face significant
difficulties in transport operation. They will need to develop innovative supply methods (local
adaptability, simplicity). Logistics service providers looking to make strategic decisions about
entering new markets need to understand those markets fully; this means assessing both the
probable availability of capital and the willingness of governments to invest in transport
infrastructure. Public authorities and private investors will need to investigate various options
for sharing responsibility and risk [26].
The presence or absence of transport networks, which facilitate efficient supply chains, is
already a factor in investment decisions around the world; the ability to offer a solid
infrastructure is likely to become an even more important criterion in determining a country's
or region's competitiveness in the future. Trans-European transport networks (TEN-T) policy
has much increased the coordination in planning of infrastructure projects by the member
states in Europe. Transport infrastructure remains a deciding factor for the economic
prospects of a country [26].
Complexity and uncertainties
The complexity in the automotive industry will continue to increase because the future
transport solutions will be a part of a sustainable transport solution on a higher system level
e.g. city level. The vehicles and transport services will have to interact with several new
actors globally and locally [6]. Companies will need to develop or fine-tune their own specific
strategies for operating in diverse emerging markets. They will need to understand how
government regulation in each market affects them e.g. changing customs procedures, the
establishment of free trade zones, incentives for foreign direct investment or new
sustainability requirements. The larger and financially-better equipped companies will target
growth by looking for suitable mergers and acquisitions. Leading local players will become
increasingly important as partners and collaborators for multinationals from around the world.
Growth in developing countries contributes to volatility in global currency markets and to
protectionist sentiment in the developed world, for example different growth rates across
various emerging markets mean that rising labour costs can quickly change the relative
attractiveness of manufacturing locations.
Deliverable D1.1
ELVA 16 SCP0-GA-2010-265898
The rapid growth of cities and the growth of urban concentration, accompanied by a stronger
connectivity at the local and even international level (ICT), will cause at the same time very
complex (in particular ecological and social) challenges and opportunities (for example,
economic and cultural ones). The development of the future xEV market is highly dependent
on the customer‘s demands and the political regulations [6]. Politicians in so called smart
cities might legislate that only zero emission vehicles are permitted to drive in central cities.
Visionary governments may even go so far as to construct Eco-Cities. Other example is the
government‘s directions in China (5 years program) that might also have a strong effect on
the market penetration of xEVs by 2020.
Manufacturing and supply chain planners must deal with rising complexity. Companies must
continuously optimize their supply chains. Some companies are preparing splintering their
traditional monolithic supply chains into smaller and more flexible ones. They also treat their
supply chains as dynamic hedges against uncertainty by actively and regularly examining
their broader supply networks with an eye toward economic conditions five or ten years
ahead. In doing so, these companies are building diverse and more resilient portfolios of
supply chain assets that will be better suited to thrive in a more uncertain world.
The world‘s supply networks are changing. New trade corridors between Asia and Africa,
Asia and South America and within Asia will re-chart global supply chains. Trade volumes
will shift towards emerging markets and least developed countries will take their first steps
into the global marketplace. Turkey‘s growth is related in part to its geographic location which
serves as an important trade corridor between Europe and the Middle East.
Mobility needs
Transportation needs are growing strongly around the world. Continuing globalisation,
coupled with high growth rates of population density and GDP in some regions, means that
the flow of goods and people will continue to increase over time. Global trade in goods and
services is likely to rise more than threefold to US$27 trillion in 2030 [26].
According to Frost & Sullivan [13], there will be a strong need for increased mobility,
European Prediction for 2000-2020: freight transport: +50 %, passenger transport: +35 %
and Western Europe traffic growth at 2 % per year.
Traffic density
The traffic density, especially in mega cities, will continue to increase. City planning will be
even more important as well as individuals‘ choice of transport solution. In cities there will be
a diversity of vehicles, and by 2030 there might be 2-wheelers and double lanes which will
increase the transport capacity [6].
2.3.1.2 Energy and resources
According to IEA [25], BP [20] and Shell [7], the global energy consumption growth will
continue, driven by industrialisation in the emerging regions – but efficiency improvements
are likely to accelerate. The net effect is although that global oil demand will increase.

Deliverable D1.1
ELVA 17 SCP0-GA-2010-265898
A greater diversity of resources delivers greater security of supply, which is an outcome
policymakers are likely to seek. The rationale for using a mix of sources rather than a few
technologies is that most technologies do not have sufficient theoretical capacity to supply all
demand, the EU‘s dependency on non-EU countries decreases and a more reliable energy
sourcing is achieved. A system that is less dependent on fossil fuels is more resilient against
resource depletion as well as cost dynamics related to the volatile global supply-and-demand
[4]. This requires closer transnational cooperation in transmission infrastructure, resource
planning, energy market regulation, and systems operation.
Energy demand
According to the IEA [25] in 2025 the world energy demand will have increased by 50 % in
relation to 2005 and will reach 15 billion tons oil equivalent. IEA estimates that from now to
2030 coal consumption, in particular for power stations in China and India, will increase by
more than 50 % (Fig. 2-5).
The fuel mix changes relatively slowly, due to long asset lifetimes, but gas and non-fossil
fuels gain share at the expense of coal and oil.
Fig. 2-5: Consumption growth [20]
Energy supply
Oil production will have started to stagnate (peak) and coal is expected to become the first
energy source between now and 2050. Meeting the expected growth will rely more and more
on alternative sources of energy supply, like natural gas liquids, bio fuels and unconventional
oil. But in 2025 oil will still largely be in the lead. Transport is still 97 % dependent on fossil
fuels, which has negative implications also for the security of energy supply.
The share of carbon-based energy should remain very largely dominant in 2030: Fossil fuels
(oil, coal and gas) account for 80 % of the world‘s primary energy mix while nuclear and

Deliverable D1.1
ELVA 18 SCP0-GA-2010-265898
renewables (hydro, wind, solar, etc.) account for 10 % each. In 2030, the European Union
will import almost 70 % of its energy needs.
According to BP [20], the global fuel mix continues to diversify and for the first time, non-
fossil fuels will be major sources of supply growth (Fig. 2-6). Energy policy and technology
lead to a slow-down in the growth of CO2 emissions from energy use, but not fast enough to
put the world on a safe carbon trajectory. OECD oil demand has peaked in 2005 and by
2030 will roughly be back at the level of 1990. Bio fuels will account for 9 % of global
transport fuels. Finally, China will be the world‘s largest oil consumer.
Fig. 2-6: World power generation [20]
Electric infrastructure capacity: the electricity demands of EVs are not expected to
overwhelm electric utilities‘ capacity. Only 4 % of electric utility capacity would be consumed
if 25 % of all U.S. vehicles were powered by electric [14]. Electric distribution infrastructure
could be strained during peak charging times, or in specific areas (such as a parking lot) that
have a disproportionate number of vehicles charging at once. Electric vehicle service
companies have focused on network management systems and software in order to
communicate with vehicles and/or charge points in order to ensure that this does not occur.
Israel Electric Corp estimates that, in a scenario where all Israeli vehicles are EVs by 2020,
they would require zero additional generation and transmission assets given the interaction
of EV service provider Better Place. If charging were done on an ad-hoc basis, generation
assets would have to increase by 21 % and transmission / distribution assets would have to
increase significantly [14].

Deliverable D1.1
ELVA 19 SCP0-GA-2010-265898
Energy price
The high energy prices will affect the total cost of transportation. Deutsche Bank‘s [14]
Integrated Oil Research Team sees potential for oil prices to rise dramatically, including
potential for a brief spike to $ 175 per barrel, given limited excess supply, rising demand, and
chronic underinvestment in new oil production. According to the IEA projection [25] fuel
prices are assumed to increase. Prices of coal and gas will increase by about 60 % over the
next 40 years, which is equivalent to a 1 % annual increase (in real terms). It will also
stimulate the penetration of alternative drive trains. The ERTRAC Strategic Research
Agenda shows the road transport energy source and propulsion technology towards 2050
(Fig. 2-7).
Fig. 2-7: ERTRAC transports evolution toward 2050 [36]
Resources available
Around 2025 the energy question should remain a source of major tension (economic and
geopolitical) due to the likely ―oil peak‖ and the energy needs of a world of 8 billion
individuals. The tensions will be both between production and consumption patterns and
between production/consumption patterns and natural resources.
The recycling of raw materials will become an important industrial activity. China accounted
for more than 50 % of the growth of the world consumption of industrial metals between 2002
and 2005. In the future the growth levels of emerging countries will maintain a high pressure
on the demand for raw materials. Many countries that are rich in resources apply
protectionist measures which stop or slow down exports of raw materials to Europe in order
to support their downstream industries.

Deliverable D1.1
ELVA 20 SCP0-GA-2010-265898
The leading producers and exporters of lithium ore today are Chile and Argentina, with the
largest reserves known to exist (and which are largely untapped) in Bolivia, along with lesser
amounts in China, Russia and North America. China and Russia are importers of lithium from
Chile, which is less costly than mining their own. Lithium can be recycled and reused, like
most other battery chemistries. The auto batteries are some of the most recycled consumer
item in the world, so a model for recycling already exists. Other materials in batteries that
also must be handling are e.g. copper and permanent magnets.
According to EC [3], 1.1 billion inhabitants do not have access to clean water today. In 2025
it is estimated that 3 billion people will not have clean water. The need for water will increase
sharply with the increases of the world population and of the rise in the standard of living in
emerging countries, creating strong tensions with the quantities available which are likely to
decrease due to climate change.
Climate changes may destroy important agriculture areas and this in combination with the
population growth will influence the future food prices [6].
2.3.1.3 Climate Change
Transport infrastructure and transport networks have profound effects on the environment.
These impacts will need to be assessed from a holistic, long-term perspective to ensure that
greenhouse gas emissions and other negative impacts on the environment are minimised.
Energy policy is driven by security as well as by climate change concerns. Measurements
taken by scientists since 2000 have shown that the world emissions of carbon dioxide grow
now more quickly than the most pessimistic scenario of IPCC [23].
Congestion
According to most of the reports in this study, the overall transportation is expected to
increase and the congestion will follow. According to Frost & Sullivan [13] the number of
vehicles increases five times faster in developing countries and the costs of congestion are
estimated to be 120 billion annually. Regulatory measures can help to provide funds to
reinvest in transport infrastructure and to reduce traffic volumes. Efficient pricing based on
external cost matches supply and demand at its most efficient point, leading to direct
economic benefits by reducing externalities, (i.e. congestion, pollution). Large-scale
implementation of road pricing is foreseen, so users as well as companies will have to pay
for the transportations in future [26].
Pollution
According to F&S, transportation equates to 21 % of emissions in which road transport
account for 71 % [13]. Air pollution caused by traffic is associated with nearly 700,000 deaths
per year, and this number is increasing [13]. CO2 emissions from road transportation are
growing at a rate of 29 % in Europe [13]. Emerging public health data on the impact of nano
particulates from diesels and other sources are said to be even more damning [6].

Deliverable D1.1
ELVA 21 SCP0-GA-2010-265898
2.3.1.4 Sustainability matters
Environmental costs will become an integral part of assessing the full costs of a transport
solution taking into account the entire life cycle of construction, operation and deconstruction
[26]. Holistic and environmental compatibility methods need to be implemented so the
transport sector can collaborate and thereby reduce emissions and congestions
[26].Transport solutions will increasingly be assessed on environmental compatibility.
Sustainability will also continue to gain in importance, so applying analyses or total value of
ownership methods will be critical [26]. An emphasis on innovation will also be critical in
finding more eco-friendly transport solutions.
2.3.1.5 Efficiency – downsizing
In July 2009, the leaders of the European Union and the G8 announced an objective to
reduce greenhouse gas emissions by at least 80 % below 1990 levels by 2050. In October
2009 the European Council set the appropriate abatement objective for Europe and other
developed economies at 80-95 % below 1990 levels by 2050 [4]. Achieving the 80 %
reduction means a transition to a new energy system both in the way energy is used and in
the way it is produced. It is virtually impossible to achieve an 80 % GHG reduction across the
economy without a 95 to 100 % decarbonised power and transport sector. Fig. 2-8 shows
that the transport sector has reduced during the last 10 years their emissions and is
expected to continue the reduction to almost half by 2020 compared to 2000 (EU) [16].
Fig. 2-9 shows that according to ECF [4], even though the carbon emissions have been
reduced, more efforts are needed to reduce emissions. The staples in the picture shows that
the emissions from transportation and energy use , between 2010-2050, will increase, while
the staple to the right shows the decarbonisation target by 2050. Notice the emission gap
between the predicted emissions by 2050 compared to the EU targets by 2050.
Fig. 2-8: The average Carbon Emission [14]

Deliverable D1.1
ELVA 22 SCP0-GA-2010-265898
Fig. 2-9: Nearly full decarbonisation in transport [4]
Fig. 2-10 shows a mix of vehicles with different drivetrains that could be one possible
scenario to be achieved by 2050 [4].
Fig. 2-10: Mix of drive trains [4]

Deliverable D1.1
ELVA 23 SCP0-GA-2010-265898
2.3.1.6 Business models
According to Deutsche Bank [14] a very large market opportunity appears to be developing
through the emergence of new business models based on the cost advantage of electricity
versus gasoline driving. Combined with government incentives already in place, these
business models have the potential to dramatically lower the entry price for electric vehicle
and potentially making them cheaper to purchase and operate.
Several automakers, finance, and infrastructure companies have been discussing business
models that could help facilitate more rapid EV market penetration. An emerging group of EV
infrastructure companies believe EVs can be cheaper than ICEs, at the point of purchase
[14]. The most advanced amongst the emerging group of EV infrastructure companies,
―Better Place‖, has based its businesses on the premise that EV purchases should be
structured with a leasing of the batteries. This will move the customers initial cost from the
purchasing process to the operation/driving process, resulting in a lower purchasing price.
―They believe this will be a pre-requisite for EVs to capture a significant share of the mass.
Better Place intends to provide vehicle batteries to consumers at no upfront cost, and then
sell consumers ―Miles‖, i.e. a per mile fee, equivalent to the per mile cost of driving a gasoline
powered vehicle, which would cover the cost of the battery, electricity, widespread charging
infrastructure, and a return on Better Place‘s investment‖ [14].
Car Sharing is a financial alternative to private ownership. Environmental friendly car sharing
companies in Sweden are e.g. Move About (www.moveabout.se) and SunFleet
(www.sunfleet.com). Traditional automakers have also initiated new business models e.g.
Peugeot Mu (www.mu.peugeot.co.uk)), Daimler car sharing subsidiary car2go
(www.car2go.com) and soon coming BMW DriveNow (www.drive-now.com).
2.3.2 Society & Culture
Several of the reports refer to the strong correlation between population and economic
growth. The emerging markets will count for the major growth and it is there that changes in
demographics and consumer behaviours could have the most significant impact of the future
society as well as business [26].
2.3.2.1 Population Growth
Population growth and the density are key indicators for the assessment of future needs for
private and public transportation needs. The world‘s population is continuing to expand and
is expected to grow by 20 % to reach 8 billion inhabitants, by 2025 [3]. According to the
United Nations [3], 97 % of this growth will occur in the developing countries (Asia, Africa),
resulting in that 61 % of the world population will be in Asia by 2025 [3]. The population of
India will approach the population of China (which will have started to decrease) and will
need extensive infrastructure enhancements. The Saudi Arabia, Turkey and the United
Kingdom are also expecting significant increases in population density. The smaller
emerging economies of Vietnam and Indonesia, part of the so-called ―Next-11‖, might
become the world's largest economies in the 21st century along with the BRICs. Other
countries such as Russia will experience no change in population density, and in some

Deliverable D1.1
ELVA 24 SCP0-GA-2010-265898
countries such as Germany, Poland and Japan, population density is even likely to decrease
[26]. The European population is expected to decrease from 2012, because of the high
proportion of elderly people. In 2025, the population of EU will only account for 6.5 % of the
world population [3].
The cities in developing countries will account for 95 % of urban growth in the next twenty
years and will shelter almost 4 billion inhabitants in 2025. The number of the inhabitants of
slums at world level will double between now and 2025 to reach more than 1.5 billion.
2.3.2.2 Urbanisation
According to the European Commission in ―The world in 2025‖ [3], 11 out of the 20 first
megacities in the world (those with more than 10 million inhabitants) will be in Asia as well as
17 of the 30 towns of 5 to 10 million inhabitants and 184 of the 364 cities between 1 and 5
million.
This long-term mega trend in population movement towards the city is the result of two
underlying force fields: the exponential growth in world population (with an average growth
rate of approx. 1.2 % per annum) and the rural-urban drift (due to the relatively more
favourable socio-economic opportunities in urban agglomerations). This leads to new
challenges for policy makers, like congestion, environmental degradation and effects of
climate change. Modern network cities have turned into spearheads of (supra-) regional and
(supra-) national power, not only from a socio-economic perspective (business,
innovativeness, jobs, wealth, migration, entrepreneurial dynamics), but also from a geo-
political perspective and a technological perspective (mobility, transport and energy systems,
ICT).
Urban areas are the main drivers of growth in the European economy. A thriving urban area
must be able to ensure the sustainable accessibility and mobility of urban systems (including
logistics) and simultaneously develop effective measures to minimise its ecological footprint.
European urban areas must attract, retain and even nurture highly mobile, creative,
innovative firms. Transport infrastructure is perceived as one of the greatest economic and
environmental challenges for mega cities [26]. Whereas North American and European cities
are mostly concerned about the maintenance of their ageing transport infrastructure,
emerging cities face the challenge of rapidly building up new basic transport infrastructure
capacities, increased congestion and growing environmental awareness will prompt a
widespread division of mega cities into sub-cities. Governments must manage urban
transport infrastructure and undertake long-term transport planning in order to deliver
sustainable urban areas. Regardless of how city structures will develop, logistics service
providers will need to rethink city delivery services programmes and develop innovative city
logistics solutions (e.g. last-mile services, home deliveries) [26].
2.3.2.3 Values, attitudes and lifestyle
Environment-related requirements and the dependence on raw materials produced abroad
will push the EU towards a new way of producing, of consuming, of living, of moving, etc. It
will have to step up its efforts to become the uncontested leader at world level of this ―socio-

Deliverable D1.1
ELVA 25 SCP0-GA-2010-265898
ecological‖ transition, in particular as the world market for ―green‖ goods and services is
expected to double from 1 370 billion dollars a year currently to 2 740 billion dollars around
2020 [3]. It is the changes in social behaviour which will contribute, if they are stimulated by
appropriate policies, to a drastic reduction in energy consumption and the market penetration
of new technologies like xEVs.
By 2030 a highly integrated and service driven information society will have emerged in
which the consumer takes part actively and continuously regardless of his/her location
(home, work, commuting, leisure). Especially in the urban areas a wide variety of on-line
services provided by advanced, cheap digital outlets. To achieve sustainable transport
solutions the connectivity of people and vehicles to the infrastructure will be a pre-requisite
[8].
Eco-aware
According to Deutsche Bank [14.] an increased societal concern regarding environmental-
climate risks can and will affect purchase decisions. People will be more empowered and
well informed. They will also become increasingly watchful and wary about how companies
perform outside the manufacturing and distribution processes. Corporate social responsibility
will become markedly more important to the consumer. A number of surveys for instance
show that in many cities the modal share of cycling has grown significantly in recent years,
and this trend will continue [18].
2.3.2.4 Demand on cities
People will value cities based upon the possibility of well-being, accessibility, safety and
security, the possibility to combine and integrate work-leisure and the mobility solutions. The
vision of an ―Eco-City‖ describes a city which is designed to create the smallest
environmental footprint and lowest quantity of pollution possible [26]. An Eco-City would be
largely self-sufficient, with minimal reliance on the surrounding countryside, and use power
generated onsite from renewable energy. Further targets of such eco-cities comprise the
implementation of zero-emission transport systems, zero-energy constructions, and energy
conservation systems and devices. Eco-cities are currently planned in different countries
worldwide, e.g. Masdar City in Abu Dhabi, as well as other projects in Australia, China,
Sweden, United Kingdom and United States. Transportation would be electronically powered
and freight transport would often be located in the underground of the city, while passenger
transport can be handled via small vehicles on ground level.
2.3.2.5 Demand on mobility solutions
The consumer of 2020 is more likely to be interested in flexible access to different types of
transportation. Bundled in the price would be scalable access to additional vehicles. Lifestyle
changes will allow access to luxury or larger vehicles during weekends, as an example, while
a small, efficient vehicle will suffice for daily commuting needs. The emergence of ―mega
cities‖ and the growth in public and alternative transportation options will be a key influencer
to changing lifestyles. Multiple transportation models will be used and more than 50 % will
use the public transportation by 2020 [13]. This will necessitate the creation of a seamless

Deliverable D1.1
ELVA 26 SCP0-GA-2010-265898
mobility experience between automobiles and these alternatives. The industry will need to
respond with ownership models and technology to integrate these options. The increased
emphasis on environmental, safety, personalization, traffic congestion and alternative
transportation will have a major impact on how and what people choose for their mobility
needs. Traditional criteria such as price, reliability and brand will have much less an impact in
the decision process of the future consumer [8].
One key reason that mass commercialization of xEVs may proceed slowly over the next
decade is that mainstream retail purchasers are careful about investing in new technologies
that are not fully understood. There are a variety of uncertainties about exactly how much
money will be saved by xEVs (savings depend on uncertain forecasts of fuel and electricity
prices), how reliable and safe the batteries will be, how convenient and costly it will be to
recharge a PEV, how easy it will be to have the vehicle serviced, and how difficult it will be to
resell the vehicle. If customer expectations are inflated (by automakers, dealers, power
companies, environmental groups, and/or government officials) relative to what is actually
experienced, the reputation damage to the technology could be significant and possibly
irreparable [12.].
According to The Report of an Expert Panel [12] there are four market factors, each of which
can be influenced by public policy, that present the greatest potential for altering the
competitive position of PEVs in the vehicle market:
1. Energy prices;
2. Battery characteristics (safety, reliability, and production costs);
3. The availability of convenient and affordable recharging infrastructure;
4. The pace of progress with PEVs compared to competing technologies, such
as refinements to the internal combustion engine, conventional hybrids,
advanced bio fuels, natural gas vehicles, and fuel cell vehicles.
2.3.3 Public Policies and market trends
In July 2009, the leaders of the European Union and the G8 announced an objective to
reduce greenhouse gas emissions by at least 80 % below 1990 levels by 2050 [3]. In
October 2009 the European Council set the appropriate abatement objective for Europe and
other developed economies at 80-95 % below 1990 levels by 2050 [3].
In order to achieve its central policy objective of reducing GHG emissions by 20 % by 2020
against 1990 levels, the EU has put together an energy-policy package [3]. Transport,
accounting for about 20 % of European CO2 emissions is one of the targeted areas for
improvement, with passenger cars (12 % of total) presenting the biggest contributor. In its
effort to become the leading low carbon society the EU has put a tough regulatory framework
in place, requiring Europe to take the global lead in fuel economy improvements.
In late 2007 the European Commission introduced its regulatory framework for regulating
automotive CO2 emissions starting in 2012 [3]. The regulations target average new car fleet
emissions of 130g/km, and will be phased in through 2015 (65 % of new car sales will have
to comply in 2012, gradually rising to 100 % by 2015). For 2020 the EU target is set to 95
g/km.

Deliverable D1.1
ELVA 27 SCP0-GA-2010-265898
According to DB [14],‖it is estimated that when combining all efforts to improve the ICE that
are currently under development, CO2 emissions could theoretically be improved by an
additional 30 %-40 %, bringing the weighted new vehicle CO2 emissions down to 105-
110g/km‖. The implication is that increased electrification appears to be inevitable since it
seems to be impossible to achieve a 95g/km target using conventional ICE technology.
Given the substantially lower CO2 footprint of xEV, adding these vehicles into the mix would
bring down fleet average statistics substantially (Fig. 2-11).
2.4 Trends in the market for xEVs
DB [14] expects increasingly compelling financial incentives/penalties from governments like
rebates on high efficiency vehicle purchases and taxes on low efficiency vehicle purchases.
Congestion charges will become increasingly prevalent, providing an economic incentive for
consumers to shift away from less efficient modes of transportation. Currently 30 % of all
countries have already made the transition towards a CO2-based system. Several European
larger cities are penalizing larger gas guzzlers and favour electrified power trains through
congestion charges for inner city traffic ―feebates‖.
Governments around the world have dramatically ratcheted up subsidies for xEV purchases.
High profile programs include credits of up to $7,500 in the U.S., €5,000 in France, and RMB
60,000 ($8,800, for public use vehicles) in China. Denmark, Israel, Japan, Spain, and others
also offer substantial financial incentives for these products [14].
Fig. 2-11: Vehicle mix and CO2 emissions [14]

Deliverable D1.1
ELVA 28 SCP0-GA-2010-265898
There has also been significant financial support for manufacturers of ―advanced technology‖
vehicles, batteries, components, and infrastructure. According to DB [14] Boston Consulting
Group estimates that governments worldwide have already pledged to spend $15 billion in
this area over the next 5 years (EV projects accounted for a large proportion of the US
Department Of Energy‘s $25 billion Advanced Technology Vehicle loan and $2.4 billion grant
programs).
Part of the European fiscal stimulus has been oriented toward infrastructure for electric
driving, and build-out of battery technology [14]. For example, France has dedicated €1.5
billion on infrastructure to recharge vehicle batteries with a target of achieving 4.4 million
vehicle recharge points by 2020 and the French government is providing loans to transform
existing OEM plants into EV factories.
President Obama called for putting one million electric vehicles on the road by 2015,
affirming and highlighting a goal aimed at building U.S. leadership in technologies that
reduce U.S. dependence on oil [14]. xEVs represent in the US a key pathway for reducing
petroleum dependence, enhancing environmental stewardship and promoting transportation
sustainability, while creating high quality jobs and economic growth.
According to DB [14] the IHS Global Insight estimates that the number of xEV models will
rise to at least 150 by 2014 and that at least 200 models will be available by 2019.
Furthermore they expect HEVs and PHEVs/EVs to each represent 11 %-12 % of US market
sales (total of 23 %) (Fig. 2-12)
Fig. 2-12: US market by 2020 [14]
According to DB [14], there will be a limited demand for full hybrids, and much higher
demand for PHEVs (14 % of the market by 2020). PHEVs would enable most consumers to
perform their daily commutes almost exclusively in electric drive mode. DB [14] notes that
PHEVs are viewed as particularly attractive for larger premium vehicles, as the relative price
increase will be smaller. They also forecast that full EVs will rise to 1 % of total market by
2015 in Europe and to approximately 5 %-6 % by 2020 (Fig. 2-13).
Deliverable D1.1
ELVA 29 SCP0-GA-2010-265898
Fig. 2-13: EU market by 2020 [14]
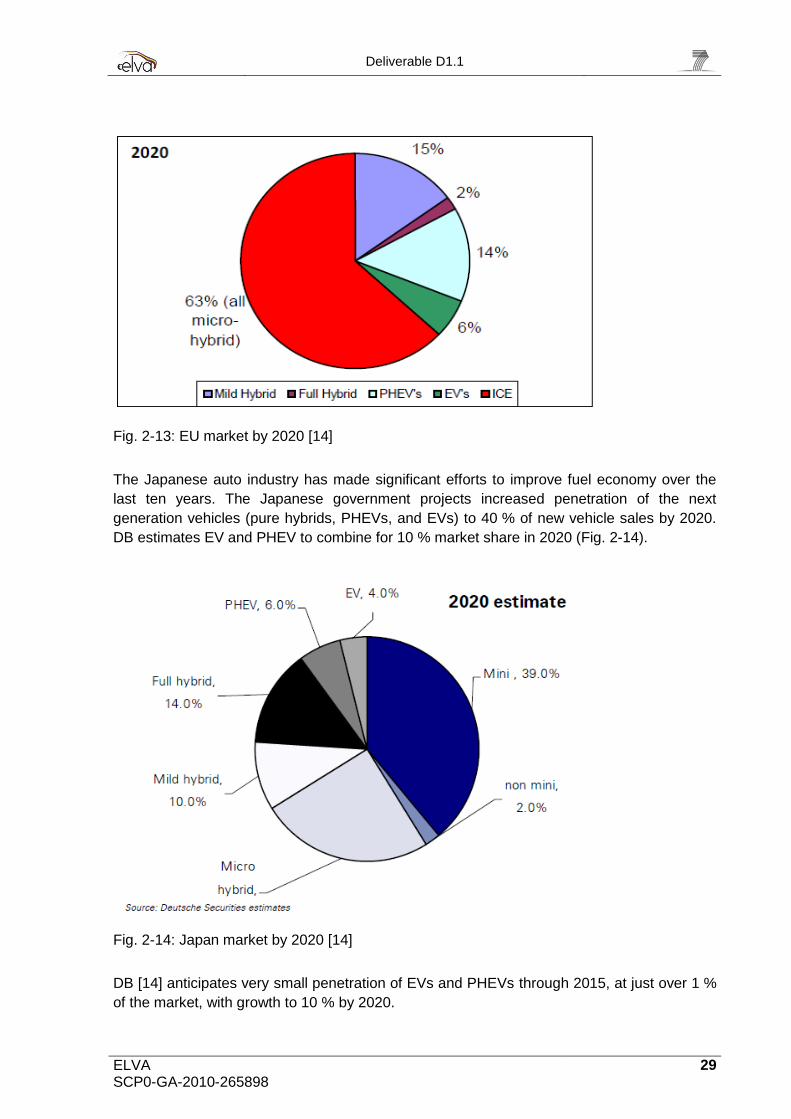
The Japanese auto industry has made significant efforts to improve fuel economy over the
last ten years. The Japanese government projects increased penetration of the next
generation vehicles (pure hybrids, PHEVs, and EVs) to 40 % of new vehicle sales by 2020.
DB estimates EV and PHEV to combine for 10 % market share in 2020 (Fig. 2-14).
Fig. 2-14: Japan market by 2020 [14]
DB [14] anticipates very small penetration of EVs and PHEVs through 2015, at just over 1 %
of the market, with growth to 10 % by 2020.
Deliverable D1.1
ELVA 30 SCP0-GA-2010-265898
Chinese policymakers and automakers have been pushing Chinese automakers to direct
resources toward the arena of ―New Energy Vehicles‖, where they feel that domestic
producers could compete on a more level playing field [14]. Many industry observers believe
that China has many other reasons to foster a large domestic EV market [14];
– China already has a strong consumer electronics and consumer electronics battery
manufacturing expertise.
– China possesses 27 % of the world‘s lithium carbonate reserves.
– The country has 80 % of the world‘s neodymium resources—a key component in the
manufacturing of permanent magnets for EV motors.
– China is likely to become increasingly dependent on foreign oil, given its rapidly
growing vehicle fleet.
Unlike Western markets, China has the ability to mandate aggressive policies, and direct
state sponsored enterprises to commit to product plans that meet national policy objectives.
The transportation sector, having seen the impact of government bans on ICE-powered
wheelers from the centres of Beijing and Shanghai which have become the world‘s largest
market for electric motorcycles, scooters, and mopeds: 20 million were sold last year.
Considering the government‘s (and Chinese automakers‘) clear intention to focus on new
energy vehicles, believes that China has potential for surprisingly rapid growth [14]
(Fig. 2-15).
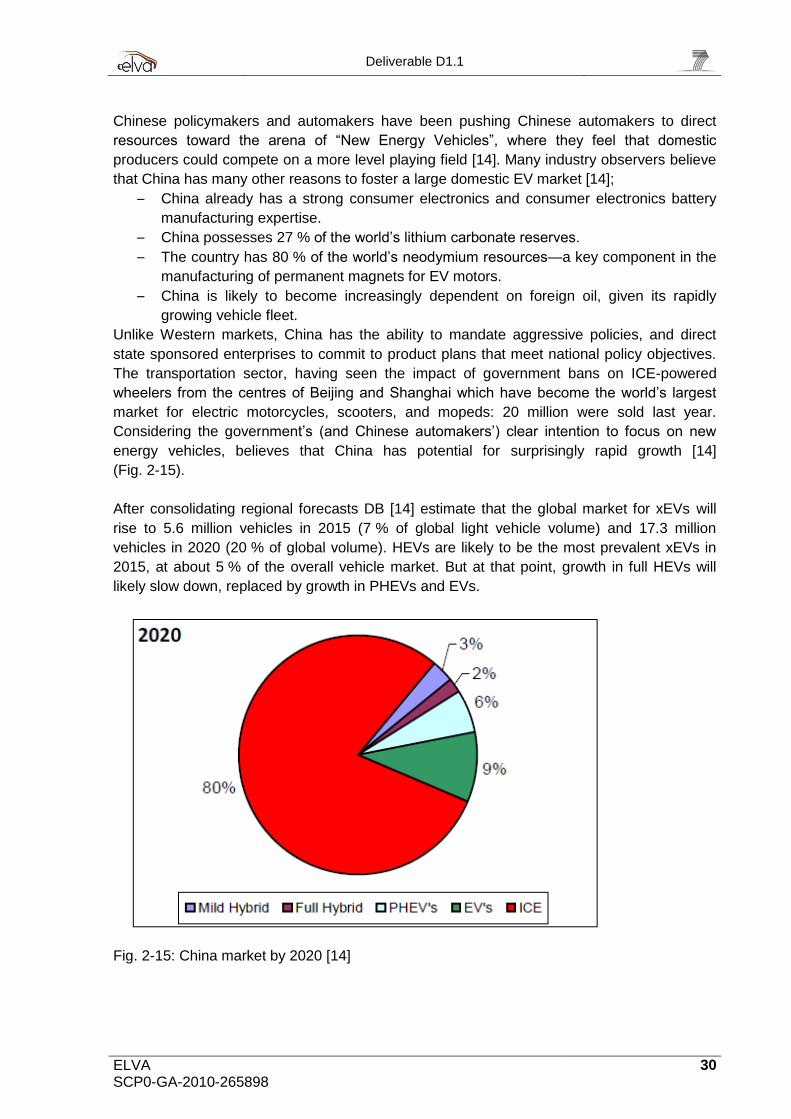
After consolidating regional forecasts DB [14] estimate that the global market for xEVs will
rise to 5.6 million vehicles in 2015 (7 % of global light vehicle volume) and 17.3 million
vehicles in 2020 (20 % of global volume). HEVs are likely to be the most prevalent xEVs in
2015, at about 5 % of the overall vehicle market. But at that point, growth in full HEVs will
likely slow down, replaced by growth in PHEVs and EVs.
Fig. 2-15: China market by 2020 [14]

Deliverable D1.1
ELVA 31 SCP0-GA-2010-265898
By 2020, DB believes PHEVs / EVs will approach 11 % of the global market, with HEVs at
just below 9 % (Fig. 2-16). By region China is expected to catch up to the US by 2020 (Fig.
2-17) but xEV adoption will likely lag in other emerging markets [14].
The government Korea believes that the country has an edge in the global electric vehicle
race as some Korean companies have leadership in battery technology [14].
Fig. 2-16: Global xEV volume by type [14]
Fig. 2-17: Global volume by region [14]

Deliverable D1.1
ELVA 32 SCP0-GA-2010-265898
2.5 Discussions and conclusions
About 40 reports have been studied. Most of them are predictions and extrapolations for
2020-2025, based on today‘s society and technology, while a few reports are descriptions of
scenarios for 2030-2050. The main purpose of this chapter is to summarise and structure the
material and identify, analyse and define the main driving forces as well as describe basic
interactions and some of the relations between these driving forces.
The reports studied are very consistent regarding the driving forces: population and
economic growth, demographical changes, urbanisation and the development of mega cities.
According to the UN [3], between now and 2025, the world population will increase by 20 %
to reach 8 billion inhabitants (6.5 today). 97 % of this growth will occur in the developing
countries (Asia, Africa), and it is expected that the quantity of goods needed to serve the
world's rapidly growing global population will increase over the next 20 years. The increased
demand of energy and other resources will follow, especially in China. Almost all reports
studied estimates that the energy demand and the CO2 emissions will continue to increase
by 2020. According to IEA [25] in 2025 the world energy demand will have increased by
50 % in relation to 2005 and estimates that from now to 2030 coal consumption, in particular
for power stations in China and India, will increase by more than 50 %.
Several reports also emphasise a common concern regarding climate change, congestions,
limited resources, and safety and security. In 2009 the EU and G8 leaders agreed that CO2
emissions must be cut by 80 % by 2050, if atmospheric CO2 is to stabilise at 450 PPM – and
global warming stay below the safe level 2 °C. But 80 % decarbonisation overall by 2050
may (according to McKinsey) require 95 % decarbonisation of the road transport sector [3].
Achieving the 80 % reduction means a transition to a new energy system both in the way
energy is used and in the way it is produced. The scenario report [4] concludes that it is
possible to fulfil the 80 % reduction by 2050 and provides a roadmap (scenario) for this. For
the transport sector, as well as for the power sector, this implies decarbonisation by 95 %,
without negative effects on safety.
Important aspects of a sustainable transportation solution are energy efficiency, reduction of
limited resources used, a fuel shift and a transition toward renewable energy resources
(RES) (on a lifecycle basis). To achieve this, three important driving forces are necessary:
1. Technology development (vehicles, batteries, infrastructure and ICT)
2. Political incentives, disincentives and legislations
3. Customer and individuals behaviour, values and attitudes
Most reports argue that the market penetration of electrical vehicles is an important part of
the solution, but it can be seen that the penetration of xEVs on the market will still be quite
modest by 2020 (see 2.4). The world market of pure EVs is estimated to be about 5 % (and
about 10 % in China) of new vehicles sold. An important technology driving force is the
development of reliable, safe, light and affordable batteries (see chapter 5). The battery
prices are expected to be halved by 2020 [14]. There are several new business model
initiatives to compensate for the high prices, e.g. Better Place. Information & Communication
Technology (ICT) is in many reports regarded as a very important technology enabler, both
regarding safety and efficiency e.g. logistic applications and sustainable management

Deliverable D1.1
ELVA 33 SCP0-GA-2010-265898
systems. ICT is also an enabler of efficient power regulation system and the energy payment
system.
The development of the future xEV market is expected to be highly dependent on political
incentives and regulations that will have a strong impact on customer‘s choice for
transportation solutions. Traditional criteria such as price, reliability and brand are expected
to have much less impact in the decision process of the future consumer. Individual values,
attitudes and lifestyle will also have a strong influence, not only on the product and services
selected, but also on the companies and the business operation itself. According to many
reports sustainability, eco-awareness and Corporate Social Responsibility (CSR) will matter
more and more, and it is probably in the emergent areas that changes in demographics and
consumer behaviours could have the most significant impact.
Large-scale implementation of road pricing, road tolls and congestion charges are foreseen
as well as actions on progressively tightening emission standards, technology development
programs and standards development for charging infrastructure. One thing is quite obvious:
users and companies should be prepared to pay more for using transport in the future.
Most businesses today have long-term strategies in place which are based on the most
likely, foreseeable future developments, but contingency planning based on different
scenarios is gaining importance, especially in times where paradigm shifts are likely.
Extreme scenarios can help broaden decision makers‘ awareness of future developments
which are not very likely, but which could potentially have a fundamental impact on the
industry or on specific companies. For instance, politicians in so-called smart cities might
legislate that only zero emission vehicles are permitted to drive in central cities (Eco-Cities).
This would probably have a huge impact on the EV market. Therefore it is not only the
scenarios themselves that are important, but also learning about the societal and technology
driving forces, and how they relate to each other and by that be prepared for ―the non-
expected‖.
One interesting finding in this study is the gap between the society predicted by 2020 and the
explorative society and EUs targets by 2050 (see Fig. 2-9). There is a strong uncertainty in
the coming years and the automotive industry will probably have to re-shape their complete
business. The automotive inertial transition pace implies that transition activities have to start
now in order to ensure a realistic pathway towards achieving the 80 % GHG reduction by
2050. The four extreme scenarios defined in the SEVS project might be good to use as a
reference platform when discussing the timeframe and the actions to take. Although the
actions taken, or rather not taken today (year 2011) will effect and shape the future society
and the sustainable road transport solutions by 2050.

Deliverable D1.1
ELVA 34 SCP0-GA-2010-265898
3 Light weight material concepts and vehicle architectures
3.1 Introduction
In order to reduce carbon emission of the vehicles and therefore to achieve the stringent
emission targets (aiming for 95 g/km CO2 emissions in 2020, Fig. 3-1), car manufacturers are
intensifying their efforts to decrease car weight. This trend requires the development of new
lightweight material concepts and architectures. The challenges in lightweight design for
innovative vehicle concepts are amplified by the ongoing electrification of the drivetrain. For
electric vehicles, due to the weight and volume of the batteries on the one hand, and the
substitution of mechanical drive train components through electric motor specific elements on
the other hand, the boundary conditions for lightweight architecture have completely changed
and the importance of lightweight materials and design will increase.
Fig. 3-1: Plan to reduce CO2 emissions in Europe [37]
In the following, different body-in-white-, chassis- and interior light weight material concepts
will be discussed by pointing out current examples. As material concepts and the chosen
vehicle architecture of the body in white are closely related, these have to be looked at
together.
3.2 Body in white material concepts and architectures
Body in white (BIW) material concepts and architectures can be categorized into three main
groups: concepts for large volume, for small and midsize volume and for high performance
cars. This categorisation is based upon the balance of investment and manufacturing costs
and the number of pieces produced. In the following paragraph, a brief overview of the State
of the Art in these three segments will be provided. Subsequently an outlook for future trends
beyond 2020 will be given.

Deliverable D1.1
ELVA 35 SCP0-GA-2010-265898
3.2.1 State of the Art
3.2.1.1 Large volume: Shell construction
Shell construction was the first approach to reduce the weight of the BIW and is today the
standard body construction method [38]. It enables the realisation of self-supporting
bodywork from formed metal sheets, which are joined together through spot welding, rivets
or bonding. For the stiff body compartment, high strength and highest strength steels are
used to limit intrusions into the passenger compartment. Due to their good formability and
high surface quality, drawing steels are applied as body shell. Relatively low material costs, a
wide range of available steel grades, freedom in design and a high possible degree of
automation are the main reasons for widespread steel application. In order to meet the high
investment costs for tooling [39, 40], it is necessary to produce in large quantities (> 1000
pieces/day).
Actually steel shell construction is the mostly used architecture to achieve the emission
targets (Fig. 3-1). This is due to the lower costs involved to weight saved ratio, compared to
other design methods. The development of AUHSS and new manufacturing and production
technologies such as tailored blanks, hydro forming, hot forming and laser welding led to
more efficient use of the material and thus to lighter BIW structures while meeting the
performance targets.
The two car body studies ULSAB and ULSAB-AVC have shown, that steel still has a high
lightweight potential. It has been proven, that with steel shell construction a weight reduction
of ca. 25 % [41], compared to the average BIW benchmark, is possible. The New Steel Body
of ThyssenKrupp is another example, demonstrating the lightweight potential of steel shell
construction. A recent exponent of the steel shell construction is the BIW of the VW Passat
(Fig. 3-2).
Fig. 3-2: The BIW of the VW Passat as an example for steel shell construction [42]

Deliverable D1.1
ELVA 36 SCP0-GA-2010-265898
In this case, the share of high strength and highest strength steels equals 82 %. Especially
the share of boron alloyed steels is expected to increase further in the next years. It is
anticipated, that the future load-carrying body structure of the passenger compartment could
consist mainly or completely of hot formed boron steels. An overall percentage of 45 % of the
body weight is estimated to be the upper limit for boron steel application in order to maintain
strength and crash performance. Fig. 3-3 shows the development of boron steel usage in
different Volvo models.
Fig. 3-3: Outlook for future applications of hot forming steels [43]
The application of aluminium increases in attached (hang-on) parts as well as in structural
parts. Besides drawing aluminium sheets that are used e.g. in door applications, extruded
sections in bumper cross members and pressure casting solutions e.g. in strut towers are
implemented. Complete aluminium shell structures (e.g. Jaguar XJ) are only a niche
application.
At present, light metals such as magnesium and titanium are limited to only a few
applications. As an example, magnesium is used in the door window frames of the Porsche
Panamera and the front-end carrier of the BMW Mini [44]. Weight reduction of 10-20 %
compared to aluminium can be reached [45]. Titanium is currently used only for specific
powertrain and chassis components. Factors limiting application of these materials are the
high material price, complex joining methods and corrosion in case of magnesium.
3.2.1.2 Midsize and small volume: Aluminium space frame
Space frame structures have a high lightweight potential and are adopted mainly for small
series due to low tooling investments. The space frame concept is based on a ―skeleton‖
construction [46]. A skeleton (steel, wood or aluminium) forms a solid framework, to which
secondary and tertiary body parts are attached as non-stressed members, by means of
various joining techniques [47]. The combination of space frame architecture with aluminium,
0
10
20
30
40
50
2002 2007 2008 2010 Obere Grenze
Usage of Boron steel through Volvo models
[%] o
fbodyw
eig
ht
XC90
7 %
V70
10 %
XC60
11 %
S60
17 %
45%
2002 2007 2008 2010 Upper limit

Deliverable D1.1
ELVA 37 SCP0-GA-2010-265898
results in the so-called aluminium space frame. A famous representative of this construction
is the AUDI Space Frame (ASF®). Fig. 3-4 shows the BIW of the AUDI A8 from 2003.
The structure of the framework consists of extrusions, castings and nodal elements; thereby
each surface element is an integral load-bearing member. Through the numerous possible
configurations of cast components, functional integration can be realised and the number of
parts and joining operations can be reduced.
The space frame construction is characterized by high static and dynamic stiffness. If
aluminium is used, this concept achieves a weight saving of about 40 % when compared to a
similar modern steel-unit body [48].
Fig. 3-4: Example of a space frame concept: AUDI A8 (2nd generation ASF®, 2003) [49]
3.2.1.3 High performance cars: Small volume with monocoque
High performance cars such as race cars are characterised by very high static and dynamic
stiffness. This is due to their monolithic load-bearing shell structure. The body and the
chassis are integrated into a single unit and hence monocoques are therefore called unit
body. Today monocoque structures are mostly made of carbon fibre reinforced plastics
(CFRP) although they can also be made of steel or more likely aluminium (e.g. Opel
Speedster, Lotus Elise).
Monocoque cars are lighter, less expensive, more rigid and can offer more protection to
occupants in a crash with appropriate design. Furthermore, monocoque concepts permit a
high functional integration. The BIW of the Mercedes McLaren SLR in CFRP is 40 % lighter
than a typical steel construction [46]. Fig. 3-5 shows the BIW of the Mercedes McLaren SLR.
When a vehicle with a unit body is involved in a serious accident, it might be more difficult to
repair than a vehicle with a full frame. Repair possibility is by cutting-out and welding rather
than by simply bolting new parts. Corrosion can cause further complications (in case of steel
monocoque), since the structural metal is a part of the load bearing structure, making it more
critical. A drawback of monocoques in CFRP is the complex manufacturing process, which
makes it cost intensive for high production volumes [51]. In addition, especially CFRP with
duroplastic matrices is seen as a source of concern regarding recycling.

Deliverable D1.1
ELVA 38 SCP0-GA-2010-265898
Fig. 3-5: CFRP-Body of the Mercedes McLaren SLR [50]
3.2.2 Future trends beyond 2020
Beyond 2020, steel, as material for the BIW, will still be playing an important role.
Furthermore the trend towards integrating more plastic components, which we already
observe today, will increase, due to new manufacturing technologies. This will make it
possible to produce these components in large numbers, while maintaining low production
costs. The fraction of light metal like aluminium and magnesium in the BIW will increase.
In 2020 a distinction between large and small/mid-size volume will still be made, because
light weight design should always be cost-effective and hence depends on the number of
pieces produced. In a first step, possible architectures for large volumes are presented and
subsequently the BIW design for midsize/small volumes in the future will be described.
3.2.2.1 Large series
In the case of large scale two main scenarios can be classified:
Dominant steel shell construction
Multi-material shell construction
Steel shell construction
Due to the continuous development of steel and the cost efficiency of steel shell construction
for large series, it is expected that this architecture will still be dominant. Nevertheless,
alternative body design methods will find more application possibilities, because of the
progress in material sciences, in particular in the field of joining technologies. Hence the
dominance of steel shell construction will diminish and the multi-material shell design will
emerge.
Multi-material shell construction
The multi-material design combines different materials in one structure (aluminium,
magnesium, steel, plastics…) in order to make the best use of the positive properties of each

Deliverable D1.1
ELVA 39 SCP0-GA-2010-265898
material. The core idea behind this approach is to use the ―right material‖ at the ―right place‖.
This means, the materials used are adapted optimally to the respective requirements of the
structural elements [51], thus leading to an improvement of the body firmness and rigidity.
This enhances the crash behaviour of the structure and leads to a weight reduction at the
same time. The main challenge of this approach is the joining of the different materials with
different coefficients of thermal expansion. Furthermore, the protection against corrosion is
also a challenging issue.
An outlook for prospective multi-material concepts is given by the SuperLightCar (SLC). In
this concept, the weight of the body of a medium-class vehicle could be reduced by 35 %
due to the consequent application of mixed construction using steel, aluminium, magnesium
and glass fibre reinforced plastics (GFRP) (Fig. 3-6).
Fig. 3-6: Multi-material-body of the SuperLightCar [52]
Fibre reinforced plastics will be increasingly found in attached components such as trunk lids.
Taking advantage of the mechanical properties of carbon fibre reinforced plastics (CFRP),
this material will also be used for structural components and crash absorbing structures.
3.2.2.2 Midsize volume and small volume
In the mid-size and small volume different lightweight architecture trends will compete
against each other:
Hybrid-structure (shell plus space frame)
Space frame (steel or aluminium)
Monocoque plus frame
Hybrid-structure (shell plus space frame)
A promising approach to decrease the weight of the BIW is the combination of architectures,
which enables an optimal use of each of the architectures with respect to the load
requirements. The Audi TT (second generation, Fig. 3-7) is a combination of aluminium
space frame and steel shell construction. Besides weight reduction, this design leads to a
better weight distribution as well as a 50 % higher torsional stiffness compared to its
predecessor.
Weight distribution
Aluminium 96 kg (53 %)Steel 66 kg (36 %)
Magnesium 11 kg (7 %)
Plastics 7 kg (4 %)
Weight SLC body: 180 kgMaterials
Aluminium sheet
Aluminium pressure cast
Aluminium profile
Steel
Hot forming steel
Magnesium sheet
Magnesium pressure cast
GFRP

Deliverable D1.1
ELVA 40 SCP0-GA-2010-265898
Fig. 3-7: Aluminium-steel mixed construction of the body of the Audi TT [53]
Space frame
Due to the increased accepted costs for lightweight measures in electric vehicles, a small
trend to profile-intensive aluminium structures can be recognised (Audi e-tron spyder, Jaguar
X-C75). As different studies on steel space frame concepts led to promising results
concerning weight reduction, costs and crash behaviour, this architecture will also be an
option for the midsize volume segment in the future [54].
The steady development of plastics and the improvement of their surface quality and lacquer
adhesion, as well as their heat resistance capacity, increase the percentage of plastics in the
car body continuously. Thus permitting the realisation of a lightweight architecture consisting
of a load-bearing aluminium or steel framework and unstressed plastic panels (e.g. Artega
GT).
Monocoque plus frame
As shown before, carbon fibre monocoques have been introduced in several super sport cars
(Mercedes SLR, Lamborghini Aventador etc.) in the past, leading to excellent crash
behaviour and high torsional stiffness. Proceedings in automation of the manufacturing
processes and decreasing material prices might qualify this concept also for higher
production volumes in the future.
The monocoque with frame is a combination of two design methods. The occupant cell is a
monocoque and the chassis is a frame construction. A representative of this approach is the
Mega City Vehicle of BMW (Fig. 3-8). In this case the monocoque consists of CFRP and the
frame of aluminium.
22%
16%
31%
31% Aluminium-Guss
Aluminium-Profil
Aluminium-Blech
Stahl-Blech
Aluminium profile
Aluminium sheet
Steel sheet
Aluminium cast
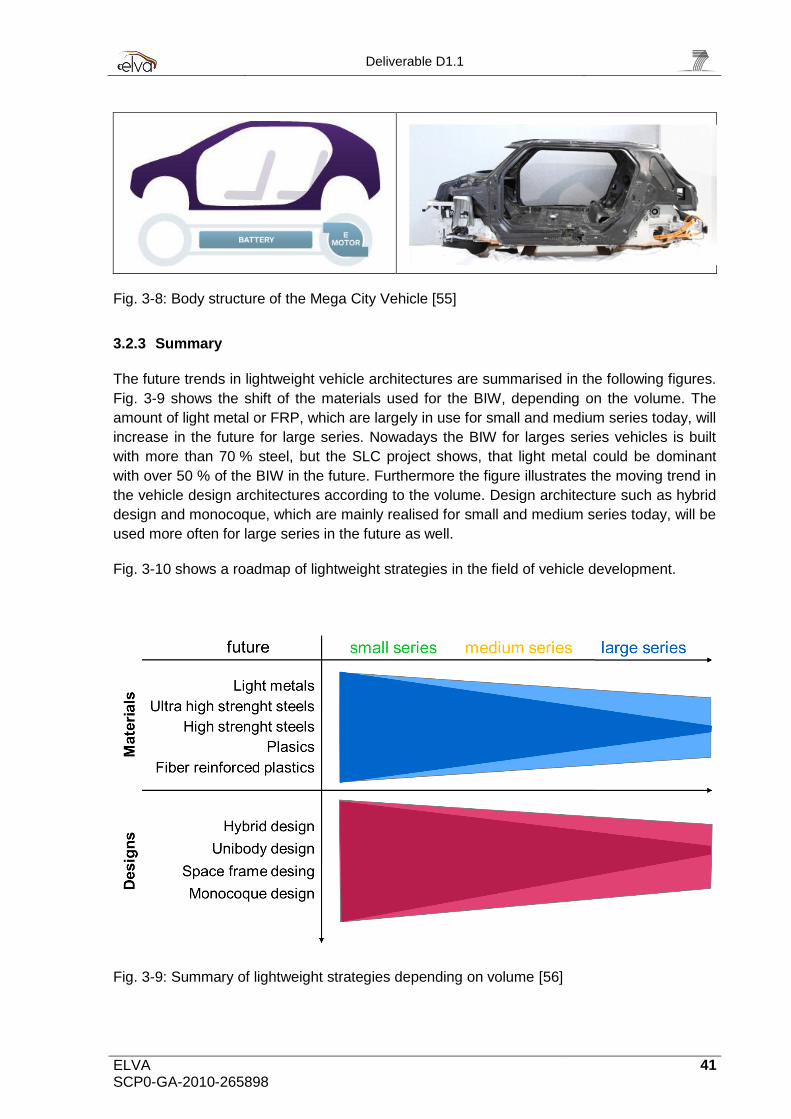
Deliverable D1.1
ELVA 41 SCP0-GA-2010-265898
Fig. 3-8: Body structure of the Mega City Vehicle [55]
3.2.3 Summary
The future trends in lightweight vehicle architectures are summarised in the following figures.
Fig. 3-9 shows the shift of the materials used for the BIW, depending on the volume. The
amount of light metal or FRP, which are largely in use for small and medium series today, will
increase in the future for large series. Nowadays the BIW for larges series vehicles is built
with more than 70 % steel, but the SLC project shows, that light metal could be dominant
with over 50 % of the BIW in the future. Furthermore the figure illustrates the moving trend in
the vehicle design architectures according to the volume. Design architecture such as hybrid
design and monocoque, which are mainly realised for small and medium series today, will be
used more often for large series in the future as well.
Fig. 3-10 shows a roadmap of lightweight strategies in the field of vehicle development.
Fig. 3-9: Summary of lightweight strategies depending on volume [56]
State of the Art
State of the Art
2020+
2020+

Deliverable D1.1
ELVA 42 SCP0-GA-2010-265898
Fig. 3-10: Roadmap of lightweight strategies [56]
3.2.4 Integration of the battery system
In most cases, electric vehicles already available today are built in the so-called ―conversion
design‖, where the body in white of an internal combustible engine (ICE) vehicle is used to
build an electric vehicle (EV). Certain modifications in the under floor panel make it possible
to integrate the battery system. A representative example of this type of EV is the Nissan
Leaf (Fig. 3-11).
Fig. 3-11: Nissan Leaf on the Paris Motor Show 2010
Another approach to realise an EV is the ―purpose design‖. In this approach the battery
system is placed in the central focus of the design process. The widely implemented solution
nowadays is the separation of the vehicle into two main units: the platform and the upper
body. The battery is integrated in the platform building a double floor similar construction. All
measures to protect the battery are implemented through the structural elements of the
platform. For instance, the DLR concept showed in Fig. 3-12 uses carbon cones to protect
the battery in case of a side impact.

Deliverable D1.1
ELVA 43 SCP0-GA-2010-265898
Fig. 3-12: DLR rib space frame [56]
Other examples for the above described approach are summarised in the following figure.
The platform of the BMW Mega City vehicle in Fig. 3-13 is an aluminium space frame and the
upper body is a CFRP monocoque. For the Fiat Phylla and Mimosa the lower body, in this
case, is also an aluminium space frame whereas the upper body is styled from plastic.
BMW Mega City vehicle [55] Fiat Phylla and Mimosa [57]
Fig. 3-13: Concepts for battery integration
The general approach in a purpose design can be summarized as a combination of a lower
body in light metal space frame to protect the battery while remaining lighter than a steel
construction and a complete plastic upper body or frame structure with plastic panels.
3.2.5 Further future body concepts for weight reduction and functional integration
With a lightweight reduction potential of 50 % compared to glass, plastics could be an option
for automotive glazing in the future. Currently polycarbonate is mainly used for roof windows
(Bugatti Veyron 16.4 Grand Sport), but concept cars like the Toyota i-mode (Fig. 3-14) show
the possible freedom in design by using polycarbonate more extensively. With thermo
management becoming even more important for electric vehicles, self-tinting polycarbonate
windows are applied in the BMW Vision Efficient Dynamics concept (Fig. 3-14).
Carbon cones

Deliverable D1.1
ELVA 44 SCP0-GA-2010-265898
Toyota i-mode BMW Vision Efficient Dynamics
Fig. 3-14: Concept cars using polycarbonate glazing
The Renault Z.E. concept includes a double-walled body structure to improve insulation of
the passenger cabin (Fig. 3-15). Another conceivable approach for reducing the required
HVAC-power (heating, ventilating, air conditioning) is to use phase change materials (PCM)
not only for battery insulation but also for the passenger cabin [58].
Currently, different possibilities to store electrical energy within a carbon fibre reinforced body
structure are investigated (Fig. 3-15). The applied multifunctional materials have lower
mechanical properties than conventional CFRP, but might lead to significant savings in
battery and body mass [59].
Renault Z.E. concept Volvo‘s structural energy storage concept
Fig. 3-15: Possible functional integration of the body structure
3.3 Chassis material concepts
The goal of chassis systems development is the improvement of comfort and driving
dynamics. Due to the high share in vehicle mass, lightweight construction in chassis can
provide a relevant contribution to overall weight reduction of the vehicle.
Steel lightweight design in chassis provides weight reduction potentials up to 20 % by
substituting conventional steels with high strength steels in connection rods, stabilisers and
coil springs [60]. This potential has been proven in the project ―Methodischer Ansatz im
Stahlleichtbau am Beispiel Federbein/Dämpfer―. Maintaining functionality and costs, a weight
reduction of 25 % was achieved thanks to material substitution, sheet thickness reduction
and structure optimisation [61].
[automobilesreview.com] [techmagdaily.com]
[auto-motor-und-sport.de] [atzonline.de]

Deliverable D1.1
ELVA 45 SCP0-GA-2010-265898
For several automotive manufacturers light weight construction by use of aluminium casting
parts has been approved during the last years (Fig. 3-16). Depending on the application it
has been possible to achieve weight reductions of 25 to 35 % by dedicated use of aluminium
casting in comparison to steel materials [62].
Fig. 3-16: Aluminium front axle of the BMW 3 series (E90) [63]
Especially for wheel controlling parts in chassis, metal materials are favoured, as the brittle
failure of fibre reinforced plastics is assessed critically. Leaf springs made of fibre reinforced
plastics are used successfully with advantages regarding weight and durability [64]. The
injection moulding part enables a weight reduction of 42 % in comparison to a steel solution.
3.4 Interior material concepts
The instrument panel beam bears an important structural function in the vehicle. Hence there
are high requirements to the construction materials concerning stiffness and strength while
the currently dominant material is steel. Nevertheless light weight metals like aluminium and
magnesium casting materials are used, as the manufacturing by die casting provides
additional advantages concerning component integration. Magnesium as moulding material
allows lower wall thicknesses than aluminium. Compared to steel solutions, concepts with
magnesium enable a light weight potential of up to 25 % [65]. A hybrid design based on a
combination of plastics and steel was presented in 2008, allowing a weight reduction by
20 % while increasing the dynamic stiffness from 39 to 46 Hz [66].
Seat structures provide additional potential for weight reduction. High strength steels are
already applied to seat rails, parts of the seat bucket and the rear seatback (Fig. 3-17). In
small volume productions, light metals (aluminium and magnesium) are used as well. Multi-
material design is currently only utilised in concept vehicles. The example in Fig. 3-17 leads
to a weight reduction of 4 kg compared to the steel construction. In this case, fibre reinforced
plastics are applied in the seat bucket and high strength steels and aluminium in the
seatback and the seat substructure. Using hybrid structures in seats, a light weight potential
of 15 to 20 % can be expected.

Deliverable D1.1
ELVA 46 SCP0-GA-2010-265898
Seat with high and highest strength steels Seat in multi-material-construction
Fig. 3-17: Light weight seat structures [67]
Due to the high requirements concerning strength and stiffness, seat structures exclusively
made of plastics are only introduced as back seats with a separate partition to the luggage
compartment, in order to ensure load securing [68]. Several super sport cars as well as
concept cars (VW XL1) make also use of larger FRP front seat structures.
In recent years, bio-fibres and bio-plastics have been applied in interior components (e.g.
Mercedes-Benz C-class, VW Fox, BMW 5 series). Improved recycling, high stiffness and
strength, good crash-behaviour and low density are some of the advantages of these
materials [69].
3.5 Conclusion
Due to advancements in steel properties and design (short and medium-term), steel will keep
its dominant position for high volume body-in-white construction in the near future. Advanced
light metals and fibre reinforced plastics will play an important role in a long term. Increasing
multi-material and hybrid-design demand further research, in particular in the field of joining
technology.
The integration of the battery system demands new approaches in vehicle architectures. In
purpose design, integrating the battery system into a profile-intensive metal floor frame,
combined with a load-bearing metal frame structure with non-stressed panels or a CFRP-
monocoque could be practicable, depending on intended production-volumes and markets.
Due to the brittle failure of FRP, wheel-guiding levers and arms in chassis systems will still
be made of advanced steel or aluminium in the future. Hybrid-structures for less critical parts
made of steel or aluminium and FRP will allow functional integration. Springs are another
possible application for FRP in future chassis systems.
Low carbon
HSS / Dual phase
Dual phase
Dual phase / Trip

Deliverable D1.1
ELVA 47 SCP0-GA-2010-265898
Especially the instrumental panel beam and the seat structures allow further weight reduction
in the vehicle‘s interior. Besides application of light metals such as aluminium and
magnesium, multi-material and hybrid-design will increase, making use of FRP structures. In
the future, a broadened use of bio-plastics and bio-fibres can be expected in particular in the
interior.

Deliverable D1.1
ELVA 48 SCP0-GA-2010-265898
4 State-of-the-art and outlook EMC
4.1 Introduction to EMC and EMF
Electromagnetic Compatibility (EMC) is when two or more products partly based on
electronics can co-exist and function as intended without interference. In 1972, the first EU
directive for automotive EMC came into force. At this time, the directive was mainly about
preventing disturbances from the ignition system from interfering with radio reception inside
and outside the vehicle. Since then, the increase of complexity in electric and electronic
systems in vehicles has been immense. Most functions in a modern vehicle are today
controlled or affected by electronics. All this electronics can interfere or be interfered. The
addition of high voltage systems, electric powertrains, voltage inverters etc. will further
increase the complexity of the electric and the electromagnetic environment.
Exposure to electromagnetic fields (EMF) is a general public concern that is difficult to take
care of in a proper way. In electric vehicles low frequency (LF) magnetic fields are of most
interest. The known effect of exposure to fields below 100 kHz is direct influence on the
nervous system. A number of other possible effects from short or prolonged exposure have
been studied. In most cases nothing was found, but in some experiments the results are
inconclusive. The possible effects include e.g. cancer, neurodegenerative disorders,
reproduction and development, cardiovascular disorders and hypersensitivity.
The concern for prolonged exposure still prevails. The debate is mostly around cellular
phones, but there is also e.g. a weak indication that childhood leukaemia has an association
to low level (0.4 µT) fields from power lines. The situation makes it very difficult to find a
generally accepted safe exposure level.
4.2 State of the Art
4.2.1 Overview of existing EMC standards
An overview of various standards is shown in table 4-1. The bases for type approval of
vehicles are the directive 72/245/EEC [70] (for EU type approval, e-marking) and the
regulation UN ECE R10 [71] (for UN type approval E-marking). The technical content is
aligned between the two since 2008. These documents state limits and levels for the tests to
be performed for type approval of complete vehicles and electric/electronic components and
sub-assemblies, but they do not define the measurements methods in detail. This is instead
defined in standards developed by the International Organization for Standardization (ISO)
and The International Special Committee on Radio Interference (CISPR). The ISO standards
cover immunity tests and the CISPR standards cover the emission tests.
Table 4-1: Standards necessary for type approval
Standard Comments
CISPR 16 A series of standards specifying equipment and methods for measuring
emission and immunity at frequencies above 9 kHz.
CISPR 12 Limits and methods of measurement for the protection of off-board
receivers from vehicles, boats and internal combustion engines
CISPR 25 Limits and methods of measurement for the protection of on-board

Deliverable D1.1
ELVA 49 SCP0-GA-2010-265898
receivers from vehicles, boats and internal combustion engines
ISO 11451 A series of test methods for immunity to electrical disturbances by
narrowband radiated electromagnetic energy, complete vehicles.
ISO 11452 A series of test methods for immunity to electrical disturbances by
narrowband radiated electromagnetic energy, components.
ISO 7637 A series of test methods for immunity to electrical transients
The most severe EMC limits and levels for a supplier to fulfil is, however, normally not the
legal requirements, but the OEM specific standards. Most vehicle manufacturers have today
their own set of standards, at least for electronic components and sub-assemblies. These
OEM standards often contain not only internal limits and levels, but also specific test
methods etc.
4.2.1.1 ISO
The International Organization for Standardization develops standards for many technical
areas. Technical Committee 22 handles road vehicles and Sub-Committee 3 is responsible
for electrical and electronic equipment.
Three series of standards are of interest for EMC purposes: ISO 11451, ISO 11452 and ISO
7637.
ISO 11451 and 11452 are similar in that they both cover immunity to electrical disturbances
by narrowband radiated electromagnetic energy, the first for complete vehicles and the latter
for vehicle components. The background for these requirements is that the vehicle should
work as intended even when subjected to electromagnetic fields from transmitters such as
cell phones, cell phone base stations, radar stations, broadcast transmitters, etc. Both
standards also have within their scope to cover this regardless of propulsion system. In
practice in the lab, testing the immunity of an EV is not so different to testing an internal
combustion engine car. For component testing, some additional equipment will be needed
since the feeding voltage for the test object may be considerably higher than 12/24/40 Volt.
The standards are mainly focusing on radio frequencies, but ISO 11452-8 that specifies
measurements of immunity to magnetic fields for electronic components covers a wider
frequency range, down to 15 Hz.
The ISO 7637 series handles test methods for immunity to conducted electric disturbances.
ISO 7637-2 covers the supply lines on the 12 or 24 systems and ISO 7637-3 covers other
lines (e.g. I/Os such as data buses). Pulses are fed to cables connected to the component
under test to simulate e.g. crank pulses. Some of these pulses have been specified with an
ignition engine in mind. An EV contains DC/DC and DC/AC converters switching high
voltages and currents, generating other types of pulses not currently covered in the
standards.
4.2.1.2 IEC/CISPR
The International Special Committee on Radio Interference (CISPR) is a committee under
the International Electrotechnical Commission. CISPR publishes a number of standards and
other documents where CISPR 12, 16 and 25 are of interest for vehicles. Common for all

Deliverable D1.1
ELVA 50 SCP0-GA-2010-265898
three is that they concern the protection of radio receivers from interference from signals
generated from e.g. a vehicle.
CISPR 16 is a series of basic EMC standards specifying equipment and methods of
measurements.
CISPR 12 and 25 are both product standards covering vehicles, CISPR 12 is covering the
protection of receivers situated off the vehicle and CISPR 25 is covering the protection from
receivers on the vehicle.
The CISPR standards used for vehicle testing only handles emission testing. The frequency
bands that are within the scope are only bands were radio receivers may exist. Therefore the
scope of CISPR 12 is limited to 30 – 1 000 MHz and CISPR 25 is limited to 0.15 – 2 500
MHz.
4.2.1.3 OEM standards
Virtually all manufacturers of complete vehicles have developed their own EMC standards, at
least for electronic components, where limits and levels are more severe that the legal
requirements. Furthermore, they commonly also specifies other test methods than the legal
requirements. This can be due to e.g. historical reasons or that the experience of the OEM is
that by using another test method for the component, the results are more similar to what is
obtained from complete vehicle testing.
4.2.2 Electromagnetic Fields (EMF)
4.2.2.1 Directives and ICNIRP
The current scientific knowledge is evaluated by the international and independent
organization ICNIRP (International Commission on Non-Ionizing Radiation Protection) and
compiled into reports and recommendations [72]. These recommendations are the basis for
legislation and product regulations all over the world. Two important examples are the EU
directive 2004/40/EC [73] and the EU recommendation 1999/519/EC [74]. These are based
on an ICNIRP report from 1998 and are applicable for workers and the general public
respectively. 2004/40/EC shall be implemented during 2012. 1999/519/EC is referred to in
product standards that already are in force.
The LF magnetic field limits are set for electric current induced in body tissue. Since this is
difficult to measure there are also a set of reference values based on more easily measured
field strength. The levels are quite high compared to what is found in daily life. A few
industries have been forced to adapt their technology. Examples are mobile phones and
some handheld electric tools. Welding is still problematic and MRI used at hospitals is always
above the limits.

Deliverable D1.1
ELVA 51 SCP0-GA-2010-265898
4.3 General technology outlook up to 2030+
4.3.1 EMC
4.3.1.1 EMC test in charging phase
The directives specify that the vehicle shall be tested in different phases. Some tests
specifies ignition on with the engine in idle, and other that the engine shall be in running
mode. There is a proposal to a new edition of UN ECE R10 that would add another mode for
EV: s, which is the charging phase. This is to ensure that no un-intentional movements of the
EV will occur even when subjected to external electromagnetic fields. There is also on-going
work within CISPR to add a radiated emission test during the charging phase.
4.3.1.2 Conducted EMC for power electronics
The ISO 7637 series has been developed with mainly traditional ignition engine architectures
in mind. One example is the crank pulse (pulse 4) that occurs when engaging the starter
motor. This pulse will never occur in an EV, but other types of pulses will occur instead, such
as pulses from switched DC/DC converters.
The present measurement methods for conducted EMC are also not sufficient for higher
powers. There is ongoing work to develop new methods and equipment for coupling
transients of different frequencies to the power lines.
4.3.1.3 Magnetic fields
ISO 11452-8 covers magnetic fields down to 15 Hz. There is development work going on
within ISO to add DC fields to the test specifications.
4.3.1.4 Composites and plastics
Most vehicles are today built on a metal chassis with a metal body. Some EVs have some of
this metal replaced by plastics and composites. The metal acts as ground-plane from an
electromagnetic point of view and strongly affects the EMC behaviour. This is also taken into
account for component testing today, were one common method is to place the component
and it‘s cabling on a metal table to simulate the bodywork of a vehicle.
An alternative test method where the component is instead placed on a non-conductive
supporting table has been suggested within CISPR, but no formal work is ongoing. This
method will not solve everything either. There will be several possible combinations of
component tests (with or without ground plane) and vehicle design (with or without metallic
body). Therefore, regardless of the test method further investigations on requirement
breakdown is necessary to investigate the transfer properties of disturbances from
component to complete vehicle level.
4.3.1.5 Wireless inductive charging
Several actors have proposed methods for non-conductive charging. These ranges from
paddles that is to be inserted into slots in the car to only replace the galvanic contact, over
fixed charging stations with pads buried in the ground over which the car is to be parked, to

Deliverable D1.1
ELVA 52 SCP0-GA-2010-265898
―electric roads‖ where the car is continuously charged during the drive. All these methods
introduce magnetic fields in some manner, and must be assessed from both EMC and EMF
point of view, although the systems that exist today are claimed to fulfil all requirements and
guidelines.
4.3.2 EMF
4.3.2.1 Scientific development and trends
Recent scientific findings do not change the overall picture but ICNIRP updates their
documents according to more precise knowledge. There has been some focus on the MRI
question mentioned above since it must be solved before 2004/40/EC becomes mandatory.
ICNIRP revised their LF guidelines 2010 so that new limits are higher than fields generated
in MRI equipment [75].
When it comes to long term exposure the situation is more difficult. Epidemiological studies
do not indicate that specific long term limits are required. However, ICNIRP admits that these
studies are difficult to carry and that their reliability is limited. Specifically is data on exposure
unreliable. The public concern and the inability of the scientific community to present
conclusive results keep the question very much alive.
Compared to the current directives we can expect some changes in the future. Under
consideration is:
- Exclusion of MRI from the directive
- Relaxation of LF limits
- New limits for long term exposure
Legislation sometimes is based more on politics than on science. National debates have
forced national or regional limits or recommendations that not are based on ICNIRP
documents. Well-known examples are restrictions for cell phones and their base stations,
power lines and computer VDUs.
4.3.2.2 Product standards
There is a growing range of European product standards dealing with electromagnetic fields.
Examples that include LF magnetic fields are EN 62233:2008 [76] and EN 50500:2008 [78].
The standards generally refer to or include levels from 1999/519/EC. In addition to the limits
the standards specify (in varying levels of details) measurements points and equipment
state.
4.3.2.3 Measurement technology LF magnetic fields
There is still some work to do on measurement methods. The basic principle is simple. The
field is measured using tri-axial loops and the total field is the vector sum of the three
components. The problem is that the signal that shall be measured is not a narrow band
sinus. The signal from power electronics has a high content of harmonics and the

Deliverable D1.1
ELVA 53 SCP0-GA-2010-265898
fundamental frequency might vary quite fast. Another difficulty is that the limit line not is
straight but has several break points.
Digital and analogue instruments solve the task in different ways. Digital instrument calculate
an FFT and e the total field from its frequency components. A simple way sometimes used is
to just add the components taking no account for phase relations. The result is an
overestimation that might be very high. Another possibility is to calculate and RMS sum. The
result will be lower but it has unfortunately no relation to limits or biology. Variants of these
occur in various documents. ICNIRP has proposed a procedure [79] that tries to estimate the
frequency weighted dB/dt that probably is the most adequate value. This is so far not
referred to in standards and directives.
4.4 Assessment
There is a strong interest in discovering possible problem areas in EMC and EMF as early in
the design process as possible, preferably by virtual assessment. It is not practically possible
to model the complete vehicle in detail, including all mechanical, electrical and system
aspects that will affect EMC and EMF. The problem at hand needs to either be broken down
to smaller parts of the vehicle, or the vehicle model needs to be simplified. Breaking down
the problem can be, e.g. by importing parts of the vehicle mechanical structure from the CAD
system into a 3D electromagnetic solver and model the signals that are present at that
particular part of the vehicle, creating models of cable bundles to assess cross-talk and to
simplify further large-scale modelling, etc. A simplified vehicle structure can be used for e.g.
simulations of field strengths outside the vehicle for optimization of antenna placement.
It is of course also vital to have accurate models of the ECU‘s. Models for assessing
emission can often be obtained from Matlab-models etc., but modelling immunity levels is
more difficult. The models do seldom predict the susceptibility of the system, but instead
needs to be calibrated by measurements.
The methods for virtual assessment can give good information about the general EMC and
EMF quality of subsystems and vehicles, and especially at early stages before the systems
have been built and to assess limited changes in existing designs, but the final verdict must
still come from measurement.
4.5 Discussion and conclusions
EMC and EMF are two technology areas that will have continuously increasing importance in
the automotive industry. EMC will be affected by several trends: increased number of
electronic units, high voltage switching and non-metallic materials in the structure of the
vehicle. EMC is a property in a vehicle that normally is un-noticed. The driver only recognizes
it when there is a problem. However, if there is a problem, it may be costly and time
consuming to fix it. It is therefore of high importance to keep EMC in mind from the beginning
in a development project. In the ELVA project we have the opportunity to assess the EMC
properties even at the architecture stage.
There is still no consensus on the risks with long time exposure of electromagnetic fields. But
even if the risk is low, there is still a public concern that needs to be addressed, hence
reducing the field levels for the occupants in the vehicles will always be important.

Deliverable D1.1
ELVA 54 SCP0-GA-2010-265898
5 Electric Storage Systems and Electric Drive Train Technology
5.1 Introduction
The design of the third generation of electric vehicles will be no more affected by the
restrictions of common combustion engine vehicles. The new freedom can be used for
components in an optimal way. Several components become obsolete (e.g. internal
combustion engine, fuel tank, exhaust system), others must be developed (e.g. battery,
inverter, full-electric drive train) or have to be adapted to the automotive world (e.g. charger).
Today, all in all the general architecture remains similar to that of a conventional car despite
some differences: drive train including inverter, motor and gear reduction integrated on the
front axle, battery located under the body near to vehicle centre of gravity, main auxiliaries
such as air conditioning compressor and power steering electrically driven. With the
announced development projects ―Mega City Vehicle‖ and ―Twizzy‖ (four-wheel two-seat
vehicle between car and scooter) BMW and Renault could be the first OEMs who
manufacture cars especially designed for E-mobility: i.e. carbon fiber body designed around
the battery, specific thermal management.
Therefore the components and functions of the drive train (e.g. recuperation, thermal
management) and the storage systems (e.g. battery, super cap, latent heat storage unit) are
the most important. The variants of the components differentiate in their performance
essentially and affect the power, efficiency, safety, weight and price of the future electric
vehicle.
Concerning their advantages and disadvantages, cooperation of components and measures
are described in the following sections. Also the technology outlook of the possible future
application will be given.
5.2 State-of-the-Art
5.2.1 Battery
The range of an electric drive is mainly defined by the capacity of the energy storage.
Therefore, the battery plays an important role for the success of electric vehicles. At the
same time the currently requested lifetime of such an energy storage system is 10 to 15
years and 160.000 to 240.000 km, and therefore, is as high as a vehicle lifetime. NiMH
batteries have already been established in the first hybrid vehicles. For the new generation a
wide application of Li-ion batteries is emerging. The application of the batteries determines
the choice of the cells. The cells are the actual energy storage components. To guarantee a
safe and reliable application in automobiles a multitude of parameters, e.g. state of
charge(SOC), state of health(SOH), temperature, charge-discharge currents and voltage
must be monitored and controlled. The wording Li-ion is a generic term for various
combinations of materials. Currently, cells in consumer applications mainly use lithium cobalt
oxide. Advancements for automotive applications are moving towards cells with new cathode
materials such as lithium cobalt nickel manganese oxide or lithium iron phosphate. All these
combinations have advantages, as well as, disadvantages regarding capacity or energy
density, and safety.

Deliverable D1.1
ELVA 55 SCP0-GA-2010-265898
The lithium-ion cell technology allows a very high energy density for battery systems, but the
energy content must be all time fully controllable, also in case of failure. Depending on the
type of cathode and anode material the lithium-ion battery has a specified temperature and
voltage range (maximum charge and minimum discharge voltage), in which the battery
operates reliably and practically without side reactions. The lithium-ion cell, however,
generally becomes unstable, if it is exposed to higher temperatures and voltages than
admitted by the active electrode materials. Therefore an additional multilevel safety strategy
is indispensable. Such a strategy is schematically shown in the following Fig. 5-1.
Fig 5-1: Multilevel safety strategy
One of the central components of this safety strategy above the cell level is a BMS (Battery
Management System) which is comprised of the BMC (Battery Management Controller) and
the CSCs (Cell Supervising Circuit), the CSM (Current Sensor Module) and the integrated
software. The supervising electronics is a central safety component on system level. The
integration and the long period operation of Lithium-Ion cells in a Hybrid or Electric Vehicle is
mainly enabled by a sophisticated supervising electronics with highly developed software
algorithms. The supervising electronics controls single cells, manages the safety
components and the cooling and thus the critical state is avoided. Also the important task of
regular symmetrisation of Li-Ion cells (that means balancing of their voltages) is performed
by the supervising electronics. The battery management electronics communicates with the
vehicle control unit and regulates the battery power dependent on the demands of the
vehicle control unit. The integrated electronics (BMC, CSCs) and the related software of the
energy storage system fulfil different functions and operations such as isolation detection,
temperature measurement of the cells and the cooling medium, determination of State of
Charge (SOC), State of Health (SOH) and State of Function (SOF), communication with the
vehicle, diagnosis, management of the internal cooling system, ensuring the functional safety
also in case of failure and detection and balancing of the cell voltages.
The use of a modular kit concept additionally allows an effective coverage of a wide range of
performance classes with a high utilization of common parts (see Fig. 5-2).

Deliverable D1.1
ELVA 56 SCP0-GA-2010-265898
Fig 5-2: Modular battery kit
This concept delivers high integration levels and can be at the same time very flexible
depending on vehicle requirements. The indirect cell cooling can be setup to use air or liquid
media.
The recycling of the battery ensures a good environmental performance of the electric
vehicle over the lifetime. The motivation for battery recycling is given by different aspects like
the recirculation of rare metals, and lower environmental stress for recycling of metal in
comparison to the ore winning (1/3 CO2). Modern recycling methods without dumping
achieve a rate of 60 % for NiMH and significant more than 70 % for lithium-ion.
5.2.2 Drive train and brakes
The electric drive train has three main architecture concepts, which are based on the position
of the electric motor. These are the centralized motor, the near-wheel motor (axle motor) and
the in-wheel motors (see Fig. 5-3). These concepts affect the vehicle design essentially.
Fig. 5-3: Three different arrangements for electric vehicle transmission

Deliverable D1.1
ELVA 57 SCP0-GA-2010-265898
Depending on strategy and use of a vehicle, different numbers and technologies of electric
motors are employed. The aim is to use the optimal technology for the respective purpose.
This can be determined by the costs of system, the available installation space, the required
features, as well as, the degree of efficiency.
In a pure electric drive a high efficiency factor over a wide range of torque and motor speed
is needed, since this assures an optimal utilization of the battery. Here preferably the
synchronous motor in the form of an axle drive system comes into use.
Electric motor overview
Electric drive motors are machines which convert electrical power into mechanical propulsion
power. Automotive electric drives intend to provide the propulsion power as torque applied to
rotating wheels. The main motor types used in automobiles are the following:
DC motors with brushes (can be seen as obsolete for modern applications)
Permanent magnet synchronous motors (one of the most used propulsion motor type)
Induction motor (often used for automotive propulsion)
External excitation synchronous motors
Reluctance motors (not yet commonly used, may get some importance in case of lack of
magnet materials, their working effect can be combined with permanent magnet motors)
There is no absolute truth about which motor is the best. The selection depends on the
weighting factors between the requirements and on the typical usage profile. All these motors
have some common properties which have a strong effect on the drive train of vehicles and
on other systems:
They are able to drive a shaft in both direction without mechanical reversing device
They are able to provide nearly constant mechanical power over a wide RPM range
They are able to generate torque even at zero RPM (with some limitations)
They are able to generate ―negative power‖ where they brake the rotating wheel and
supply energy back to the vehicle‘s electric system. The braking power limits have the
same magnitude as drive power values (the engine brake power of internal combustion
engines are as low as 10-20 % of the positive drive power values)
They have a short time overload capability up to 200-300 % of their long term power
capacity
They need a power electronic controller (inverter) to transform the DC battery voltage into
a controlled multi (often 3-) phased voltage to feed and control the motor.
They can realize control commands much quicker than conventional engines
These properties are pretty unusual for engineers working with conventional internal
combustion engines and have a strong effect on the design of the drive train. Just one effect
to be mentioned: electric drive trains do not necessarily need clutch and switched gearbox to
drive a vehicle.
State-of-the-art in electric drive trains
As we discuss about state-of-the-art drive train of electric road vehicles, we have a pretty low
number of series production vehicle types, somewhat more low volume prototypes and a lot

Deliverable D1.1
ELVA 58 SCP0-GA-2010-265898
of design studies with unproven target-specifications to be analysed. With this background
the wording ―state-of-the-art‖ has much less meaning as the same word for a product
category with a long series production history.
Electric cars today, let‘s call it 1st generation of EV‘s, are still constructed often like ―take an
existing vehicle and exchange its engine by an electric motor‖. It means all the existing
solutions are taken over beginning with the fact that the vehicle has one single electric motor
and a gearbox (switched or fixed). One single motor for two driven wheels means
automatically a differential gear, too. This way of approximation is motivated by reusing as
much ―commodity‖ components as possible and a reduction of development time as well as
financial and technical risks. The few companies which decided to produce electric vehicles
in a remarkable number follow this concept. On the other hand there are a plenty of
prototype vehicles or at least studies where new drive train configurations are
planned/showed. Let us take an overview of the different possibilities how an electric drive
train can look like:
Single motor, clutch (keep modifications simple) switched gearbox, differential, drive
shafts
For this it can be taken a conventional car and change the internal combustion engine to an
industrial electric motor. To keep the changes simple, the clutch is often kept even if it has no
practical function. If the original vehicle had an automatic transmission, the hydrodynamic
part can be eliminated or kept. The fact that the vehicle has a gearbox makes the selection
and control of the electric motor a bit simpler because switching the gear may compensate
for the non-perfect parameter design of the electric motor so the vehicle has a sufficient hill
climbing capability and acceptable top speed even if the motor‘s torque and RPM is limited.
Such vehicles have sometimes DC motors which are not really the perfect choice for a
vehicle but easier to buy and control.
Single motor, no clutch, fixed reduction gear, differential, drive shafts
Here the driving comfort is improved by the elimination of gear shifts. The vehicle has an
always engaged drive train from the motor to the wheels. The selection and the control of the
motor needs much more professional design because the demands on acceleration, hill
climbing capability and the top speed can only be fulfilled if the complete system is designed
for the purpose and the parameters are optimized together. Normally the electric drive
systems have a torque limitation (different for short term and long term), a power limitation
(also different for short and long term) and top RPM. An important parameter is the ratio
between the RPM values where the motor reaches its maximal power to the maximal allowed
RPM. This parameter is called ―Constant Power Speed Range‖ and tells how wide the RPM
range is, where the motor can ―simulate‖ a continuously variable transmission. If the
mentioned RPM ratio is high (>>2) there is no need to switch between different gears. With
increasing motor power to vehicle mass ratio the parameter optimization gets easier. Heavy
vehicles designed for high speed and high hill climbing capability are not easy to realize
without switched gears. The other challenge is the smooth controllability of motor torque so
that the accelerator pedal response is fine enough for low speed drive situations. Such drive
trains are often realized with induction motors, permanent magnet synchronous motors or
external excitation synchronous motors but not with brushed DC motors. (Example vehicle:
Tesla Roadster, Renault Fluence EV).

Deliverable D1.1
ELVA 59 SCP0-GA-2010-265898
Near wheel motors with wheel individual reduction gear
In this case the 2 or 4 wheels are driven by local electric motors via drive shafts and often via
wheel individual fixed reduction gears. This advanced drive train is often motivated by the
wish to introduce a function called torque vectoring where special drive stability benefits
should be gained from the actively controlled drive torque distribution between the driven
wheels. This is why this drive train is often found in sportive high power electric vehicles (like
Audi e-tron). The construction with drive shafts is intended to keep the unsprung masses
(masses which are coupled to the wheel-side of the suspension) as low as possible which is
an absolute requirement for high speed sport vehicles. The motor kind can be induction
machines or synchronous machines as well.
In-wheel motors with reduction gear
In wheel motors are electric motors which are mechanically fixed to the wheel so that they
move together with the wheel side of the suspension. This construction eliminates the need
of joints and drive shafts in the transfer of torque to the wheels. Therefore the drive system is
very compact and often fits into the place which is anyway reserved for the wheel. The
middle part of the vehicle between the wheels can be made free of drive train components.
Reduction gears are often built together with the motor as planetary gear set.
Direct drive wheel motors
A special case of wheel motors is where the motor drives the wheel without reduction gears
so that the rotor of the motor is fixed to the rim. This construction reduces the design volume
of the drive system to the minimum so that it is almost as low as that of a non-driven wheel.
A very beneficial option is the full integration of the power electronics into the wheel motor.
This makes it possible to reduce number of the high current cables (from 3 to 2, plus
reduction of the average current values) leading to the moving suspension parts and reduces
the cable-related electrical losses. The lack of reduction gears introduces a tough challenge
to the designers of the wheel motor due to the need of a very high torque density. This is the
reason why it is assumed that this drive configuration is limited to vehicles with lower weight.
The benefits of very low design-volume, possibility for advanced individual torque
controllability, almost no mechanical losses (no gear set) and low cable related losses may
make this drive train one of the candidates for the most modern city mobility solutions. On
the other hand it is rather unlikely that this solution appears in high power sportive cars.
Impact of electric drive on the vehicle’s body
The basic design of the vehicle‘s body is impacted by the fact that the battery has to be
placed somewhere in a crash-safe position where the centre of gravity and space utilization
is optimal. The large cooling opening at the front and aerodynamics concepts may
completely change, the heating/cooling systems of the vehicle are impacted by the different
requirements, the design room and local air cooling demand is totally different for electric
drives in comparison to internal combustion engines.
Deliverable D1.1
ELVA 60 SCP0-GA-2010-265898
Impact of electric drive on the brake system
The possibility to use the electric machine to brake the vehicle and reuse a remarkable part
of the motion energy has strong influence on the brake system. The brake function has to be
split into an electric part and friction brake part. The driver has to be able to control the
combination of these two brake actuator sets like before with the conventional interfaces
(acceleration pedal for ―engine brake‖, brake pedal and parking brake lever/button). Vehicles
with recuperation capability have to be able to handle necessary transients between electric
braking and friction braking in a way that it is seamless for the driver or at least does not
cause any extra effort or dangerous unpredictable behaviour. Solutions can be split into two
main groups:
Vehicles with conventional brake system and increased engine brake effect for
recuperation (Mitsubishi MIEV, Renault EV‘s) (see chapter 6.2).
Vehicles with brake blending capable brake systems which can realize these transitions
nearly seamless (example: brake system of Toyota and Lexus hybrid cars).
The second group can be seen as a high-tech solution, the first is a good compromise to
reuse standard brake components but the increased engine brake effect is assumed as a
tendency for city vehicles with brake blending capability too because of the comfort-benefit of
handling almost all driving situations with the accelerator pedal.
It is assumed that the brake-by-wire systems and especially the ―dry‖ electromechanical
brake actuators will get increasing market in the future because they fit very well to the
demands in an electric vehicle (see Fig. 5-2).
The control precision and dynamics of electric motors (especially in-wheel motors) might
introduce a new solution for the vehicle dynamics and wheel slip control systems where the
electric machine is deeply involved in control functions like anti-lock function, traction slip
control and stability control functions. This trend and the possibility of electrical energy
recuperation might lead to a change in the brake component design (smaller, lighter brake
actuators) and in the control architecture of these systems, too. The keyword will be a smart
cooperation of brake and drive systems under common intelligent control.
An assumed trend for the future is the appearance of water cooled braking resistors in the
vehicle. Braking resistors are well known everywhere in the industry where electric braking is
performed but reuse of the energy is not ensured in 100 % of the cases (trains, cranes,
elevators, robots, heavy electrically actuated machines, electric ship drives). Braking
resistors will be used to cover the part of power capacity of electric braking which cannot be
fed back into the battery due to any technical limitation. Using a braking resistor with
electronic power control could solve several underestimated problems like missing engine
brake capability at full battery load and open new functional possibilities if their cooling will be
integrated into the thermal management of the vehicles.
5.2.3 Charging
The power electronic flow (inverter) controls the energy from the battery to the electric motor,
as well as, the reverse direction from the motor to the battery (e.g. recuperation). In addition,
it provides an optional connection with a DC/DC converter between conventional board net

Deliverable D1.1
ELVA 61 SCP0-GA-2010-265898
(14V) and the electric drive battery (high voltage). This makes it the heart of electric drive.
During friction or braking phases, this energy is mainly converted to friction and through this
into heat. This heat energy is friction transmitted to the environment and therefore no longer
available for powering the vehicle. An electric drive can be used either as motor or as
generator, if designed appropriately. Electric drive offers the possibility of re-using at least
partially this energy, which has already been used to increase the kinetic energy during
acceleration of the vehicle. The ability to recuperate has a stake in the capacity of the battery
system and therefore the dimensions of the storage system.
An additional concept to improve the flexibility for users and offer an alternative for charging
the battery is given by the switch able batteries. Integration models and generic interfaces for
a smooth battery pack incorporation and removal in electric vehicles are available in a first
version for Better Place and its partner (see Fig. 5-4). Some improvements are necessary for
the next generation:
Finding a space efficient location to place the battery inside the very limited space in
modern vehicle.
Simple service access to the battery, standards for all EVs and a cost efficient version of
a battery bay for vehicles and battery switch stations.
The current version of the switchable battery system and its switching station is used for
some taxi and local transport applications in founded projects. The main application is the
Renault EV Fluence with a switchable battery system for Denmark and Israel.
Fig. 5-4: Switchable batteries in the environment of E-mobility (Better Place)
The availability of the electric vehicle interacts with the charging of the battery. The on board
charger offers the opportunity to charge the vehicle battery independently of fixed charging
stations. Therefore the charger transforms the different external power sources into internal
charging amperage. The charging operating sequence depends on a communication
interface and has to be operated with a specific state of vehicle mode.

Deliverable D1.1
ELVA 62 SCP0-GA-2010-265898
Currently, there is a clear trend visible in the automotive industry: each plug-in HEV and each
EV will incorporate an on-board charger to re-charge the batteries as often as possible and
nearly everywhere. Continuously re-charging of the batteries is possible, due to the missing
memory effect of lithium technology. As almost all wall sockets in Europe are able to provide
at least 3 kW power (1-phase, 230V), chargers in a vehicle will have approximately the same
power capability.
There will be certain requirements to those on-board chargers:
Standard automotive characteristics, such as water tightness and vibration stability are
mandatory.
An easy and flexible mechanical adaption to vehicle environment, via e.g. so-called
brackets (adapters) will be necessary.
Chargers must be cooled (air cooled or water cooled).
The vehicle architecture should be able to use the power dissipation (heat) of the
charging devices under cold weather conditions.
For energy saving reasons, they must have an efficiency of at least 90 %. Technically
good devices will have 95 or even 96 %.
The power factor must guarantee high efficiency values (up to 99 %).
Chargers must be electrically tuned to ―their‖ battery (e.g. cut-off voltage).
Chargers must support diagnostics.
Fig. 5-5: A possible electrical design principle
Chargers will have filters on the AC power input to suppress interferences. After rectifying the
input voltage, it will be clocked and fed to a transformer, which will provide galvanic
separation between on-board and off-board voltage. The secondary voltage of the

Deliverable D1.1
ELVA 63 SCP0-GA-2010-265898
transformer will be rectified and filtered again, so it can be fed to the battery. Module-
incorporated electronics will control the power stages.
Fig. 5-6: 10 kW charger, mounted in a prototype car
The size of a 3 kW charger will be around 6 l (e.g.55x15x8 cm) and the weight will be
approximately between 5 and 8 kg. However, the values depend on materials used, electrical
and mechanical design, as well as basic features (tightness, stability) or cooling principle.
HV connectors, high power wiring, water filled cooling hoses etc. will further increase the
electric vehicle‘s weight caused by charging functionality.
Vehicle architecture
The charging functionality of a car includes a lot of control elements:
Triggering the charging (by user, by timer, by power grid, by smart control)
Interface to grid
Locking the plug on the car
Reading temperature sensors
Control cooling
Check battery values regularly
Displaying charge status
Diagnostics
Etc.
As this charging functionality affects a lot of units, it will be most probably not run in a
charger, but for instance in the vehicle controller. Therefore chargers, as well as batteries,
may control their own module functions only, while a central, ―intelligent‖ device may control
all other units by electrical interfaces, such a (CAN) bus.
The on-board charger will not be necessarily a stand-alone unit. Especially in the future, it
will be most probably integrated in another power device, such as DC/DC converter or
battery.

Deliverable D1.1
ELVA 64 SCP0-GA-2010-265898
Fig. 5-7: Architecture diagram charging
The initiation of the charging, especially at home wall sockets or at private parking lots, could
be done by a smart HMI, depending on users selections, power price or timer function. A
possibility could be to introduce a new main electric controller, which covers all charging
control functions. This unit could read power demands, connector and flap statuses or plug
presence. In case all pre-conditions are correct (grid voltage detected, plug locked, …),
charging can be started by activating the charger and the battery. The electric main controller
e.g. EVC will monitor all devices, check the system values and detects the status of the
charger. It can also send charging values (e.g. state of battery) to the interior system.
Depending on modules‘ demands or other requirements, cooling may be necessary or
charging power may be lowered or even stopped, everything controlled by a central charging
master device.
5.2.4 Thermal management
The term ―thermal management‖ describes the efficient control of thermal energy flows in the
vehicle in accordance with specific requirements and prevailing operating and load
conditions. As a result the thermodynamic and the energy efficiency can be improved. This
leads to longer battery life and improved thermal comfort. All components in the cooling
circuits - e.g. radiator, fan, louvers, thermostat, electric machine, inverter, charger, heating
and water pump – must be in principle be included in the thermal management system.
The electrification of the power train allows the establishment of alternative and
unconventional vehicle concepts. The performance of these electric vehicles is substantially
restricted by today‘s battery technology. Despite the reduced amount of onboard energy the
consumer expects a suitable driving range and is not willing to accept any remarkable
comfort restriction. The conflict between the driving range and comfort has a significant
influence on the thermal comfort and appoints the importance of a well-designed thermal
vehicle concept and its control.

Deliverable D1.1
ELVA 65 SCP0-GA-2010-265898
Every electric vehicle needs thermal control for both, thermal conditioning of the power train
components and of the passenger compartment. For driving a city-cycle a middle class
vehicle requires on average around 13 – 18 kWh/100km for propulsion. With the efficiency of
the electric drive train this will cause about 1 – 2.5 kW of thermal waste energy. To enable
full performance of the propulsion system this energy has to be removed from the
components. A fluid cooling has become the state-of-the-art and standard for electric drive
train components.
The electric motor and inverter can be run up to relatively high temperatures. For energy
storage systems the Li-Ion technology promises actually best performance. For operation of
Li-Ion batteries strict temperature limits have to be guaranteed. The limits depend on the
chosen cell-technology and restrict the battery operation to the maximal cell temperature of
around 55 – 60 °C requiring a maximal water inlet temperature of max. 35 °C. The lower
operation temperature of 0 °C to -25 °C is limited by the chosen electrolyte. The operation in
winter may require the usage of a battery heater.
The energy needed for conditioning the compartment depends strongly of the ambient
temperature and reaches in European winter up to 4.5 kW for heating and in summer 2.5 kW
for cooling the compartment. The usage of an electric heater or an electric compressor for
air-conditioning reduces the vehicle range remarkably. The use of the thermal waste energy
from the electric propulsion components for heating can enlarge the range.
El.
Motor
Ch
arg
er
Ch
arg
er
Ch
arg
er
8b 8c
Compartment
Radiator
Radiator
Inverter
HV-Battery
Evaporator
Condensator
Reducer
Temperature Sensor
Y / X- Junction
4
Check Valve
13tØ16 mm
3
Control Valve
El. Heater
11
9t
1
2t
6 7
14
15
1012
x Aktive Component
8a
5
7t
4t
5t
8at 8bt8ct
Fig. 5-8: Example of thermal circuits for an electric power train
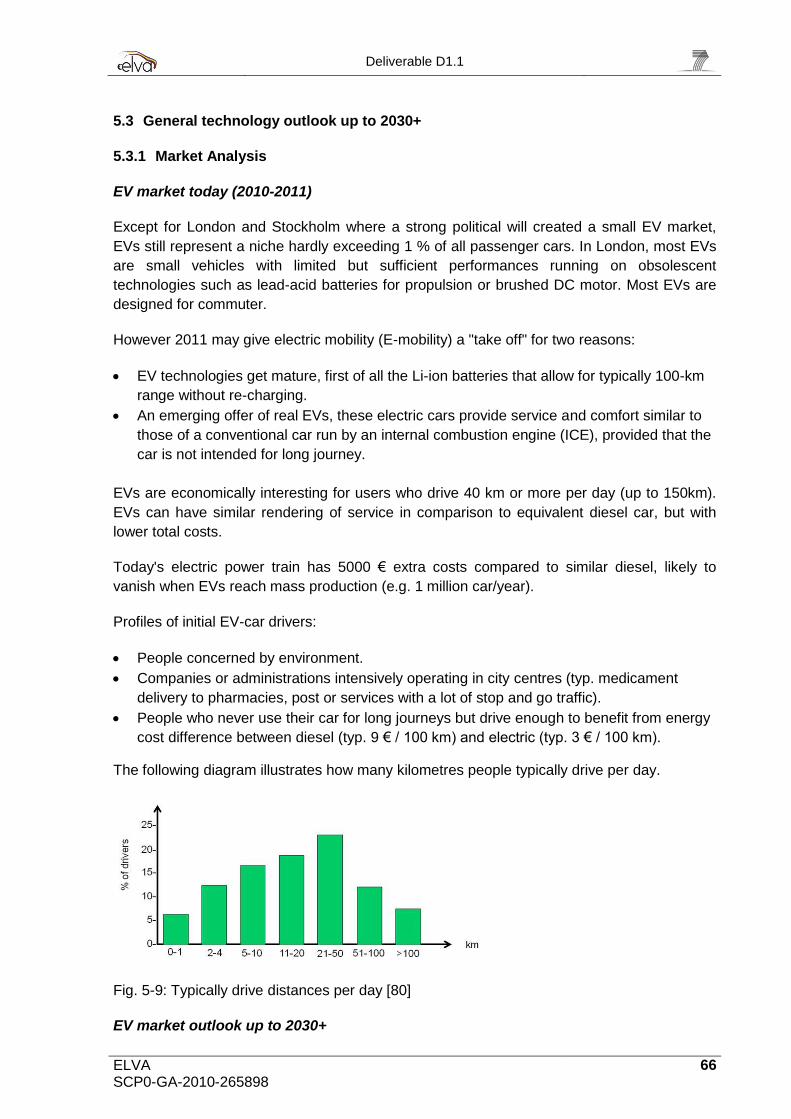
Deliverable D1.1
ELVA 66 SCP0-GA-2010-265898
5.3 General technology outlook up to 2030+
5.3.1 Market Analysis
EV market today (2010-2011)
Except for London and Stockholm where a strong political will created a small EV market,
EVs still represent a niche hardly exceeding 1 % of all passenger cars. In London, most EVs
are small vehicles with limited but sufficient performances running on obsolescent
technologies such as lead-acid batteries for propulsion or brushed DC motor. Most EVs are
designed for commuter.
However 2011 may give electric mobility (E-mobility) a "take off" for two reasons:
EV technologies get mature, first of all the Li-ion batteries that allow for typically 100-km
range without re-charging.
An emerging offer of real EVs, these electric cars provide service and comfort similar to
those of a conventional car run by an internal combustion engine (ICE), provided that the
car is not intended for long journey.
EVs are economically interesting for users who drive 40 km or more per day (up to 150km).
EVs can have similar rendering of service in comparison to equivalent diesel car, but with
lower total costs.
Today's electric power train has 5000 € extra costs compared to similar diesel, likely to
vanish when EVs reach mass production (e.g. 1 million car/year).
Profiles of initial EV-car drivers:
People concerned by environment.
Companies or administrations intensively operating in city centres (typ. medicament
delivery to pharmacies, post or services with a lot of stop and go traffic).
People who never use their car for long journeys but drive enough to benefit from energy
cost difference between diesel (typ. 9 € / 100 km) and electric (typ. 3 € / 100 km).
The following diagram illustrates how many kilometres people typically drive per day.
Fig. 5-9: Typically drive distances per day [80]
EV market outlook up to 2030+

Deliverable D1.1
ELVA 67 SCP0-GA-2010-265898
The forecast of the EV market share for 2020 or later is very uncertain due to several factors
like oil price, subsidies, commodity price, etc. Here are some examples.
1. IHK Stuttgart, the Chamber of Industry and Commerce of the Stuttgart region [81]:
IHK Stuttgart published 2010 a study on market share for innovative drive technologies. The
study proposes three scenarios based on the ubiquitous conservative-middle-optimistic
pattern:
Scenario I: 3 % market share for EVs in 2020, 6 % for 2030.
Scenario II: 5 % market share for EVs in 2020, 9 % for 2030.
Scenario III: 6 % market share for EVs in 2020, 13 % for 2030.
Fig. 5-10: Market share for EV (scenarios) [81]
2. Deutsche Bank, Global Markets Research, "Electric Cars: Plugged In 2", 2009:
China, which is rapidly becoming a venerable market force in the global auto industry, is
likely to adopt policies aimed at raising penetration rates for ―Alternative Energy Vehicles‖,
primarily consisting of PHEVs and EVs. The following diagram shows 9 % market share in
China in 2020.
Fig. 5-11: Market share in China 2020 [82]

Deliverable D1.1
ELVA 68 SCP0-GA-2010-265898
5.3.2 Battery
Future developments in the electrochemical energy storage will try to utilize the full potential
of element combinations in the periodic table of elements. Amongst theoretically most
promising and attractive combinations are combinations such Li-S, Li-O, Li-F.
At the actual state of R & D activities with lithium-sulphur batteries, the challenge focus
mainly on finding a suitable electrolyte. The first prototypes are very interesting regarding the
energy density. The main issue for the next time is the life time and the safety. In the case of
Li-S reducing side reactions is the most important goal.
Lithium-air batteries consist of lithium anodes electrochemically coupled to atmospheric
oxygen through an air cathode. Oxygen gas introduced into the battery through an air
cathode is essentially an unlimited cathode reactant source. Theoretically with oxygen as an
unlimited cathode reactant, the capacity of the battery is limited by the Li anode. The
oxidation of metal electrodes is standing for a ―burning‖ of metal such as in a fuel cell. This
combination provides of course the highest energy densities, but also the danger of
uncontrolled energy output.
When recharging Li-F it must be arranged as nano-scale matrix. The extremely small
diameter will allow compensating the poor conductivity. The design of such an electrode
structure and its controlled deposition of nano grains is one of the great challenges of future
battery development.
Generally, it must be remembered that practical (laboratory and prototypes) and theoretical
energy densities of the discussed systems may be very different. But the trend will be
anyway in the direction of the mentioned systems, since the high theoretical energy densities
allow gaining enough practical energy densities still positioned factors over the conventional
today‘s systems and thus practical implementation will deliver significantly higher energy
densities than today's known and commercialized systems.
On a shorter term scale also further developments of existing Li-Ion technologies are
expected. And, also on system level higher energy densities can be reached if for examples
very robust cell technologies can be employed.
The estimated cost for lithium-ion battery packs over the period till 2030 is published by a
representative study of McKinsey [89]. The price could drop to $ 380 per kilowatt hour by
2020 under a medium cost reduction scenario, see Fig. 5-12 (lithium-ion battery cost
assumption). This is mainly based on the volume rise, in addition to technical progress and
standardization of the products.

Deliverable D1.1
ELVA 69 SCP0-GA-2010-265898
Fig. 5-12: Lithium-ion battery cost assumption [89]
5.3.3 Drive train and brakes
Future trends of electric drive systems
The short term trend in electric mobility is dominated by the still very high price of the drive
batteries. Therefore the first generation of electric vehicles fulfils at least one of the following
conditions:
The battery capacity demand is low, due to very low vehicle mass (best example: electric
bikes where the fashion-wave is already there). Next candidates could be the electric
replacement of small motorbikes for cities (scooters <=50ccm).
Conventional engines are legally not allowed in an area or have to pay high extra fee to
drive in (London)
Financing/leasing the battery is supported by governments so that the end-user sees a
real alternative in an electric vehicle
some end-users can afford financing an electric vehicle with high-prestige value (Tesla
Roadster)
The political motivation of people to be independent from oil providers (project better
place)
As seen above, there is already a trend for vehicles at the two ends of the parameter scale:
electric bikes with very low system power and battery capacity to make it affordable for
masses and on the other end there are some extreme prestige dominated vehicles and
prototypes to wake up the interest of wealthy people. The market segment designed for
everyday people is not dominating yet. As the production technology and capacity of the key
components are established, the price reduction should lead to a wider spreading of the
electric vehicle market. The motivation for that is not only on the cost side (long time is
needed to suppress the complete system price to a competitive level), but on other positive
Deliverable D1.1
ELVA 70 SCP0-GA-2010-265898
properties like low noise level, simple drivability, legal motivations, image of environment-
friendly mobility, somewhat less running costs and all those additional features which are not
necessarily related to electric drive but may at first appear in electric vehicles (for example
infotainment features).
One possible tendency would be the significant reduction of the size and weight of the
vehicle to fit better to the inner city usage profile. This tendency allows using smaller
batteries. There are signs that a new vehicle category may come up (especially for cities).
Such a mini vehicle is an ideal base for electric drive due to small range and speed
requirements and improved manoeuvrability. To save as much room for payload as possible,
the wheel-individual drive system (in wheel motors with fixed gears or as direct drive) is ideal
for that vehicle category.
Vehicles with required long range will need electric drive components to reduce the
environment pollution. But a pure electric drive system is very unlikely.
Long term technological tendencies of electric drive system components will be to reduce the
size and find integration combinations, which are optimized for different vehicle types. Such
integration tendency can be the integration of the inverter into the motor, integration of two
inverters into one unit, integration of braking resistor power stage into the inverter, integration
of DC/DC converters into chargers or inverters, etc.
5.3.4 Charging
The battery costs will decrease and battery capacities will increase. The Charging power will
increase also, and charging times will go down. More and more public charging stations will
be available, some hundred Thousands in Europe in 2020, millions in 2030.
DC charging for quick charge will be standard in future. A battery will be able to be charged
to 80 % capacity in 10 minutes. Charging power then will be some 10 kW (or even 100 kW).
This will require additional vehicle infrastructure, such as DC power connectors or special
data exchange to the charging spot. This high power charging will most probably be done by
off-board chargers. Especially charging stations at highways will support this quick charge
function. A standardization of the battery bay will generate a maximum flexibility in vehicle
design, the possibility to increase the drive dynamic performance and the driving range. On
the other hand batteries with higher capacity and the possibility of high power charging will
replace any ideas of switchable batteries.
Stationary inductive charging
Although today‘s series EVs rarely have this feature, it may be an interesting option for EVs
in the mid-term range. The charging efficiency is roughly 10 % less than the wired solution
(depending on e.g. arrangement of coils), however, due to low power prices, hardly cost
relevant. Also the often used argument of bad EMC and potential negative impact on beings
is a solvable technical challenge (see also IP). So is the additional used space or single digit
weight (in kg) in a vehicle. The only relevant issue in our opinion is the additional one-time
cost.

Deliverable D1.1
ELVA 71 SCP0-GA-2010-265898
Fig. 5-13: Inductive charging principle
On the primary part (non-movable) the additional electronic effort is the conversion from 50
or 60 Hz grid frequency to low frequency (typ. 20 kHz – 150 kHz) with relative high power
(some kW). On top and most cost relevant is the coil part with primary transmitting and
secondary receiving coils. After high power rectification on the secondary part, there are no
additional electronics necessary. The coil diameters are mostly a few 10 cm up to 1 m and
the height is normally only a few cm, while the a.m. add-on electronics are 1 or 2 kg heavy
with approx. 2 litre volume.
The positive effect on inductive charging is the comfort, one wins:
No more cable handling
No more dirty hands
No touching of electricity containing parts
No add. safety and security efforts to lock connectors or to avoid driving, when connected
The power transmitting primary coil will always be stationary, means at a parking lot.
Some cars have their receiving, secondary coil at the front, around the grill or licence plate,
however most vehicles have it at the bottom, more or less centred. The better the horizontal
arrangement of the two ―laying‖ coils and the lower the air gap in between, the better the
coupling, the higher the efficiency. With coils of e.g. 50 cm diameter, 3 cm horizontal miss-
arrangement and 20 cm distance, there‘s an efficiency of more than 90 % achievable.
5.3.5 Thermal management
For ensuring maximal vehicle range without reducing the thermal comfort some passive and
active measures can be implemented.
The passive measures reduce the energy consumption by constructive changes.
Isolation of the vehicle body and reduction of the window surfaces decrease the required
energy for heating the compartment.
Usage of reflecting window surfaces with a shallow angle reduces the heat radiation into
the compartment and hence the needed energy for cooling.

Deliverable D1.1
ELVA 72 SCP0-GA-2010-265898
Usage of heat reflecting vehicle paints prevent heating up the compartment.
Solar technology can be used for aerating the cabin and thus to avoid heavily
overheating.
Reduction of thermal masses.
Active measures require additionally new components for a smart control.
In particular the usage of heat pumps instead of electric heaters and compressors can
reduce the energy consumption for conditioning the compartment and resp. the battery
significantly. CO2 as refrigerant promises a good performance. But still some technologic
challenges have to be solved at very low temperatures.
Decreasing the fresh air-circulation is another good measure for reducing both, the
heating and cooling energy. A certain part of the air still has to be exchanged to avoid to
high CO2 concentration in the compartment.
Thermal preconditioning of the vehicle during charging phases is cheap as the energy
does not come out of the battery and reduces significantly the required energy at the
beginning of a driving cycle. Thermal storage systems can provide the compartment with
required thermal energy additionally.
Braking phases are among the strongest energy killers. Recuperation of braking energy
enlarges the vehicle range. The reuse of the recuperated energy for heating or cooling
the compartment is accompanied by multiple losses. A control strategy which switches on
the electric consumers while braking directly without charging the battery first can enlarge
the range especially in city cycles.
The integration of a fluid chilled braking resistor (see chapter 1.2.2) makes the electric
braking all-time available and contributes thus to improve the braking performance. The
braking energy that cannot be stored in the battery, e.g. due to the fact that the battery is
already fully loaded, can be converted into thermal energy and be reused for
compartment heating.
Compulsory guided air flow increases the subjective well-being fast.
Window dehumidification and de-icing with electric films.
A smart thermal control should combine the active measures. Especially if linked to the route
planer/ navigation system the controller can select the best strategy.
5.4 Discussion and Conclusions
Future EVs will be different from today‘s cars in several ways, which requests an overall
optimization of efficiency and reliability of the drive train regarding:
Battery technology must be affordable, lightweight and reliable
Charging has to be standardized and easy to handle
The selected power train arrangement has to be optimized and matched with the brake
An intelligent thermal management keeps the efficiency of the EV on a high level
These topics are responsible for a successful introduction of EVs in near future and they
open up new opportunities and degrees of design freedom, which enable and require new
vehicle concepts.

Deliverable D1.1
ELVA 73 SCP0-GA-2010-265898
In a holistic approach the intelligent interaction between the domains power train, brake and
navigation as absolutely necessary. The ELVA project will respect such an approach,
presuming the availability of the technologies and their interaction.
With current vehicle body (not isolated) it is not sufficient to develop a heating system only
based on a thermal management. Thermal comfort and efficiency can only be provided by an
effective solution with a good thermal protection of vehicle, motor, components and
passenger compartment.
ELVA will first define the basics of the vehicle body and the weight issues, before a selection
of the power train arrangement is performed.

Deliverable D1.1
ELVA 74 SCP0-GA-2010-265898
6 Brake System Technology and Related Active Safety
6.1 Introduction
Market success of electric vehicles will be closely linked to their ability to reach high
efficiency, reliability and safety levels. The brake system is a significant part of the active
safety of any vehicle. Thus, an analysis of the state-of-the-art of today existing brake and
stability control systems and their possibilities for use in electric vehicles, including an
outlook on future systems and energy recuperation, is necessary.
6.2 State-of-the-Art
The state-of-the-art brake systems in the first generation of fully electric vehicles are quite
―simple‖ friction brakes. There is no real management or blending of brake force distribution
between friction and electrical/recuperative braking. Currently, there are three kinds of
conservative solutions that can be distinguished:
Mild generator brake torque during any accelerator pedal release. The limitations are the
small amount of deceleration and therefore recuperated energy, and - in case of full
battery capacity - almost no deceleration at all.
Enlarged free travel of brake pedal in combination with a brake pedal travel sensor in
order to create a basic recuperative deceleration when pushing the brake pedal in its
initial travel. The limitation is the inconsistent brake pedal characteristic, e.g. pedal travel
against vehicle deceleration becomes a function of the charge level of the battery.
Manual mode shift by the driver in order to select the amount of recuperative deceleration
by the generator, e.g. during downhill driving. The limitations are the reduced operational
comfort and the dependency of the correct driver decision.
The brake systems used today are based on conventional friction brakes that are
hydraulically actuated [83], see Fig. 6-1 (upper part with ―Muscular Energy and Boosted
Muscular Energy). For comfort reasons the driver‘s foot force is normally increased by using
a vacuum reservoir (―booster‖). The vacuum is usually produced within a combustion
engine‘s air intake manifold. Due to regulatory requirements, these systems work (with
limited effects), even when the booster is out of order. The design keeps a mechanical and
hydraulic contact between the driver‘s brake pedal and all friction brakes which enables
braking even when the auxiliary vacuum system is no more working. State-of-the-art in
today‘s electric vehicles is using this type of brake system with an additional vacuum pump to
replace the air intake that itself is not existing in an electric motor vehicle.
Anti-lock, traction control and yaw stability functions are hereby realized by means of a
hydraulic-electronic control unit with wheel-individual valve and pressure timing for all
mechanical friction brakes of the vehicle.

Deliverable D1.1
ELVA 75 SCP0-GA-2010-265898
Fig. 6-1: Overview service brake concepts
6.3 General Technology Outlook up to 2030+
The existing hydraulic brake systems, with the driver‘s foot force directly applied to the
hydraulics will be more and more replaced by so-called by-wire technologies, where the input
to the brake pedal does not result in a direct coupling with the hydraulic system. Such
systems are necessary for a torque blending between friction and recuperative generator
(electrical motor) braking, without pedal implications (unsteadiness, pulsing etc.).
In these systems (lower part of Fig. 6-1, with Electronically Controllable Boosted Muscular
Energy Braking System and both Full Power Brake Systems), the driver applies his force to a
conventional pedal, but the pedal back-force is given by a simulator (springs, damper) so as
to guarantee a common feeling, whereas the friction brake force for the vehicle wheels is
generated by by-wire sensors and actuators (electric-pneumatically [vacuum], electric-
hydraulically, electro-mechanically) and/or the recuperative generator torque.
An example of such a first electric vehicle brake-by-wire system, already introduced to the
market for hybrid vehicles, is shown in Fig. 6-2: An active booster with no direct coupling
between pedal or hydraulic lines, but an electro-solenoid valve inside and a vacuum pump is
capable of a selective distribution between hydraulic (friction) and regenerative brake
torques, including a seamless transition of both modes (torque blending).
Other relevant systems – some of them also being already in production for hybrid vehicles -,
still purely hydraulic-based (but already with a decoupling of driver‘s foot from the hydraulic
line [―by-wire‖ technology]), are shown in the Figs. 6-3 – 6-6 [84]. These systems can
manage a cooperation of friction and regenerative brake torques, too, not only in hybrid but
also fully electric vehicles.

Deliverable D1.1
ELVA 76 SCP0-GA-2010-265898
Fig. 6-2: Brake-by-wire system with active booster
Fig. 6-3: Advics/Aisin solution – EHB (Lexus/Toyota Prius Hybrids)

Deliverable D1.1
ELVA 77 SCP0-GA-2010-265898
Fig. 6-4: Nissin Kogyo solution – AHB (Honda Civic)
Fig. 6-5: TRW solution – SCB

Deliverable D1.1
ELVA 78 SCP0-GA-2010-265898
Fig. 6-6: TRW solution - AHB
An interim solution on the way towards a total ―dry by-wire brake‖ system could be a hybrid
(combined) brake system with one axle being equipped with conventional hydraulic brakes
and the other axle with electro-mechanical callipers, see Fig. 6-7.
Fig. 6-7: Hybrid brake system

Deliverable D1.1
ELVA 79 SCP0-GA-2010-265898
A very high-sophisticated solution will be the complete electro-mechanical brake-by-wire
system (full EMB, ―dry‖ braking without any hydraulic fluid, [85], see Fig. 6-8), with control
(anti-lock, traction control, yaw stability) by a central Electronic Control Unit (ECU) which
influences individually the four electro-mechanical callipers (with a calliper-integrated electric
motor and gearing in each calliper) of the vehicle.
All of the shown brake systems – including full EMB – are able to fulfil the safety regulations
of an ECE homologation [86].
Already known additional means for enhancing safety (shortening braking distance, e. g. see
[87]) can be incorporated in all kinds of conventional and especially future brake systems.
Fig. 6-8: EMB system layout and components
The complete overview of actual and future brake system architectures as shown in Fig.6-1,
differentiates the architectures in the kind whether brake-by-wire is possible or not. Only the
last three architectures provide this capability, and they are especially suitable for electric
vehicles with a torque management and blending function between friction and recuperative
braking.
6.4 Stability Control Functions and Driver Assistance Systems
State-of-the-art brake systems are equipped with a wide range of stability enhancement
functions because a wheel individual controllability of braking torque is a powerful tool to
improve the vehicle‘s stability. The drive system of the vehicle today is only providing a
(combustion engine) drive torque limiting functionality and is acting as a slave under the
master of the vehicle dynamics control system, the latter one being integrated into the brake
system‘s electronic control unit. This kind of architecture is mainly due to the fact that the

Deliverable D1.1
ELVA 80 SCP0-GA-2010-265898
internal combustion engine based drive system has only one freedom to influence the global
driving torque (no wheel selective drive) and has limited control dynamics.
With the appearance of electric drive systems these facts may change. Electric motors are
reacting fast and precisely on a torque command, and in case of a multi-motor drive concept
a wheel individual or axle individual drive and/or brake torque control is feasible. An often
mentioned function, the so called ―torque vectoring‖, is the best example of the benefits of
wheel selective drive torque control. This function is intended to improve the vehicle‘s yaw
behaviour with utilizing the near-wheel or in-wheel electric motors to generate controlled
yaw-torque stabilization (torque around the vertical axis of the vehicle). Since the electric
motors convert electric energy into mechanical energy, the energy and power management
of the drive system has to be involved to open the freedoms required by the stability
enhancement functions. Electric braking on one wheel plus driving on another wheel creates
high electric power flow between the two electric machines but has a limited impact on the
battery power. These freedoms will require a restructuring of the functional architecture of the
control systems.
Subsystem boundaries have to be redefined in the future to realize most of the new technical
possibilities. This tendency might lead to a new control structure: a kind of vehicle-global
motion control function can be established. This could act as a master above all vehicle-
stability relevant subsystems such as electric drive components, brake system, steering and
suspension control. The role of electric drive will move from the pure drive function to a ―drive
+ brake + stabilize‖ control. A near-wheel motor or in-wheel motor will be involved into the
wheel slip control functions such as anti-lock, traction control and drive stability
enhancement. The permanent magnet synchronous motors - the almost only possibility for a
direct drive in a wheel motor system - need a very fast motor position sensing and have a
fast torque response; so the motor control electronics provide a good possibility for a quick
and reactive support of wheel rotation speed control. This wheel speed control – due to its
fast motor position sensing and fast task frequency << 1ms - is intended to improve the
wheel speed behaviour and vehicle stability under slippery road conditions and
corresponding braking manoeuvres. The wheel speed control is continuously under control of
the motion control function of the vehicle, where the cooperation with friction brakes is also
realized. Such control architectures may differ from today‘s vehicle stability control
structures. The new control structures are intended to improve the stability of the vehicle and
enable a higher rate of recuperation during braking and stabilization manoeuvres. The
integration of a braking resistor into the vehicle‘s electrical and thermal systems allows
keeping these advanced electric wheel speed control functions even under circumstances
when the battery is not able to receive the full electric power from the braking. With these
constructive actions the portion of friction braking could be reduced which mean less friction
brake power generation and a chance to downscale the friction brake system and to use
advanced compact actuators. The portion of pure electric braking capability and the
improved availability due to a braking resistor makes the system by-wire capable, being able
to support driver assistance functions and also comfort functions like soft stop without brake
jerk in front of red traffic lights.
Advanced driver assistance functions are intended to reduce the risk of driving and reduce
the effort of the driver in safely driving the vehicle. A part of these functions needs a by-wire
capability of the drive train, the brake system and the steering. Adaptive cruise control (ACC)
Deliverable D1.1
ELVA 81 SCP0-GA-2010-265898
systems need sometimes a smoothly controllable braking effect with minimal NVH (noise,
vibration, harshness) in order to reduce the vehicle‘s speed if the vehicle in front is driving to
slowly or the own vehicle has to keep the speed on a downhill road. Electric drive systems
provide the necessary brake and drive capability with the additional benefit of recuperating
energy of braking. A further step is an automatic braking in case of collision danger to warn
the driver and to reduce the speed difference between the vehicle and the obstacle. Electric
drive supports this and other similar functions like hill descend control the same way: simply
providing controlled braking. Drive systems with torque vectoring capability (wheel individual
drive motors) open a new possibility in lane departure warning and avoidance systems where
camera(s) are detecting the tendency for unwanted lane departure; a torque difference is
generated between the left and right side wheel motors in order to act like a smooth steering.
If the car is not equipped with electric servo steering or by-wire steering, the torque vectoring
function may serve as an actuator for this small corrective action. Another positive feature of
electric motors is the very good torque and rotation speed controllability at the near zero
speed range. This feature might open new possibilities in supporting the parking aid
functions. The importance of parking manoeuvres might be a bit underestimated today even
if it is already a challenge for many drivers (just an indication: see the many funny you-tube
videos about how people fail manoeuvring into a parking slot). The importance of parking
manoeuvres and traffic jams/stop & go supporting functions is surely rising with the global
trend to ―megacities‖ where parking place is rare and has rising value. Electric drive systems
may get a good chance to win market if the precise controllability of electric motors is used
properly for manoeuvring aid functions. Several parking aid functions can be realized by
them with different complexity:
Simply switching to a special mode where the accelerator pedal characteristics are
optimized for parking manoeuvres
Introducing a kind of 1D joystick by means of which the driver can smoothly control
forward and backward crawling in a speed controlled way with seamless transients
between forward and backward driving without the necessity to change between forward
and reverse gear (just like toy cars)
The previous solutions with the combination of a motion limitation based on parking aid
sensors. This would behave like a ―virtual cage‖ where the vehicle stops crawling
automatically some centimetres before touching an obstacle during manoeuvring
Fully automatic parking where the steering is controlled automatically and the drive
motors are working in an advanced speed controlled or position controlled mode to
realize highest motion control precision
The rotation speed control function – mentioned before at the vehicle dynamics control topics
- can be implemented in a way that both the vehicle dynamics and the manoeuvring function
groups are supported by a generic algorithm in the sense of motion control.
6.5 Discussion and Conclusions
ELVA should go beyond the state-of-the-art by applying electro-hydraulic or electro-
mechanical brakes to the electric vehicle, preferably controlled by by-wire means.
The brake system must be able to recuperate energy. By pure friction braking, normally a
high amount of energy is dissipated into heat and cannot be used within the vehicle
anymore. By an intelligent solution part of this energy can be recycled, using the electric

Deliverable D1.1
ELVA 82 SCP0-GA-2010-265898
motor(s) as generator(s). By these means, a longitudinal motion control for optimized energy
consumption in an electric vehicle is feasible.
The brake force generation has to provide a management between friction and electrical
regenerative braking, depending on the individual situation (like soft stop, emergency
braking). Also a smooth transfer between friction and regenerative braking is to be
guaranteed. This is achieved by optimal blending of electrical and mechanical brake torques.
A big challenge is the perfect handling of the basic brake function by recuperating energy out
of the movement (deceleration) of the fully electric vehicle and to use the friction brake only
for ―hard stops‖ or emergency situations. The switch from one (recuperation) to the other
(friction) mode must be taken by the system itself, within shortest time and without error, e.g.
without any negative impact on safety (stopping distance, vehicle stability) and driver‘s
perception or influence (no heavy pedal implications).
As an alternative to the central motor concept, a new cooperative motion control
management of individual electric motors is achievable: this may be the case during anti-lock
conditions, due to the possibility of wheel-selective distribution of torques by controlling
individual electric hub motors (in-wheel motors).
Also torque vectoring including vehicle stability control can thus be influenced in a positive
kind and manner.
Additionally, by the electrification of the brake system including the active control of electrical
drive motors, solutions summarized by ―brake-by-wire‖ systems may open further options
towards active safety in terms of advanced driver assistant systems [88], e.g. adaptive cruise
control, stop & go/traffic jam assist, parking aid.

Deliverable D1.1
ELVA 83 SCP0-GA-2010-265898
7 State-of-the-art and trends in active and passive safety
7.1 Introduction
Traffic-related accidents are a major threat to life to our society. In spite of the significant
improvements in vehicle safety over the past 25 years, the current number of deaths and
injuries plus all the associated social and economic costs, remain unacceptable. In Europe
the number of fatalities is decreasing (Fig. 7-1), but still more than 35.000 people have died
on European roads in 2009. Fig. 7-1 also illustrates that the objective to save lives of the
European commission (blue line) has not been met in the past decade.
Worldwide according to the World Health Organisation (WHO) [90] more than 1.2 million
people die every year due to traffic accidents and this number is expected to get worse.
WHO predicts that in 2030 road accident fatalities will be the fifth leading cause of death in
the world (now it is ranking 9).
Fig. 7-1: Road traffic fatalities in Europe: comparison of European targets set in 2000 and
actual fatalities till 2009.
In industrialized countries about half of the traffic fatalities are vulnerable road users
(pedestrians, pedal cyclists and motor cyclists (incl. mopeds) while in developing countries
the ration of vulnerable road users is even higher. Car occupant fatalities mainly occur in
frontal and side impacts.
Automobile safety includes the study and practice of vehicle design, construction, and
equipment to minimise the occurrence and consequences of automobile accidents. During
the last decades the safety of vehicles has changed from an important distinctive criterion to
a basic requirement for the consumer (ABS, ESP, airbags etc.). The increase in safety
awareness is also represented in increasing safety standards like Euro NCAP. To stand out
Evolution 1990 - 2010
EU fatalities
54.000
49.900
46.200
39.600
36.700
34.000
31.500
29.200
27.000
74.900 75.400
70.700
65.40063.900 63.200
59.40060.300
59.00057.700
56.400
54.000 53.300
50.400
47.300
45.300
43.100 42.500
35.200
42.800 38.900
20000
30000
40000
50000
60000
70000
80000
1990 1991 1992 1993 1994 1995 1996 1997 1998 1999 2000 2001 2002 2003 2004 2005 2006 2007 2008 2009 2010
Source: - CARE (EU road accidents database)
- National data
2010 objective : 25.000 lives to save
EU fatalities

Deliverable D1.1
ELVA 84 SCP0-GA-2010-265898
of their competitors, automotive manufacturers have to increase their constructive effort to
achieve above-average test results in order to attain a buying incentive.
The methods for improving vehicle safety can be divided into three categories as illustrated
in the Safety Phase Chart in Fig. 7-2. The first category deals with measures avoiding the
accident usually referred to as active safety. The second group deals with mitigating the
consequences of an accident if an accident happens, usually referred to as passive safety
and the third category refers to post crash care (medical care etc..). In this chapter we will
focus on active and passive safety. Concerning post crash care it is important to mention
here that automatic warning of emergency services after an accident has happened (e-Call)
and providing the rescue team actual information on crash severity and specific vehicle
information that may be of importance in the rescue phase, is important and become
technical feasible in the future. This in particular is important for electric vehicles due to the
presence of the large number of batteries and related risks (see also chapter 7.3.4).
Another terminology which is more and more used is integrated safety. This is the field in
which active and passive and also post crash safety meet and interact closely, to offer the
best protection to road users. Pre-crash sensing systems are of particular importance as
integrated safety systems. Such systems consist of anticipatory crash sensors with related
scene modelling algorithms coupled to safety devices via decision algorithms embedded in
control units (see also chapter 7.2)
Fig. 7-2: Methodologies to reduce accidents and the consequences of accidents
The effect of the efforts being made to increase active and passive safety can be illustrated
by German accident statistics. By enhancing active safety the number of accident could be
slightly reduced despite considerably increased traffic volume. Passive safety measures
significantly lowered the risk of being injured or killed during an accident (Fig. 7-3).

Deliverable D1.1
ELVA 85 SCP0-GA-2010-265898
Fig. 7-3: Accident statistics of Germany [92]
7.2 Active Safety
7.2.1 DAS and ADAS systems
Fig. 7-4 illustrates the effect of various types of active safety systems. What can be seen is a
steadily decrease in number of accidents per kilometre travelled. The introduction of all kind
of active safety systems has significantly contributed to this decrease.
Very important in the field of active safety are the so-called ADAS systems (Advanced Driver
Assistance Systems. They are usually defined as:
Vehicle control systems that use environment sensors to improve driving comfort and/or
traffic safety by assisting (and taking over the role of) the driver in recognizing and reacting to
potentially dangerous traffic situations.
ADAS systems are a special category of Driver Assistance Systems (DAS). Examples of
DAS systems already on the market include ABS, ESC, cruise control, speed limiter, tire
pressure monitoring and rear vision (parking aid).
ADAS systems can be subdevided into five categories:
• Driver information systems: support driver on the strategic level on his driving tasks
(route navigation, traffic sign recognition, night vision, adaptive lighting control)
• Driver warning systems: support driver on the manoeuvring level and actively warn
driver on potential dangers (parking assistant, lane departing warning, blind spot
warning, driver drowsiness warning, forward collision warning and intersection
collision warning)
0
5
10
15
20
25
0
100
200
300
400
500
600
700
800
900
1000
1970 1980 1990 2000 2007
Pa
sse
nge
r-K
ilom
ete
rs, A
ccid
en
ts
De
ath
s
Passenger-Kilometers [Billion pkm]
Accidents [1000]
Deaths [1000]
0
5
10
15
20
25
0
100
200
300
400
500
600
700
800
900
1000
1970 1980 1990 2000 2007
Fata
litie
s
Tota
l p
km,
Acc
ide
nts
Year
Total pkm [billion pkm] DE
Accidents [1000] DE
Fatalities [1000] DE
46 Deaths/Billion pkm
5 Deaths/Billion pkm
Active Safety
Passive Safety
Year

Deliverable D1.1
ELVA 86 SCP0-GA-2010-265898
Fig. 7-4: Effect of active and passive safety systems on accidents and fatalities per
distance travelled
• Intervening systems: active support to the driver on the control level (lane keeping,
intelligent speed adaption and adaptive cruise control)
• Integrated active/passive systems working together in a co-operative way towards
vehicle safety: pre-crash sensing systems (PCS)
• Fully automated systems: driver out of the control loop
In DAS and ADAS systems electronics, communication and intelligence in and around the
vehicle are important enabling factors and as can be seen from the various technologies that
already have been developed, the automotive industry has made significant progress in
developing new advanced, more complex safety systems based on the new technologies
that have become available.
Concerning PCS systems technological development in the field of sensor technology has
created very promising new opportunities to gather information on accident parameters
before and during the crash. This information can be used for influencing the crash
conditions and the response of safety systems in order to reduce the risk of injuries and
fatalities in a much more effective way. This is particularly true as such pre-crash sensing
based systems allow the optimisation of the injury mitigation process for each specific
accident situation separately rather than applying protection methodology which has been
optimised for a specific accident situation such as that prescribed by crash regulations.
7.2.2 Assessment methods
In contrast to the assessment of passive safety systems (see 7-3) for active safety systems
and in particular for ADAS systems objective reliable assessment systems are lacking.
Significant developments in the field of ADAS systems are required focusing among others
on methodologies and related numerical and experimental tools for the design and

Deliverable D1.1
ELVA 87 SCP0-GA-2010-265898
evaluation of these systems. In particular reliability is an important issue and therefore new
methods are needed to evaluate these systems under a large range of conditions including
situations where the systems should not be activated but still do (false-positives).
Potential assessment methods for ADAS systems can be divided into:
• Accident investigation
• On the road testing (field testing)
• Test tracks (driving simulation)
• Laboratory testing
• Virtual testing (computer simulations)
Passive safety assessment for regulatory (and consumer testing like Euro NCAP) purposes
is largely based on laboratory testing while virtual testing here is largely used in the design
process. For active safety systems and in particular ADAS systems a combination of the
above methods is expected to be used (except accident investigations). It is expected that
consumer testing organization like Euro NCAP will take the lead (rather than regulatory
body). Euro NCAP has recently started to take active safety systems on board in their
evaluation system and their roadmap which covers the period up to 2015. [91] proposes
assessment methods for amongst others: ESC, Intelligent Speed Adaption (ISA) and
advanced safety functions for collision mitigation for vehicles and vulnerable road users.
7.3 Passive safety
The passive safety characterises the ability of vehicles to protect the occupants during a
crash and contents primarily of the airbags, seatbelts and the physical structure of the
vehicle. However, passive safety is not restricted only to the protection of vehicle passengers
but also includes the protection of outside traffic participants like pedestrians and cyclists.
Additional key aspects are the inner and outer compatibility. While the inner compatibility
attends to the self-protection of passengers by equivalent deformation zones, design of the
interior and restraint systems, the outer compatibility means the adjustment of deformation
forces to deformation paths with regard to distributed energy absorption to all participants of
the accident in compliance with the biomechanical limits.
7.3.1 Structural Components of Vehicles
The structural components of cars are facing basically three requirements concerning
passive safety:
Adequate strength of passenger compartment (survival space)
Adequate space in the deformation area to transform kinetic energy into deformation
work in compliance with biomechanical limit values
Compatibility with other traffic participants

Deliverable D1.1
ELVA 88 SCP0-GA-2010-265898
These basic requirements differ in their characteristic concerning separate areas of the
vehicle structure (see Fig. 7-5).
Fig. 7-5: Deformation areas for front, side or rear impact
The deformation zone in the front is designed for the demands of accidents with high relative
velocities and often only partial overlap (offset). Compared to the front, the relative velocities
during rear impacts are lower. Furthermore, a generally large free deformation space helps
to realise the requirements of passive safety. The deformation zone at the side has to be
very rigid, because of the closeness to the passengers. Difficulties occur due to the large
door openings and the dominant bending load on the components (b-pillar, rocker panel,
etc.) in side impacts.
The specific requirements of the three deformation zones are listed below:
Front end:
High relative velocities
Often partial overlap at accidents (offset)
Rear end:
Low relative velocities
Large deformation space
Side:
Very low deformation path
Mainly bending load on the components
Large door openings
While conventional cars have voluminous and almost non-deformable engine blocks, which
reduce the available space of forward displacement and in the worst case could hit the
firewall and increase the intrusion in the passenger cell, within EV space in the front
deformation zone
rear end impact
deformation zone
frontal collision
deformation zone
side impact
safety passenger cell

Deliverable D1.1
ELVA 89 SCP0-GA-2010-265898
compartment can be gained and be used to improve the protection in car to car impacts and
the self-protection as well as the pedestrian protection. In this context the compatibility of
different traffic participants and the restraint systems come to focus.
7.3.2 Compatibility and Restraint Systems
The frequency of accidents between vehicles of different categories is shown in Fig. 7-6.
Though the number of collisions between compact and luxury class cars is rather small, it is
highly relevant for security because due to the law of conservation of momentum and the
second law of Newton, the change of velocity Δv and the decelerations of both vehicles
depend on their mass ratio.
A study of the Insurance Institute for Highway Safety (IIHS) showed that between the years
2000 and 2003 18 % of fatalities were caused by accidents of passenger cars with pickups
and SUVs [93]. In Europe the increasingly wide spectrum of cars (more small and very small
but also more luxury class vehicles and SUVs) also raises the necessity of car designs
concerning compatibility, whereas other collision scenarios still have to be considered.
Fig. 7-6: Frequency of different accident categories
Compatibility can be divided into two types: force compatibility (stiffness, load-level at
deformation, homogeneity) and shape compatibility (geometry, positioning of the main load
paths, crash management systems), see Fig. 7-7. Besides methods of passive safety,
accident avoiding systems of active safety are also a main factor for the compatibility (e.g.
City Safety by Volvo; PRE-SAFE by Mercedes-Benz).
By the dimensioning of the deformation zones the taken energy and its deformation can be
influenced. At disadvantageous dimensioning of a heavy vehicle it will dissipate some of its
kinetic energy by deformation of the front structure of the weaker crash partner.
Compatibility at frontal collision: Who hits whom?
Compact vehicle / Compact vehicle
Compact vehicle / Upper class
Upper class / Upper class
30 %
5 %
49 %
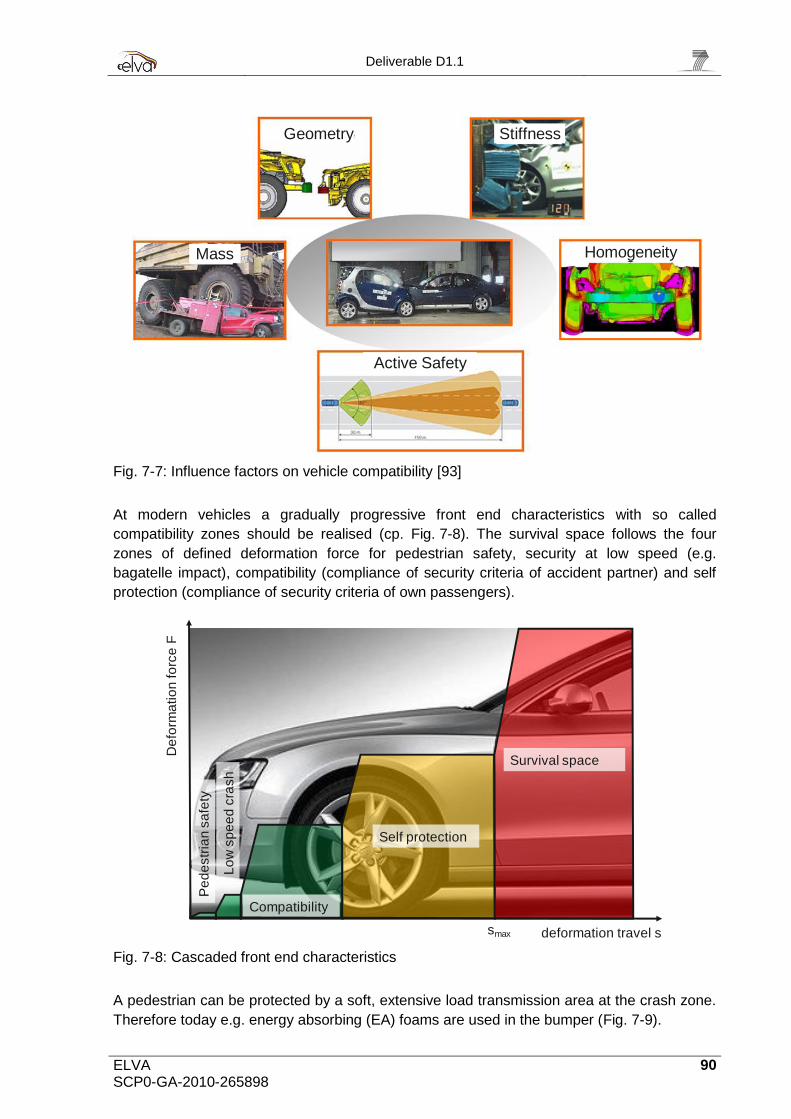
Deliverable D1.1
ELVA 90 SCP0-GA-2010-265898
Fig. 7-7: Influence factors on vehicle compatibility [93]
At modern vehicles a gradually progressive front end characteristics with so called
compatibility zones should be realised (cp. Fig. 7-8). The survival space follows the four
zones of defined deformation force for pedestrian safety, security at low speed (e.g.
bagatelle impact), compatibility (compliance of security criteria of accident partner) and self
protection (compliance of security criteria of own passengers).
Fig. 7-8: Cascaded front end characteristics
A pedestrian can be protected by a soft, extensive load transmission area at the crash zone.
Therefore today e.g. energy absorbing (EA) foams are used in the bumper (Fig. 7-9).
Geometry Stiffness
Mass Homogeneity
Active Safety
smax deformation travel s
De
form
atio
n fo
rce
F
Pe
de
str
ian
sa
fety
Compatibility
Self protection
Survival space
Lo
w s
pe
ed
cra
sh

Deliverable D1.1
ELVA 91 SCP0-GA-2010-265898
Fig. 7-9: Construction of front structure in consideration of compatibility
But a favourable configuration of the vehicle structure is not sufficient enough to ensure
passenger survival in case of an accident. Unsecured passengers do not take part in vehicle
deceleration until their impact on interior parts and are exposed to very high accelerations
thereafter. So the optimised deformation zones have to be combined with restraint systems
(RS), which are responsible for linking the passenger to the vehicle deceleration and thus for
tolerable, survivable loads.
The improvement of passenger safety can thus be reached by constructional measures on
the vehicle‘s lateral structure, via upholstery or by adaptive airbag systems.
The demands placed on a restraint system are summarised below:
early linking of the passenger to the cell deceleration, i.e. small belt slack
optimal utilisation of the available forward displacement
low and on a wide area affecting restraint forces
adherence to the permissible biomechanical limit values
comfortable operation regarding high acceptance
In regard to the restraint systems, a distinction is made between active systems, which must
be applied by the driver himself, and passive systems, which protects the passenger without
self-manipulation (Fig. 7-10). All systems focus with their retention forces on the areas of the
head, thorax, pelvis and knee thigh. To ensure the customers safety vehicles are reviewed
within a wide number of tests and regulations.
Bumper Beam
Bumper Skin
EA-Elements
EA-Foam Frontend Longmember

Deliverable D1.1
ELVA 92 SCP0-GA-2010-265898
Fig. 7-10: Classification of restraint systems
7.3.3 Crash Standards
Crash tests can be subdivided into their intention (e.g. legislation standard, consumer
protection laws), into selling markets (e.g. USA, Europe) and into their field of investigation
(e.g. Frontal, Side). Fig. 7-11 gives an overview of the categorisation of crash standards
according to the named subdivisions.
While the legislation standards have certain specification that has to be fulfilled, consumer
tests give a possibility to evaluate the safety of automobiles. The aim of the „New Car
Assessment Program" (US and Euro NCAP) is bringing transparency to the customers,
regarding the passive and active safety of various vehicles. The consumer ought to be able
to compare between different vehicles using a simple quantification scale consisting of 0 to 5
stars in which a five star rating represents a car with a very high passive safety, without
consulting technical literature. For Europe the Euro NCAP was developed which has, with its
various test procedures, much higher requirements than comparable legislation standards.
Due the big public interest the Euro NCAP achieved the last years it is introduced in detail at
this point.
Restraint Systems
active
Lap Belt
2-Point Belt
3-Point Belt
4/5-Point Belt
passive
Seat
Belt Tensioner
Belt Tightener
Belt Force Limiter
Front Airbag
Side Airbag
Window Airbag
Future Airbag Systeme
USA: 2-Point Belt with Knee Bolster
Knee Bolster and Front Airbag

Deliverable D1.1
ELVA 93 SCP0-GA-2010-265898
Fig. 7-11: Categorisation of crash standards
Since 2009, Euro NCAP only releases one overall star rating for each car tested with a
maximum of five stars (1st level). This overall safety rating is composed of the car‘s
performance in the following categories [94]:
adult protection
child protection
pedestrian protection
safety assist
Besides the overall star rating for the safety of a car, the percentage for the performance in
each category is also published (2nd level). The category ―adult protection‖ comprises the
following test procedures (see also Fig. 7-13):
vehicle frontal impact
vehicle car to car side impact
vehicle pole side impact
whiplash test with a driver‘s seat on a sled reproducing a rear impact
The overall score is calculated by weighting the four categories with respect to each other,
while making sure that not one area is underachieving. A bad rating in one category causes
a downgrading of the overall rating. Due to varying car configurations in the different
legislationalstandards
consumerprotection laws
Europe
Crash standards
RotWUSA Europe RotWUSA
Euro NCAPAZT...
Japan NCAP...
...Side
ECE-R95...
ECE-R94...
FrontFMVSS 201...
FMVSS208...
Front Belts Front Side ...
US NCAPIIHS...

Deliverable D1.1
ELVA 94 SCP0-GA-2010-265898
European countries, the tested cars always have the poorest safety options that are
available. The third level gives a detailed rating for the four categories. Fig. 7-12 shows the
Euro NCAP rating system in summary with its three levels of rating.
Fig. 7-12: The three levels for overall rating at Euro NCAP
Euro NCAP is currently in a revision process to increase the safety level of cars on the
market. Therefore in the past new test procedures were added and point systems were
changed to the today‘s described rating. Until 2012 the weighting system is changing
stepwise so that tested cars need more and more percentages in each category to reach the
same overall star rating. All written information and all test results can be found in [94]
Fig. 7-13: Test configurations of Euro NCAP
Frontal impactwith full vehicle
Car to car side impact with full vehicle
pole side impact with full vehicle
rear impact simulation at driver’s seat
Sled tests with the followingaccleration-time-curves

Deliverable D1.1
ELVA 95 SCP0-GA-2010-265898
Vehicles with electric power trains have to fulfil the same requirements on as conventional
cars, but several additional aspects have to be taken into account, which are not clearly
defined by consumer protection laws or legislation standards and will be discussed in the
following chapter
7.3.4 Requirements on electric vehicles and systems
Additional aspects concerning the safety of the electric storage system of electric vehicles
(EVs) are the loads acting on the system, the dimensioning of the battery housing and the
surrounding structure.
Legislation standards concerning the electric storage system of EVs are:
ECE R-100
DIN EN 60086-4
DIN V VDE V 0510-11
DIN IEC 61982-4 & 5
EN 60086-2-27
UN Recommendations for the Transport of Dangerous Goods, Part III
Since all of the named standards base on the UN recommendations for the transport of
dangerous goods [95] following only this standard is explained. Here all the requirements on
storage systems for the transport from the system manufacturer to the customer are defined.
It does not directly reference load cases or test procedures for EV. However, since the use of
electric storage systems in EVs is comparable to the transport of such systems, OEMs refer
to this standard.
The storage system is distinguished into the systems Cell, Component Cell and Battery: Cell
means a single encased electrochemical unit which exhibits a voltage differential across its
two terminals. Battery means one or more cells which are electrically connected together by
permanent means, including case, terminals and markings. Component Cell means a cell
contained in a battery
The standard demands eight tests for lithium ion cells and batteries: altitude simulation,
thermal test, vibration test, shock test, external short circuit, impact, overcharge and forced
discharge. The impact test and forced discharged are not processed in case of batteries.
Regarding the usage in EVs and in the context to structural requirements, only the tests
vibration and shock are described in detail.
Within the vibration test the batteries are firmly secured to the platform of a vibration machine
without distorting the cells in such a manner as to faithful transmit the vibration. The vibration
is a sinusoidal waveform with a logarithmic sweep between 7 Hz and 200 Hz and back to 7
Hz traversed in 15 minutes. This cycle is repeated 12 times for a total of 3 hours for each of
three mutually perpendicular mounting positions of the battery. The maximal applied
acceleration is 8g.
For the shock test the batteries are secured to the testing machine by means of a rigid mount
which supports all mounting surfaces of each test battery. Every battery is subjected to a
half-sine shock with a peak of acceleration of 50 g and pulse duration of 11 ms. The battery

Deliverable D1.1
ELVA 96 SCP0-GA-2010-265898
is subjected to three shocks in the positive direction and followed by three shocks in negative
direction of three mutually perpendicular mounting positions of the battery for a total number
of 18 shocks. [95]
The standards requirements on cells and batteries are no mass loss, no leakage, no venting,
no disassembly, no rupture and no ignition.
Additionally to the legislation standards several studies are available. In this context stands
the Sandia Report with the aim to assist in the further development of advanced
transportation technologies. The Sandia National Laboratories (SNL) possess expertise in
battery abuse testing and cooperates with the U.S. Department of Energy‘s Office of
FreedomCAR and Vehicle Technologies and the United States Advanced Battery
Consortium Tech Team. SNL acts as an impartial body whose responsibility under the
FreedomCAR Program is to perform abuse testing for electrical energy storage systems of
the size and type used in electric vehicles and hybrid electric vehicles. [96]
Sandia‘s approach distinguishes the storage system in a quite similar way like the UN
transportation standard in units, modules and packs. While the unit means the cell and the
pack embrace the entire battery, the module is an integrated assembly of multiple cells in
series or parallel configuration with the associated control electronics. The tests suggested
by Sandia differ from the previously mentioned. As before only the tests handling the
structural behaviour of the storage system are described in detail at this point: the controlled
crush, the drop and the shock tests.
The controlled crush is applied on module level. The module is placed between a textured
and a flat plate (see Fig. 7-14). One plate is mounted at an actor and equipped with a force
transducer. This test is conducted in two stages. The first stage is a displacement of 15 % of
the module‘s height, which is held for 5 minutes. The second stage is limited by either a 50 %
displacement of the module‘s height or a force of 1000 times the module‘s mass; whichever
condition occurs first is held for 5 minutes. If multiple test articles are available crushing from
multiple axes is recommended.
Fig. 7-14: Crush test textured platen surface [95]
The drop test is a destructive free drop from a pre-determined height not to exceed 10 m
onto a centrally located, cylindrical steel object (e.g., a telephone pole) having a radius of
150 mm. The test may not be suitable for test devices whose enclosures are not independent
30 mm r = 75 mm

Deliverable D1.1
ELVA 97 SCP0-GA-2010-265898
structural components. Nevertheless, testing of enclosed subassemblies is possible and may
yield useful data. The height of the drop is determined by evaluating credible abuse
conditions during the manufacture, assembly, and normal use of the electric storage system.
The system shall impact lengthwise across the radius of the cylindrical object, but not on the
end of the cylindrical object (see Fig. 7-15). A horizontal impact with an equivalent velocity
change is accepted.
Fig. 7-15: Drop test impact [96]
The configuration of the mechanical shock is similar to the test included in the UN standard
and is applied on module level. Differences can be found in the maximum acceleration, the
duration and is divided in three load levels, see Fig. 7-16.
Fig. 7-16: Mechanical shock duration
The shocks are specified in terms of velocity change and maximum duration. The shock
duration is defined as the time between the first and last time the shock pulse crosses the
10 % peak level. The maximum duration will place lower limits on the peak acceleration,
r = 150 mm

Deliverable D1.1
ELVA 98 SCP0-GA-2010-265898
which must be proven during the test. The shock parameters are shown in Fig. 7-17.
Compared to the UN standard the required acceleration is lower.
Fig. 7-17: Shock parameters
7.4 Discussion: outlook for 2020+
Considering recent developments at Euro NCAP with their roadmap up to 2015 it can be
expected that for 2020 for important active safety systems formal assessment methods will
have become available. Consumer testing programs outside Europe and also legal
requirements are expected to follow this trend. The implication for ELVA is that for electric
vehicles 2020+ active safety systems including (intervening) ADAS systems will be an
important part of the requirements, but further progress in passive safety will also be
necessary. Both for active and passive safety systems the ELVA concepts should get the
highest ratings in 2020 Euro NCAP type of standards.
Active safety systems to take on board in the ELVA concepts to be considered include:
Autonomous braking for rear-end impacts based on pre-crash sensing. For other
accident situations the technology is probably not mature enough yet.
Automatic braking based on pre-crash sensing to avoid or to mitigate the severity
of impacts with vulnerable road users (pedestrians and bicyclist).
New ESC systems in case electric motors would drive wheels independently which
offers new and advanced possibilities for vehicle control in case a crash would be
expected.
Driver monitoring system: Driver distraction and inattention is a growing problem in
particular due to the increase of devices in the car that distract the driver. Various
methods are under development or already have been introduced to monitor the
fitness state of the driver and for a 2020+ EV such system should be part of the
requirements.
Area under the curve
is Δv
timeshock duration
10 % level
Minimum acceleration
fox x ms
Peak level (100 %)
Acceleration x ms

Deliverable D1.1
ELVA 99 SCP0-GA-2010-265898
Lane keeping system: Such systems can be effective in particular on two-lane
roads with opposing traffic.
For passive safety protection measures to take on board in 2020 for an ELVA EV
include:
A vehicle structure that retains survivable space for the occupant in various crash
modes. Particular if the vehicle is small and light this becomes a challenge. This
aspect relates directly to the compatibility with other vehicles in a crash.
Adaptive restraint systems (seatbelts, airbags, head restraints). Based on pre-
crash sensing information for the most important accident conditions the
occupant should be offered an optimal protection.
Vulnerable road user protection in case a crash cannot be avoided. Some
systems to reduce the severity of the crash are already on the market based on
pre-crash sensing. But further mitigation of the consequences of the crash is
needed using passive safety measures (pedestrian friendly front).
Fulfilling the highest requirements concerning battery safety (see 7.3.4).

Deliverable D1.1
ELVA 100 SCP0-GA-2010-265898
8 Discussion and Conclusions
The objective of WP 1.1, of which the results are described in this report, is to identify
societal and technological scenarios for 2020 and beyond and in this way to contribute to the
specifications of the vehicle concepts to be developed in ELVA. These vehicle concepts are,
according to the objectives of ELVA, intended for mass production and they should be
affordable for the majority of the consumers in 2020.
In this report first a review of European and global roadmaps, strategy papers etc. for future
road transport has been given in order to identify the main drivers and trends in our society
(chapter 2). The remaining chapters in this report deal with the state-of-the art and future
trends of the vehicle technology concerning lightweight vehicle design, EMC, energy storage,
drive train technology, brake systems and safety aspects of future electric vehicles. The
focus of this Discussions and Conclusions section is mainly on the potential impact of the
findings in this report on the ELVA concepts to be developed.
8.1 Main drivers and trends
The time frame for ELVA is shorter (2020+) than the time frame in many of the reports that
have been studied. Quite a few studies indicate that for this shorter period not too many
changes in our society will take place. In spite of this it is good to look ahead since cars
developed for 2020+ may still be around up to 2040; so some of the long term predictions
may already influence the ELVA designs that could enter the market in 2020+.
Most of the reports studied are predictions and extrapolations based on the today‘s society
and technology status. The reports are very consistent regarding the driving forces:
population and economical growth, demographical changes, urbanisation and the
development of mega cities. Between now (2011) and 2025, the world population will
increase by 20 % to reach 8 billion inhabitants (6.5 today) and 97 % of this growth will occur
in the developing countries (Asia, Africa).
Most reports indicate that the penetration of the electrical vehicles is an important part of the
solution, but it can be seen that the penetration of xEVs on the market will still be quite
modest by 2020. The world market of full EVs is estimated in 2020 to be about 5 %, except
for China where the predictions are 10 %, of new vehicles sold.
Three important (groups of) driving forces to achieve a sustainable future transportation
solution are:
Technology development
Political incentives, disincentives and legislations
Customer and individuals behaviour, values and attitudes
An important technology driving force is the development of reliable, safe, light and
affordable batteries as described in chapter 6.
Concerning future societal scenarios a number of interesting scenarios have been presented
(see 2.2). These scenarios are of interest as a reference platform for ELVAELVA. In
particular the four extreme scenarios defined in the SEVS project might be of interest when

Deliverable D1.1
ELVA 101 SCP0-GA-2010-265898
developing the specifications for the ELVAELVA concepts. The important driving forces
―politics‖ and ―personal values‖ mentioned above were identified in SEVS as drivers with the
largest uncertainty and with the largest impact on a future sustainable and safe transport
system and combinations of extreme values of these driving forces resulted in the four SEVS
scenarios.
8.2 Light weight design
Materials and design are key technologies in the automotive industry. Besides the
advancement in steel body design (short and medium-term), construction methods with fibre-
reinforced high performance plastics and multi material design will be able to play an
important role in a long term.
For electric vehicles, due to the weight and volume of the batteries and the substitution of
mechanical drive train the boundary conditions for lightweight architecture have completely
changed. The challenges in lightweight design for innovative vehicle concepts are amplified
and the importance of lightweight design increases, due to the significant influence of the
battery on the electric vehicle‘s range. Furthermore the integration of the battery system
enables new possibilities for lightweight design. Depending on the number of pieces
produced, as seen earlier, an approach consisting of integrating the battery system in a tube-
intensive floor panel, combined with a frame load-bearing structure with non-stressed panels
could be practicable.
The choice for light weight materials depends besides the mechanical properties on
expected production volume, markets (material availability), vehicle use, customers and
performance-cost-balance.
Keeping these factors in mind, material opportunities for the ELVA concepts can be
summarised in Table 8-1:
Table 8-1 Potential material selection in ELVA
Body Chassis Interior
advanced steel (load-
carrying structure)
advanced aluminium
(structure, panels)
fibre reinforced plastics
(structure, panels)
advanced plastic (e.g.
battery housing, glazing)
hybrid-structures (allowing
functional integration)
aluminium-steel
aluminium-FRP
steel-FRP
multi-material design
advanced steel (levers,
arms)
advanced aluminium
(levers, arms)
fibre reinforced plastics
(springs)
hybrid-structures (allowing
functional integration)
aluminium-FRP
steel-FRP
plastics
bio-plastics/bio-fibres
aluminium, FRP (e.g.
seat structures)
hybrid-structures
(allowing functional
integration)
aluminium-FRP
steel-FRP

Deliverable D1.1
ELVA 102 SCP0-GA-2010-265898
It should be mentioned finally that the joining technology of the various parts will remain a big
challenge and this demands significant research efforts, in particular, in the field of joining
different materials.
8.3 EMC
Electromagnetic Compatibility (EMC) and exposure to electromagnetic fields (EMF) are two
technology areas that will have increasing importance in the automotive industry. EMC will
be affected by several trends: increased number of electronic units, high voltage switching
and non-metallic materials in the structure of the vehicle. EMC is a property in a vehicle that
normally is un-noticed. The driver only recognizes it when there is a problem. However, if
there is a problem, it may be costly and time consuming to fix it. It is therefore of high
importance to keep EMC in mind from the beginning in a development project. In the ELVA
project we have the opportunity to assess the EMC properties even at the architecture stage.
Methods for virtual assessment can give good information about the general EMC and EMF
quality of subsystems and vehicles, and especially at early stages before the systems have
been built and to assess limited changes in existing designs, but the final verdict must still
come from measurement
There is still no consensus on the risks with long time exposure of electromagnetic fields. But
even if the risk is low, there is still a public concern that needs to be addressed, so reducing
the field levels for the occupants in the vehicles will always be important.
8.4 Electric storage and drive train technology
Future EVs will be different from today‘s cars in several ways, which requests an overall
optimization of efficiency and reliability of the drive train regarding to:
Battery technology must be affordable, lightweight and reliable
Charging has to be standardized and easy to handle
The selected power train arrangement has to be optimized and matched with the brake
An intelligent thermal management keeps the efficiency of the EV on a high level
These topics are responsible for a successful introduction of EV‘s in near future and they
open up new opportunities and degrees of design freedom, which enable and require new
vehicle concepts.
In a holistic approach the intelligent interaction between the domains power train, brake and
navigation is absolutely necessary. ELVA must respect such an approach and presume the
availability of the technologies and their interaction.
With current vehicle body (not isolated) it is not sufficient to develop a heating system only
based on a thermal management. Thermal comfort and efficiency can only be provided by an
effective solution with a good thermal protection of vehicle, motor, components and
passenger compartment.

Deliverable D1.1
ELVA 103 SCP0-GA-2010-265898
ELVA must first define the basics of the vehicle body and the weight issues, before a
selection of the power train arrangement can be performed.
8.5 Brake technology
ELVA should go beyond the state-of-the-art by applying electro-hydraulic or electro-
mechanical brakes to the electric vehicle, preferably controlled by by-wire means.
The brake system must be able to recuperate energy. By pure friction braking, normally a
high amount of energy is dissipated into heat and cannot be used within the vehicle
anymore. By an intelligent solution part of this energy can be recycled, using the electric
motor(s) as generator(s). By these means, a longitudinal motion control for optimized energy
consumption in an electric vehicle is feasible.
The brake force generation has to provide a management between friction and electrical
regenerative braking, depending on the individual situation (like soft stop, emergency
braking). Also a smooth transfer between friction and regenerative braking is to be
guaranteed. This is achieved by optimal blending of electrical and mechanical brake torques.
A big challenge is the perfect handling of the basic brake function by recuperating energy out
of the movement (deceleration) of the fully electric vehicle and to use the friction brake only
for ―hard stops‖ or emergency situations. The switch from one (recuperation) to the other
(friction) mode must be taken by the system itself, within shortest time and without error, e.g.
without any negative impact on safety (stopping distance, vehicle stability) and driver‘s
perception or influence (no heavy pedal implications).
As an alternative to the central motor concept, a new cooperative motion control
management of individual electric motors is achievable: this may be the case during anti-lock
conditions, due to the possibility of wheel-selective distribution of torques by controlling
individual electric hub motors (in-wheel motors).
Also torque vectoring including vehicle stability control can thus be influenced in a positive
kind and manner.
Additionally, by the electrification of the brake system including the active control of electrical
drive motors, solutions summarized by ―brake-by-wire‖ systems may open further options
towards active safety in terms of advanced driver assistant system, e.g. adaptive cruise
control, stop & go/traffic jam assist, parking aid.
8.6 Vehicle safety
Considering recent developments in Euro NCAP it can be expected that for 2020 for a
number of important active safety systems formal assessment methods will become
available. Consumer testing programs outside Europe and also legal requirements are
expected to follow this trend. The implication for ELVA is that for EV vehicles 2020+ active
safety systems including (intervening) ADAS systems will be an important part of the
requirements but further progress in passive safety will also be necessary. Both for active
and passive safety systems the ELVA concepts should get the highest ratings in 2020
Euro NCAP type of standards.

Deliverable D1.1
ELVA 104 SCP0-GA-2010-265898
Active safety systems to take on board in the ELVA concepts to be considered include:
Autonomous braking for rear-end impacts based on pre-crash sensing. For other
accident situations the technology is probably not mature enough yet.
Automatic braking based on pre-crash sensing to avoid or to mitigate the severity
of impacts with vulnerable road users (pedestrians and bicyclist).
New ESC systems in case electric motors would drive wheels independently which
offers new and advanced possibilities for vehicle control in case a crash would be
expected.
Driver monitoring system. Driver distraction and inattention is a growing problem in
particular due to the increase of devices in the car that distract the driver. Various
methods are under development or already have been introduced to monitor the
fitness state of the driver and for a 2020+ EV such system should be part of the
requirements.
Lane keeping system. Such systems can be effective in particular on 2-lane
roads with opposing traffic.
Passive safety protection requirements in an ELVA EV include:
A vehicle structure that retains survivable space for the occupant in various crash
modes. Particular if the vehicle is small and light this becomes a challenge. This
aspect relates directly to the compatibility with other vehicles in a crash.
Adaptive restraint systems (seatbelts, airbags, head restraints). Based on pre-
crash sensing information for the most important accident conditions the
occupant should be offered an optimal protection.
Vulnerable road user protection in case a crash cannot be avoided. Some
systems to reduce the severity of the crash are already on the market based on
pre-crash sensing. But further mitigation of the consequences of the crash is
needed using passive safety measures (pedestrian friendly front).
Fulfilling the highest requirements concerning battery safety.
Deliverable D1.1
ELVA 105 SCP0-GA-2010-265898
9 Glossary
CFRP Carbon Fibre Reinforced Plastics
EV Electric Vehicle
xEV All type of Electric Vehicles
PEV Plug in Electric Vehicle
BEV Battery Electric Vehicle
FRP Fibre Reinforced Plastics
GFRP Glass Fibre Reinforced Plastics
HVAC Heating, Ventilating, Air Conditioning
NEDC New European Driving Cycle
PCM Phase Change Materials
SLC Super Light Car
ASF Aluminium Space Frame
AUHSS Advanced Ultra High Strength Steel
BIW Body-in-White
DLR Deutsches Zentrum für Luft- und Raumfahrt e.V.
FRP Fiber-reinforced Plastic
ICE Internal Combustible Engine
MCV Mega City Vehicle
ULSAB Ultra Light Steel Auto Body
ULSAB-AVC Ultra Light Steel Auto Body Advanced Vehicle Concepts
EMC Electromagnetic Compatibility
EMF Exposure to electromagnetic fields
RS Restrain System
SNL Sandia National Laboratories

Deliverable D1.1
ELVA 106 SCP0-GA-2010-265898
WHO World Health Organisation
PCS Pre Crash Sensing System
VRU Vulnerable Road User
DAS Driver Assistant System
ADAS Advanced Driver Assistance System
ESC Electronic Stability Control
EA Energy Absorption
IEA International Energy Agency
GHG Green House Gasses
CEP Courier, Express and Parcels
TEN-T Trans European Transport Network
ERTRAC European Road Transport Research Advisory Council
DB Deutsche Bank
RPM Revolutions per Minute
DC Direct Current
CISPR International Special Committee on Radio Interference
ICNIRP International Commission on Non-Ionizing Radiation Protection
BMS Battery Management System
BMC Battery Management Controller
CSC Cell Supervising Circuit
CSM Current Sensor Module
Deliverable D1.1
ELVA 107 SCP0-GA-2010-265898
10 Literature
[1] ERTRAC: Road Transport Scenario 2030+ ―Road to Implementation‖, Oct 2009,
(www.ertrac.org)
[2] ERTRAC: European Industry Roadmap, Electrification of Road Transport,
Version 3.3, 19 Oct 2009
[3] EUROPEAN COMMISSION: The world in 2025, Rising Asia and socio-ecological
transition, 2009,
[4] ECF: Roadmap 2050, A practical Guide to a prosperous, low-carbon Europe,
(www.roadmap2050.eu)
[5] WBCSD: Mobility 2030: Meeting the challenges to sustainability, July 2004,
(www.wbcsd.org)
[6] SEVS: Safe Efficient Vehicle Solutions, 2010, (www.sevs.se)
SAFER and SHC, Chalmers
[7] SHELL: Energy Scenarios 2050 & Signal & Signposts, 2011
(www.shell.com/scenarios)
[8] IBM Global Business Services: Automotive 2020, Clarity beyond the chaos,
August 2008
[9] IBM Global Business Services: Truck 2020 Transcending turbulence, Oct 2009
[10] McKinsey Quarterly: The fast lane to the adoption of electric cars, Feb 2011
[11] KPMG: KPMG‘s Global Automotive Executive Survey 2011,
(www.kpmg.com/automotive)
[12] School of Public and Environmental Affairs, Indiana University: Plug-in EV, A
Practical Plan for Progress, February 2011
[13] Frost & Sullivan, Edward Gibbs: The global market for hybrid electric vehicles
(HEVs): prospects to 2020!
[14] Deutsche Bank: Electric Cars, Plugged In 2, A mega-theme gains momentum,
Nov 2009
[15] Accenture: Changing the game, Plug-in electric vehicle pilots, 2011,
(www.accenture.com)
[16] European Commission; A sustainable future for transport, 2009

Deliverable D1.1
ELVA 108 SCP0-GA-2010-265898
[17] McKinsey & Company; Executive Summary- Towards a new global order for
automotive suppliers
[18] PWC; Transportation & Logistics 2030, Volume 1: How will supply chains evolve
in an energy-constrained, low-carbon world? 2009 (www.tl2030.com)
[19] McKinsey; Building the supply chain of the future, Jan 2011
[20] BP: BP Energy Outlook 2030, 2011 (www.bp.com)
[21] Exxon Mobile: The Outlook for Energy: A View to 2030, 2010
(www.exxonmobil.com)
[22] Shell: Shell energy scenarios to 2050, 2008 (www.shell.com/scenarios)
[23] Greenpeace: Battle of the Grids, 2011 (www.greenpeace.org)
[24] McKinsey: Gas in 2020, A Perspective, April 2008
[25] International Energy Agency (IEA); World Energy Outlook 2010 (www.iea.org)
[26] PWC: Transportation & Logistics 2030, Volume 2: Transport infrastructure -
Engine or hand brake for global supply chains? Volume 3: Emerging Markets
2020, 2010 (www.tl2030.com)
[27] European Commission: Towards a European road safety area: policy orientations
on road safety 2011-2020, July 2010
[28] European Commission: ICT for the Fully Electric Vehicle Research Needs and
Challenges Ahead, Dec 2010
[29] World Economic Forum; Global Risks 2011, Sixth Edition, 2011
(www.weforum.org)
[30] McKinsey Environmental and Energy Sustainability – Sustainability an approach
for India (www.mckinseyquartely.com)
[31] Nasscom: Perspective 2020 Transform Business, Transform India, April 2009
[32] McKinsey Quarterly: Applying global trends: A look at China‘s auto industry, July
2010 (www.mckinseyquarterly.com)
[33] McKinsey Quarterly; How green are China‘s cities?, Jan 2011
(www.mckinseyquarterly.com)
[34] E3G: Chinese Challenge or Low Carbon Opportunity? The implications of China‘s
Five-Year-Plan for Europe, March 2011 (www.e3g.org)

Deliverable D1.1
ELVA 109 SCP0-GA-2010-265898
[35] A portfolio of power-trains for Europe: a fact-based analysis, The role of Battery
Electric Vehicles, Plug-in Hybrids and Fuel Cell Electric Vehicles
(www.zeroemissionvehicles.eu)
[36] ERTRAC: Strategic Research Agenda 2010 (www.ertrac.org)
[37] CANTOR, B.; GRANT, P.; JOHNSTON, C., Automotive Engineering, Lightweight,
Functional, and Novel Materials, Taylor & Francis, New York - London, 2008
[38] FRIEDRICH H., Leichtbau und Werkstoffinnovationen im Fahrzeugbau, ATZ
Magazine, 2002
[39] KRUSCHE, T.; WALTER, H.; DUDZIAK: Untersuchung und Erprobung einer
Stahl-Spaceframe-Struktur aus Innenhochdruck umgeformten und rollprofilierten
Bauteile, Studiengesellschaft Stahlanwendung. Forschungsbericht P367.
Düsseldorf: Verlag und Vertriebsgesellschaft, 2000
[40] SIMON, P.: Entwicklung einer Leichtmetall-Space-Frame-Struktur für Fahrzeuge
mit alternativen Antriebskonzepten, Lightweight Design, Issue 05, Vieweg &
Teubner Verlag, Wiesbaden, 2009
[41] BRAESS, H-H.; SEIFFERT, U., Handbook of Automotive Engineering
[42] GOEDE, M.; SCHROETER, O.: Fortschritte im Fahrzeugleichtbau zur
Verbesserung der Energieeffizienz, 12. Dresdner Leichtbausymposium,
Innovationsquelle Leichtbau – Vorreiter bei der Energieeinsparung, Dresden,
2008
[43] BERGWALL, M., The new Volvo S60 Car Body, Aachener Karosserietage 2010,
Aachen/Germany, 2010
[44] GORONCY, J.; HAMMER, H.: Leichtbau-Lektionen, Automobil Industrie 6/2010,
Vogel Business Media, Würzburg/Germany, 2010
[45] HOPF, B., FÜLLER, K.-H., Lightweight Body – Concepts, Materials,
Manufacturing, Aachener Karosserietage 2010, Aachen/Germany, 2010
[46] SCHINDLER, V.; SIEVERS, I.: Forschung für das Auto von Morgen
Aus Tradition entsteht Zukunft, Springer Verlag, Berlin Heidelberg New York,
2008
[47] ANSELM, D.: Die Pkw-Karosserie, Vogel Verlag, Würzburg, 1997
[48] PAEFGEN, F.J.; LEITERMANN, W.: „Audi Space Frame – ASF®, ein neues
PKW-Rohbaukonzept in Aluminium.―, VDI-Berichte No. 1134, Entwicklungen im
Karosseriebau, 1994.

Deliverable D1.1
ELVA 110 SCP0-GA-2010-265898
[49] TIMM, H.: Konzept- und Technologietrends zum kostenattraktiven Karosseriebau
Die neue A8-Karosserie, Tag der Karosserie, Aachen, 2003
[50] BECHTHOLD, M.: FVK-Rohbau für Hochleistungssportwagen – Mercedes Benz
SLR McLaren, Vision Plastic Car Body 2010, Bad Nauheim, 2004
[51] WALLENTOWITZ, H.; FREIALDENHOVEN, A.; OLSCHEWSKI, I.: Strategie in
der Automobilindustrie, Vieweg & Teubner, Wiesbaden, 2009
[52] N.N. SuperLightCar, 2009
[53] TIMM, H., The new Audi TT body, EuroCarBody 2006, Bad Nauheim/Germany,
2006
[54] HÖFEMANN, M.; REICHERT, B.; SCHULZ, R.; PETERS, B.-M., Spaceframes
aus Stahl – der Trend im Karosseriebau, Blech Inform, Issue 04/2003, Carl
Hanser Verlag, München, 2003
[55] DRESSLER, B.: Leichtbau und LifeDrive Concept des BMW Mega City Vehicle
Würzburger Automobil Gipfel, Würzburg, 2010
[56] GRUNDOLF, K.; FRIEDRICH, H.; BEEH, E.: Leichtbaustrategie für innovative
Fahrzeugkonzepte der Zukunft „CO2 – Die Herausforderung für unsere Zukunft―
ATZ/MTZ-Konferenz - Energie, München, 2008
[57] CRF FIAT, Split-Frame architecture, 11th International conference; Architectures
for eco-vehicles, Florence ATA, 2009
[58] PAUSE, B. H.: Thermal control of automotive interiors with phase change
material
U.S. Patent No. 7320357 B2, 2008
[59] EKSTEDT, M.; WYSOCKI, M.; ASP, L.E., Structural batteries made from fibre
reinforced composites, Plastics, Rubber and Composites, Issue 39, pp. 148-150,
2010
[60] BRENDECKE, T.; GÖTZ, O.; GROSS, M., Leichtbau von
Fahrwerkskomponenten, ATZ Magazine, Issue 10/2008, Vieweg Verlag,
Wiesbaden/Germany, 2008
[61] WÖHRMANN, M.; WALLMICHRATH, M.; FREHN, A., Methodischer Ansatz im
Stahlleichtbau am Beispiel Federbein/Dämpfer, FAT-Schriftenreihe,
Frankfurt/Germany, 2006
[62] MENGE, M; Rath, D.; ZEUNER, T., Neue Fahrwerksteile aus Aluminiumguss,
ATZ Magazine, Issue 3/2005, Vieweg Verlag, Wiesbaden/Germany, 2005

Deliverable D1.1
ELVA 111 SCP0-GA-2010-265898
[63] N.N., Die Lasten optimal verteilt, Die Aluminium Vorderachse im BMW 3er
Touring
(www.bmw.com/com/de/newvehicles/3series/touring/2005/allfacts/engine_frontax
le.html)
[64] FRANKE, O.; SCHÜRMANN, H., Der Sprung in die Großserie für ein
hochbeanspruchtes FVK-Bauteil, Eine GFK-Blattfeder für eine neue Transporter-
Generation, 10. Internationale AVK-Tagung, Stuttgart/Germany, 2007
[65] N.N., Innenraum auf Abspeckkurs, Verlag Moderne Industrie GmbH,
Landsberg/Germany, 2010
[66] BEER, T.; HINZ, M., Schnittstellenübergreifende Entwicklung – Schlüssel zur
neuen Cockpitstruktur, ATZ Magazine, Issue 02/2008, Vieweg Verlag,
Wiesbaden/Germany, 2008
[67] GRESCH, P., Jedes Gramm zählt, Automobil Industrie INSIGHT, Issue 03/2010,
Vogel Business Media, Würzburg/Germany, 2010
[68] PADRAIG, N.; RUDERT, K., Verbesserte Autositze durch blasgeformte
Kunststoffstrukturen, ATZ Magazine, Issue 12/2006, Vieweg Verlag,
Wiesbaden/Germany, 2006
[69] SCHEDEL, R.: Naturfaser-Werkstoffe für Interieur und Exterieur, ATZ Magazine,
Issue 06/2007, Vieweg Verlag, Wiesbaden/Germany, 2007
[70] Council Directive 72/245/EEC relating to the radio interference (electromagnetic
compatibility) of vehicles, 72/245/EEC
[71] Uniform provisions concerning the approval of vehicles with regard to
electromagnetic compatibility, UN ECE Regulation 10, Revision 3.
[72] On the minimum health and safety requirements regarding the exposure of
workers to the risks arising from physical agents (electromagnetic fields),
2004/40/EC
[73] COUNCIL RECOMMENDATION of 12 July 1999 on the limitation of exposure of
the general public to electromagnetic fields (0 Hz to 300 GHz), 1999/519/EC
[74] Guidelines for limiting exposure to time-varying electric, magnetic and
electromagnetic fields (up to 300 GHz), ICNIRP 1998
[75] Guidelines for limiting exposure to time-varying electric, magnetic and
electromagnetic fields (1 Hz to 100 kHz), ICNIRP 2010
[76] Measurement methods for electromagnetic fields of household appliances and
similar apparatus with regard to human exposure, EN 62233:2008

Deliverable D1.1
ELVA 112 SCP0-GA-2010-265898
[78] Measurement procedures of magnetic field levels generated by electronic and
electrical apparatus in the railway environment with respect to human exposure,
EN 50500:2008
[79] Guidance on determining compliance of exposure to pulsed and complex non-
sinusoid waveforms below 100 kHz with ICNIRP guidelines, ICNIRP 2009
[80] Prof. Dr.-Ing. Holger Hanselka, Fraunhofer Institute, 2010
[81] IHK Stuttgart, Study "Otto-, Diesel- Elektromotor – wer macht das Rennen", 2010
[82] Deutsche Bank, Global Markets Research, "Electric Cars: Plugged In 2", 2009
[83] B. Breuer, K. Bill, Bremsenhandbuch, Vieweg Verlag, Wiesbaden 2006
[84] J. Pickenhahn, L. Gilles, T. Hönig, P. Thomas, Concepts for Regenerative
Braking in Vehicles with Hybrid Propulsion Drive, XXVI, International µ
Symposium, Bad Neuenahr, 16./17.06.2006
[85] H. Wallentowitz, K. Reif, Handbuch Kraftfahrzeugelektronik, Vieweg Verlag,
Wiesbaden 2006
[86] ECE R 13H, § 2.2 + 2.2.1
[87] R. Schöneburg, K.-H. Baumann, Auf dem Weg zur virtuellen Knautschzone, 11.
Braunschweiger AAET Symposium, 10./11.2.2010
[88] H. Winner, S. Hakuli, G. Wolf, Handbuch Fahrerassistenzsysteme, Vieweg und
Teubner Verlag, Wiesbaden 2009
[89] McKinsey, Quarterly 2009, Number 3
[90] Global status report on road safety: time for action. Geneva, World Health
Organization, 2009
(www.who.int/violence_injury_prevention/road_safety_status/2009).
[91] Euro NCAP, Moving forward, Strategic roadmap 2010-2015, Dec. 2009
(www.euroncap.com)
[92] ECKSTEIN, L., Structural Design of Vehicles, Schriftenreihe Automobiltechnik,
Aachen, 2010
[93] HERMANN, K. u.a., Entwicklung einer Simulationsmethode zur Bewertung der
Fahrzeugkompatibilität, Vortrag, SIMVEC 2008, Baden-Baden, 26./27. November
2008

Deliverable D1.1
ELVA 113 SCP0-GA-2010-265898
[94] Euro NCAP, The official site of the European New Car Assessment Programme,
2010 (www.euroncap.com)
[95] UN Transport of Dangerous Goods, Part III, United Nations Economic
Commission for Europe, 2010
(www.unece.org/trans/danger/publi/manual/Rev4/English/04E_part3.pdf)
[96] DOUGHTY, D.H; CRAFTS, C.C., Electric Energy Storage System – Abuse Test
Manual for Electric and Hybrid Electric Vehicle Application, Sandia National
Laboratories, Albuquerque, 2006
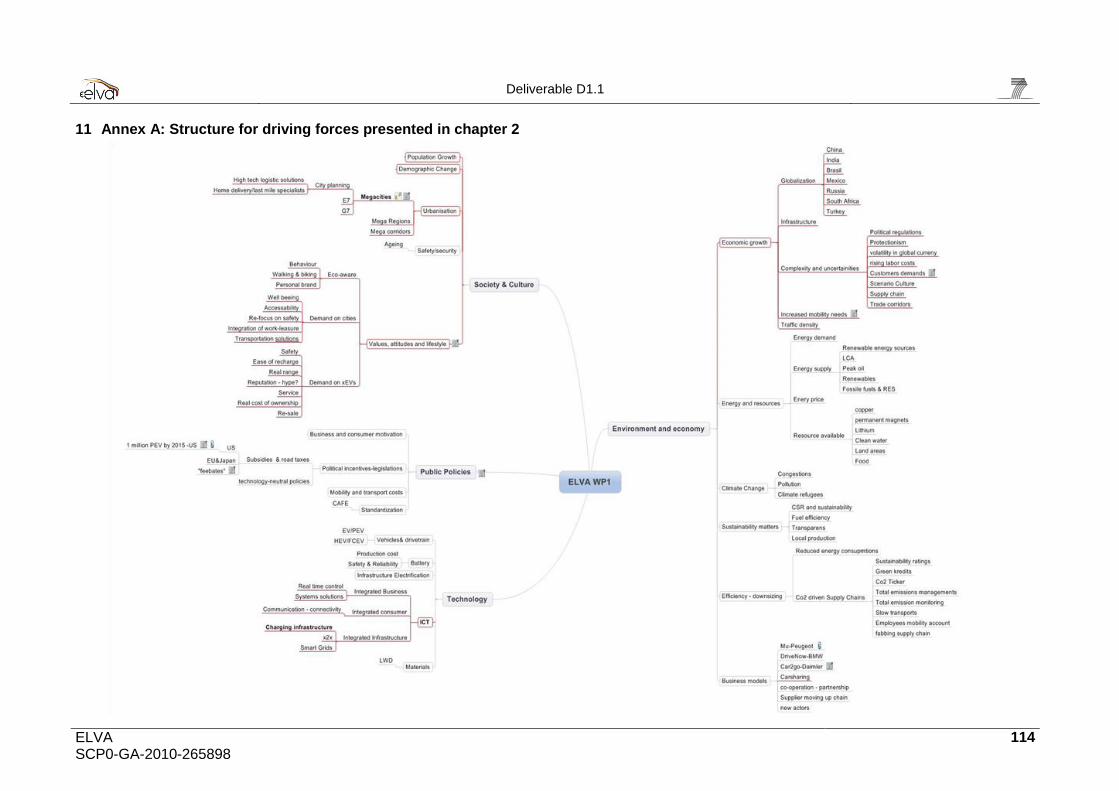
Deliverable D1.1
ELVA 114 SCP0-GA-2010-265898
11 Annex A: Structure for driving forces presented in chapter 2