Embed Size (px)
Citation preview

Electronic copy available at: http://ssrn.com/abstract=2142343Electronic copy available at: http://ssrn.com/abstract=2142343
1
Socially Responsible Funds and Market Crises
John Nofsinger
Washington State University
Abhishek Varma*
Illinois State University
September 5, 2012
ABSTRACT
Compared to conventional mutual funds, socially responsible mutual funds outperform during
periods of market crisis. This dampening of downside risk comes at the cost of underperforming
during non-crisis periods. Investors with Prospect Theory utility functions would value the
skewness of these returns. This asymmetric return pattern is driven by the mutual funds that
focus on environmental, social, or governance (ESG) attributes and is especially pronounced in
ESG funds that use positive screening techniques. Furthermore, the observed patterns are
attributed to the socially responsible attributes and not the differences in fund management or the
characteristics of the companies in fund portfolios.
JEL Classification: G01, G20, M14
KEYWORDS: SRI, ESG, socially responsible, prospect theory
Nofsinger: Department of Finance and Management Science, College of Business, Washington
State University, Pullman, WA, 99164-4746; (509) 335-7200, [email protected].
*Varma(Corresponding Author): Department of Finance, Insurance and Law, College of
Business, Illinois State University, Campus Box 5480, Normal, IL 61790-5480; (309) 438-5658,

Electronic copy available at: http://ssrn.com/abstract=2142343Electronic copy available at: http://ssrn.com/abstract=2142343
2
Socially Responsible Funds and Market Crises
1. Introduction
Sustainability requires that organizations strive for financial success while accepting
responsibility for their impact on and relationships with a diverse group of stakeholders (AON,
2007). One of the key drivers behind sustainability practices is the increasing investor demand
for socially responsible investing (SRI) strategies, which includes ethical investing and green
investing. SRI funds historically began by excluding firms producing socially undesirable
products (sin stocks) like alcohol, tobacco, weapons, gambling, etc. As this niche of the
investment industry developed, money managers began incorporating environment, social, and
governance (ESG) factors into their investment analysis, decision-making, and portfolio
construction. There is much literature on whether investors pay a price for investing in socially
responsible investments funds or obtain superior returns. Proponents of socially responsible
investing argue it might potentially limit downside risk. However, Renneboog, Horst, and Zhang
(2008a) and others report that investors largely do pay a cost for ethics.
And yet, the SRI industry has grown substantially over time. The USSIF (2010) report
finds that professionally managed assets following SRI strategies grew by 380 percent since
1995 to $3.07 trillion in 2010. In comparison, the broad universe of professionally managed
assets grew by 260 percent to $25.2 trillion in 2010. Even during the financial crisis (2007-2009)
the broad universe of professionally managed assets remained roughly flat while assets using
SRI strategies enjoyed healthy growth of more than 13 percent. To explain the increasing
popularity of SRI when it mostly generates negative abnormal returns, Statman (2004) and
Bollen (2007) argue that investors must gain some utility from the externalities of investing in a
manner consistent with their beliefs.

3
We propose another explanation. Although SRI investing may generate negative
abnormal returns over time, they hold up better during market crisis periods. That is, the nature
of SRI and ESG dampens the downside risk. Companies that consistently exhibit social and
environmental responsibility may find themselves suffering from fewer legal prosecutions, fines,
and more stable relations with communities and government, including regulators (McGuire, et
al., 1988). Also, firms with better corporate governance may be suited to deal with adverse
systemic economic shocks. Verwijmeren and Derwall (2010) find that firms with high measures
of employee satisfaction measures exhibit lower bankruptcy risk. In a more direct test,
Oikonomou, et al. (2012) conclude that socially responsible behavior is weakly negatively
related to systematic risk while irresponsible behavior is strongly positively related to systematic
risk.
Would investors be willing to give up some return in non-crisis market periods to gain
some higher returns during crisis periods? Under Kahneman and Tversky’s (1979) Prospect
Theory, investors are more negatively impacted by losses than they are positively impacted by a
gain of similar magnitude. Thus, they are likely to choose a portfolio with skewed or asymmetric
performance because the gain in utility for doing better in falling markets is larger than the loss
in utility for underperforming in rising markets.
Using a unique dataset of US domestic equity SRI funds for the period 2000-2011, we
investigate the performance of SRI funds during crisis and non-crisis periods to empirically test
the hypothesis that SRI funds dampen downside risk for investors during poor economic
conditions.
The next section describes the literature and develops our hypotheses. Section 3 details
our data and defines our methods. The SRI return alphas are computed for non-crisis and crisis

4
periods in Section 4 and compared to conventional mutual funds. In Section 5, we break out the
different SRI foci, like avoiding unwanted products, environmental activities, social issues and
governance standards. We also investigate the role of using positive versus negative screen
techniques. One could argue that SRI and conventional funds are managed differently. Or, there
may be differences in the characteristics of the companies picked for the portfolios beyond the
socially responsible attributes. We explore this possibility in Section 6. The last section
summarizes our findings.
2. Literature Review and Hypothesis Development
2.1 Literature Review
Early research suggests that SRI funds either exhibit no performance difference from
conventional funds (Hamilton, Jo, and Statman, 1993; Goldreyer, Ahmed, and Diltz, 1999;
Statman, 2000; Shank, Manullang, and Hill, 2005) or underperform (Girard, Rahman, and Stone,
2007). More recently, Adler and Kritzman (2008) contend that some cost must be associated
with SRI because they exclude some attractive firms from their portfolios. Using Monte Carlo
simulation, they estimate the cost of SRI to be giving up somewhere between 0.17 percent and
2.4 percent return per year due to the self-imposed restrictions. Using an international set of SRI
mutual funds, Renneboog, Horst, and Zhang (2008a) find that investors largely pay a price for
ethics. Specifically, SRI funds in the United States, the United Kingdom, and in many
continental European and Asia-Pacific countries underperform their domestic benchmarks by
−2.2 to −6.5 percent. However, the risk-adjusted returns of SRI funds are generally not
statistically different from the performance of conventional funds.
Another method of examining this issue is to study the SRI firms themselves, rather than
SRI mutual fund portfolios or indexes. Different aspects of social responsibility have been

5
examined. For example, Derwall, Guenster, Bauer, and Koedijk (2005) provide evidence of
positive abnormal returns for environmentally clean firms. Other studies find positive, though
not statistically significantly, abnormal returns (Kempf and Osthoff, 2007; Statman and
Glushkov, 2009) using different measures of environmental performance. Positive abnormal
returns have been identified for some types of SRI, specifically for firms with high employee
satisfaction (Edmans, 2011; Statman and Glushkov, 2009; Derwall, Koedijk, and Horst, 2011)
and good corporate governance (Bebchuk, Cohen, and Ferrell, 2009). On the other hand, positive
abnormal returns have been found in some firms that are avoided by SRI investors. Hong and
Kacperczyk (2009) empirically analyze sin stocks and find that they earn positive annual
abnormal returns of about 3 percent (see also Kim and Venkatachalam, 2011).
How can many of the firms SRI investors buy outperform and yet SRI mutual funds do
not? Guenster (2012) describes how SRI portfolios include some positive alpha firms, they also
exclude some positive alpha firms like sin stocks, thus ending with normal performance.
However, Guenster also notes that positive alphas in SRI favored firms have been disappearing
recently. Bebchuk, Cohen, and Wang (2011) documents a learning effect for corporate
governance and show that abnormal returns in those firms have diminished over time and
recently ceased to exist. Similar declines of abnormal returns have been reported in recent years
for the social dimension of SRI favored firms (Derwall et al., 2011).
Our data shows that the total net assets in U.S. domestic SRI equity mutual funds grew
305 percent from 2000 to 2011 while the asset growth rate of U.S. domestic non-SRI equity
funds grew 65 percent during the same period. The growth in assets being managed in SRI
mutual fund may seem puzzling considering their marginal relative performance. Bollen (2007)
resolves this puzzle by suggesting that investors have a multi-attribute utility function that

6
doesn’t just include risk-reward optimization, but also incorporates personal and social values.
Renneboog, Horst, and Zhang (2008b) argue that this social value aspect of the utility function
reduces the value of financial characteristics to SRI investors. Consistent with this conjecture,
Renneboog, Horst, and Zhang (2011) and Benson and Humphrey (2008) find that SRI investors
may be more loyal to SRI mutual funds than are conventional investors. They use monthly to
annual lead-lag relationships between return and money flow into SRI and conventional funds.
They report that SRI flows are significantly less sensitive to past negative returns than are flows
to conventional funds. However, Renneboog, Horst, and Zhang (2011) find that not all SRI fund
categories are treated alike. Specifically, SRI funds that use either negative screens or screens
based on specific sin/ethical issues have a weaker flow sensitivity to negative returns, whereas,
social screens induce a weaker flow-return relation if past returns are positive. On the other hand,
flows of SRI funds with environmental screens are more sensitive to past returns.
2.2 Hypothesis Development
In addition, SRI portfolios may exhibit unsystematic risk. If investors constrain their
opportunity set of available firms to own through various negative or positive screens, they
should incur diversification costs (Guenster, 2012). That is, SRI mutual funds run the risk of
being under diversified and thus underperforming in the traditional mean-variance optimization
framework. In fact, while the debate over whether SRI earns positive, negative, or zero returns is
useful from an asset pricing perspective, it may highlight how investors actually value the return
distribution and risk. Kahneman and Tversky’s (1979) Prospect Theory shows that investors do
not value gains and losses with the same magnitude. People are more negatively impacted by
losses than they are positively impacted by a gain of similar magnitude. This is because the slope
7
of the utility function in the loss domain is steeper than the slope of the utility function in the
gain domain. Indeed, people may be better described as loss averse rather than risk averse.
Consider two portfolios called (1) efficient portfolio and (2) skewed portfolio. The
efficient portfolio is mean-variance optimized. The skewed portfolio underperforms the efficient
portfolio during a rising stock market and out performs it during a falling stock market. Overall,
the efficient portfolio marginally outperforms the skewed portfolio. Under prospect theory,
investors are likely to choose the skewed portfolio over the efficient portfolio because the gain in
utility for doing better in falling markets is larger than the loss in utility for underperforming in
rising markets.
SRI mutual funds intentionally constrain themselves through investing in a subset of the
available stocks through negative and/or positive screens. Thus, they are not likely to be efficient
portfolios. Could SRI funds be similar to the skewed portfolio? Proponents of SRI claim that
their style of investing reduces the downside risk. Positive screens choose firms with good
environmental records, good corporate governance, and good employee relations. These firms
are less likely to experience negative outcomes in these social areas. Also, negative screens avoid
stocks that may be more likely to have high impact negative news regarding social issues. Thus,
SRI portfolios may hold up better during bear markets even at the expense of underperforming
during bull markets. This skewed performance (relative to the efficient portfolio), combined with
prospect theory preferences would explain this SRI popularity.
3. Data and Methods
3.1 SRI Mutual Funds
During the period of 2000 to 2011, we identify 240 US domestic equity mutual funds in
the SRI category. The fund level survivor-bias-free US mutual data (mutual fund and ETF) has

8
been obtained from Centre for Research in Security Prices (CRSP). We look at a sample of only
equity funds as the data available to us allows us to link their equity holdings to other databases
such as CRSP and Compustat, which provide stock level financial and trading information. From
here on we will refer to US domestic equity SRI funds as SRI funds, even though SRI funds
could broadly include other asset classes such as global equity or fixed income. Our list of SRI
funds has been put together through an extensive search of various databases as SRI funds are
not explicitly identified in the CRSP database. We first looked through the Morningstar database
in January 2012 to identify active US funds with SRI objectives. However, this list would have
survivorship bias as it would exclude funds that got liquidated or merged earlier. Using the
sample of SRI funds studied in Statman (2000), we identified some more SRI funds that were in
existence during the beginning of our sample period in January 2000, but were subsequently
liquidated or merged. We also looked through publicly available lists of SRI funds on the
Socialfunds.com and USSIF.org websites to find other missing SRI funds.1 In addition, we
searched the name history of the CRSP US Mutual fund database for certain keywords that
commonly appear in SRI fund names and located a few more SRI funds.2 Table 1 summarizes
the 240 SRI funds we located. They are mostly open end mutual funds, but include 12 exchanged
traded funds (ETFs). They compromise 135 retail funds. At the end of the 2011, the surviving
184 funds managed a total of nearly $29 billion. Most of the funds (190) and the assets ($25
billion in 2011) are actively managed.
<Insert Table 1 about here>
1 The list of SRI Funds on the Social Funds website is publicly available at www.socialfunds.com. The list of SRI
Funds on the US Social Investment forum (USSIF, formerly the Social Investment Forum) is publicly available at:
http://ussif.org/. 2 We searched for the following words that seem to occur frequently in the name of SRI funds: Social, socially,
environment, green, sustainability, sustainable, ethics, ethical, faith, religion, Christian, Islam, Baptist and Lutheran.
Thereafter, we looked through the prospectus of the funds and fund websites (if available) to ensure that they were
indeed SRI funds.

9
SRI includes different strategies (positive versus negative screening) and different foci,
namely screens based on firm products, environmental impact, social and governance screens.
Positive screens over-weight stocks which perform well on certain attributes and place lesser or
no weight on those that perform poorly on those attributes. Negative screens only restrict
investments in firms that perform poorly on certain attributes. These differences in style might
impact fund performance. We have collected data on screening criteria by looking through each
fund’s prospectus (historical or current) made publicly available on SEC Edgar. For a few funds
the information was obtained from company websites. Most funds tend to describe their SRI
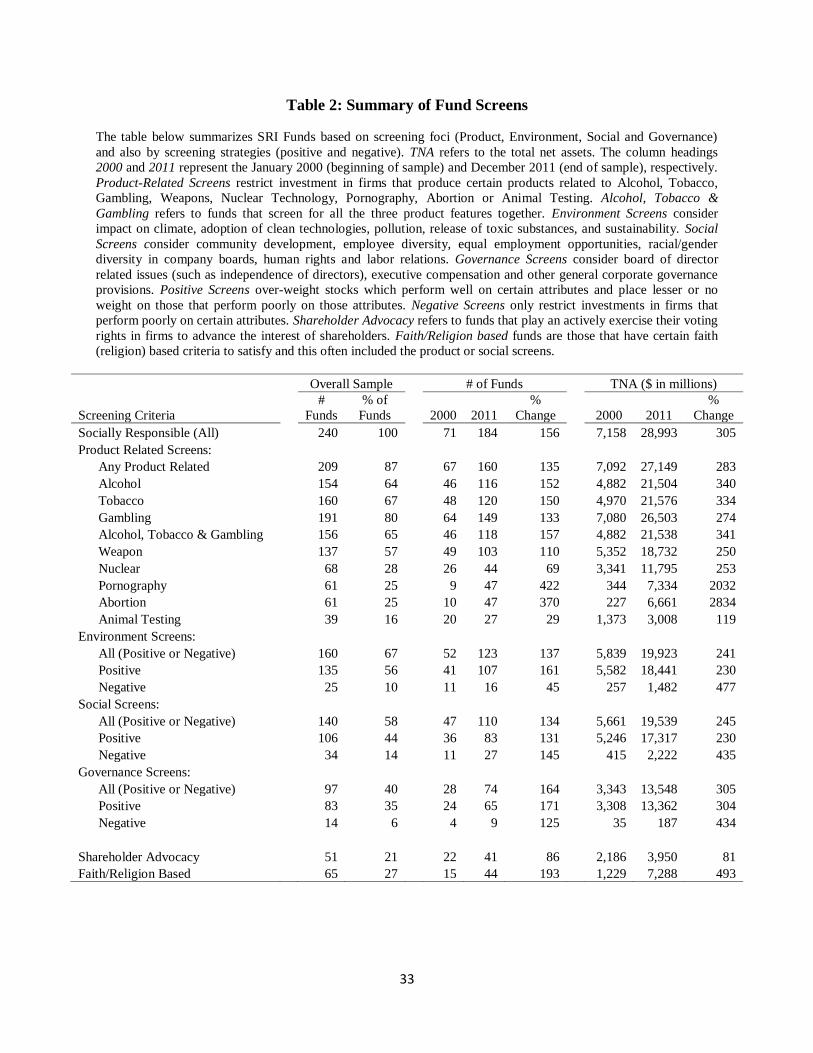
criteria under the “Principal Investing Strategies” section of their prospectus. See Table 2 for a
distribution of our sample’s screen criteria. We define product-based screens as those that
prohibit or restrict investments in stocks that produce or derive significant revenues from
alcohol, tobacco, gambling, defence/weapons, nuclear energy, pornography or contraceptives.
Out of 209 funds that employ some kind of firm product screens, the most frequently screened
product characteristics are gambling (191 funds), tobacco (160 funds), and alcohol (154 funds).
<Insert Table 2 about here>
Environmental screens consider the firm’s impact on climate, adoption of clean
technologies, pollution, release of toxic substances, and sustainability. Of the 160 funds with
environment screens, 25 use a negative screen approach that avoids polluters. The other 135 fund
use a positive screen strategy in which they seek firms that take actions like using green energy
and promoting recycling, which positively contribute to the environment.. Social screens
consider community development, employee diversity, equal employment opportunities,
racial/gender diversity in company boards, human rights, and labor relations. Of the 140 funds
using social criteria, 106 are using the positive screen approach to find progressive firms.

10
Governance screens consider board of director related issues (such as independence of directors),
executive compensation, and other general corporate governance provisions. There are 97 funds
in our sample that use governance criteria. Of these, 83 funds use positive governance screens,
while 14 use negative screens to avoid firms with poor governance policies. A few funds broadly
mention employing environment, social or governance screens, but do not define their precise
screening criteria/methodology.
The number of SRI mutual fund and the amount of SRI assets under management grew
substantially during the time of our sample. The total number of SRI funds grew from 71 in 2000
to 184 in 2011, for a 156 percent growth. SRI mutual fund assets under management grew 305
percent, to $29 billion. The fasted growing funds in the ESG categories were funds that screen on
corporate governance issues. Faith/religious focus funds, which often implement some product
based screen (often related to alcohol, tobacco, gambling, pornography or
abortion/contraceptives) and sometimes also include a few ESG screens, also witnessed
significant growth.
A cursory review of the second table would suggest that SRI firms tend not to specialize
in just one screening foci. Indeed, the typical SRI fund uses various product screens and
environmental or social screens. Table 3 shows the frequency of fund using combinations of
screening topics. Panel A displays the number of funds using combinations of product,
environment, social, and governance screens. For example, there are 131 funds that implement
both product and environmental screens. We have 128 funds that use both social and
environmental screens. Panel B adds the positive and negative screen information to the analysis.
For example, there are 106 funds that use product screens and positive environmental screens.
One thing that is apparent in the panel is that funds tend to stick to either positive or negative
11
screen techniques. Of the 135 funds that use a positive environmental screen, only 5 use negative
social screens and none use governance negative screens. And of the 25 funds that use negative
environmental screens, none use positive social or governance screens.
<Insert Table 3 about here>
The CRSP US Mutual Fund database provides data on mutual fund holdings from
January 2003 onwards on a monthly frequency. Unfortunately, data is often missing for some
months, especially early in the time period. Given that the data is evenly available only at the
quarterly level (which starts in 2000), we choose to investigate differences quarterly fund
composition.3 The mutual fund holdings data uniquely identifies securities in each fund portfolio.
This allows us to study stock characteristics of the portfolios by extracting stock level returns
and accounting data from the CRSP and Compustat.
3.2 Matching Conventional Funds
In this study, we compare the performance of SRI equity funds to a matched sample of
non-SRI conventional equity funds. The matching fund approach has been used in many other
studies that investigate SRI fund performance.4 For each SRI fund, on the earliest date that a SRI
fund appears in our sample, we identify three peer conventional funds with similar Lipper fund
objectives, years in existence and total net assets. We accomplish this by first identifying
conventional funds with same Lipper objective and inception dates within a year of the SRI
fund’s inception date. Thereafter, the three conventional funds closest in total net assets are
3 If the holding at the end of a particular quarter are unavailable, we take the reporting date closest to the end of the
quarter as reflective of the quarter end position. Sometimes there could be a potential tie. For example, the statement
for 11/30/2008 and 1/31/2009 are considered to be reflective of the quarter ending 12/31/2008 and are a month away
from the relevant date. In this situation, we assume that 1/31/2009 is more reflective of 12/31/2008 than an earlier
reporting date of 11/30/2008. 4 For examples, see Goldreyer, Ahmed and Diltz (1999), Statman (2000), Bauer, Koedijk and Otten (2005), Bollen
(2007), and Renneboog, Horst, and Zhang (2008).

12
identified.5 Also, we ensure that for each SRI fund, the three matched funds come from unique
fund families. This is done to ensure that the matched conventional fund performance is not
dominated by a few fund families.
3.3 Crisis Periods
Crisis periods are often characterised with a big fall in the stock market. During the
period 2000 to 2011, we identify two crisis periods for the stock market based on the peak and
trough for the Standard & Poor’s 500 Index: March 2000 to October 2002 and October 2007 to
March 2009. The first crisis period (March 2000 to October 2002) happened after the technology
bubble burst and during this period the S&P 500 fell from from a high of 1534.63 on March 27,
2000 to a low of 768.63 on October 10, 2002. The second crisis period (October 2007 to March
2009) revolved around the global financial crisis and saw the S&P 500 fall from a high of
1576.09 on October 11, 2007 to a low of 666.79 on March 6, 2009.
The National Bureau of Economic Research (2012) identifies two recessionary periods
during the period 2000-2011. The first recessionary business cycle is from March 2001 to
November 2001 (8 months) and the second cycle is from December 2007 to June 2009 (18
months). These NBER recessionary periods broadly coincide with our definition of market crises
based on the performance of the stock market, thought the first NBER period is shorter than our
first market crises period. Using the NBER definition we get results similar to the ones with our
market crises definition.
5 For very few (3 out of 240) SRI funds, three conventional fund matches were not found due to the one year age
criteria being too restrictive. In such cases, we relax the fund inception date criteria to within three years and if we
still do not achieve three matched funds we drop the age criteria completely. We also tried an alternate matching
procedure using the same matching criteria as above but instead of identifying matched conventional funds just once
on the earliest date that a SRI fund appears in the sample, we conducted a separate matching routine for each SR
fund each month. This meant that the same fund could have potentially different matched conventional funds each
month. Even with this alternate methodology our results remained unchanged.
13
3.4 Alpha using Factor Models
We use three different factor models to calculate risk adjusted abnormal return
performance of SRI funds relative to conventional funds. The first alpha measure is calculated
from the CAPM. The second model used is the Fama-French 3-factor model (Fama and French,
1993), which supplements the CAPM with the size (SMB) and value (HML) investment style
factors. The last alpha measure is calculated using the Carhart (1997) 4-factor model, which
supplements the Fama-French 3-factor model with a momentum (WML) factor. We implement
the above models for an equally weighted portfolio of mutual funds over a monthly time-series.
While several studies in the past have investigated the performance of SRI funds and
conventional funds over different time horizons, we estimate separate non-crisis and crisis period
alpha model parameters using the entire monthly time-series of the average mutual fund return
for the twelve year period (2000-2011). We estimate the non-crisis (NC) and crisis (C) period
alphas for the CAPM using the following specification:
( )
where is the equally weighted average monthly fund returns belonging to a specific fund
category (SRI, Conventional or SRI-Conventional) at time t, is the non-crisis period
monthly alpha, is the crisis period monthly alpha, is a dummy variable that takes the
value of 1 if time t is defined as non-crisis period and 0 otherwise, is a dummy variable that
takes the value of 1 if time t is defined as a crisis period and 0 otherwise, is the market
return, is the risk free rate (30 day T-bill rate), and measures systematic risk. The Fama-
French 3-factor with crisis and non-crisis alphas extends the CAPM above with the following
specification:
( )

14
where and , are the loadings on the size (SMB) and value (HML) factor, respectively.
Finally, we consider the Carhart 4-factor model for measuring crisis and non-crisis alphas:
( )
where is the loading on the momentum (WML) factor and the remaining terms have been
defined above. The monthly alphas are annualized for presentation in our tables. To account for
any possible time-series correlation of regressions residuals, we estimate standard errors for the
regression coefficients using the Newey-West procedure (Newey and West, 1987). The data for
(30-day Treasury bill rate), SMB, HML, and WML were obtained from Kenneth French’s
(2012) online data library.
4. Fund Performance in Crisis and non-Crisis Periods
Average returns and alpha estimates for various factor models are reported in Panel A of
Table 4 for our time period. The estimates shown are annualized measures. The SRI funds
average 2.56 percent, which is not significantly different than the 2.60 percent of the matching
conventional funds. The alpha estimates for the SRI funds in the three factor models are all
small, negative, and not significantly different from zero. This is also true for the matching
conventional funds. The alphas for the SRI funds are not significantly different than the
matching conventional fund alphas, which is consistent with Statman (2000), Shank, et al.
(2005), and Renneboog, et al. (2008a). Of course, the firm perspective of stock returns is that
they may represent the cost of equity capital. El Ghoul , et al. (2011) study firms’ cost of capital
and report that some SRI foci experience lower equity costs.
<Insert Table 4 about here>
The alpha estimates in crisis and non-crisis periods are reported in Panel B. For average
returns, SRI funds earn an annualized 15.8 percent during non-crisis periods and –18.7 percent

15
during crisis periods. This is a slight insignificant underperformance compared to conventional
funds during the non-crisis periods. During the crisis periods, the SRI funds outperformed the
conventional funds by an annualized 1.18 percent, which is nearly significant at the 10 percent
level with a t-statistic of 1.65. Note that the non-crisis period alphas are significantly negative for
both types of firms. SRI funds underperform conventional funds during the non-crisis periods by
–0.67 to –0.95 percent, depending on the asset pricing model, and these negative alphas are
significant at the 10 percent level. For the crisis periods, the alpha estimates are positive, though
not statistically significant. SRI alphas are economically and statistically significantly higher
than the matching conventional funds (range of 1.61 to 1.70 percent) during the crises. Thus, we
find that SRI mutual funds do hold up slightly better during crisis periods compared to
conventional funds. As a balance, they give up a small amount of return during non-crisis
periods. Investors who face prospect theory utility functions will be willing to give up some
upside in the non-crisis periods to attenuate the downside during the crisis periods. This is
because the utility function in the loss domain is steeper than the function in the gain domain.
The risk of SRI is also of interest. At the company level (not the mutual fund level),
Oikonomou, et al. (2012) examine the relationship between Corporate Social Performance (CSP)
measures as indicated by KLD and systematic risk using S&P 500 firms for the period 1992 to
2009. Using a one factor market model, they find that social strength components of firms are
insignificantly negatively associated with systematic risk while social concern components are
significantly positively associated with systematic risk. Luo and Bhattacharya (2009) also find
that CSP and idiosyncratic risk are negatively related. However, Galema, et al. (2008) argues that
SRI may impact a firm’s book-to-market ratio and thus confound signal factor measures of
systematic risk. To examine risk, we use the Carhart 4-factor model and with separate intercept
16
estimates for non-crisis and crisis periods. The results for SRI and conventional funds are shown
in Table 5. In general, SRI funds when compared to conventional funds load a little more on the
market risk and the book-to-market valuation (HML) factors, and a little less on size (SMB) and
return momentum (WML) factors. Although there are a few statistically significant differences
between the loading of SRI and conventional funds, their magnitudes appear economically small.
<Insert Table 5 about here>
5. Screening Techniques in Crisis and non-Crisis Periods
Our performance analysis so far investigates the SRI funds as a homogeneous group.
However, the different foci categories of the SRI funds may have different impacts during
market crises. For example, a portfolio consisting of firms that use good corporate governance
practices seems well suited to perform better during dynamic times like a market crisis. On the
other hand, we do not see that a portfolio selected on faith based philosophies would be either
better or worse suited to navigating such dynamic periods. Thus, we investigate the performance
of SRI mutual funds using different foci and screening techniques. Again, we are interested in
Crisis and non-Crisis periods. We begin by estimating annualized alphas computed from the
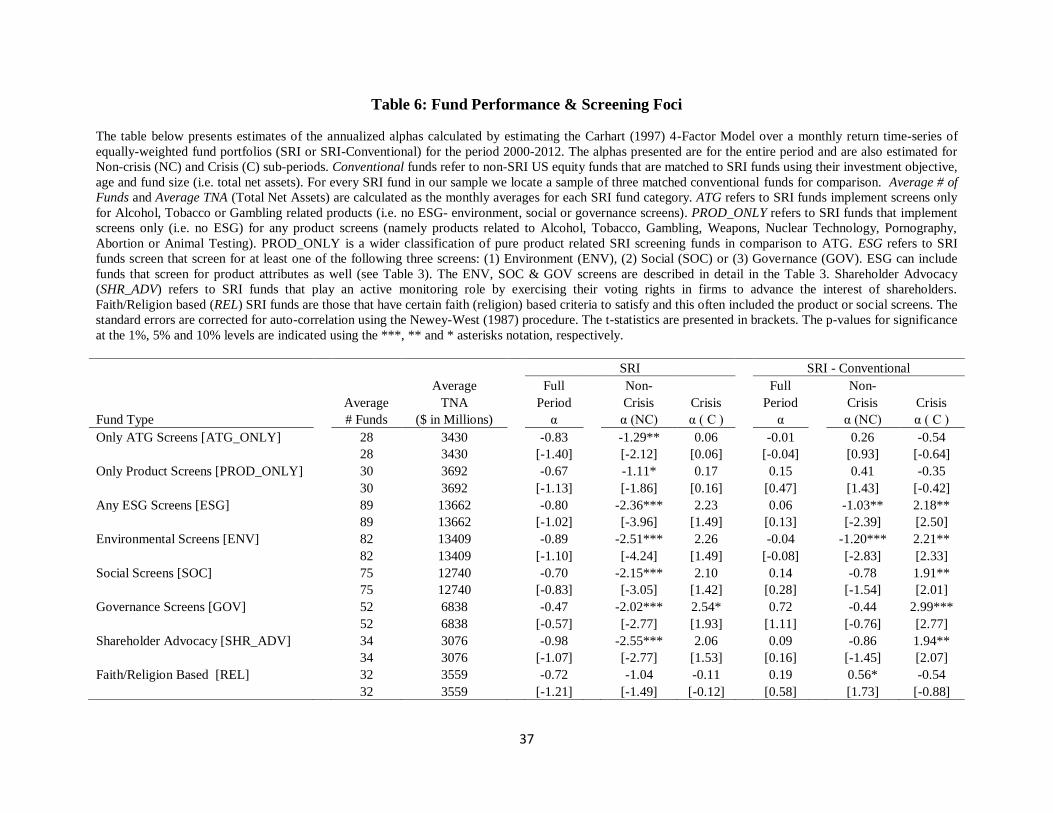
Carhart (1997) 4-Factor Model for the different SRI foci categories. The performance of funds is
potentially confounded by various combinations of screening criteria employed. Most funds
often screen for either product related criteria (62 funds) or for ESG attributes with a few product
screens (149 funds). Few funds screen only for ESG attributes (29 funds), while ignoring any
product screens. In order to study the impact of popular product screens without the confounding
impact of ESG screens, we look at the performance of funds that employ only product screens.
The results for the funds that screen only (i.e., no other product or ESG screens) on alcohol,
tobacco, and gambling (ATG) are shown in Table 6. The ATG funds significantly underperform

17
by −1.29 percent during non-Crisis periods and have insignificant performance during Crisis
periods. In addition, the ATG fund performance is not significantly different from conventional
funds. Thus, it appears that avoiding sin stocks does not produce the crisis support seen in the
general SRI sample. Increasing the subsample to include all funds that screen only for product
related screens (i.e., no ESG screens) beyond just alcohol, tobacco and gambling results in
similar conclusions.
<Insert Table 6 about here>
The environmental, social, and governance categories perform much better during crisis
periods. As a group, these ESG funds underperform conventional funds by −1.03 percent during
non-crisis periods and outperform them in crisis periods by 2.18 percent. Both estimates are
significant at the 5 percent level. In separating environmental, social, and governance categories,
we find that all three significantly outperform conventional funds by 2.21, 1.91, and 2.99
percent, respectively. The performance of the funds focusing on governance issues show a
particularly strong crisis period alpha. They have the only significantly positive abnormal return
(2.54 percent) during crisis of all the SRI fund categories. The 34 funds that are active in
shareholder advocacy also significantly outperform conventional funds in crisis periods.
Interestingly, advocacy sample of firms appears to perform very similar to the funds with social
screens.
Lastly, the faith/religious based funds seem to perform very similar to funds that
implement only product screens. The religious funds outperform conventional funds in the non-
crisis periods by 0.56 percent (significant at the 10 percent level) and underperform during the
crisis periods. This is expected given that faith/religious funds are mostly (40 out of 65) purely
product screening funds. Based on faith/religious tenants these funds often exclude firms that

18
produce or derive significant revenues from products related to alcohol, tobacco, gambling,
pornography or abortion/contraceptives.
We also examine the performance by positive versus negative screening techniques. We
ask, is it better to avoid firms with poor ESG characteristics or seek firms with good ESG
characteristics? The results are shown in Table 7. A quick examination of both the full period
SRI fund alphas and their alphas from the comparison with conventional funds show that none
are significantly different from zero. Thus, neither positive nor negative screen techniques do
better overall. However, the results in the non-Crisis and Crisis periods show large differences.
The alphas for all the samples that use positive screens are significantly negative during non-
crisis periods and significantly positive in crisis periods. None of the alphas for the funds using
negative screens are significant. The pattern is the same in comparison with the conventional
funds. Positive screen funds underperform conventional funds during non-crisis periods and
outperform during crisis periods. Thus, our general finding that SRI funds hold up better during
crisis periods, at a cost during the non-crisis periods, appears to mainly come from ESG funds
with positive screen techniques.
<Insert Table 7 about here>
The opposite of using an SRI strategy would be to specifically buy stocks that SRI
investors avoid. For example, Hong and Kacperczyk (2009) find that one type of sin stocks,
tobacco, earns high risk adjusted returns. We are aware of one mutual fund that derives a
significant portion of its portfolio from sin stocks. Hoepner and Zeume (2009) find that this Vice
Fund does not earn abnormal returns. We compare the performance of the Vice Fund to the
performance of SRI funds that intentionally excludes sin stocks. The results are reported in Table
8. The SRI vice screened funds’ earns a significant −1.7 percent alpha during the full time

19
period. Most of the negative performance comes from an annualized −2.26 percent alpha during
non-crisis periods, which is moderated somewhat by a positive, but insignificant crisis period
alpha. The Vice Fund has a full time period alpha of 2.01 percent, but it is not statistically
significant. Interesting, the Vice Fund shows the opposite performance pattern in the non-crisis
and crisis periods compared to SRI funds. The Vice Fund earns a large 5.81 percent alpha during
non-crisis periods and an −14.36 percent alpha during the crisis periods. Comparing the vice
screened funds to the Vice Fund show that the screened funds significantly underperform during
non-crisis periods and outperform during crisis periods.
<Insert Table 8 about here>
6. Firm characteristics versus social responsibility
We show that SRI mutual funds earn an asymmetric return performance. They perform
better during market crisis periods, but at a cost of performing worse during non-crisis periods.
This asymmetry might be valued by investors with a prospect theory utility function. However,
our finding might not result from the SRI aspect of the firms in the portfolio, but rather by other
characteristics of those firms. For example, one could conjecture that SRI funds invest in well-
established firms with stable cash flows, which could provide downside protection during
periods of market turmoil. Thus, it could be argued that non-SRI stock fundamentals
characteristics induce the performance asymmetry rather than the SRI aspects. Also, there could
be differences in fund management between SRI and conventional funds the drive our results.
Thus, in this section we investigate whether it is the SRI aspects of these funds or the firm or
fund characteristics that are important for the performance pattern.

20
6.1 Description of variables for firm and fund characteristics
We introduce the following firm characteristic variables: Age, BM, Cap, Leverage,
Turnover, Illiquidity, Div Yield, Ret Volt, CF Volt and ROA. Each variable is calculated as the
value-weighted averages of individual stocks in a mutual fund’s portfolio.6 Age refers to the
number of years since the stock first appeared in the CRSP database. BM is the book value of
equity divided by the market capitalization. Similar to Fama and French (1993), we calculate
book value at the end of the previous fiscal year as the sum of common stockholder’s equity,
deferred taxes and investment credits. Cap is calculated as the market capitalization (in billions)
of the stock at the end of the quarter. Leverage refers to the debt-to-equity ratio. Turnover and
Illiquidity for each stock-quarter is calculated as the average daily turnover over the last calendar
year. Daily turnover (see Datar, Naik and Radcliff, 1998) is calculated as volume divided by
shares outstanding. A higher turnover potentially indicates greater liquidity. Similar to Amihud
(2002), we calculate Illiquidity on a daily basis [|Return|÷ (Price*1000*Volume)], which reflects
the price change induced by a thousand dollar volume of trades. A higher value for the Illiquidity
measure indicates low liquidity. Div Yield refers to the annual percentage dividend yield
calculated for each stock as the annual dividends (split adjusted) divided by price (split adjusted).
Ret Volt standard deviation of daily excess returns (excess over CRSP value-weighted index) over
the last calendar year. Similar to Zhang (2006) we calculated CF Volt as standard deviation of
the net cash flow from operating activities over the previous five financial years (minimum of
three years), scaled by the average total assets. ROA is the net income divided by average total
assets.
6 Data for BM, Leverage, CF Volatility and ROA for each stock each quarter is extracted from the previous fiscal
year data made available on Compustat. In contract, Age, Cap, Turnover, Div Yield and Ret Volatility are extracted
from the most recently available data on CRSP at the end of a particular quarter.
21
We also compute three fund level characteristics: Fund Turnover, Fund # Stocks and
Fund Defensive Alloc. Fund turnover for each fund-quarter observation is calculated as the
minimum of the aggregate purchases and sales during the quarter divided by the average of the
beginning and end of quarter total portfolio value. The turnover rate is thereafter annualized for
presentation. In the absence of transaction level data, we use quarterly holdings data to determine
the total sales and purchases of stocks in the underlying portfolio. To determine a sale or
purchase we look at how the split adjusted number of stocks at the end of each quarter changes.
The dollar value of a stock purchase (or sale) is determined by multiplying the adjusted change
in holdings for a stock multiplied by its average daily split adjusted price for the stock each
quarter. Fund # Stocks is calculated as the total number of stocks held in a fund’s portfolio in a
particular quarter. Fund Defensive Alloc is calculated as the total percentage of fund’s portfolio
in a particular quarter that is invested in Consumer Non-Durable, Utility and Healthcare
industries, which are sometimes referred to as defensive industries. We use the Fama-French ten
industry SIC classification available on Kenneth French’s (2012) online data library.
We report these fund and firm characteristics in Table 9. Panel A shows the three fund
level measures. Since a mutual fund may behave differently in a bull versus a bear stock market,
we report the average characteristics in the non-crisis and crisis periods for SRI fund and for the
matching conventional funds. The conventional funds appear to be more active traders compared
to the SRI funds as they have significantly more turnover. In fact, conventional funds trade about
35 percent more. For the number of the stocks in the portfolios, the SRI funds hold more stocks
during the non-crisis periods (198 versus162) while the conventional funds hold more during the
crisis periods (181 versus 166). If the number of stocks in a portfolio is indicative of the level of
diversification, then SRI funds are more diversified during non-crisis periods and conventional
22
funds are better diversified during crisis periods. Some mutual funds adapt to a market downturn
by rotating into so called defensive stocks. SRI funds do not appear to rotate in this manner.
They hold 18.6 percent of their portfolio in the defensive industries regardless of whether it is a
market crisis or not. On the other hand, conventional funds rotate from a 14.8 percent allocation
during the non-crisis periods to an 18.8 percent allocation in crisis periods. These three portfolio
measures suggest that SRI funds are managed differently than conventional funds.
<Insert Table 9 about here>
The comparison of the firm level characteristics of the companies in the portfolios is
shown in Panel B. The first two rows shows that SRI funds prefer to own firms that are slightly
younger and smaller in size. Although there are some significant differences between the
dividend yields and book-to-market ratios of the firms in the portfolios between SRI and
conventional funds, the differences seem economically small. SRI funds hold firms with higher
ROA and lower leverage compared to conventional portfolios in both non-crisis and crisis
periods. The underlying trading of the firms owned by SRI funds shows lower turnover and
lower return volatility than the firms owned by the matching conventional funds.
Are these differences in fund and firm characteristics causing our asymmetric
performance patterns between SRI funds and conventional funds? Or, are the SRI foci and screen
techniques driving our result? We test these hypotheses in the next section.
6.2 Comparing the cross-section of mutual funds
The cross-sectional difference in mutual fund performance could be attributed to its
underlying portfolio or fund investing characteristics. Though our factor models are an efficient
tool for a time-series performance attribution of the average mutual fund, they do not allow for
23
studying or controlling the impact of cross-sectional fund variables. In this section, we analyze a
panel data of quarterly stock returns using the following regression specification:
( )
where is the quarterly fund return for fund j at time t, is a dummy variable that takes the
value 1 if fund j is a SRI fund and 0 otherwise, is a dummy variable that takes the value
1 if time t is defined as a crisis period and 0 otherwise, is the market (CRSP value-
weighted) return, is the risk free rate (30 day T-bill rate), and measures systematic risk.
The other dependent variables Age, BM, Cap, Leverage, Turnover, Div Yield, Ret Vol, CF Vol,
ROA, Fund # Stocks, Fund Defensive Allocation and Fund Turnover have been defined in the
previous section.7 To control for regression residuals being correlated across time and fund,
consistent with the finding of Peterson (2009), we generate double clustered (time and fund
clusters) robust standard errors. The coefficient measures additional quarterly return (if any)
earned by SRI funds. The coefficient measures the additional quarterly return earned by SRI
funds in times of crises.
SRI funds are not alike and different screening foci are likely to produce different results.
To study the difference in impact of screening foci, we implement the following regression
specification:
7 Since both Turnover and Illiquidity are related to liquidity, we present results with only one of them. Our
unreported results with the Illiquidity variable instead of the Turnover variable are similar and therefore have not
been presented to conserve space.

24
( ) ∑
where is a dummy variable that takes the value 1 if fund j implements an ESG
(Environment, Social or Governance) screen and 0 otherwise, is a dummy variable
that takes the value 1 if fund j implements only (no other screening criteria) pure product related
(Alcohol, Tobacco, Gambling, Weapons, Animal Testing, Nuclear, Pornography or
Contraceptives) exclusionary screens and 0 otherwise, is a dummy variable that takes the
value 1 if time t is defined as a crisis period and 0 otherwise, and the remaining terms are defined
in the earlier regression specification. The coefficients , , , and measure the
differential quarterly return impact of ESG screens in general, ESG screens during crises periods,
product screens in general, and product screens during crises periods, respectively. Beyond
testing for the impact of any ESG screens in general (ESG=Any), we also separately test for
Environment (ESG=Env), Social (ESG=Social) and Governance (ESG=Govern).8
The regression estimates are reported in Table 10. The first regression (shown as [1])
examines the impact of SRI in general, while controlling for firm and fund characteristics. The
SRI coefficient of −0.273 percent (significant at the 10 percent level) should be interpreted as a
quarterly alpha for SRI funds. In general, the SRI funds underperform. However, they do
perform better during the crisis periods. The SRI*CRISIS interaction coefficient is a significant
0.781 percent. Therefore, even though there are differences in fund management and firm
8 We do not place three separate dummy variables for Environment, Social and Governance criteria in the same
regression as most fund screen for multiple ESG attributes, leading to strong multi-collinearity and uninterruptable
coefficient. For example, out of 161 funds that screen for Environment, we find that a majority also screen for other
criteria like social (130 funds) and governance criteria (85 funds). Refer to table 3 for more details for combination
of screens implemented.

25
characteristics of companies held between SRI and conventional funds, it is the socially
responsible attribute that drives the performance asymmetry.
<Insert Table 10 about here>
Our earlier results suggest that most of the performance asymmetry comes from the
environmental, social, and governance categories of SRI. In regression [2], we show the results
for the ESG focused funds and their matched conventional funds. The ESG coefficient reported
is a significant −0.33 percent and the crisis interaction coefficient is large 0.90 percent per
quarter. The product screen only coefficients are not significant. Therefore, it still appears that
the ESG categories are driving the overall results. Regressions [3] to [5] separately test for the
impact of each of the three ESG criteria namely, environmental, social, and governance.9 The
results for the environmentally screened funds are very similar to the general ESG analysis. The
social and governance screened fund analysis shows that the overall alpha estimates are still
negative, but smaller in magnitude and no longer significant. The crisis alphas are still positive,
larger in magnitude (over 1 percent per quarter), and significant at the 5 percent level. We
interpret these results as indicating that all three SRI categories of environmental, social, and
governance, contribute to the return performance asymmetry.
In our last analysis, we examine the role of positive and negative screen techniques while
controlling for the fund and firm characteristics. The following regression specification explores
the differences in alpha (abnormal returns), if any, for positive and negative ESG screening
strategies:
9 These categories may not be independent as many funds might screen for multiple ESG criteria.

26
( ) ∑
where is a dummy variable that takes the value 1 if fund j implements a
positive ESG (Environment, Social or Governance) screen and 0 otherwise, is
a dummy variable that takes the value 1 if fund j implements a negative ESG (Environment,
Social or Governance) screen and 0 otherwise, and the remaining terms are defined in the earlier
regression specification. The coefficients , , , , , and measure the differential
impact of positive ESG screens in general, positive ESG screens in general during crises periods,
negative ESG screens in general, negative ESG screens in general during crises periods, product
screens in general, and product screens during crises periods, respectively.
Table 11 reports the results for samples of SRI funds using any ESG foci, or each of the
three separately and their matching conventional funds. All four of the regressions show the
same results. The funds using positive screens earn a significant negative alpha in general, and a
significantly positive and larger in magnitude alpha for the crisis periods. None of the estimates
for negative ESG screens and product screens are significant. Thus, after controlling for fund
characteristics and the characteristics of the firms in the portfolios, positively screened ESG
attributes hold up better in crisis periods.
<Insert Table 11 about here>

27
7. Summary
The number and assets under management of socially responsible mutual funds have
dramatically grown over the past couple of decades. And yet, much of the literature reports that
investors pay a cost for limiting their portfolios to SRI attributes. If so, then why have SRI funds
become more popular? We postulate that the positive socially responsible attributes of
companies make them less risky in market crisis periods. For example, firms with good
governance standards are more likely to navigate the dynamic challenges of crisis periods. In
addition, investors with Prospect Theory utility will value the gain in utility for doing better in
falling markets more than the loss in utility for underperforming in rising markets. This is
because people are more negatively impacted by losses than they are positively impacted by a
gain of similar magnitude.
Using a sample of SRI mutual funds and matching conventional funds during the period
2000 to 2011, we compute the return alphas in non-Crisis and Crisis periods. Overall, the alphas
for SRI and conventional funds are insignificantly negative and not different from each other.
However, in non-crisis periods, conventional funds outperform SRI funds by an annualized 0.67
to 0.95 percent, depending on the factor model used. But in crisis periods, SRI funds outperform
by 1.61 to 1.70 percent. Further analysis shows that the outperformance in crisis periods is driven
by the mutual funds that focus on shareholder advocacy, environmental, social, and governance
issues. In addition, it is the ESG funds that use a positive screen technique rather than negative
screens have this asymmetric return pattern. SRI funds that focus on sin stocks or other product
screens and funds that focus on faith or religious principles do not outperform in crisis periods. It
is worth noting that these product screens are also in their nature negative screen. Thus, it is fair

28
to conclude that it is positive screening in general that leads to positive alphas during periods of
market turmoil.
We also compare several fund management measures between SRI and conventional
funds. While there are differences in the fund turnover, the number of stocks held in the
portfolio, and the allocation to defensive stocks, these differences do not drive the asymmetric
return findings. Our analysis of the characteristics of the companies held in the portfolios also
shows differences between the funds. SRI funds, on average, hold younger and smaller firms,
more profitable firms, and firms with lower return volatility. After controlling for these firm
characteristic differences, we find that it is still the socially responsible attributes that are
associated with the outperformance in crisis periods.
We conclude that SRI attributes, especially ESG, drive an asymmetric return pattern in
which SRI funds outperform conventional funds in market crisis periods, but underperform in
non-crisis periods. This pattern could be valued by investors with Prospect Theory utility
functions.

29
References
Adler, Timothy, and Mark Kritzman. 2008. “The Cost of Socially Responsible Investing.”
Journal of Portfolio Management 35:1, 52–56.
Amihud, Y., 2002. Illiquidity and stock returns: cross-section and time series effects. Journal of
Financial Markets 5, 31-56.
AON. 2007. Industry Update: “Sustainability – Beyond Enterprise Risk Management.” Retrieved
2/25/2012 from, http://www.aon.com/about-aon/intellectual-capital/attachments/risk-
services/sustainability_beyond_enterprise_risk_management.pdf
Bauer, R., Koedijk, K., Otten, R., 2005. International evidence on ethical mutual fund
performance and investment style. Journal of Banking and Finance 29, 1751–1767.
Benson, Karen L., and Jacquelyn E. Humphrey. 2008. “Socially Responsible Investment Funds:
Investor Reaction to Current and Past Returns.” Journal of Banking and Finance 32:12,
1850-1859.
Bebchuk, Lucian A., Alma Cohen, and Allan Ferrell. 2009. “What Matters in Corporate
Governance?” Review of Financial Studies 22:2, 783–827.
Bebchuk, Lucian A., Alma Cohen, and Charles C. Y. Wang. 2011. “Learning and the
Disappearing Association between Governance and Returns.” Journal of Financial
Economic, forthcoming.
Bollen, Nicolas. 2007. “Mutual Fund Attributes and Investor Behavior.” Journal of Financial
and Quantitative Analysis 42:3, 683–708.
Carhart, Mark M. 1997. “On persistence of mutual fund performance,” Journal of Finance 52,
57-82.
Datar, Vinay T., Narayan Y. Naik and Robert Radcliffe. 1998. “Liquidity and stock returns: An
alternative test,” Journal of Financial Markets 1, 205-219.
Derwall, Jeroen, Nadja Guenster, Rob Bauer, and Kees Koedijk, 2005. “The Eco Efficiency
Premium Puzzle.” Financial Analysts Journal 61:2, 51–63.
Derwall, Jeroen, Kees Koedijk, and Jenke ter Horst. 2011. “A Tale of Value-seeking versus
Profit-driven Investors.” Journal of Banking and Finance 35:8, 2137–2147.
Edmans, Alex. 2011. “Does the Stock Market Fully Value Intangibles? Employee Satisfaction
and Equity Prices.” Journal of Financial Economics 101:3, 621–640.
El Ghoul, Sadok, Omrane Guedhami, Chuck C. Y. Kwok, and Dev R. Mishra. 2011. “Does
corporate social responsibility affect the cost of capital?” Journal of Banking and Finance
35:9, 2388-2406.
Fama, Eugene F., and Kenneth R. French. 1993. “Common factor in the returns of stocks and
bonds,” Journal of Financial Economics 33, 3-56.
French, Kenneth R., 2005. Retrieved from:
http://mba.tuck.dartmouth.edu/pages/faculty/ken.french/data_library.html
Galema, Rients, Auke Plantinga, and Bert Scholtens. 2008. “The stocks at stake: Return and risk
in socially responsible investment.” Journal of Banking and Finance 32, 2646-2654.
Girard, Eric, Hamid Rahman, and Brett Stone. 2007. “Socially Responsible Investments: Goody-
Two-Shoes or Bad to the Bone?” Journal of Investing 16:1, 96–110.
Goldreyer, Elizabeth F., Parvez Ahmed, and J. David Diltz. 1999. “The Performance of Socially
Responsible Mutual Funds: Incorporating Sociopolitical Information in Portfolio Selection.”
Managerial Finance 25:1, 23–36.

30
Guenster, Nadja. 2012. “Performance Implications of SR Investing: Past versus Future,” in
Socially Responsible Finance and Investing, Kent Baker and John R. Nofsinger, Editors.
John Wiley & Sons, Inc., forthcoming.
Hamilton, Sally, Hoje Jo, and Meir Statman. 1993. “Doing Well While Doing Good? The
Investment Performance of Socially Responsible Mutual Funds.” Financial Analysts Journal
49:6, 62–67.
Hoepner, Andreas G. F., and Stephan Zeume. 2009. “The Dark Enemy of Responsible Mutual
Funds: Does the Vice Fund Offer More Financial Virtue?” Working paper, available at
SSRN: http://ssrn.com/abstract=1485846.
Hong, Harrison, and Marcin Kacperczyk. 2009. “The Price of Sin: The Effects of Social Norms
on Markets.” Journal of Financial Economics 93:1, 15–36.
Kahneman, Daniel, and Amos Tversky. 1979. “Prospect Theory: An Analysis of Decision under
Risk.” Econometrica 46, 171-185.
Kempf, Alexander, and Peer Osthoff. 2007. “The Effect of Socially Responsible Investing on
Portfolio Performance.” European Financial Management 13:5, 908–922.
Kim, Irene, and Mohan Venkatachalam. 2011. “Are Sin Stocks Paying the Price for Their
Accounting Sins?” Journal of Accounting, Auditing and Finance 26:2, 415–442.
Luo, Xueming, and C.B. Bhattacharya. 2009. “The debate over doing good: corporate social
performance, strategic marketing levers, and firm-idiosyncratic risk.” Journal of Marketing
73, 198-213.
McGuire, Jean, Alison Sundgren, and Thomas Schneeweis. 1988. “Corporate Social
Responsibility and Firm Financial Performance.” Academy of Management Journal 31:4,
854-872.
National Bureau of Economic Research (NBER), 2012. Business Cycles Data. Retrieved from:
http://www.nber.org/cycles.html
Newey, W., and West, K., 1987. A Simple, Positive Semi-Definite, Heteroscedastic and
Autocorrelation Consistent Covariance Matrix. Econometrica 55, 703-708.
Oikonomou, Ioannis, Chris Brooks, and Stephen Pavelin. 2012. “The Impact of Corporate Social
Performance on Financial Risk and Utility: A Longitudinal Analysis.” Financial
Management 41:2, 483-515.
Petersen, M.A, 2009. “Estimating Standard Errors in Finance Panel Data Sets: Comparing
Approaches.” Review of Financial Studies 22:1, 435-480.
Renneboog, Luc, Jenke Ter Horst, and Chendi Zhang. 2008a. “The Price of Ethics and
Stakeholder Governance: The Performance of Socially Responsible Mutual Funds.” Journal
of Corporate Finance 14:3, 302328. Renneboog, Luc, Jenke Ter Horst, and Chendi Zhang. 2008b. “Socially Responsible
Investments: Institutional Aspects, Performance, and Investor Behavior.” Journal of Banking
and Finance 32:12, 1723–1742.
Renneboog, Luc, Jenke Ter Horst, and Chendi Zhang. 2011. “Is Ethical Money Financially
Smart? Nonfinancial Attributes and Money Flows of Socially Responsible Investment
Funds.” Journal of Financial Intermediation 20:4, 562–588.
Shank, Todd, Daryl Manullang, and Ron Hill. 2005. “Doing Well While Doing Good Revisited:
A Study of Socially Responsible Firms’ Short-Term versus Long-term Performance.”
Managerial Finance 31:8, 33–46.
Statman, Meir. 2000. “Socially Responsible Mutual Funds.” Financial Analyst Journal 56:3, 30–
39.

31
Statman, Meir, 2004. What do investors want? Journal of Portfolio Management 30th
Anniversary Issue, 153-161.
Statman, Meir, and Denys Glushkov. 2009. “The Wages of Social Responsibility.” Financial
Analysts Journal 65:4, 33–46.
USSIF. 2010. Trends in Socially Responsible Investing Retrieved 2/26/2012 from,
http://ussif.org/resources/research/documents/2010TrendsES.pdf
Verwijmeren, Patrick, and Jeroen Derwall. 2010. “Employee well-being, firm leverage, and
bankruptcy risk.” Journal of Banking and Finance 34, 956-964.
Zhang, X. F., 2006. “Information Uncertainty and Stock Returns.” Journal of Finance 61, 105–
137.

32
Table 1: Summary of SRI Funds
The table below summarizes information for the 240 Socially Responsible Investing (SRI) US domestic equity funds
in our sample. Full Period refers to statistics for the entire 12 year period (2000-2012). The time periods Jan 2000,
Jan 2006 and Dec 2011 denote approximately the beginning, middle and end of our sample period. TNA refers to
total net assets. A Unique Fund Manager is identified based on the fund manager managing the fund. Fund Type
refers to classification of funds as indexed and non-indexed funds. Non-Indexed Funds do not try to replicate any
particular stock index. Index Based funds utilize indices as primary filters to buy and sell securities. Non-ETF Pure
Index funds are open ended mutual funds that aim to match the total investment performance of a publicly
recognized securities market index by replicating its components and their respective portfolio weights. ETF Pure
Index funds are exchange traded funds that aim to match the total investment performance of a publicly recognized
securities market index by replicating its components and their respective portfolio weights. Enhanced Index funds
are mutual funds that aim to exceed the total investment performance of a publicly recognized securities market.
SRI Fund Summary Items Full Period Jan 2000 Jan 2006 Dec 2011
# of All Funds 240 76 113 184
TNA of All Funds ($ in millions)
7,158.10 23,139.00 28,992.70
# of Retail Funds 135 60 75 98
TNA of Retail Funds ($ in millions)
6,639.40 16,493.20 15,001.60
# of Unique Fund Managers 68 29 34 52
TNA of Median Unique Fund Managers ($ in millions)
51.00 188.05 179.90
Fund Type ( # of funds):
Non-Indexed 190 65 86 152
Index Based 17 6 7 9
Non-ETF Pure Index 18 2 15 13
ETF Pure Index 12 0 2 7
Enhanced Index 3 3 3 3
Fund Type (TNA $ in millions):
Non-Indexed
6,838.90 21,175.30 25,185.90
Index Based
242.10 376.40 1,367.00
Non-ETF Pure Index
52.40 1,059.70 1,154.30
ETF Pure Index
0.00 457.00 1,242.20
Enhanced Index
24.70 70.60 43.30
Median Expense Ratio
1.41% 1.38% 1.20%
Median Fund Age (in years) 3 6 7
33
Table 2: Summary of Fund Screens
The table below summarizes SRI Funds based on screening foci (Product, Environment, Social and Governance)
and also by screening strategies (positive and negative). TNA refers to the total net assets. The column headings
2000 and 2011 represent the January 2000 (beginning of sample) and December 2011 (end of sample), respectively.
Product-Related Screens restrict investment in firms that produce certain products related to Alcohol, Tobacco,
Gambling, Weapons, Nuclear Technology, Pornography, Abortion or Animal Testing. Alcohol, Tobacco &
Gambling refers to funds that screen for all the three product features together. Environment Screens consider
impact on climate, adoption of clean technologies, pollution, release of toxic substances, and sustainability. Social
Screens consider community development, employee diversity, equal employment opportunities, racial/gender
diversity in company boards, human rights and labor relations. Governance Screens consider board of director
related issues (such as independence of directors), executive compensation and other general corporate governance
provisions. Positive Screens over-weight stocks which perform well on certain attributes and place lesser or no
weight on those that perform poorly on those attributes. Negative Screens only restrict investments in firms that
perform poorly on certain attributes. Shareholder Advocacy refers to funds that play an actively exercise their voting
rights in firms to advance the interest of shareholders. Faith/Religion based funds are those that have certain faith
(religion) based criteria to satisfy and this often included the product or social screens.
Overall Sample # of Funds TNA ($ in millions)
Screening Criteria
#
Funds
% of
Funds
2000 2011
%
Change
2000 2011
%
Change
Socially Responsible (All)
240 100
71 184 156
7,158 28,993 305
Product Related Screens:
Any Product Related
209 87
67 160 135
7,092 27,149 283
Alcohol
154 64
46 116 152
4,882 21,504 340
Tobacco
160 67
48 120 150
4,970 21,576 334
Gambling
191 80
64 149 133
7,080 26,503 274
Alcohol, Tobacco & Gambling
156 65
46 118 157
4,882 21,538 341
Weapon
137 57
49 103 110
5,352 18,732 250
Nuclear
68 28
26 44 69
3,341 11,795 253
Pornography
61 25
9 47 422
344 7,334 2032
Abortion
61 25
10 47 370
227 6,661 2834
Animal Testing
39 16
20 27 29
1,373 3,008 119
Environment Screens:
All (Positive or Negative)
160 67
52 123 137
5,839 19,923 241
Positive
135 56
41 107 161
5,582 18,441 230
Negative
25 10
11 16 45
257 1,482 477
Social Screens:
All (Positive or Negative)
140 58
47 110 134
5,661 19,539 245
Positive
106 44
36 83 131
5,246 17,317 230
Negative
34 14
11 27 145
415 2,222 435
Governance Screens:
All (Positive or Negative)
97 40
28 74 164
3,343 13,548 305
Positive
83 35
24 65 171
3,308 13,362 304
Negative
14 6
4 9 125
35 187 434
Shareholder Advocacy
51 21
22 41 86
2,186 3,950 81
Faith/Religion Based 65 27 15 44 193 1,229 7,288 493

34
Table 3: Combination of Socially Responsible Screens
The table below summarizes the various combinations (# of funds) of SRI screens used by the 240 SRI US Equity
funds in our sample. Panel A presents combinations based on screening foci (product, environment, social and
governance). Panel B presents combinations based on both, screening foci and strategies (positive and negative).
PROD_Any refers to product screens, which restrict investment in firms that produce certain products related to
Alcohol, Tobacco, Gambling, Weapons, Nuclear Technology, Pornography, Abortion or Animal Testing. ENV
refers to environment screens, which consider impact on climate, adoption of clean technologies, pollution, release
of toxic substances, and sustainability. SOC refers to social screens, which consider community development,
employee diversity, equal employment opportunities, racial/gender diversity in company boards, human rights and
labor relations. GOV refers to governance screens, which consider board of director related issues (such as
independence of directors), executive compensation and other general corporate governance provisions. Positive
Screens (POS) over-weight stocks which perform well on certain attributes and place lesser or no weight on those
that perform poorly on those attributes. Negative (NEG) Screens only restrict investments in firms that perform
poorly on certain attributes. ENV_POS, ENV_NEG, SOC_POS, SOC_NEG, GOV_POS and GOV_NEG refer to
environment positive, environment negative, social positive, social negative, governance positive and governance
negative screens, respectively.
Panel A: Screening Foci Combinations
Combination PROD_Any ENV SOC GOV
PROD_Any 209
ENV 131 160
SOC 126 128 140
GOV 83 86 91 97
Panel B: Positive & Negative Screen Combinations
Combination PROD_Any ENV_POS ENV_NEG SOC_POS SOC_NEG GOV_POS GOV_NEG
PROD_Any 209
ENV_POS 106 135
ENV_NEG 25 0 25
SOC_POS 92 106 0 106
SOC_NEG 34 5 17 0 34
GOV_POS 69 83 0 83 0 82
GOV_NEG 14 0 3 0 8 0 14

35
Table 4: Fund Performance
This table presents statistics on SRI fund performance versus matched-conventional funds. Our performance
measures use a monthly time-series of an equally-weighted portfolio of funds (SRI or Conventional or SRI-
Conventional) for the period 2000-2012. SRI funds refer to US domestic equity funds with social responsibility
screens. Conventional funds refer to non-SRI US equity funds that are matched to SRI funds using their investment
objective, age and fund size (i.e. total net assets). For every SRI fund in our sample we locate a sample of three
matched conventional funds for comparison. The performance measures (alphas) are annualized for presentation.
Panel A presents performance measures for the entire period, whereas Panel B measures for Non-Crisis and Crisis
periods. The CAPM Alpha is calculated using the CAPM model. The FF3 Alpha is the alpha calculated based on to
the Fama and French (1993) 3-Factor model, which supplements the CAPM with the size and value factors. The
Carhart 4-Factor Alpha is calculated using the Carhart (1997) 4-Factor model, which supplements the Fama and
French (1993) 3-Factor model with a momentum factor. During the period 2000-2011, we identify two Crisis
periods for the stock market based on the peak and trough for the S&P 500 index: March 2000 to October 2002 and
October 2007 to March 2009. The remaining months are classified as Non-crisis periods. The standard errors are
corrected for auto-correlation using the Newey-West (1987) procedure. The t-statistics are presented in brackets.
The p-values for significance at the 1%, 5% and 10% levels are indicated using the ***, ** and * asterisks notation,
respectively.
Panel A: Returns for SRI & Conventional Funds
Estimate
SRI
Conventional
SRI - Conventional
Average Return
2.56
2.60
-0.04
[0.47]
[0.47]
[-0.13]
CAPM Alpha
-0.37
-0.31
-0.06
[-0.49]
[-0.45]
[-0.16]
FF3 Alpha
-0.76
-0.85
0.09
[-1.06]
[-1.34]
[0.23]
Carhart 4-Factor Alpha
-0.75
-0.86
0.11
[-1.05] [-1.35] [0.31]
Panel B: Returns for SRI & Conventional Funds in Non-Crisis and Crisis Periods
SRI Conventional SRI - Conventional
Estimate
Non-Crisis Crisis
Non-Crisis Crisis
Non-Crisis Crisis
Average Return
15.82*** -18.69**
16.61*** -19.65***
-0.69 1.18
[3.66] [-2.42]
[4.02] [-2.63]
[-1.19] [1.65]
CAPM Alpha
-1.93*** 2.57
-0.99* 0.95
-0.95* 1.61**
[-3.76] [1.59]
[-1.96] [0.77]
[-1.69] [2.03]
FF3 Alpha
-2.07*** 1.81
-1.35*** 0.11
-0.73* 1.70**
[-3.58] [1.34]
[-2.62] [0.09]
[-1.83] [2.38]
Carhart 4-Factor Alpha
-2.04*** 1.79
-1.37*** 0.13
-0.67* 1.66**
[-3.51] [1.32] [-2.71] [0.11] [-1.93] [2.32]

36
Table 5: Factor Loadings for Carhart 4-Factor Model
The table below presents the coefficients estimates for the Carhart (1997) 4-Factor Model (refer Table 4, Panel B)
with separate alphas for the Non-Crisis (NC) and Crisis (C) periods. The alpha estimates are annualized for
presentation. The coefficients , , , and represent loadings on the excess market return (MKT), size factor
(SML), value factor (HML) and momentum factor (WML), respectively. The standard errors are corrected for auto-
correlation using the Newey-West (1987) procedure. The t-statistics are presented in brackets. The p-values for
significance at the 1%, 5% and 10% levels are indicated using the ***, ** and * asterisks notation, respectively.
Alpha MKT SMB HML WML R-sq
Fund Portfolio α (NC) α ( C ) β1 β2 β3 β4 (Adj)
SRI -2.04*** 1.79 0.98*** -0.00 0.06*** -0.02 0.98
[-3.51] [1.32] [60.05] [-0.02] [2.63] [-1.44]
Conventional -1.37*** 0.13 0.97*** 0.04** 0.04 0.01 0.99
[-2.71] [0.11] [67.77] [2.13] [1.56] [1.24]
SRI − Conventional -0.67* 1.66** 0.01 -0.04** 0.02 -0.03*** 0.33
[-1.93] [2.32] [0.98] [-2.01] [1.65] [-2.81]
37
Table 6: Fund Performance & Screening Foci
The table below presents estimates of the annualized alphas calculated by estimating the Carhart (1997) 4-Factor Model over a monthly return time-series of
equally-weighted fund portfolios (SRI or SRI-Conventional) for the period 2000-2012. The alphas presented are for the entire period and are also estimated for
Non-crisis (NC) and Crisis (C) sub-periods. Conventional funds refer to non-SRI US equity funds that are matched to SRI funds using their investment objective,
age and fund size (i.e. total net assets). For every SRI fund in our sample we locate a sample of three matched conventional funds for comparison. Average # of
Funds and Average TNA (Total Net Assets) are calculated as the monthly averages for each SRI fund category. ATG refers to SRI funds implement screens only
for Alcohol, Tobacco or Gambling related products (i.e. no ESG- environment, social or governance screens). PROD_ONLY refers to SRI funds that implement
screens only (i.e. no ESG) for any product screens (namely products related to Alcohol, Tobacco, Gambling, Weapons, Nuclear Technology, Pornography,
Abortion or Animal Testing). PROD_ONLY is a wider classification of pure product related SRI screening funds in comparison to ATG. ESG refers to SRI
funds screen that screen for at least one of the following three screens: (1) Environment (ENV), (2) Social (SOC) or (3) Governance (GOV). ESG can include
funds that screen for product attributes as well (see Table 3). The ENV, SOC & GOV screens are described in detail in the Table 3. Shareholder Advocacy
(SHR_ADV) refers to SRI funds that play an active monitoring role by exercising their voting rights in firms to advance the interest of shareholders.
Faith/Religion based (REL) SRI funds are those that have certain faith (religion) based criteria to satisfy and this often included the product or social screens. The
standard errors are corrected for auto-correlation using the Newey-West (1987) procedure. The t-statistics are presented in brackets. The p-values for significance
at the 1%, 5% and 10% levels are indicated using the ***, ** and * asterisks notation, respectively.
SRI SRI - Conventional
Average
Full
Non-
Full
Non-
Average TNA
Period
Crisis Crisis
Period
Crisis Crisis
Fund Type
# Funds ($ in Millions)
α
α (NC) α ( C )
α
α (NC) α ( C )
Only ATG Screens [ATG_ONLY]
28 3430
-0.83
-1.29** 0.06
-0.01
0.26 -0.54
28 3430
[-1.40]
[-2.12] [0.06]
[-0.04]
[0.93] [-0.64]
Only Product Screens [PROD_ONLY]
30 3692
-0.67
-1.11* 0.17
0.15
0.41 -0.35
30 3692
[-1.13]
[-1.86] [0.16]
[0.47]
[1.43] [-0.42]
Any ESG Screens [ESG]
89 13662
-0.80
-2.36*** 2.23
0.06
-1.03** 2.18**
89 13662
[-1.02]
[-3.96] [1.49]
[0.13]
[-2.39] [2.50]
Environmental Screens [ENV]
82 13409
-0.89
-2.51*** 2.26
-0.04
-1.20*** 2.21**
82 13409
[-1.10]
[-4.24] [1.49]
[-0.08]
[-2.83] [2.33]
Social Screens [SOC]
75 12740
-0.70
-2.15*** 2.10
0.14
-0.78 1.91**
75 12740
[-0.83]
[-3.05] [1.42]
[0.28]
[-1.54] [2.01]
Governance Screens [GOV]
52 6838
-0.47
-2.02*** 2.54*
0.72
-0.44 2.99***
52 6838
[-0.57]
[-2.77] [1.93]
[1.11]
[-0.76] [2.77]
Shareholder Advocacy [SHR_ADV]
34 3076
-0.98
-2.55*** 2.06
0.09
-0.86 1.94**
34 3076
[-1.07]
[-2.77] [1.53]
[0.16]
[-1.45] [2.07]
Faith/Religion Based [REL]
32 3559
-0.72
-1.04 -0.11
0.19
0.56* -0.54
32 3559 [-1.21] [-1.49] [-0.12] [0.58] [1.73] [-0.88]

38
Table 7: Fund Performance & Screening Strategies
Similar to the methodology outline in Table 6, this table presents estimates of the annualized Carhart (1997) 4-Factor alphas. This table investigates the
differences between positive and negative screening strategies used by SRI funds. Positive Screens (POS) over-weight stocks which perform well on certain
attributes and place lesser or no weight on those that perform poorly on those attributes. Negative (NEG) Screens only restrict investments in firms that perform
poorly on certain attributes. ESG refers to SRI funds screen that screen for at least one of the following three screens: (1) Environment (ENV), (2) Social (SOC)
or (3) Governance (GOV).ESG can include funds that screen for product attributes as well (see Table 3). The ENV, SOC & GOV screens are described in detail
in the Table 3. ESG_POS, ESG_NEG, ENV_POS, ENV_NEG, SOC_POS, SOC_NEG, GOV_POS and GOV_NEG refer to ESG positive, ESG negative,
environment positive, environment negative, social positive, social negative, governance positive and governance negative screens, respectively. The standard
errors are corrected for auto-correlation using the Newey-West (1987) procedure. The t-statistics are presented in brackets. The p-values for significance at the
1%, 5% and 10% levels are indicated using the ***, ** and * asterisks notation, respectively.
SRI SRI – Conventional
Average
Full
Non-
Full
Non-
Average Assets
Period
Crisis Crisis
Period
Crisis Crisis
Fund Type
# Funds ($ in Millions)
Α
α (NC) α ( C )
α
α (NC) α ( C )
Any ESG Positive Screening [ESG_POS]
69 12545
-0.77
-2.78*** 3.11**
-0.03
-1.49*** 2.80**
69 12545
[-0.89]
[-4.77] [1.99]
[-0.05]
[-2.98] [2.58]
Any ESG Negative Screening [ESG_NEG]
21 1117
-0.60
-0.88 -0.06
0.58
0.59 0.57
21 1117
[-0.70]
[-1.09] [-0.03]
[1.12]
[1.00] [0.61]
Environmental Positive Screen [ENV_POS]
72 12806
-0.83
-2.65*** 2.70*
-0.11
-1.33*** 2.25**
72 12806
[-0.95]
[-4.74] [1.67]
[-0.21]
[-3.03] [2.14]
Environmental Negative Screen [ENV_NEG]
10 604
-1.10
-1.54 -0.25
0.34
-0.15 1.29
10 604
[-1.06]
[-1.15] [-0.16]
[0.35]
[-0.12] [0.96]
Social Positive Screen [SOC_POS]
60 11728
-0.72
-2.49*** 2.72*
0.29
-1.00* 2.79**
60 11728
[-0.84]
[-3.59] [1.81]
[0.50]
[-1.84] [2.50]
Social Negative Screen [SOC_NEG]
16 1012
-0.56
-0.80 -0.09
-0.25
0.15 -1.02
16 1012
[-0.52]
[-0.93] [-0.04]
[-0.46]
[0.25] [-1.18]
Governance Positive Screen [GOV_POS]
47 6738
-0.47
-2.24*** 2.96**
0.81
-0.62 3.57***
47 6738
[-0.53]
[-3.17] [2.15]
[1.11]
[-1.13] [3.00]
Governance Positive Screen [GOV_NEG]
5 99
-0.21
-0.07 -0.47
0.26
1.12 -1.39
5 99 [-0.22] [-0.06] [-0.29] [0.30] [1.02] [-0.85]

39
Table 8: Vice vs. Non-Vice Funds
Similar to the methodology outline in Table 6, this table presents estimates of the annualized Carhart (1997) 4-
Factor alphas. This table compares the performance of funds that intentionally exclude vice stocks (NO_VICE) to a
fund that invests only in vice stocks (VICEX). Vices here specifically refer to only to common sin attributes that are
alcohol, tobacco, gambling or weapons. Since the VICEX fund came into inception only August 2002, in this table
we analyze returns starting in September 2002 till the end of sample period (i.e. December 2011). Average # of
Funds and Average TNA (Total Net Assets) are calculated as the monthly averages for each SRI fund category. The
standard errors are corrected for auto-correlation using the Newey-West (1987) procedure. The t-statistics are
presented in brackets. The p-values for significance at the 1%, 5% and 10% levels are indicated using the ***, **
and * asterisks notation, respectively.
Average Full Non-
Average TNA
Period
Crisis Crisis
Fund Type
# of Funds ($ in millions)
α
α (NC) α ( C )
Vice Screened Funds [NO_VICE]
60 8604
-1.70***
-2.26*** 0.54
60 8604
[-3.70]
[-3.89] [0.44]
Vice Investor Fund [VICEX]
1 65
2.01
5.81*** -14.36***
1 65
[0.75]
[2.84] [-4.21]
NO_VICE – VICEX
-3.74
-8.06*** 14.88***
[-1.28] [-3.64] [3.62]
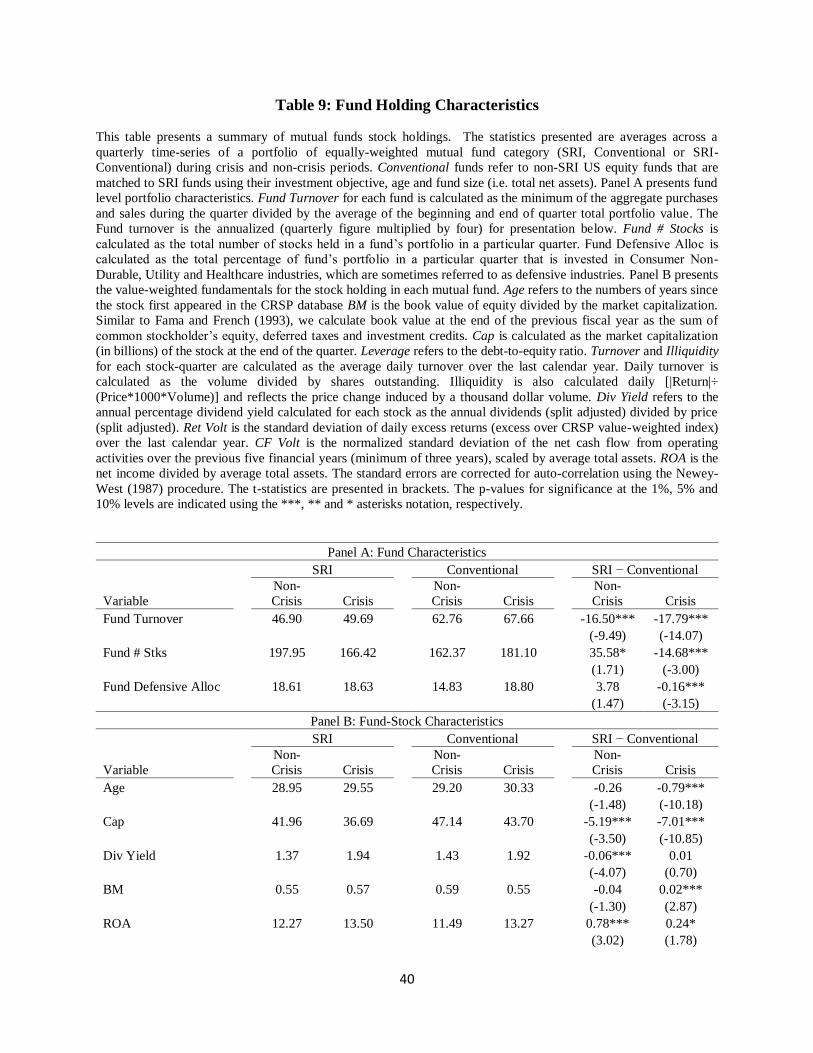
40
Table 9: Fund Holding Characteristics
This table presents a summary of mutual funds stock holdings. The statistics presented are averages across a
quarterly time-series of a portfolio of equally-weighted mutual fund category (SRI, Conventional or SRI-
Conventional) during crisis and non-crisis periods. Conventional funds refer to non-SRI US equity funds that are
matched to SRI funds using their investment objective, age and fund size (i.e. total net assets). Panel A presents fund
level portfolio characteristics. Fund Turnover for each fund is calculated as the minimum of the aggregate purchases
and sales during the quarter divided by the average of the beginning and end of quarter total portfolio value. The
Fund turnover is the annualized (quarterly figure multiplied by four) for presentation below. Fund # Stocks is
calculated as the total number of stocks held in a fund’s portfolio in a particular quarter. Fund Defensive Alloc is
calculated as the total percentage of fund’s portfolio in a particular quarter that is invested in Consumer Non-
Durable, Utility and Healthcare industries, which are sometimes referred to as defensive industries. Panel B presents
the value-weighted fundamentals for the stock holding in each mutual fund. Age refers to the numbers of years since
the stock first appeared in the CRSP database BM is the book value of equity divided by the market capitalization.
Similar to Fama and French (1993), we calculate book value at the end of the previous fiscal year as the sum of
common stockholder’s equity, deferred taxes and investment credits. Cap is calculated as the market capitalization
(in billions) of the stock at the end of the quarter. Leverage refers to the debt-to-equity ratio. Turnover and Illiquidity
for each stock-quarter are calculated as the average daily turnover over the last calendar year. Daily turnover is
calculated as the volume divided by shares outstanding. Illiquidity is also calculated daily [|Return|÷
(Price*1000*Volume)] and reflects the price change induced by a thousand dollar volume. Div Yield refers to the
annual percentage dividend yield calculated for each stock as the annual dividends (split adjusted) divided by price
(split adjusted). Ret Volt is the standard deviation of daily excess returns (excess over CRSP value-weighted index)
over the last calendar year. CF Volt is the normalized standard deviation of the net cash flow from operating
activities over the previous five financial years (minimum of three years), scaled by average total assets. ROA is the
net income divided by average total assets. The standard errors are corrected for auto-correlation using the Newey-
West (1987) procedure. The t-statistics are presented in brackets. The p-values for significance at the 1%, 5% and
10% levels are indicated using the ***, ** and * asterisks notation, respectively.
Panel A: Fund Characteristics
SRI Conventional SRI − Conventional
Variable
Non-
Crisis Crisis
Non-
Crisis Crisis
Non-
Crisis Crisis
Fund Turnover
46.90 49.69
62.76 67.66
-16.50*** -17.79***
(-9.49) (-14.07)
Fund # Stks
197.95 166.42
162.37 181.10
35.58* -14.68***
(1.71) (-3.00)
Fund Defensive Alloc
18.61 18.63
14.83 18.80
3.78 -0.16***
(1.47) (-3.15)
Panel B: Fund-Stock Characteristics
SRI Conventional SRI − Conventional
Variable
Non-
Crisis Crisis
Non-
Crisis Crisis
Non-
Crisis Crisis
Age
28.95 29.55
29.20 30.33
-0.26 -0.79***
(-1.48) (-10.18)
Cap
41.96 36.69
47.14 43.70
-5.19*** -7.01***
(-3.50) (-10.85)
Div Yield
1.37 1.94
1.43 1.92
-0.06*** 0.01
(-4.07) (0.70)
BM
0.55 0.57
0.59 0.55
-0.04 0.02***
(-1.30) (2.87)
ROA
12.27 13.50
11.49 13.27
0.78*** 0.24*
(3.02) (1.78)

41
Leverage
1.05 0.81
1.87 0.99
-0.82 -0.18*
(-1.46) (-1.83)
Turnover
0.96 1.27
1.04 1.36
-0.08*** -0.09***
(-5.34) (-5.84)
Illiquidity
0.72 0.52
0.58 0.43
0.14 0.09
(0.55) (1.12)
Ret Volt
1.69 2.16
1.73 2.20
-0.04*** -0.04***
(-4.39) (-8.97)
CF Volt
0.04 0.04
0.04 0.04
-0.00 -0.00***
(-1.46) (-12.18)
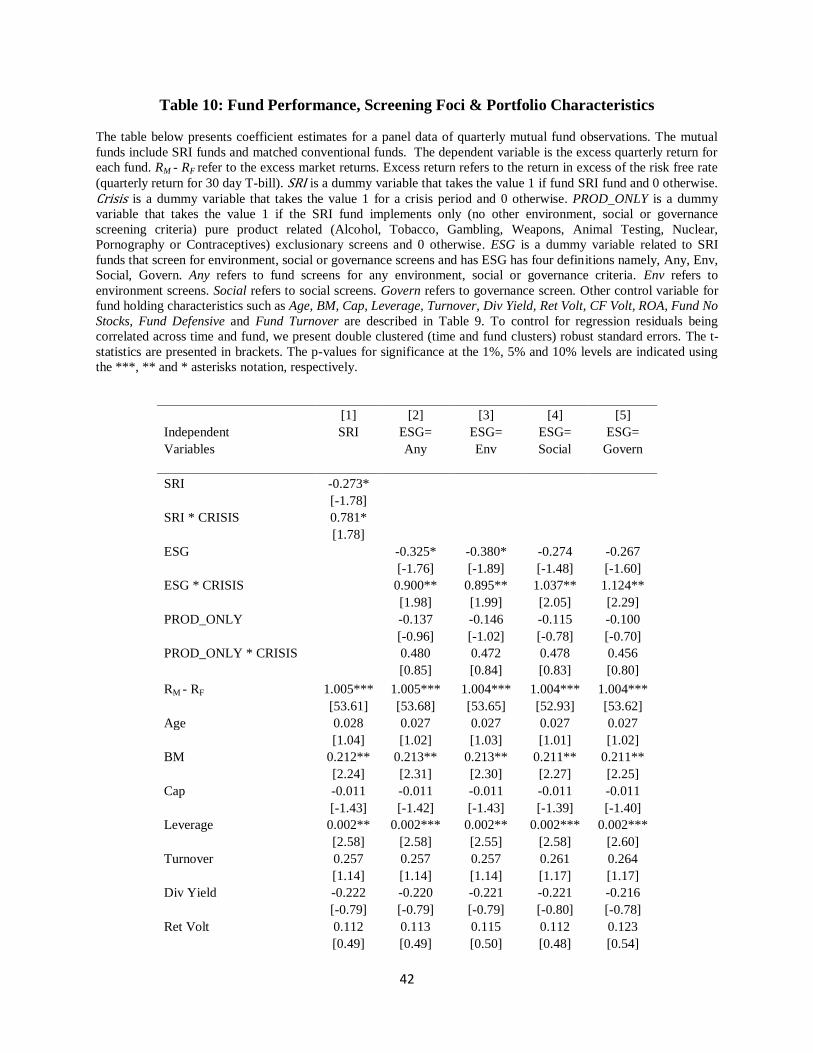
42
Table 10: Fund Performance, Screening Foci & Portfolio Characteristics
The table below presents coefficient estimates for a panel data of quarterly mutual fund observations. The mutual
funds include SRI funds and matched conventional funds. The dependent variable is the excess quarterly return for
each fund. RM - RF refer to the excess market returns. Excess return refers to the return in excess of the risk free rate
(quarterly return for 30 day T-bill). SRI is a dummy variable that takes the value 1 if fund SRI fund and 0 otherwise.
Crisis is a dummy variable that takes the value 1 for a crisis period and 0 otherwise. PROD_ONLY is a dummy
variable that takes the value 1 if the SRI fund implements only (no other environment, social or governance
screening criteria) pure product related (Alcohol, Tobacco, Gambling, Weapons, Animal Testing, Nuclear,
Pornography or Contraceptives) exclusionary screens and 0 otherwise. ESG is a dummy variable related to SRI
funds that screen for environment, social or governance screens and has ESG has four definitions namely, Any, Env,
Social, Govern. Any refers to fund screens for any environment, social or governance criteria. Env refers to
environment screens. Social refers to social screens. Govern refers to governance screen. Other control variable for
fund holding characteristics such as Age, BM, Cap, Leverage, Turnover, Div Yield, Ret Volt, CF Volt, ROA, Fund No
Stocks, Fund Defensive and Fund Turnover are described in Table 9. To control for regression residuals being
correlated across time and fund, we present double clustered (time and fund clusters) robust standard errors. The t-
statistics are presented in brackets. The p-values for significance at the 1%, 5% and 10% levels are indicated using
the ***, ** and * asterisks notation, respectively.
[1] [2] [3] [4] [5]
Independent SRI ESG= ESG= ESG= ESG=
Variables
Any Env Social Govern
SRI -0.273*
[-1.78]
SRI * CRISIS 0.781*
[1.78]
ESG
-0.325* -0.380* -0.274 -0.267
[-1.76] [-1.89] [-1.48] [-1.60]
ESG * CRISIS
0.900** 0.895** 1.037** 1.124**
[1.98] [1.99] [2.05] [2.29]
PROD_ONLY
-0.137 -0.146 -0.115 -0.100
[-0.96] [-1.02] [-0.78] [-0.70]
PROD_ONLY * CRISIS
0.480 0.472 0.478 0.456
[0.85] [0.84] [0.83] [0.80]
RM - RF 1.005*** 1.005*** 1.004*** 1.004*** 1.004***
[53.61] [53.68] [53.65] [52.93] [53.62]
Age 0.028 0.027 0.027 0.027 0.027
[1.04] [1.02] [1.03] [1.01] [1.02]
BM 0.212** 0.213** 0.213** 0.211** 0.211**
[2.24] [2.31] [2.30] [2.27] [2.25]
Cap -0.011 -0.011 -0.011 -0.011 -0.011
[-1.43] [-1.42] [-1.43] [-1.39] [-1.40]
Leverage 0.002** 0.002*** 0.002** 0.002*** 0.002***
[2.58] [2.58] [2.55] [2.58] [2.60]
Turnover 0.257 0.257 0.257 0.261 0.264
[1.14] [1.14] [1.14] [1.17] [1.17]
Div Yield -0.222 -0.220 -0.221 -0.221 -0.216
[-0.79] [-0.79] [-0.79] [-0.80] [-0.78]
Ret Volt 0.112 0.113 0.115 0.112 0.123
[0.49] [0.49] [0.50] [0.48] [0.54]
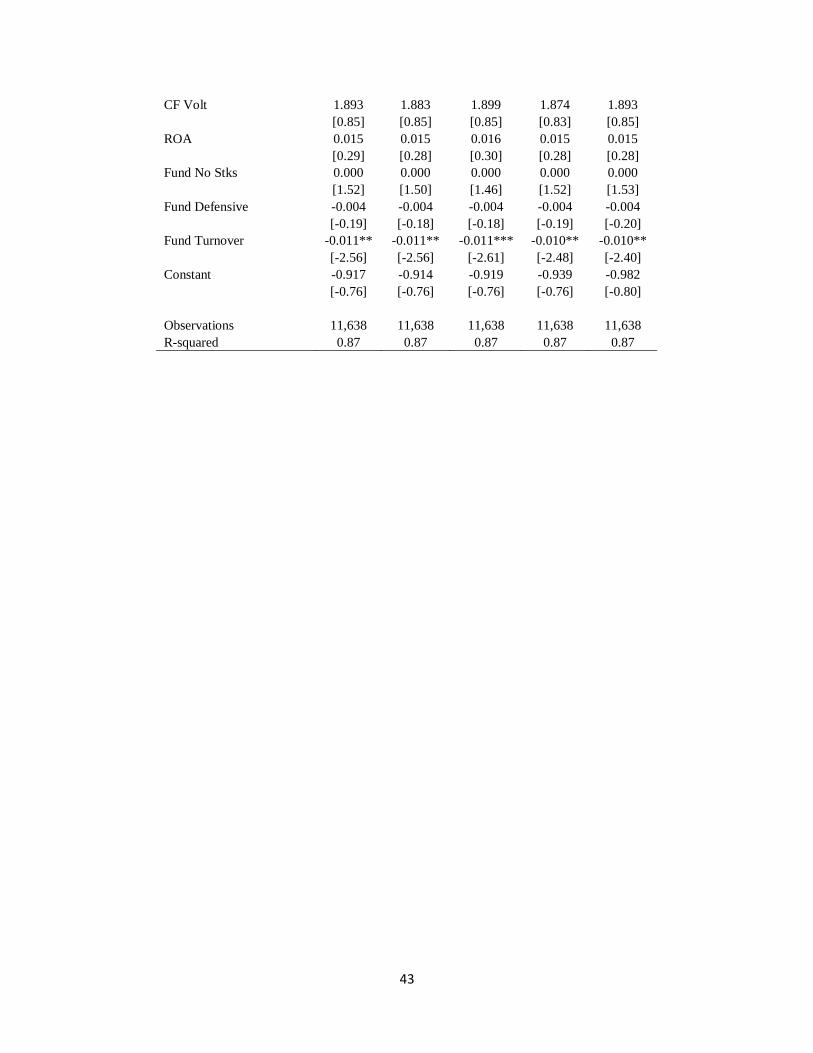
43
CF Volt 1.893 1.883 1.899 1.874 1.893
[0.85] [0.85] [0.85] [0.83] [0.85]
ROA 0.015 0.015 0.016 0.015 0.015
[0.29] [0.28] [0.30] [0.28] [0.28]
Fund No Stks 0.000 0.000 0.000 0.000 0.000
[1.52] [1.50] [1.46] [1.52] [1.53]
Fund Defensive -0.004 -0.004 -0.004 -0.004 -0.004
[-0.19] [-0.18] [-0.18] [-0.19] [-0.20]
Fund Turnover -0.011** -0.011** -0.011*** -0.010** -0.010**
[-2.56] [-2.56] [-2.61] [-2.48] [-2.40]
Constant -0.917 -0.914 -0.919 -0.939 -0.982
[-0.76] [-0.76] [-0.76] [-0.76] [-0.80]
Observations 11,638 11,638 11,638 11,638 11,638
R-squared 0.87 0.87 0.87 0.87 0.87

44
Table 11: Fund Performance, Screening Strategies & Portfolio Characteristics
Similar to the Table 10, this table coefficient estimates for a panel data of quarterly mutual fund observations. The
mutual funds include SRI funds and matched conventional funds. The dependent variable is the excess quarterly
return for each fund. RM - RF refer to the excess market returns. Crisis is a dummy variable that takes the value 1 for
a crisis period and 0 otherwise. PROD_ONLY is a dummy variable that takes the value 1 if the SRI fund implements
only (no other environment, social or governance screening criteria) pure product related (Alcohol, Tobacco,
Gambling, Weapons, Animal Testing, Nuclear, Pornography or Contraceptives) exclusionary screens and 0
otherwise. POSITIVE_ESG is a dummy variable related to SRI funds that have positive screening strategies for
environment, social or governance foci (ESG). Positive Screens over-weight stocks which perform well on certain
attributes and place lesser or no weight on those that perform poorly on those attributes. NEGATIVE_ESG is a
dummy variable related to SRI funds that have negative screening strategies for environment, social or governance
foci (ESG). Negative Screens only restrict investments in firms that perform poorly on certain attributes. ESG has
four definitions namely, Any, Env, Social, Govern. ESG_Any refers to fund screens for any environment, social or
governance criteria. Env refers to environment screens. Social refers to social screens. Govern refers to governance
screen. The regression coefficients for our control variables are suppressed to conserve space as they are similar to
the ones observed in Table 10. Refer to table 10 for a description of control variables, RM - RF, Age, BM, Cap,
Leverage, Turnover, Div Yield, Ret Volt, CF Volt, ROA, Fund No Stocks, Fund Defensive and Fund Turnover. To
control for regression residuals being correlated across time and fund, we present double clustered (time and fund
clusters) robust standard errors. The t-statistics are presented in brackets. The p-values for significance at the 1%,
5% and 10% levels are indicated using the ***, ** and * asterisks notation, respectively.
[1] [2] [3] [4]
Independent ESG= ESG= ESG= ESG=
Variables Any Env Social Govern
POSITIVE_ESG -0.324* -0.394* -0.357* -0.359*
[-1.82] [-1.84] [-1.71] [-1.94]
POSITIVE_ESG * CRISIS 1.150** 0.936* 1.186** 1.161**
[2.26] [1.94] [2.12] [2.29]
NEGATIVE_ESG 0.005 -0.029 -0.252 -0.287
[0.03] [-0.16] [-0.88] [-1.11]
NEGATIVE_ESG * CRISIS 0.727 0.741 0.163 0.554
[1.53] [1.53] [0.18] [0.78]
PROD_ONLY -0.108 -0.110 0.117 0.150
[-0.56] [-0.57] [0.39] [0.56]
PROD_ONLY * CRISIS -0.260 -0.258 0.312 -0.077
[-0.48] [-0.47] [0.25] [-0.08]
Intercept & Other Variables Suppressed
Observations 11,638 11,638 11,638 11,638
R-squared 0.87 0.87 0.87 0.87