Embed Size (px)
Citation preview
27
Pakistan Economic and Social Review Volume 45, No. 1 (Summer 2007), pp. 27-54
SOCIAL SECTOR EXPENDITURES AND OUTCOMES A Case Study of the Punjab in the 1990s
NINA GERA*
Abstract. Overall, Punjab’s performance is better than that of the country as a whole. For one, Punjab’s population growth rate, a vital determinant of quality of life and well being, has remained lower than Pakistan’s population growth rate, while the economic growth rate has remained higher. In this article we will analyze social sector expenditures in terms of education and health and their outcomes on poverty levels and economic indicators for the Punjab. In the main, the poor social sector indicators it was found are due to inadequate spending on the social sectors and inefficiencies in implementation.
I. INTRODUCTION Despite the Punjab’s better performance as compared to the country as a whole, the incidence of poverty is still high and inequality is the highest in the entire country. In this paper we examine whether overall social sector expenditures determine the poverty status of the people. Are the province’s abysmal social indicators a result of low spending on the social sector and inefficiencies in the use of these limited resources?
There are no studies for Pakistan/Punjab that tests the relationship of social sector expenditures and poverty. The poverty reduction paradigm of 1990 put forward by the World Bank stressed growth, social sector
*The author is Assistant Professor at Department of Economics, Lahore School of
Economics, Lahore (Pakistan). (E-mail: [email protected]). The author wishes to thank Dr. Sohail J. Malik, Chairman, Innovative Development
Strategies, Islamabad, for his help and guidance. The author also wishes to thank the anonymous referee of the article for his valuable comments.
28 Pakistan Economic and Social Review
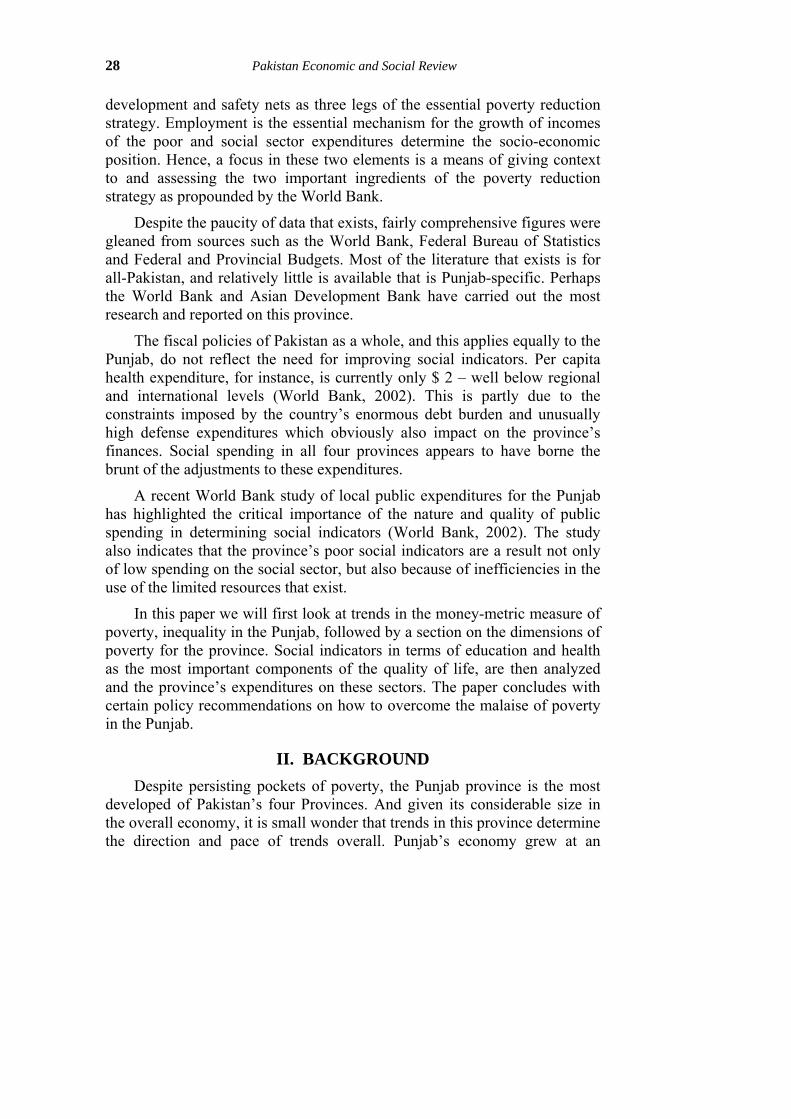
development and safety nets as three legs of the essential poverty reduction strategy. Employment is the essential mechanism for the growth of incomes of the poor and social sector expenditures determine the socio-economic position. Hence, a focus in these two elements is a means of giving context to and assessing the two important ingredients of the poverty reduction strategy as propounded by the World Bank.
Despite the paucity of data that exists, fairly comprehensive figures were gleaned from sources such as the World Bank, Federal Bureau of Statistics and Federal and Provincial Budgets. Most of the literature that exists is for all-Pakistan, and relatively little is available that is Punjab-specific. Perhaps the World Bank and Asian Development Bank have carried out the most research and reported on this province.
The fiscal policies of Pakistan as a whole, and this applies equally to the Punjab, do not reflect the need for improving social indicators. Per capita health expenditure, for instance, is currently only $ 2 – well below regional and international levels (World Bank, 2002). This is partly due to the constraints imposed by the country’s enormous debt burden and unusually high defense expenditures which obviously also impact on the province’s finances. Social spending in all four provinces appears to have borne the brunt of the adjustments to these expenditures.
A recent World Bank study of local public expenditures for the Punjab has highlighted the critical importance of the nature and quality of public spending in determining social indicators (World Bank, 2002). The study also indicates that the province’s poor social indicators are a result not only of low spending on the social sector, but also because of inefficiencies in the use of the limited resources that exist.
In this paper we will first look at trends in the money-metric measure of poverty, inequality in the Punjab, followed by a section on the dimensions of poverty for the province. Social indicators in terms of education and health as the most important components of the quality of life, are then analyzed and the province’s expenditures on these sectors. The paper concludes with certain policy recommendations on how to overcome the malaise of poverty in the Punjab.
II. BACKGROUND Despite persisting pockets of poverty, the Punjab province is the most developed of Pakistan’s four Provinces. And given its considerable size in the overall economy, it is small wonder that trends in this province determine the direction and pace of trends overall. Punjab’s economy grew at an
GERA: Social Sector Expenditures and Outcomes 29
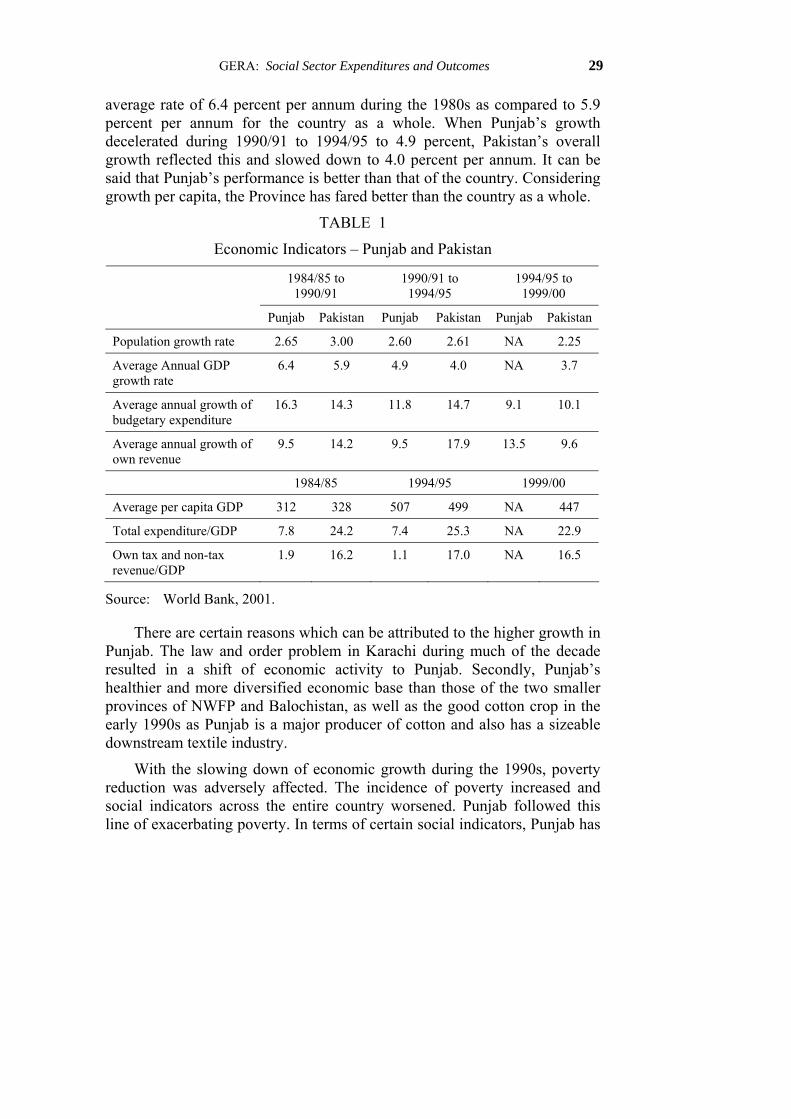
average rate of 6.4 percent per annum during the 1980s as compared to 5.9 percent per annum for the country as a whole. When Punjab’s growth decelerated during 1990/91 to 1994/95 to 4.9 percent, Pakistan’s overall growth reflected this and slowed down to 4.0 percent per annum. It can be said that Punjab’s performance is better than that of the country. Considering growth per capita, the Province has fared better than the country as a whole.
TABLE 1
Economic Indicators – Punjab and Pakistan
1984/85 to 1990/91
1990/91 to 1994/95
1994/95 to 1999/00
Punjab Pakistan Punjab Pakistan Punjab Pakistan
Population growth rate 2.65 3.00 2.60 2.61 NA 2.25
Average Annual GDP growth rate
6.4 5.9 4.9 4.0 NA 3.7
Average annual growth of budgetary expenditure
16.3 14.3 11.8 14.7 9.1 10.1
Average annual growth of own revenue
9.5 14.2 9.5 17.9 13.5 9.6
1984/85 1994/95 1999/00
Average per capita GDP 312 328 507 499 NA 447
Total expenditure/GDP 7.8 24.2 7.4 25.3 NA 22.9
Own tax and non-tax revenue/GDP
1.9 16.2 1.1 17.0 NA 16.5
Source: World Bank, 2001.
There are certain reasons which can be attributed to the higher growth in Punjab. The law and order problem in Karachi during much of the decade resulted in a shift of economic activity to Punjab. Secondly, Punjab’s healthier and more diversified economic base than those of the two smaller provinces of NWFP and Balochistan, as well as the good cotton crop in the early 1990s as Punjab is a major producer of cotton and also has a sizeable downstream textile industry.
With the slowing down of economic growth during the 1990s, poverty reduction was adversely affected. The incidence of poverty increased and social indicators across the entire country worsened. Punjab followed this line of exacerbating poverty. In terms of certain social indicators, Punjab has

30 Pakistan Economic and Social Review
fared more poorly than the national averages. For instance, the infant mortality rate at 95 per thousand, is higher than the national average of 89 per thousand. The contraceptive prevalence ratio is lower in this province when compared to the whole of Pakistan. However, gross primary enrolment rate and literacy rates are better in the Punjab than national levels (Malik, 2004).
The available information on poverty in Punjab is succinctly presented below. An aside on the data sources of the tables is worthy of mention here. As the breakdown and categories of the data in the Report on the Punjab prepared by Malik (2004) and used in this analysis (in quintiles) is different from and not consistent with that presented in the Pakistan Social and Living Standards Measurement Survey 2004-05 (PSLM), additional tables have been provided to supplement the analysis. The PSLM is intended to be one of the main mechanisms for monitoring the implementation of the PRSP. It supposedly provides a set of representative, population-based estimates of social indicators and their progress under the PRSP. However, in assessing the quality and worth of the data, it should be kept in mind that the field work for the Survey was carried out between September 2004 and March, 2005, a relatively short period. This leads one to question the validity, representativeness and reliability of the data.
Before attempting to understand and analyze the reasons for the persisting poverty in the province, it would be worthwhile to look at the trends in poverty by province in terms of the money-metric measure.
III. TRENDS IN MONEY-METRIC MEASURE OF POVERTY
Going by the available information on the headcount of poverty based on the Household Income and Expenditure Surveys (HIES) data, poverty in the Punjab increased markedly during the latter part of the 1990s. This increasing trend of poverty in terms of the money-metric measure is applicable both to the urban as well as rural areas. The incidence of poverty however is less than that of NWFP and Balochistan.
On the whole, the overall picture of consumption/income poverty in the Punjab tallies closely with the national picture with a higher concentration of the poor in rural areas. The over 10 percentage point rural-urban gap in headcount rates for Punjab in 1998-99 is in line with the pattern for the country as a whole. In urban areas of the Punjab poverty went up considerably in FY 99. In that year unemployment and under-employment
GERA: Social Sector Expenditures and Outcomes 31
increased and numerous labour intensive sectors such as construction, transport and manufacturing grew sluggishly (Malik, 2004).
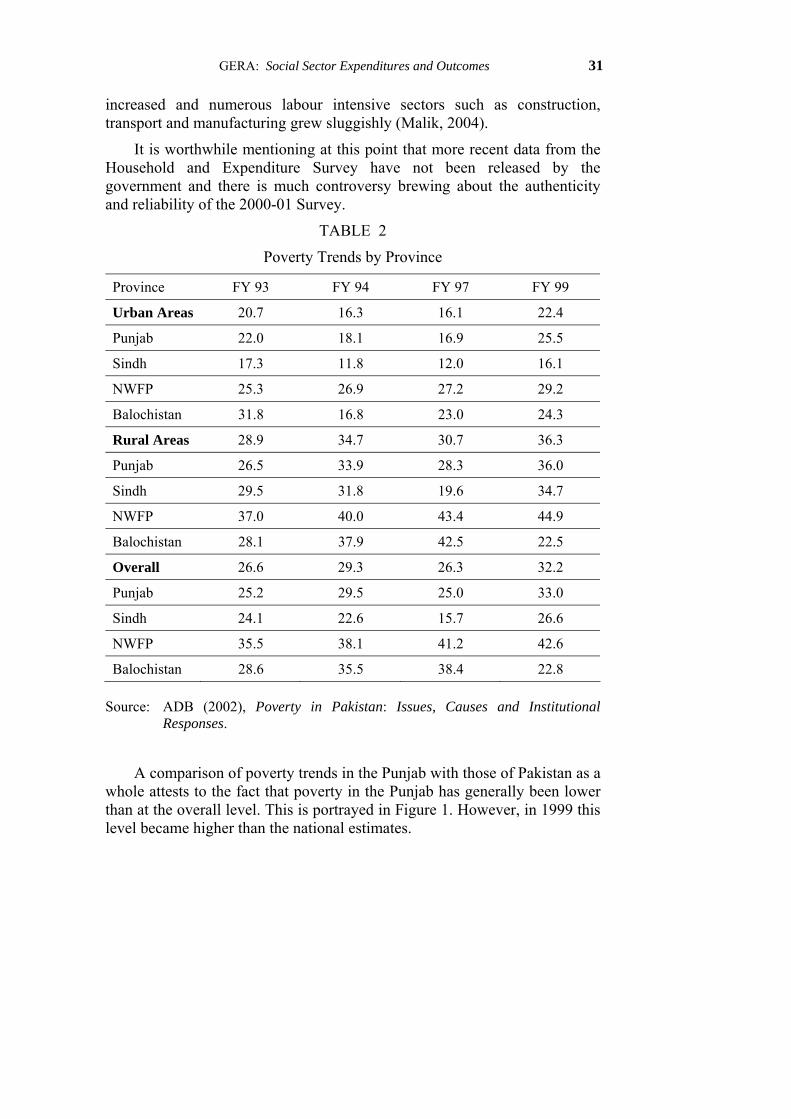
It is worthwhile mentioning at this point that more recent data from the Household and Expenditure Survey have not been released by the government and there is much controversy brewing about the authenticity and reliability of the 2000-01 Survey.
TABLE 2
Poverty Trends by Province
Province FY 93 FY 94 FY 97 FY 99
Urban Areas 20.7 16.3 16.1 22.4
Punjab 22.0 18.1 16.9 25.5
Sindh 17.3 11.8 12.0 16.1
NWFP 25.3 26.9 27.2 29.2
Balochistan 31.8 16.8 23.0 24.3
Rural Areas 28.9 34.7 30.7 36.3
Punjab 26.5 33.9 28.3 36.0
Sindh 29.5 31.8 19.6 34.7
NWFP 37.0 40.0 43.4 44.9
Balochistan 28.1 37.9 42.5 22.5
Overall 26.6 29.3 26.3 32.2
Punjab 25.2 29.5 25.0 33.0
Sindh 24.1 22.6 15.7 26.6
NWFP 35.5 38.1 41.2 42.6
Balochistan 28.6 35.5 38.4 22.8
Source: ADB (2002), Poverty in Pakistan: Issues, Causes and Institutional Responses.
A comparison of poverty trends in the Punjab with those of Pakistan as a whole attests to the fact that poverty in the Punjab has generally been lower than at the overall level. This is portrayed in Figure 1. However, in 1999 this level became higher than the national estimates.

32 Pakistan Economic and Social Review
FIGURE 1
25.2
29.5
25
32.226.629.3
26.3
33
0
5
10
15
20
25
30
35
FY 93 FY 94 FY 97 FY 99
Per
cent
Pop
ulat
ion
Punjab Pakistan
In the Figure 1 above, Series 1 represents the Punjab statistics while Series 2 is for all Pakistan.
TABLE 3
Poverty Headcount, Poverty Gap and Severity of Poverty in Punjab During the 1990s by Region
FY 93 FY 94 FY 97 FY 99 Region P0 P1 P2 P0 P1 P2 P0 P1 P2 P0 P1 P2
Urban areas 21.98 3.92 1.02 18.14 3.39 0.9 16.93 2.68 0.70 25.50 5.29 1.67 North Punjab 9.95 1.36 0.28 9.66 1.57 0.43 13.27 1.70 0.42 12.77 2.17 0.61 Central Punjab 25.61 4.67 1.23 23.71 4.71 1.32 15.87 2.42 0.64 24.50 5.06 1.61 South Punjab 27.97 5.24 1.42 17.81 3.13 0.78 21.70 3.86 1.00 35.33 7.64 2.39 Rural areas 26.45 4.66 1.2 33.85 6.79 2.0 28.28 5.03 1.35 36.00 7.87 2.52 North Punjab 10.49 1.68 0.39 29.27 6.33 2.36 21.44 3.04 0.68 29.31 4.76 1.14 Central Punjab 27.94 4.75 1.21 31.60 6.08 1.69 26.17 4.71 1.26 34.52 7.50 2.36 South Punjab 33.24 6.46 1.84 41.08 8.69 2.66 32.87 5.97 1.65 39.74 9.20 3.11 Overall 25.3 4.46 1.17 29.51 5.85 1.71 25.03 4.35 1.17 32.97 7.13 2.27 North Punjab 10.28 1.55 0.34 19.14 3.87 1.37 19.04 2.65 0.60 24.38 3.99 0.98 Central Punjab 27.45 4.74 1.21 29.93 5.79 1.61 22.63 3.92 1.05 30.99 6.64 2.09 South Punjab 31.57 6.07 1.71 34.59 7.14 2.13 30.73 5.57 1.53 38.93 8.92 2.98
Source: Government of Pakistan, Pakistan Economic Survey, Various issues. Finance Division, Economic Advisor’s Wing, Islamabad.
Note: P0: Poverty headcount; P1: Poverty gap; P2: Severity of poverty
GERA: Social Sector Expenditures and Outcomes 33
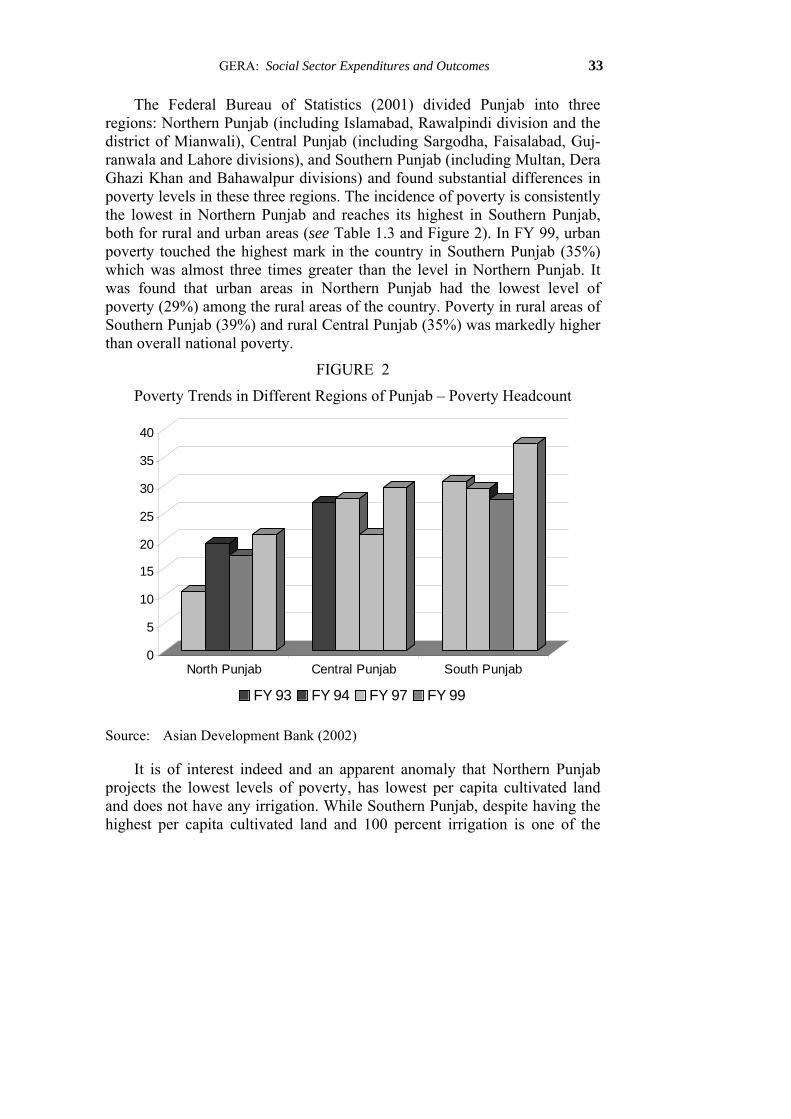
The Federal Bureau of Statistics (2001) divided Punjab into three regions: Northern Punjab (including Islamabad, Rawalpindi division and the district of Mianwali), Central Punjab (including Sargodha, Faisalabad, Guj-ranwala and Lahore divisions), and Southern Punjab (including Multan, Dera Ghazi Khan and Bahawalpur divisions) and found substantial differences in poverty levels in these three regions. The incidence of poverty is consistently the lowest in Northern Punjab and reaches its highest in Southern Punjab, both for rural and urban areas (see Table 1.3 and Figure 2). In FY 99, urban poverty touched the highest mark in the country in Southern Punjab (35%) which was almost three times greater than the level in Northern Punjab. It was found that urban areas in Northern Punjab had the lowest level of poverty (29%) among the rural areas of the country. Poverty in rural areas of Southern Punjab (39%) and rural Central Punjab (35%) was markedly higher than overall national poverty.
FIGURE 2
Poverty Trends in Different Regions of Punjab – Poverty Headcount
0
5
10
15
20
25
30
35
40
North Punjab Central Punjab South Punjab
FY 93 FY 94 FY 97 FY 99
Source: Asian Development Bank (2002)
It is of interest indeed and an apparent anomaly that Northern Punjab projects the lowest levels of poverty, has lowest per capita cultivated land and does not have any irrigation. While Southern Punjab, despite having the highest per capita cultivated land and 100 percent irrigation is one of the
34 Pakistan Economic and Social Review
poorest regions of the country. One reason for this seeming ‘absurdity’ is that rural areas in Northern Punjab are closely knit with their urban centers and have strong linkages with the services sector. Also the people of the region have for long been employed in the public sector, especially in the armed forces. On the other hand, Southern Punjab is the least urbanized region in the province, and mobility of the people in the quest of employment outside the region or overseas has also been limited. The World Bank (2002) also concluded that the highest incidence of vulnerability, chronic and transient poverty is in the southern irrigated plains of Punjab and Sindh, and the lowest in the northern irrigated regions of the Punjab.
Across rural-urban areas, Table 3 shows that the incidence of poverty in the urban areas of southern Punjab has gone up from 21.7 percent to 35.3 percent during FY97-FY99. The major reason for this hike is the badly affected cotton-based manufacturing industries in the region. According to an estimate, the cotton production in Multan Division in FY 98 was only 64 percent of FY96 levels. Added to this was the decline in job opportunities and increasing incidence of unemployment in urban areas, a considerable decline in domestic remittances exacerbating the situation further.
In rural areas, the incidence of poverty is closely tied in with shocks in agriculture. For instance, the agricultural sector witnessed a negative growth rate (–5.29%) in 1992-93 and considerably low growth in 1996-97 (0.12%) and 1998-99 (1.95%). The fundamental reason for this slow growth was the fall in the production of major crops, especially the production of cotton which declined to 1368 tons in 1993-94 from 2181 thousand tons the previous year. The years 1996-97 and 1998-99 also saw a fall in cotton production. A similar trend of poverty incidence can be seen in all the three regions of the Punjab in Table 3.
IV. INEQUALITY IN PUNJAB The 1990s show an increase in inequality with the highest Gini coefficient in 1998-99. It is in the Punjab that inequality is the highest as compared to the other provinces. This applies both to urban and rural sectors. Table 4 below shows the available estimates of the Gini coefficient (expressed as a percent) of consumption expenditures. Table 4 indicates that inequality is higher in Punjab and Sindh relative to NWFP and Balochistan. In the Punjab, inequality in urban areas is far greater than in rural areas. The Gini coefficient for urban Punjab is around 12 percent higher than rural Punjab.
GERA: Social Sector Expenditures and Outcomes 35
TABLE 4
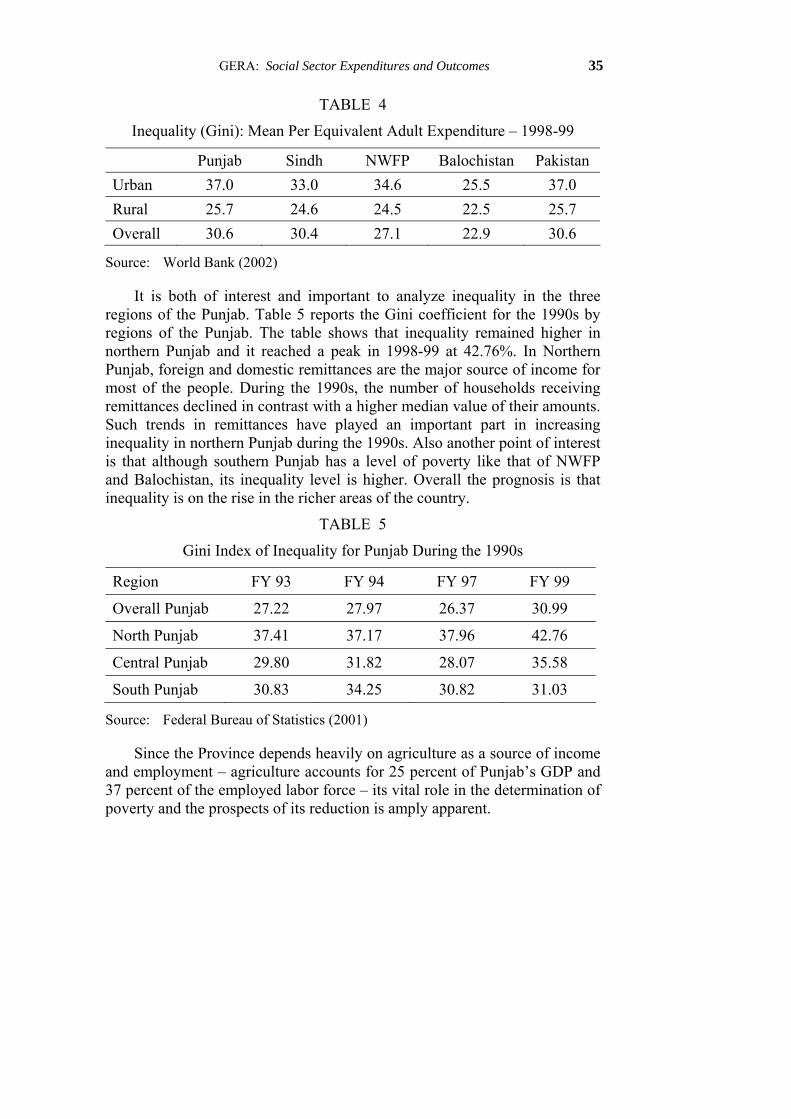
Inequality (Gini): Mean Per Equivalent Adult Expenditure – 1998-99
Punjab Sindh NWFP Balochistan Pakistan Urban 37.0 33.0 34.6 25.5 37.0 Rural 25.7 24.6 24.5 22.5 25.7 Overall 30.6 30.4 27.1 22.9 30.6
Source: World Bank (2002)
It is both of interest and important to analyze inequality in the three regions of the Punjab. Table 5 reports the Gini coefficient for the 1990s by regions of the Punjab. The table shows that inequality remained higher in northern Punjab and it reached a peak in 1998-99 at 42.76%. In Northern Punjab, foreign and domestic remittances are the major source of income for most of the people. During the 1990s, the number of households receiving remittances declined in contrast with a higher median value of their amounts. Such trends in remittances have played an important part in increasing inequality in northern Punjab during the 1990s. Also another point of interest is that although southern Punjab has a level of poverty like that of NWFP and Balochistan, its inequality level is higher. Overall the prognosis is that inequality is on the rise in the richer areas of the country.
TABLE 5
Gini Index of Inequality for Punjab During the 1990s
Region FY 93 FY 94 FY 97 FY 99
Overall Punjab 27.22 27.97 26.37 30.99
North Punjab 37.41 37.17 37.96 42.76
Central Punjab 29.80 31.82 28.07 35.58
South Punjab 30.83 34.25 30.82 31.03
Source: Federal Bureau of Statistics (2001)
Since the Province depends heavily on agriculture as a source of income and employment – agriculture accounts for 25 percent of Punjab’s GDP and 37 percent of the employed labor force – its vital role in the determination of poverty and the prospects of its reduction is amply apparent.
36 Pakistan Economic and Social Review
It is important next, in this context, to give an overview of Punjab’s main dimensions of poverty as a backdrop to assessing the underlying causes.
V. POPULATION GROWTH AND KEY CHARACTERISTICS OF THE PUNJAB
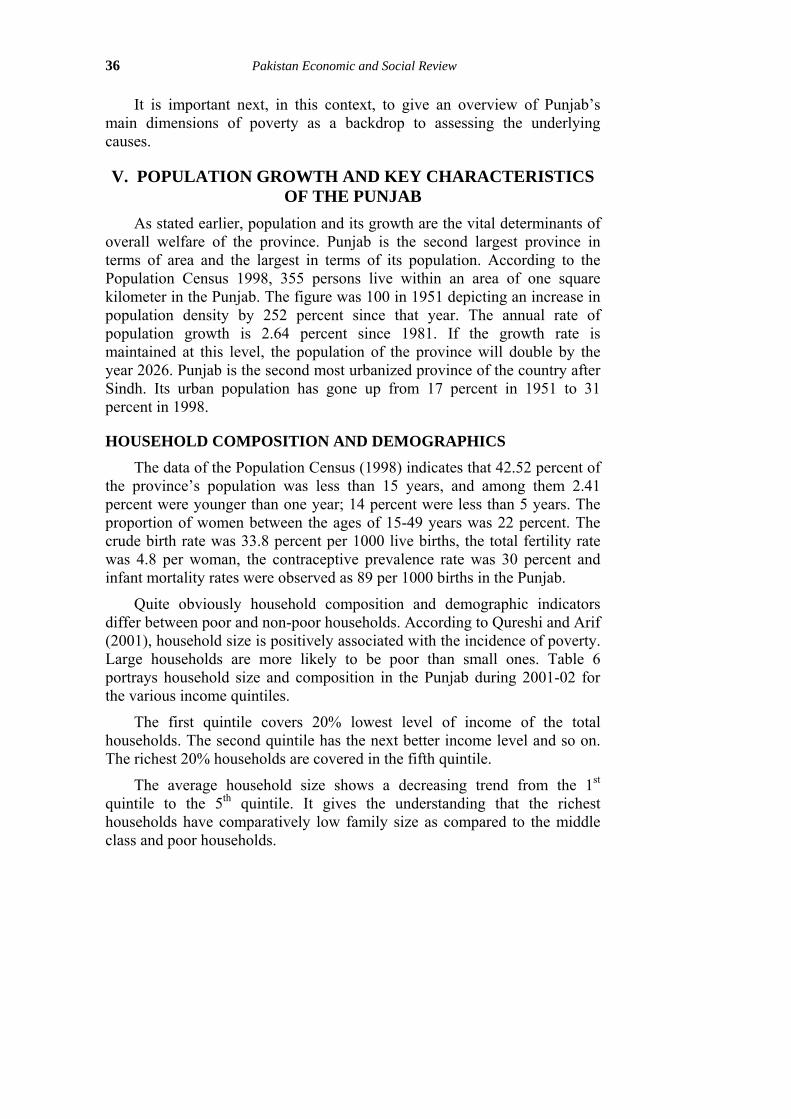
As stated earlier, population and its growth are the vital determinants of overall welfare of the province. Punjab is the second largest province in terms of area and the largest in terms of its population. According to the Population Census 1998, 355 persons live within an area of one square kilometer in the Punjab. The figure was 100 in 1951 depicting an increase in population density by 252 percent since that year. The annual rate of population growth is 2.64 percent since 1981. If the growth rate is maintained at this level, the population of the province will double by the year 2026. Punjab is the second most urbanized province of the country after Sindh. Its urban population has gone up from 17 percent in 1951 to 31 percent in 1998.
HOUSEHOLD COMPOSITION AND DEMOGRAPHICS
The data of the Population Census (1998) indicates that 42.52 percent of the province’s population was less than 15 years, and among them 2.41 percent were younger than one year; 14 percent were less than 5 years. The proportion of women between the ages of 15-49 years was 22 percent. The crude birth rate was 33.8 percent per 1000 live births, the total fertility rate was 4.8 per woman, the contraceptive prevalence rate was 30 percent and infant mortality rates were observed as 89 per 1000 births in the Punjab.
Quite obviously household composition and demographic indicators differ between poor and non-poor households. According to Qureshi and Arif (2001), household size is positively associated with the incidence of poverty. Large households are more likely to be poor than small ones. Table 6 portrays household size and composition in the Punjab during 2001-02 for the various income quintiles.
The first quintile covers 20% lowest level of income of the total households. The second quintile has the next better income level and so on. The richest 20% households are covered in the fifth quintile.
The average household size shows a decreasing trend from the 1st quintile to the 5th quintile. It gives the understanding that the richest households have comparatively low family size as compared to the middle class and poor households.

GERA: Social Sector Expenditures and Outcomes 37
TABLE 6
Average Household Size and its Composition in Punjab by Sex and Quintiles, 2001-02
Punjab Total 1st quintile
2nd quintile
3rd quintile
4th quintile
5th quintile
Household size 100 15.42 16.44 18.22 22.13 27.80
Average number of members per household
6.54 8.12 7.39 6.91 6.11 5.24
Male 3.26 4.06 3.66 3.46 3.08 2.61
Female 3.27 4.06 3.73 3.45 3.04 2.63
Average number of adults (male above 18 years)
1.65 1.74 1.70 1.70 1.65 1.53
Female (above 16 years) 1.84 1.95 1.89 1.92 1.80 1.74
Children 3.05 4.43 3.80 3.29 2.66 1.98
Urban areas – % of households 100 11.38 11.04 15.92 21.71 39.95
Rural areas – % of households 100 17.02 18.59 19.13 22.29 22.97
Source: Government of Pakistan, Pakistan Integrated Household Survey (2001-02)
For further analysis, we see the differences in household size between rural and urban areas. The differences of household size between rural and urban areas are statistically significant. Punjab has shown a slight increase in the household size compared to the year 1998-99.
SOCIAL INDICATORS Income and expenditure indicators of poverty alone do not provide a complete picture of poverty unless they are complemented by non-poverty measures. Some of the latter include gross enrolment ratio, literacy level, health, etc.
Education There is no arguing the fact that the performance of the education sector has remained grossly lacking in Pakistan. There are vast gender and rural urban differences in education. Table 7 below reports the gross primary enrolment rate of the Punjab for the various quintiles for both urban and rural areas.

38 Pakistan Economic and Social Review
TABLE 7
Gross Primary Level Enrolment Rate (Excluding Katchi Class – by Income Group)
Urban Areas Rural Areas Income Group Male Female Both Male Female Both 1st quintile 59 57 58 55 39 47 2nd quintile 94 75 83 68 53 61 3rd quintile 111 94 102 95 61 77 4th quintile 108 109 109 99 80 90 5th quintile 109 120 114 109 88 99
Source: Government of Pakistan Federal Bureau of Statistics, Pakistan Integrated Household Survey, 2001-02
The gross enrolment rate is the number of children attending primary level (Class 1 to 5) divided by number of children aged 5 to 9 multiplied by 100. Gross enrolment rates are lower for the first quintile (that is poor households). The difference is quite substantial between rural and urban areas in the Punjab.
TABLE 8(a)
Gross Enrolment Rate at the Primary Level (Age 5-9 Years) (Excluding Katchi Class)
Gross Primary Level Enrolment Rate 2004-05 Region and Province
Male Female Both
Urban Areas Punjab
107 111
100 108
104 110
Rural Areas Punjab
89 96
68 82
79 89
Overall Punjab
94 100
77 89
86 95
Gross Enrolment Rate: [Number of children attending primary level (classes 1-5) divided by number of children aged 5-9 years] multiplied by 100. Enrolment in katchi is excluded.
Source: Pakistan Social and Living Standards Measurement Survey (2004-05).
GERA: Social Sector Expenditures and Outcomes 39
TABLE 8(b)
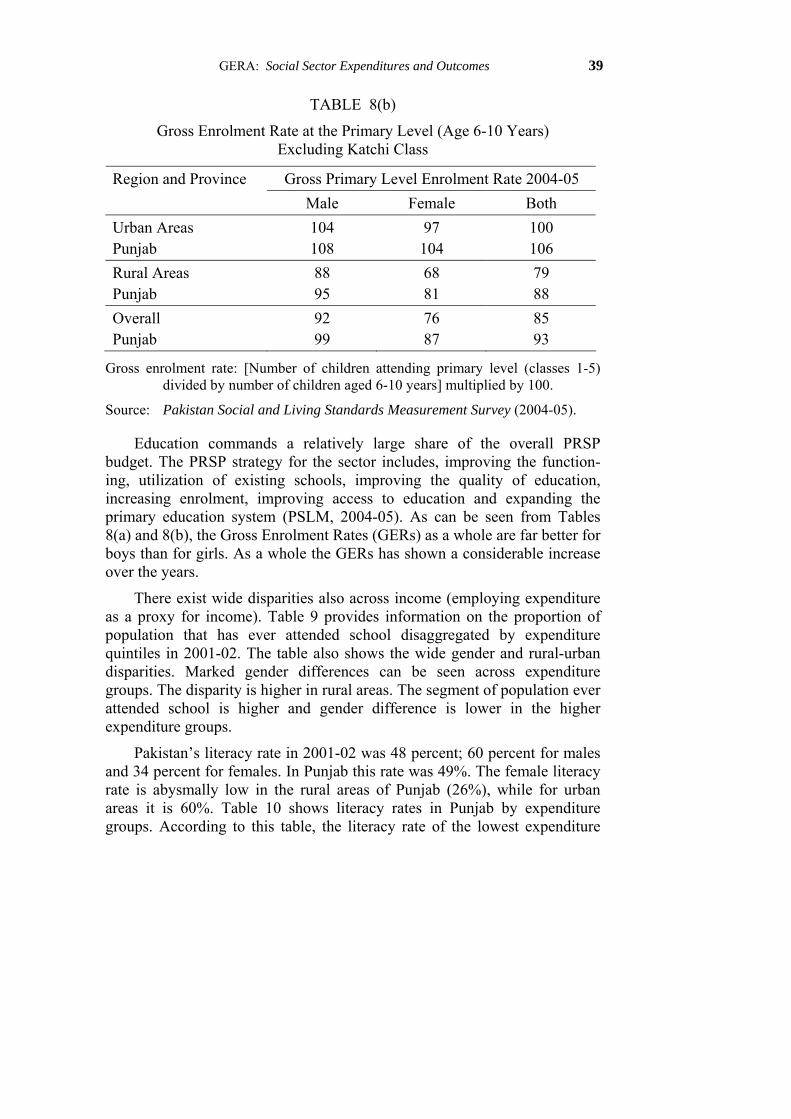
Gross Enrolment Rate at the Primary Level (Age 6-10 Years) Excluding Katchi Class
Gross Primary Level Enrolment Rate 2004-05 Region and Province Male Female Both
Urban Areas Punjab
104 108
97 104
100 106
Rural Areas Punjab
88 95
68 81
79 88
Overall Punjab
92 99
76 87
85 93
Gross enrolment rate: [Number of children attending primary level (classes 1-5) divided by number of children aged 6-10 years] multiplied by 100.
Source: Pakistan Social and Living Standards Measurement Survey (2004-05).
Education commands a relatively large share of the overall PRSP budget. The PRSP strategy for the sector includes, improving the function-ing, utilization of existing schools, improving the quality of education, increasing enrolment, improving access to education and expanding the primary education system (PSLM, 2004-05). As can be seen from Tables 8(a) and 8(b), the Gross Enrolment Rates (GERs) as a whole are far better for boys than for girls. As a whole the GERs has shown a considerable increase over the years.
There exist wide disparities also across income (employing expenditure as a proxy for income). Table 9 provides information on the proportion of population that has ever attended school disaggregated by expenditure quintiles in 2001-02. The table also shows the wide gender and rural-urban disparities. Marked gender differences can be seen across expenditure groups. The disparity is higher in rural areas. The segment of population ever attended school is higher and gender difference is lower in the higher expenditure groups.
Pakistan’s literacy rate in 2001-02 was 48 percent; 60 percent for males and 34 percent for females. In Punjab this rate was 49%. The female literacy rate is abysmally low in the rural areas of Punjab (26%), while for urban areas it is 60%. Table 10 shows literacy rates in Punjab by expenditure groups. According to this table, the literacy rate of the lowest expenditure
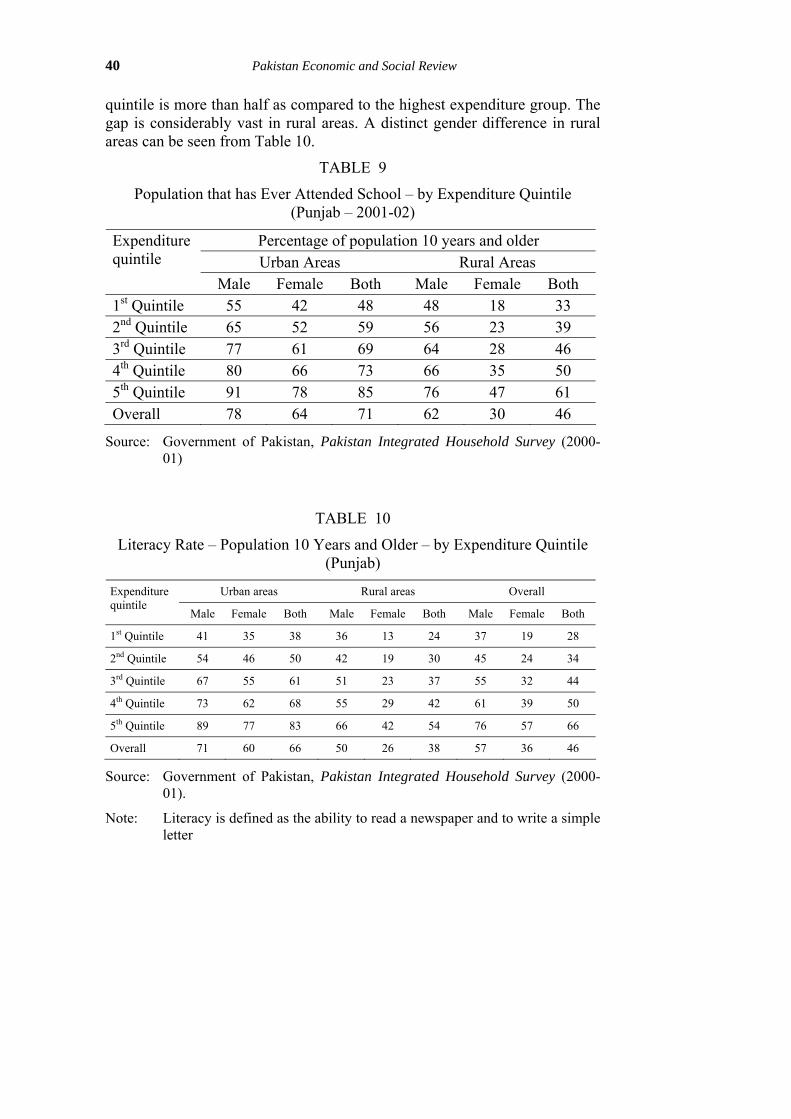
40 Pakistan Economic and Social Review
quintile is more than half as compared to the highest expenditure group. The gap is considerably vast in rural areas. A distinct gender difference in rural areas can be seen from Table 10.
TABLE 9
Population that has Ever Attended School – by Expenditure Quintile (Punjab – 2001-02)
Percentage of population 10 years and older Urban Areas Rural Areas
Expenditure quintile
Male Female Both Male Female Both 1st Quintile 55 42 48 48 18 33 2nd Quintile 65 52 59 56 23 39 3rd Quintile 77 61 69 64 28 46 4th Quintile 80 66 73 66 35 50 5th Quintile 91 78 85 76 47 61 Overall 78 64 71 62 30 46
Source: Government of Pakistan, Pakistan Integrated Household Survey (2000-01)
TABLE 10
Literacy Rate – Population 10 Years and Older – by Expenditure Quintile (Punjab)
Urban areas Rural areas Overall Expenditure quintile
Male Female Both Male Female Both Male Female Both
1st Quintile 41 35 38 36 13 24 37 19 28
2nd Quintile 54 46 50 42 19 30 45 24 34
3rd Quintile 67 55 61 51 23 37 55 32 44
4th Quintile 73 62 68 55 29 42 61 39 50
5th Quintile 89 77 83 66 42 54 76 57 66
Overall 71 60 66 50 26 38 57 36 46
Source: Government of Pakistan, Pakistan Integrated Household Survey (2000-01).
Note: Literacy is defined as the ability to read a newspaper and to write a simple letter
GERA: Social Sector Expenditures and Outcomes 41
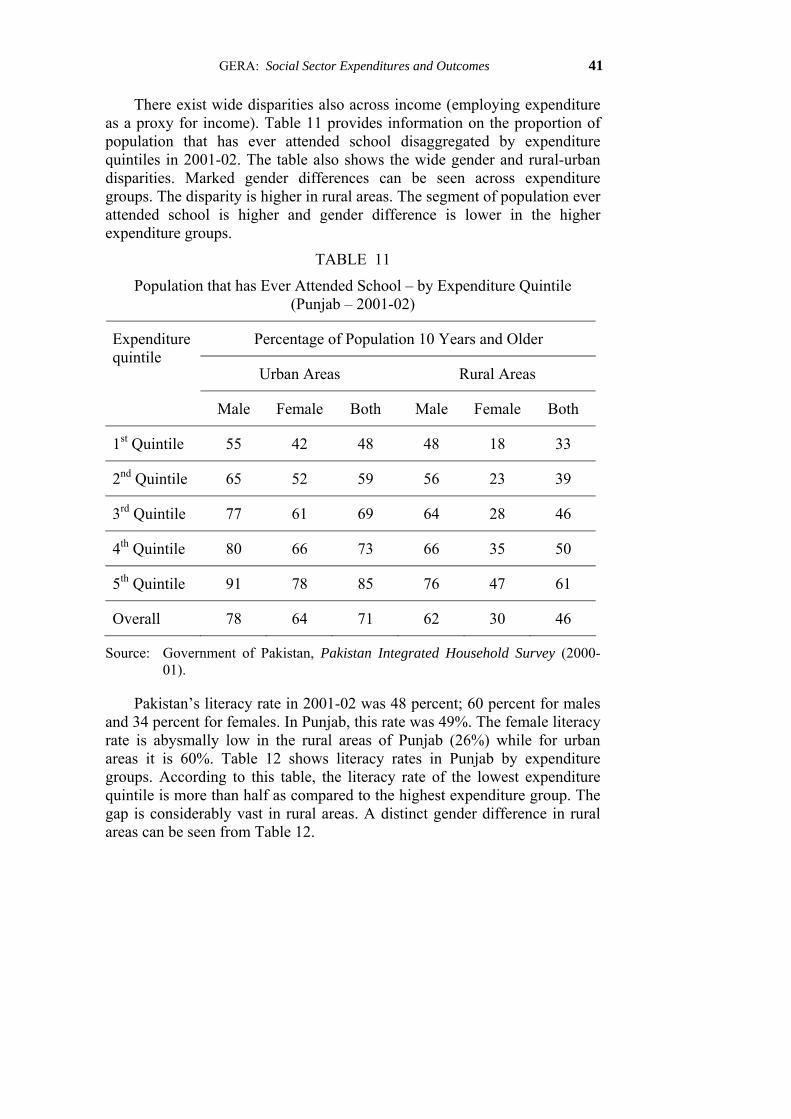
There exist wide disparities also across income (employing expenditure as a proxy for income). Table 11 provides information on the proportion of population that has ever attended school disaggregated by expenditure quintiles in 2001-02. The table also shows the wide gender and rural-urban disparities. Marked gender differences can be seen across expenditure groups. The disparity is higher in rural areas. The segment of population ever attended school is higher and gender difference is lower in the higher expenditure groups.
TABLE 11
Population that has Ever Attended School – by Expenditure Quintile (Punjab – 2001-02)
Percentage of Population 10 Years and Older
Urban Areas Rural Areas
Expenditure quintile
Male Female Both Male Female Both
1st Quintile 55 42 48 48 18 33
2nd Quintile 65 52 59 56 23 39
3rd Quintile 77 61 69 64 28 46
4th Quintile 80 66 73 66 35 50
5th Quintile 91 78 85 76 47 61
Overall 78 64 71 62 30 46
Source: Government of Pakistan, Pakistan Integrated Household Survey (2000-01).
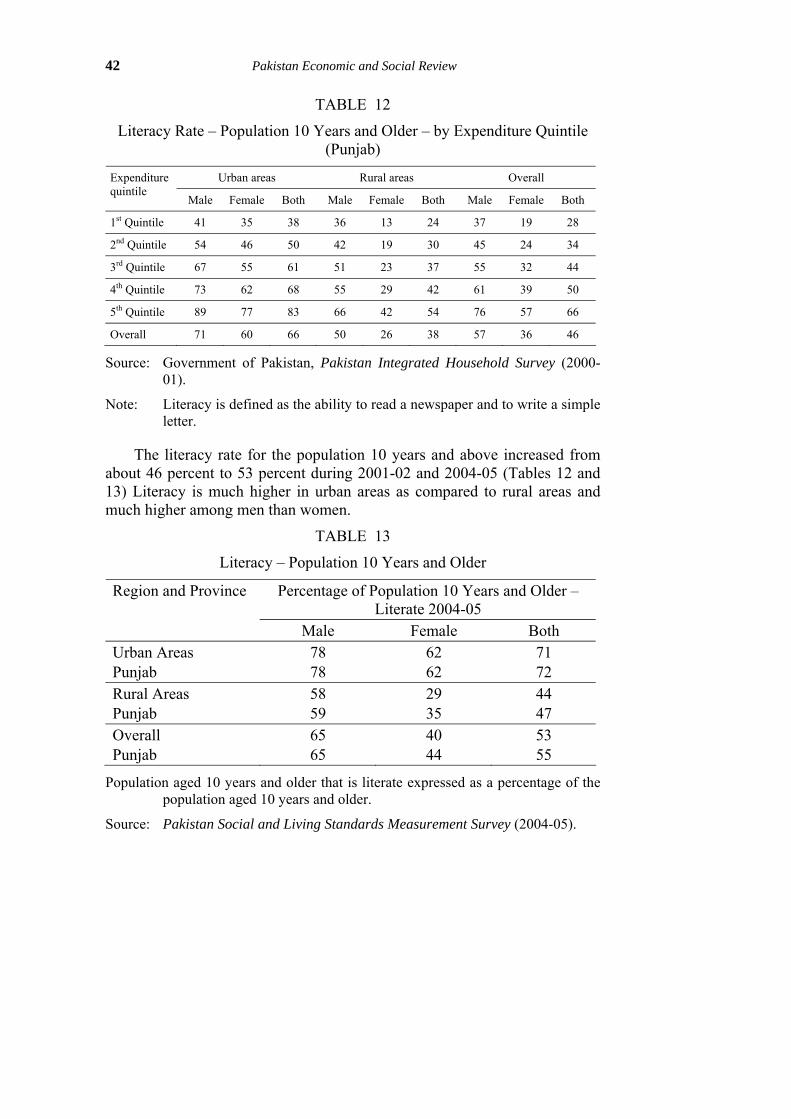
Pakistan’s literacy rate in 2001-02 was 48 percent; 60 percent for males and 34 percent for females. In Punjab, this rate was 49%. The female literacy rate is abysmally low in the rural areas of Punjab (26%) while for urban areas it is 60%. Table 12 shows literacy rates in Punjab by expenditure groups. According to this table, the literacy rate of the lowest expenditure quintile is more than half as compared to the highest expenditure group. The gap is considerably vast in rural areas. A distinct gender difference in rural areas can be seen from Table 12.
42 Pakistan Economic and Social Review
TABLE 12
Literacy Rate – Population 10 Years and Older – by Expenditure Quintile (Punjab)
Urban areas Rural areas Overall Expenditure quintile
Male Female Both Male Female Both Male Female Both
1st Quintile 41 35 38 36 13 24 37 19 28
2nd Quintile 54 46 50 42 19 30 45 24 34
3rd Quintile 67 55 61 51 23 37 55 32 44
4th Quintile 73 62 68 55 29 42 61 39 50
5th Quintile 89 77 83 66 42 54 76 57 66
Overall 71 60 66 50 26 38 57 36 46
Source: Government of Pakistan, Pakistan Integrated Household Survey (2000-01).
Note: Literacy is defined as the ability to read a newspaper and to write a simple letter.
The literacy rate for the population 10 years and above increased from about 46 percent to 53 percent during 2001-02 and 2004-05 (Tables 12 and 13) Literacy is much higher in urban areas as compared to rural areas and much higher among men than women.
TABLE 13
Literacy – Population 10 Years and Older
Percentage of Population 10 Years and Older – Literate 2004-05
Region and Province
Male Female Both Urban Areas Punjab
78 78
62 62
71 72
Rural Areas Punjab
58 59
29 35
44 47
Overall Punjab
65 65
40 44
53 55
Population aged 10 years and older that is literate expressed as a percentage of the population aged 10 years and older.
Source: Pakistan Social and Living Standards Measurement Survey (2004-05).
GERA: Social Sector Expenditures and Outcomes 43
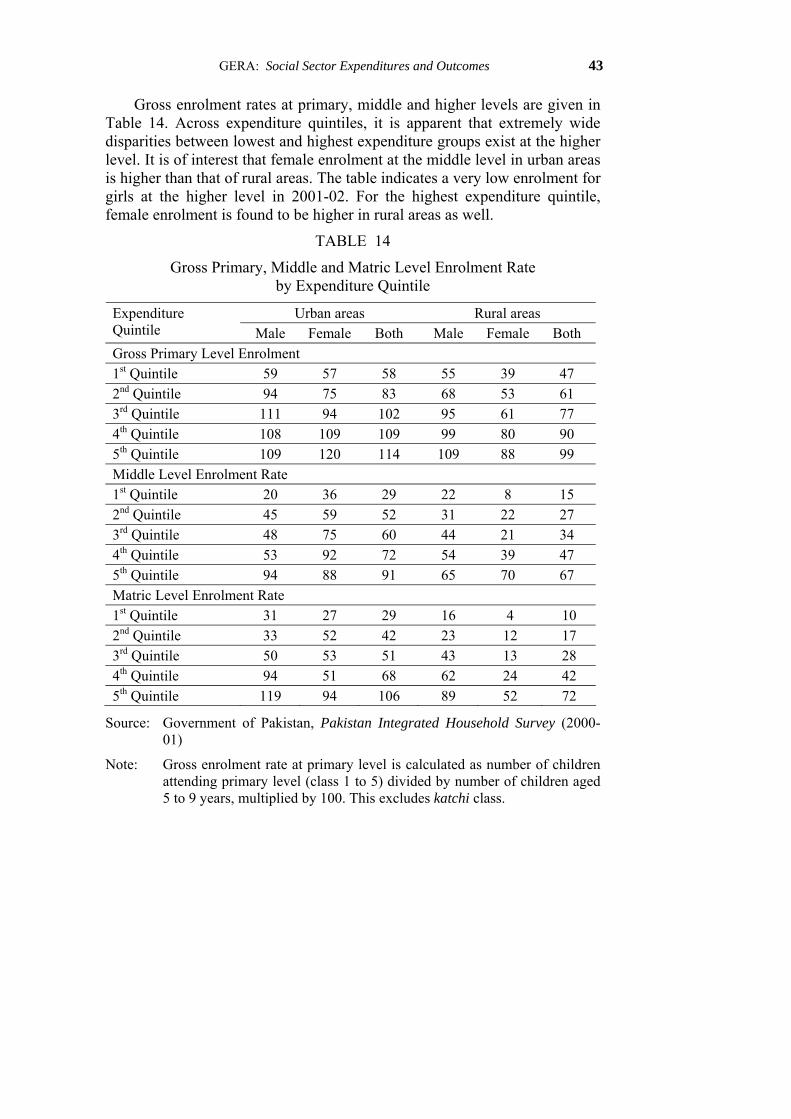
Gross enrolment rates at primary, middle and higher levels are given in Table 14. Across expenditure quintiles, it is apparent that extremely wide disparities between lowest and highest expenditure groups exist at the higher level. It is of interest that female enrolment at the middle level in urban areas is higher than that of rural areas. The table indicates a very low enrolment for girls at the higher level in 2001-02. For the highest expenditure quintile, female enrolment is found to be higher in rural areas as well.
TABLE 14
Gross Primary, Middle and Matric Level Enrolment Rate by Expenditure Quintile
Urban areas Rural areas Expenditure Quintile Male Female Both Male Female Both Gross Primary Level Enrolment 1st Quintile 59 57 58 55 39 47 2nd Quintile 94 75 83 68 53 61 3rd Quintile 111 94 102 95 61 77 4th Quintile 108 109 109 99 80 90 5th Quintile 109 120 114 109 88 99 Middle Level Enrolment Rate 1st Quintile 20 36 29 22 8 15 2nd Quintile 45 59 52 31 22 27 3rd Quintile 48 75 60 44 21 34 4th Quintile 53 92 72 54 39 47 5th Quintile 94 88 91 65 70 67 Matric Level Enrolment Rate 1st Quintile 31 27 29 16 4 10 2nd Quintile 33 52 42 23 12 17 3rd Quintile 50 53 51 43 13 28 4th Quintile 94 51 68 62 24 42 5th Quintile 119 94 106 89 52 72
Source: Government of Pakistan, Pakistan Integrated Household Survey (2000-01)
Note: Gross enrolment rate at primary level is calculated as number of children attending primary level (class 1 to 5) divided by number of children aged 5 to 9 years, multiplied by 100. This excludes katchi class.
44 Pakistan Economic and Social Review
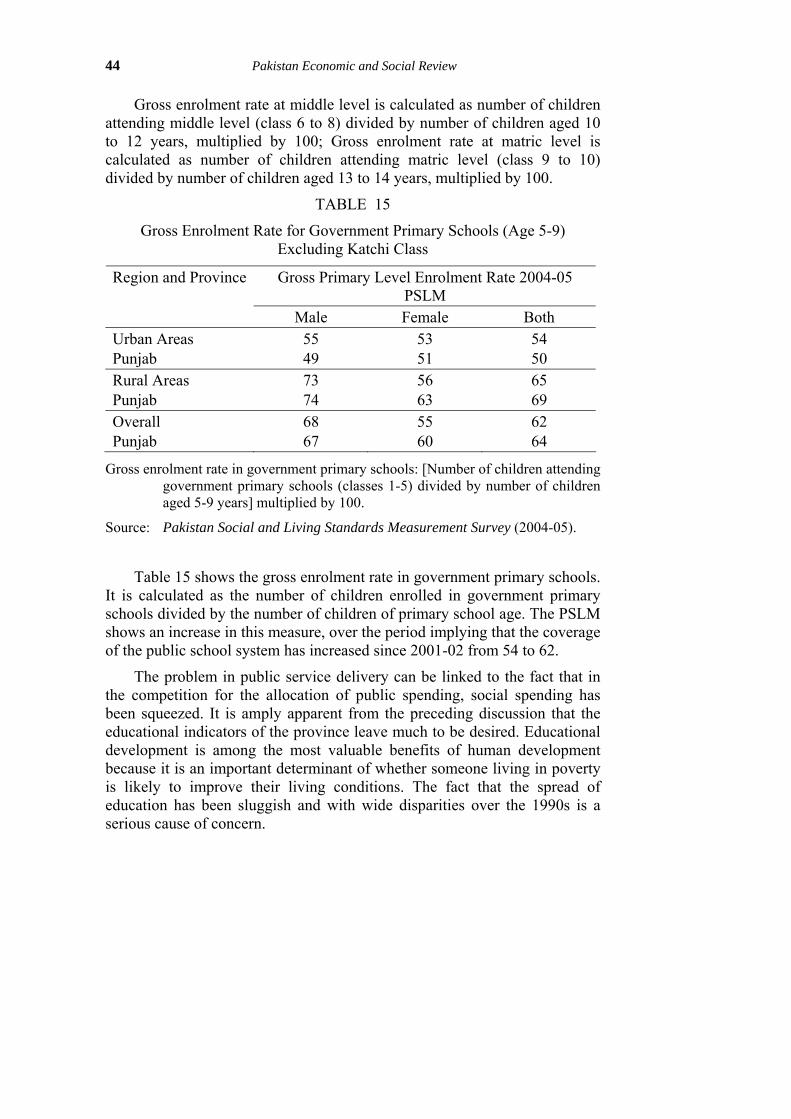
Gross enrolment rate at middle level is calculated as number of children attending middle level (class 6 to 8) divided by number of children aged 10 to 12 years, multiplied by 100; Gross enrolment rate at matric level is calculated as number of children attending matric level (class 9 to 10) divided by number of children aged 13 to 14 years, multiplied by 100.
TABLE 15
Gross Enrolment Rate for Government Primary Schools (Age 5-9) Excluding Katchi Class
Gross Primary Level Enrolment Rate 2004-05 PSLM
Region and Province
Male Female Both Urban Areas Punjab
55 49
53 51
54 50
Rural Areas Punjab
73 74
56 63
65 69
Overall Punjab
68 67
55 60
62 64
Gross enrolment rate in government primary schools: [Number of children attending government primary schools (classes 1-5) divided by number of children aged 5-9 years] multiplied by 100.
Source: Pakistan Social and Living Standards Measurement Survey (2004-05).
Table 15 shows the gross enrolment rate in government primary schools. It is calculated as the number of children enrolled in government primary schools divided by the number of children of primary school age. The PSLM shows an increase in this measure, over the period implying that the coverage of the public school system has increased since 2001-02 from 54 to 62.
The problem in public service delivery can be linked to the fact that in the competition for the allocation of public spending, social spending has been squeezed. It is amply apparent from the preceding discussion that the educational indicators of the province leave much to be desired. Educational development is among the most valuable benefits of human development because it is an important determinant of whether someone living in poverty is likely to improve their living conditions. The fact that the spread of education has been sluggish and with wide disparities over the 1990s is a serious cause of concern.

GERA: Social Sector Expenditures and Outcomes 45
What, in the main accounts, for the poor education indicators? An attempt will be made in the following section to analyze this.
Expenditure on Education According to a World Bank study on local public expenditures, the main reasons for the province’s abysmal social indicators are: low spending on the social sector and inefficiencies in the use of these limited resources. Punjab allocates almost 2.1% of its GDP to education and that is only about half of the share allocated by countries with similar levels of incomes and around two-thirds of what is spent in India and Sri Lanka. The Social Action Program intended to explicitly boost expenditures, yet average real spending per student was stagnant at best during the 1990s.
TABLE 16
Percentage Share of Expenditure on Education in Total Expenditure
Percentage share in total expenditure of education
Education (Total) Primary
education Secondary education
University education
Profes-sional
education, teacher’s training
Others
Growth rate in
expendi-ture on
education
1990/91 21.95 10.97 5.64 2.17 1.89 1.28
1991/92 22.81 12.24 5.54 1.57 1.75 1.70 15.34
1992/93 22.99 11.69 5.55 2.33 2.16 1.27 9.45
1993/94 26.74 13.95 6.69 2.53 1.95 1.62 15.47
1994/95 25.04 13,42 6.18 2.15 1.16 2.12 22.10
1995/96 23.90 13.03 6.00 2.18 1.09 1.60 12.29
1996/97 24.93 13.36 6.35 2.33 1.21 1.68 0.72
1997/98 27.92 16.31 6.40 2.37 1.11 1.72 18.88
1998/99 25.59 14.57 6.02 2.25 1.21 1.54 –1.12
1999/00 22.26 13.22 5.53 2.13 0.41 0.98 3.47
2000/01 23.54 13.37 6.23 2.15 0.59 1.20 6.35
2001/02 25.33 14.39 6.43 2.32 0.61 1.57 7.60
2002/03 25.19 14.50 6.11 2.51 0.64 1.44 –0.5
Source: World Bank Database, 2004/05
46 Pakistan Economic and Social Review
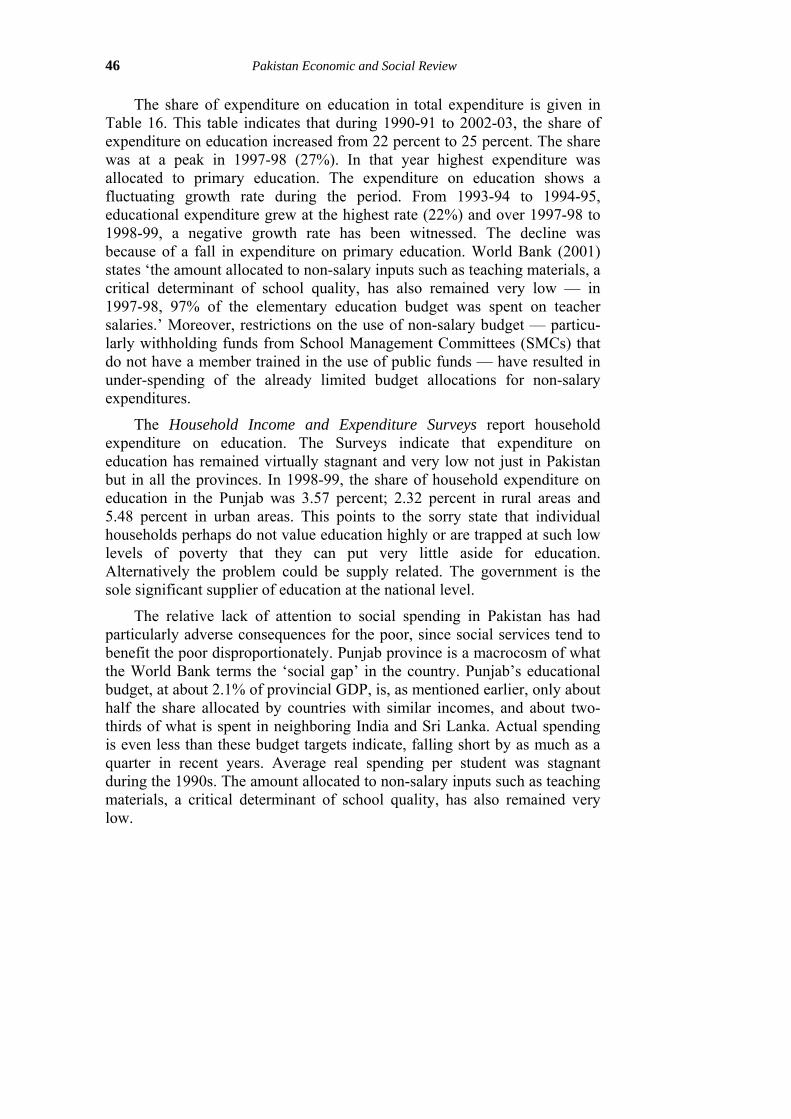
The share of expenditure on education in total expenditure is given in Table 16. This table indicates that during 1990-91 to 2002-03, the share of expenditure on education increased from 22 percent to 25 percent. The share was at a peak in 1997-98 (27%). In that year highest expenditure was allocated to primary education. The expenditure on education shows a fluctuating growth rate during the period. From 1993-94 to 1994-95, educational expenditure grew at the highest rate (22%) and over 1997-98 to 1998-99, a negative growth rate has been witnessed. The decline was because of a fall in expenditure on primary education. World Bank (2001) states ‘the amount allocated to non-salary inputs such as teaching materials, a critical determinant of school quality, has also remained very low — in 1997-98, 97% of the elementary education budget was spent on teacher salaries.’ Moreover, restrictions on the use of non-salary budget — particu-larly withholding funds from School Management Committees (SMCs) that do not have a member trained in the use of public funds — have resulted in under-spending of the already limited budget allocations for non-salary expenditures.
The Household Income and Expenditure Surveys report household expenditure on education. The Surveys indicate that expenditure on education has remained virtually stagnant and very low not just in Pakistan but in all the provinces. In 1998-99, the share of household expenditure on education in the Punjab was 3.57 percent; 2.32 percent in rural areas and 5.48 percent in urban areas. This points to the sorry state that individual households perhaps do not value education highly or are trapped at such low levels of poverty that they can put very little aside for education. Alternatively the problem could be supply related. The government is the sole significant supplier of education at the national level.
The relative lack of attention to social spending in Pakistan has had particularly adverse consequences for the poor, since social services tend to benefit the poor disproportionately. Punjab province is a macrocosm of what the World Bank terms the ‘social gap’ in the country. Punjab’s educational budget, at about 2.1% of provincial GDP, is, as mentioned earlier, only about half the share allocated by countries with similar incomes, and about two-thirds of what is spent in neighboring India and Sri Lanka. Actual spending is even less than these budget targets indicate, falling short by as much as a quarter in recent years. Average real spending per student was stagnant during the 1990s. The amount allocated to non-salary inputs such as teaching materials, a critical determinant of school quality, has also remained very low.

GERA: Social Sector Expenditures and Outcomes 47
Another vital ingredient of human development is health. While various health indicators in the Punjab and Pakistan as a whole have shown some improvement since the beginning of the decade, enormous challenges remain. In the following section we discuss the health scenario of the province and then continue to attempt to analyze why the health indicators are as poor as they are.
Health The government health strategy focuses on young children and their mothers particularly in rural areas. The main emphasis is to improve women’s access to government health care. The government’s strategy for primary health care includes:
● improving the efficiency and utilization of basic health care services, both preventive and curative;
● improving program design by paying more attention to quality;
● increasing access to health care by constructing more facilities; and
● increasing women’s access by recruiting more female staff.
Such noble intentions notwithstanding, the prevailing conditions of health care, particularly public health care, remains pathetic and abysmal.
As is applicable to most parts of the country, the health status in Punjab is far from satisfactory. The number of maternal deaths in the province was estimated at 833 per month in 1998. Immunization coverage based on record fell from 37 percent in 1995-96 to 33% in 2001-02. This percentage is 57 percent on the basis of record and recall and 97 percent on the basis of recall. There are vast variations across districts. Table 17 presents the difference between the various income quintiles with respect to child immunization. The percentage of children fully immunized in the Punjab in 2001-02 was 23 percent 23 percent for the 1st quintile and 46 percent for the 5th quintile. As is to be expected, in urban areas the proportion of fully immunized children for the poor households is less than the proportion of rural areas. As concerns child immunization, the difference between the 1st quintile and 5th quintile in urban areas is greater.
Expanding the coverage of immunization in Pakistan is a focal objective of the government. Measuring immunization coverage in household surveys is not that simple. Parents often do not have the children’s immunization/ health cards with complete information on vaccinations received.

48 Pakistan Economic and Social Review
TABLE 17
Percentage of Children Aged 12 to 23 Months who have been fully Immunized, by Income Groups and Region in the Punjab, 2001-02
Urban Areas Rural Areas Both Areas Income Group
Male Female Both Male Female Both Male Female Both
1st quintile 37 33 35 19 23 21 22 25 23
2nd quintile 45 53 50 23 25 24 26 31 28
3rd quintile 45 55 51 24 24 24 29 33 31
4th quintile 53 55 54 32 33 32 38 40 39
5th quintile 59 68 65 26 40 32 37 55 46
Source: Government of Pakistan, Pakistan Integrated Household Survey (2001-02)
TABLE 18
Percentage of Children Aged 12-23 Months that have been Immunized
Based on Recall and Record – Fully Immunized 2004-05 Region and Province
Male Female Both
Urban Areas Punjab
86 89
87 89
87 89
Rural Areas Punjab
73 82
71 80
72 81
Overall Punjab
78 85
77 84
77 84
Based on recall: Children reported as having received at least one immunization expressed as a percentage of all children aged 12-23 months.
Based on record: Children who reported having received full immunization who also have an immunization card, expressed as a percentage of all children aged 12-23 months.
Source: Pakistan Social and Living Standards Measurement Survey (2004-05).

GERA: Social Sector Expenditures and Outcomes 49
Immunization rates based solely on the information given on immunization cards (‘record’) may therefore underestimate the figures. However, there is the advantage of using written information recorded by health workers. The alternative is to ask parents about the history of their child’s vaccinations and assess coverage rates employing this information (‘recall’). This has the disadvantage that parents may not remember vaccinations administered. Neither measure is ideal and without flaws. Both are presented in Table 18. There is an increase in complete immunization rates both for rural and urban areas but in rural areas it is particularly significant going from about 32 percent in 2001-02 to 72 percent in 2004-05 as the above tables indicate.
Infant mortality is an important demographic indicator. In Pakistan, there has occurred a decline in this indicator overall. In Table 19 data is presented on a comparison of infant mortality rates in the country overall and Punjab. From the data it is apparent that the rate is higher in the Punjab when compared to the overall figures. A fairly high rate is evident for rural areas both overall and the Punjab. Over time however there is a declining trend in infant mortality rates.
TABLE 19
Infant Mortality in Punjab and Pakistan (Deaths per 1000 Live Births)
1996-97 1998-99
Male Female Both Male Female Both Pakistan 101 108 105 93 85 89 Punjab 108 121 115 100 91 95 Urban Pakistan 82 85 83 7 68 73 Urban Punjab 84 93 89 78 61 70 Rural Pakistan 108 117 112 99 91 95 Rural Punjab 116 130 123 109 102 106
Source: Government of Pakistan, Pakistan Integrated Household Survey (1998-99).
The prevalence of malnutrition has shown no signs of improvement since the last 20 years. The estimated number of malnourished children was around 8 million in 1997-98. Almost half the children under 5 years of age were underweight. The World Bank (2002) surveyed households in four districts of rural Pakistan and observed a total lack of improvement in these districts since an earlier study done 10 years earlier. For that matter they found a higher incidence of malnutrition. There are of course significant
50 Pakistan Economic and Social Review
variations across provinces, Punjab being somewhat better off than other provinces.
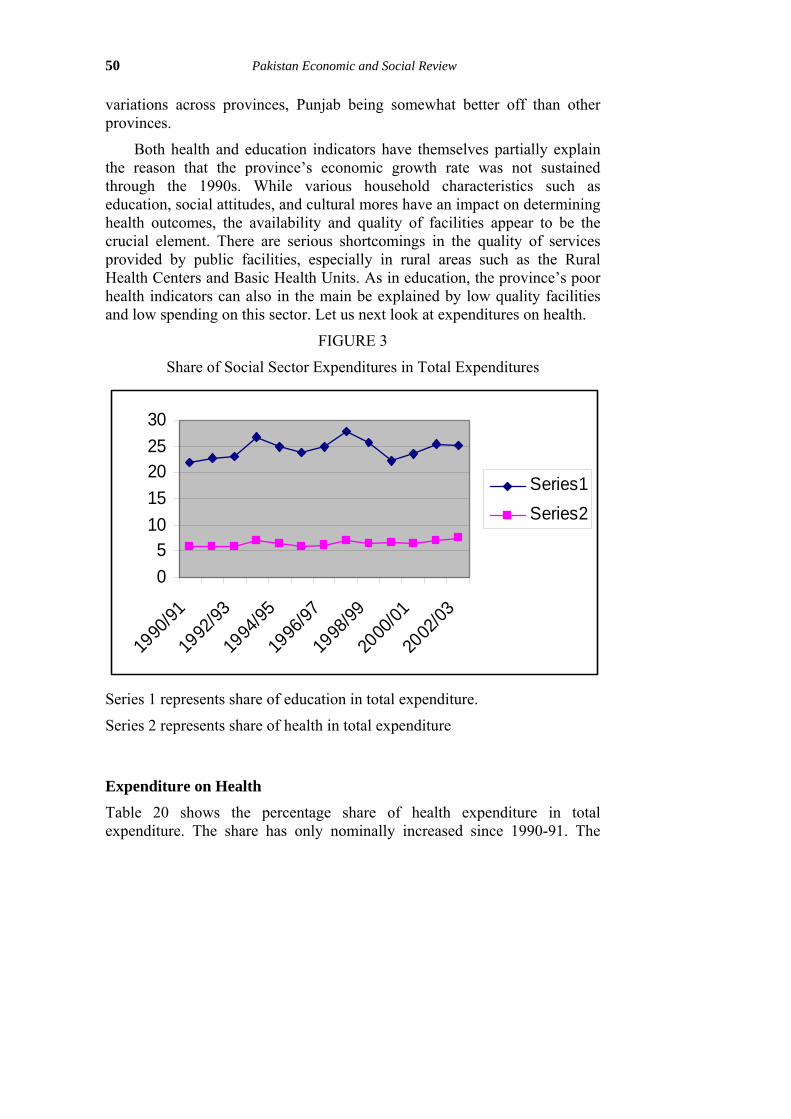
Both health and education indicators have themselves partially explain the reason that the province’s economic growth rate was not sustained through the 1990s. While various household characteristics such as education, social attitudes, and cultural mores have an impact on determining health outcomes, the availability and quality of facilities appear to be the crucial element. There are serious shortcomings in the quality of services provided by public facilities, especially in rural areas such as the Rural Health Centers and Basic Health Units. As in education, the province’s poor health indicators can also in the main be explained by low quality facilities and low spending on this sector. Let us next look at expenditures on health.
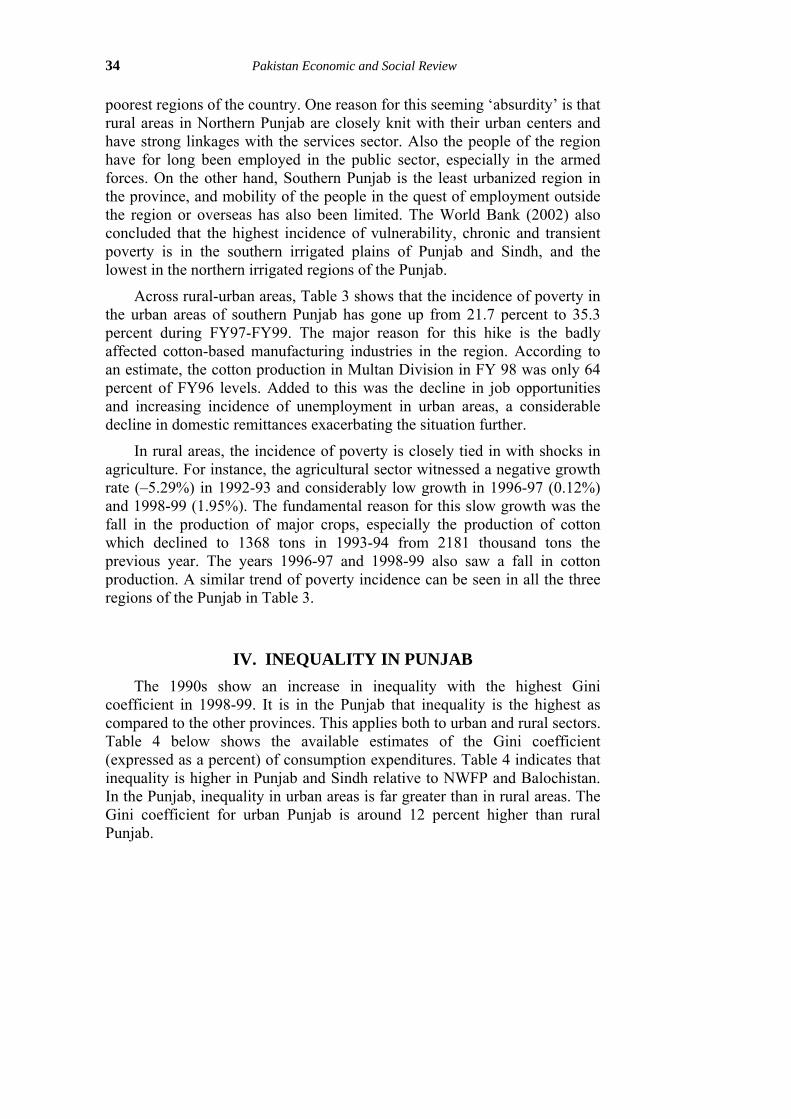
FIGURE 3
Share of Social Sector Expenditures in Total Expenditures
05
1015202530
1990
/91
1992
/93
1994
/95
1996
/97
1998
/99
2000
/01
2002
/03
Series1Series2
Series 1 represents share of education in total expenditure.
Series 2 represents share of health in total expenditure
Expenditure on Health Table 20 shows the percentage share of health expenditure in total expenditure. The share has only nominally increased since 1990-91. The

GERA: Social Sector Expenditures and Outcomes 51
expenditure was at its highest in 2002-03. Punjab’s health expenditure of about 0.7% of provincial GDP is low by international standards since the average expenditure for all low and middle income countries is around 2% of GDP. Since non-salary inputs are insufficient, the government health facilities often run short of medicines and other supplies. This includes essential drugs.
TABLE 20
Percentage Share of Expenditure on Health in Total Expenditure
Percentage Share in Total Expenditure
Health General
Hospitals and
Clinics
Mother and
Child
Other faci-lities and
Preventive Measures
Others
Growth Rate in
Expenditure on health
1990/91 5.82 5.01 0.04 0.02 0.74
1991/92 5.95 5.06 0.03 0.02 0.84 13.65
1992/93 6.00 5.15 0.03 0.02 0.80 9.44
1993/94 6.91 5.84 0.03 0.02 1.02 14.31
1994/95 6.45 5.38 0.03 0.03 1.02 21.69
1995/96 5.79 4.93 0.05 0.04 0.77 5.59
1996/97 6.03 5.20 0.03 0.02 0.79 0.63
1997/98 6.86 5.77 0.03 0.03 1.03 20.75
1998/99 6.54 5.59 0.03 0.02 0.89 2.75
1999/00 6.78 5.37 0.02 0.02 1.36 23.38
2000/01 6.39 5.66 0.03 0.03 0.67 –5.23
2001/02 6.95 6.00 0.03 0.05 0.87 8.76
2002/03 7.45 6.51 0.04 0.04 0.86 7.19
Source: Government of Pakistan, Pakistan Integrated Household Survey, 2001/02.
Punjab’s health expenditure of approximately 0.5% of provincial GDP is like education low by international standards – the average expenditure for all low and middle-income countries is roughly 2% of GDP. At about a third of total expenditures, allocations for non-salary inputs are insufficient, with the result that government health facilities routinely run out of medicine and
52 Pakistan Economic and Social Review
other supplies. For instance, in the last quarter of 1999, half of the primary health care facilities in the province reported that supplies of three essential drugs had been completely exhausted.
VI. CONCLUSIONS Thus, we see that in the Punjab and elsewhere, social gaps and fissures are becoming ever worse. Given that, as stated earlier, aggregate social sector spending has been inadequate in the Punjab and Pakistan as a whole, it is particularly important to improve the impact of such spending on the poor. For one, expanding the share of primary education in educational expenditures is a way to ensure such an impact.
As the case of the Punjab shows, poor management and implementation have exacerbated the ill effects of scarce allocations for social programs. The province and the entire country exhibit constant problems in several dimensions of governance that are of relevance for healthy public spending: leakage, licit and illicit; difficulties with bureaucratic structure and quality; weaknesses in the rule of law, and opacity in government decision making (World Bank, 2002). Problems of implementation also crop up due to lack of management capacity in the public sector. To a certain extent, political factors also impede the implementation of public sector policies. For example, public expenditure allocations, such as the selection of infrastructure projects lacking sufficient attention to maintenance and sustainability, may be driven by incentives that govern local political dynamics. This phenomenon is particularly applicable to the Punjab. Again in the Punjab as elsewhere, there exists the elite capture of the state. The elites, barely benefiting from public spending focused on the poor, and in certain cases even threatened by it (education), are known to have blocked reforms.
By way of remedying the situation, social spending is embedded in the very fabric of government and society, so successful governance reforms will simply have to be comprehensive and broad in scope. Reforms that curtail waste and leakage in all areas of fiscal policy, particularly in development, and that deepen the rule of law have direct impacts on the efficiency of spending, which in turn relaxes the fiscal constraint that worsens the social gap.
Social sector reforms that overlook the difficulties that the poor encounter in holding the government accountable, and the vital role that local elites play concerning this, are highly unlikely to be successful. The lack of accountability can be improved by increased democratization, decentraliza-

GERA: Social Sector Expenditures and Outcomes 53
tion, and transparency. All told, it is critical to ensure that growth is pro-poor and participatory, and the obstacles arising from resistance from local elites overcome.
It can be concluded from this analysis that government investments in education and skills enhancement, health and in the provision of infra-structure can have a direct effect on moving households out of poverty. The government should therefore continue to enhance its investments in these areas.
Pakistan is poised at an extremely critical moment in time when the right choices, priorities and strategies in education can enable it to progress on a sustainable and just trajectory of development. It is necessary, therefore to accelerate greater access to quality education at all tiers and across all regions.
As with the education system, the health system in the Punjab faces issues of equity, effectiveness and efficiency. The resources devoted to the health system are unequally distributed and not in proportion to the distribution of health problems. There is no substantial and growing evidence that considerable improvements in the health of the populace can be achieved at reasonable cost.
Another equally important set of factors the government should focus on relate to the strengthening of existing safety nets for the poor in the form of micro-interventions and welfare programs, which either supplement the assets of the poor or are given in the form of direct income and consumption support for the poorest.
And unless a concerted effort is made to better the social indicators in the Punjab, all the banter about high growth rates will prove meaningless. If the province and the country as a whole do not close its social gap, its long term ability to grow and alleviate poverty will be seriously at stake. Although a tall order, it is imperative for the problem to be tackled on a war footing.

54 Pakistan Economic and Social Review
REFERENCES
Asian Development Bank (2002), Poverty in Pakistan: Issues, Causes and Institutional Responses.
Government of Pakistan (2005), Pakistan Social and Living Standards Measurement Survey, 2004-05. Statistics Division, Federal Bureau of Statistics, Islamabad.
Government of Pakistan, Agriculture Census Organization, 1990 and 2000.
Government of Pakistan, Household Income and Expenditure Survey 1998-99. Federal Bureau of Statistics.
Government of Pakistan, Labour Force Survey, 1999-2000. Federal Bureau of Statistics.
Government of Pakistan, Pakistan Economic Survey, Various issues. Ministry of Finance, Islamabad.
Government of Pakistan, Pakistan Integrated Household Survey, 2001-02. Federal Bureau of Statistics.
Malik, Sohail J. (2004), Initial Discussion Draft, ADB PSRMP Mission – Background Note on Poverty in Punjab.
Qureshi, S. K. and G. M. Arif (2001), ‘Profile of Poverty in Pakistan, 1998-1999’. MIMAP Technical Paper Series, Pakistan Institute of Development Economics (PIDE), Islamabad.
Social Policy and Development Center (SPDC), Annual Report, 2004.
World Bank (2001), Reforming Punjab’s Public Finances and Institutions. Washington DC.
World Bank (2002), Pakistan Poverty Assessment, Poverty in Pakistan: Vulnerability, Social Gaps and Rural Dynamics, Washington DC.
World Bank Database, 2003-04.
World Bank for the Pakistan Human Development Forum (January 24-26, 2002), Islamabad, January 2002.
World Bank, ‘Poverty in Pakistan in the 1990s: An Interim Assessment’.
World Development Report (1990), Poverty. Oxford University Press, Washington DC.