Embed Size (px)
Citation preview

Social Protection and Social Insurance Age Transfers in Poland
Institute of Statistics and DemographyWarsaw School of Economics SGH
Conferene “Demographic Change in Central and Eastern Europe (CEE)”Joint Programming Initiative “More Years, Better Lives”
Vienna, 24 March 2015
dr Agnieszka Chłoń-Domińczak
PolNTANational Transfer Accounts and National Time Transfer Account for Poland

Outline
• Demographic situation in Poland• Social insurance in Poland: basic facts• Benefits and revenues of social insurance
system by age groups and gender• Who receives what kind of benefits?• Change of pension expenditure age profiles in
time• Summary

Population ageing combined with waves of baby booms and baby busts
0 6 12 18 24 30 36 42 48 54 60 66 72 78 84 90 960
100000
200000
300000
400000
500000
600000
700000
800000
2004 Total 2008 Total 2012 Total
05
101520253035404550556065707580859095
100+
-400000
-300000
-200000
-100000 0
100000
200000
300000
400000
2012 Men 2012 Women 2008 Men2008 Women 2004 Women 2004 Men
• Gradual shift of post-war baby-boom generation towards retirement age• Increased size of transfers from social insurance to retired population• Reduced mortality and lower fertility after 1989 Source: GUS

Social expenditure in Poland compared to the EU-15
20002001
20022003
20042005
20062007
20082009
20102011
2012 0.0
5.0
10.0
15.0
20.0
25.0
30.0
35.0
PolandEU-15
• The level of social protection expenditure in Poland is lower than the EU average
• Widening gap in recent years is caused also by the developments of the economy (lack of recession in Poland)
Source: ESPROSS Eurostat
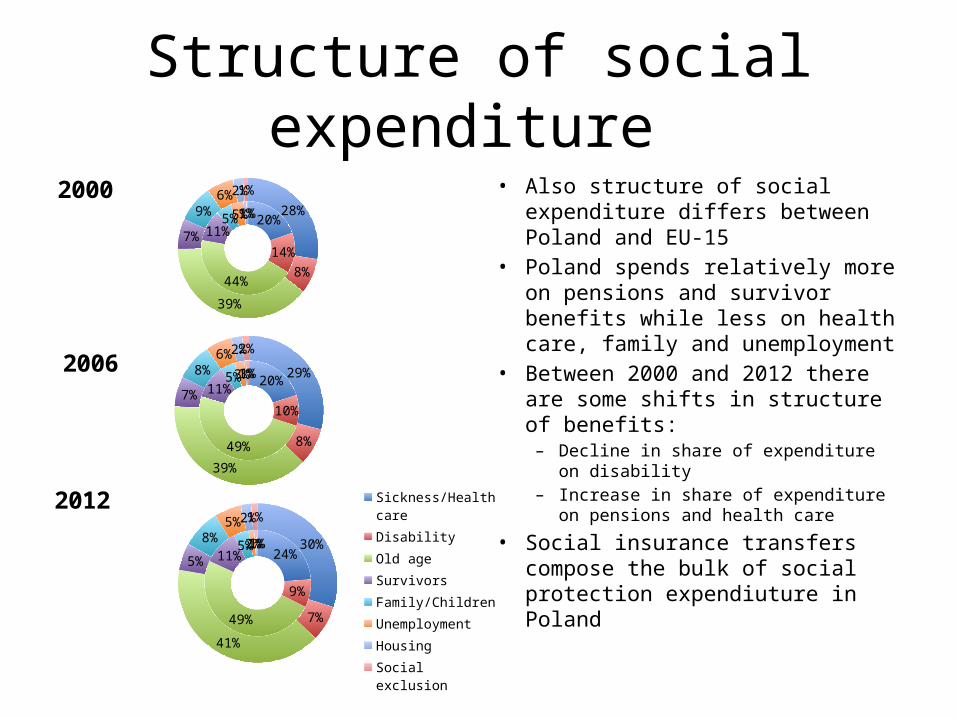
Structure of social expenditure • Also structure of social expenditure
differs between Poland and EU-15• Poland spends relatively more on
pensions and survivor benefits while less on health care, family and unemployment
• Between 2000 and 2012 there are some shifts in structure of benefits:– Decline in share of expenditure on
disability– Increase in share of expenditure on
pensions and health care
• Social insurance transfers compose the bulk of social protection expendiuture in Poland
20%
14%
44%
11%5%5%1%1% 28%
8%
39%
7%
9%6%2%1%2000
20%
10%
49%
11%5%3%1%1% 29%
8%
39%
7%
8%6%2%2%2006
24%
9%
49%
11%5%2%1%1% 30%
7%
41%
5%
8%5%2%1%
Sickness/Health care
Disability
Old age
Survivors
Family/Children
Unemployment
Housing
Social exclusion
2012

Social Insurance in Poland
• One of the largest cash transfer systems covering all employees and self-employed
• Financed from contributions and government subsidies
Insured people ('000)
Pensioners ('000)
Total expenditure
(% GDP)
Pension expenditure
(% GDP)
% of expenditure covered by
contributions2004 12 857 7 175 11,8 10,8 71,22008 14 513 7 414 10,4 9,6 61,12012 14 604 7 351 10,7 9,8 69,4
Source: ZUS

Data analysed
• Part of the development of NTA profiles for Poland • Data availability:
– 2012 by age cohort and gender: • data on transfers including:
– Pensions: old-age, disability, survivors– Pre-retirement transfers (non-contributory)– Short-term benefits: maternity and sickness benefits
• data on contribution revenue based on the information on wage levels covered by social insurance
– 2004 and 2008 by age cohort and sex:• data on pension transfers (old-age, disability and survivors)
– Data on transfers: as of December of a given year (monthly data)– Data on contributions: annual data, re-calculated to monthly level

2012: Transfers by type0 3 6 9 12 15 18 21 24 27 30 33 36 39 42 45 48 51 54 57 60 63 66 69 72 75 78 81 84 87 90 93 96 99+
0
20000000
40000000
60000000
80000000
100000000
120000000
140000000
ST sickness MST sickness FST maternity MST maternity FST father leavePRERET MPRERET FWIP MWIP FBridge MBridge FDI MDI FS MS FOA MOA F
Source: own calculations

2012: transfers by type and sex0 4 8 12 16 20 24 28 32 36 40 44 48 52 56 60 64 68 72 76 80 84 88 92 96
0
10000000
20000000
30000000
40000000
50000000
60000000
70000000
80000000
90000000
OA M S M DI M Bridge M WIP M PRERET M
ST father leave ST maternity M ST sickness M
0 4 8 12 16 20 24 28 32 36 40 44 48 52 56 60 64 68 72 76 80 84 88 92 96
0
10000000
20000000
30000000
40000000
50000000
60000000
OA F S F DI F Bridge F WIP F PRERET F ST maternity FST sickness F
Source: own calculations

Comparison of transfers per capita by sex
(real prices of 2012)
0 4 8 12 16 20 24 28 32 36 40 44 48 52 56 60 64 68 72 76 80 84 88 92 96
0
500
1000
1500
2000
2500
Male
2008 Total M 2012 Total M 2004 Total M
0 4 8 12 16 20 24 28 32 36 40 44 48 52 56 60 64 68 72 76 80 84 88 92 96
0
500
1000
1500
2000
2500
Female
2008 Total F 2012 Total F 2004 Total F
Source: own calculations

Summary
• Demographic shift leads to increased expenditure due to ageing of the post-war baby-boom generation
• Pensions are the main source of transfers from social insurance:– Disability and survivor pensions increase prior to legal
retirement age– Survivor pensions to widows are an important transfers
for women 70+• 2008 reform of early retirement transfers led to a
shift of age profiles of transfers for ages 55-60