Embed Size (px)
Citation preview
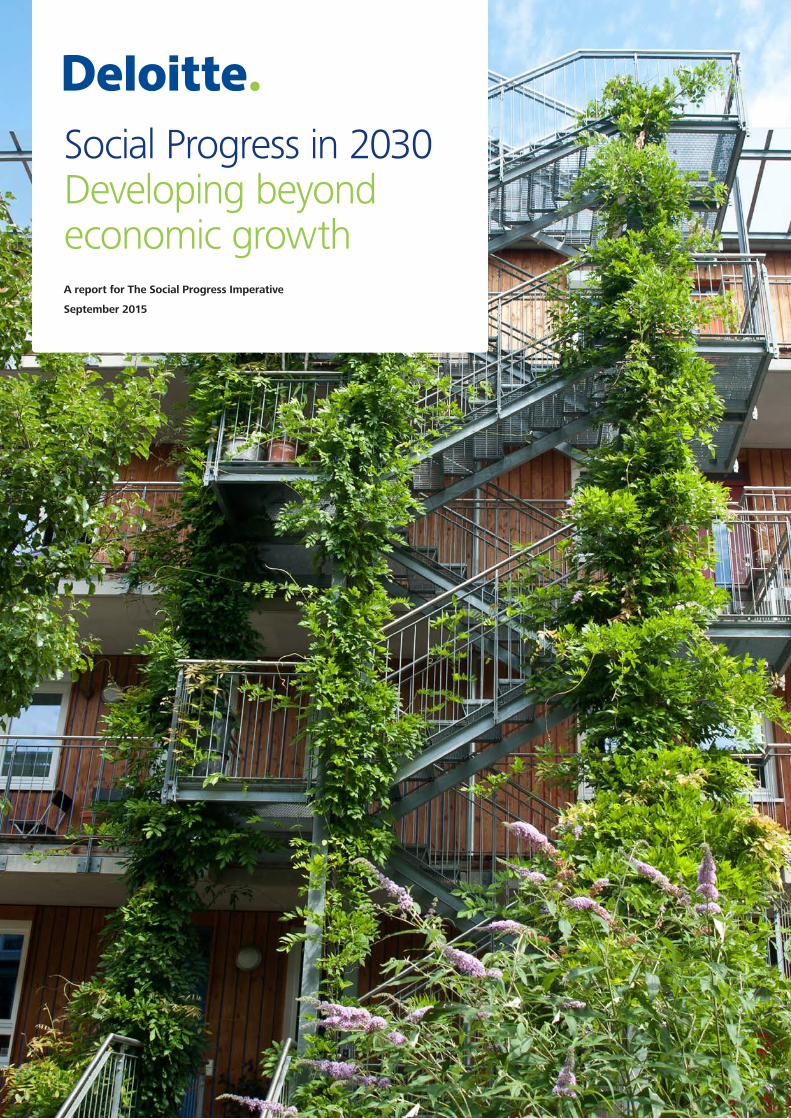
Social Progress in 2030Developing beyond economic growthA report for The Social Progress Imperative
September 2015
To start a new section, hold down the apple+shift keys and click
to release this object and type the section title in the box below.
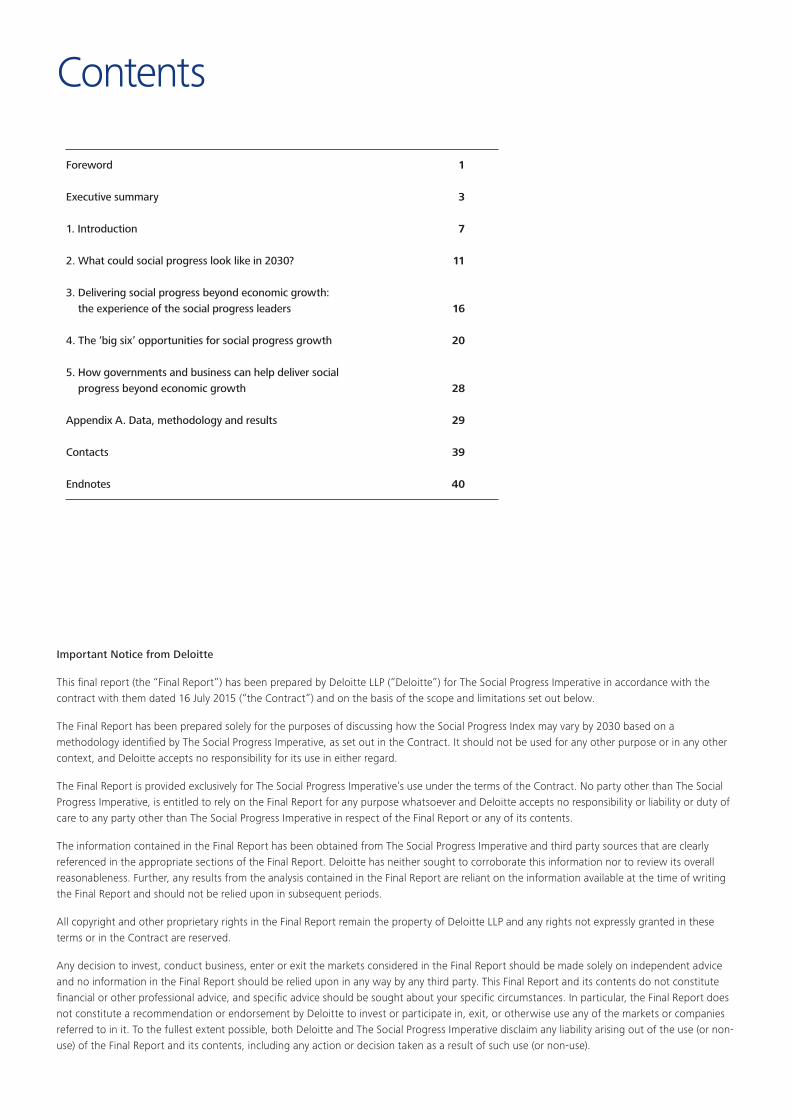
Contents
Important Notice from Deloitte
This final report (the “Final Report”) has been prepared by Deloitte LLP (“Deloitte”) for The Social Progress Imperative in accordance with the contract with them dated 16 July 2015 (“the Contract”) and on the basis of the scope and limitations set out below.
The Final Report has been prepared solely for the purposes of discussing how the Social Progress Index may vary by 2030 based on a methodology identified by The Social Progress Imperative, as set out in the Contract. It should not be used for any other purpose or in any other context, and Deloitte accepts no responsibility for its use in either regard.
The Final Report is provided exclusively for The Social Progress Imperative’s use under the terms of the Contract. No party other than The Social Progress Imperative, is entitled to rely on the Final Report for any purpose whatsoever and Deloitte accepts no responsibility or liability or duty of care to any party other than The Social Progress Imperative in respect of the Final Report or any of its contents.
The information contained in the Final Report has been obtained from The Social Progress Imperative and third party sources that are clearly referenced in the appropriate sections of the Final Report. Deloitte has neither sought to corroborate this information nor to review its overall reasonableness. Further, any results from the analysis contained in the Final Report are reliant on the information available at the time of writing the Final Report and should not be relied upon in subsequent periods.
All copyright and other proprietary rights in the Final Report remain the property of Deloitte LLP and any rights not expressly granted in these terms or in the Contract are reserved.
Any decision to invest, conduct business, enter or exit the markets considered in the Final Report should be made solely on independent advice and no information in the Final Report should be relied upon in any way by any third party. This Final Report and its contents do not constitute financial or other professional advice, and specific advice should be sought about your specific circumstances. In particular, the Final Report does not constitute a recommendation or endorsement by Deloitte to invest or participate in, exit, or otherwise use any of the markets or companies referred to in it. To the fullest extent possible, both Deloitte and The Social Progress Imperative disclaim any liability arising out of the use (or non-use) of the Final Report and its contents, including any action or decision taken as a result of such use (or non-use).
Foreword 1
Executive summary 3
1. Introduction 7
2. What could social progress look like in 2030? 11
3. Delivering social progress beyond economic growth: the experience of the social progress leaders 16
4. The ‘big six’ opportunities for social progress growth 20
5. How governments and business can help deliver social progress beyond economic growth 28
Appendix A. Data, methodology and results 29
Contacts 39
Endnotes 40
To start a new section, hold down the apple+shift keys and click
to release this object and type the section title in the box below.
Social Progress in 2030 Developing beyond economic growth 1
Foreword
The new Global Goals agreed by the United Nations are a profound statement of who we, humanity, want to be. We want a world where everyone has not just the basic needs of survival but also the capabilities and freedoms to live to their potential, on a planet that is sustainable.
The Global Goals are the ‘What?’. Now the debate must turn to the ‘How?’. This report is a contribution to that urgent, critical debate. Based on what we know about the relationship between GDP per capita and social progress, this report shows that, though economic growth is necessary to achieve the Global Goals, it is far from sufficient. There needs to be a productivity revolution in the creation of social progress over the next 15 years if we are to stand a chance of meeting the Global Goals’ ambitious vision for our world. This is the challenge of creating inclusive growth with shared prosperity, rather than growth that benefits just a few.
Can the world achieve this social progress productivity revolution? Some countries have already done so. Even at relatively modest levels of GDP per capita some countries, such as Costa Rica, have reached high levels of social progress for their populations. GDP is not destiny. We have many of the solutions already.
There are policies, programmes and technologies that are already being implemented that, if scaled globally, could drive massive improvements in human wellbeing. And most of all we need governments, business and
civil society to work together to bring about these solutions and drive change.
The Social Progress Imperative is honoured to partner with Deloitte on this report. We are delighted that the Social Progress Index can provide such important insight about how to achieve the Global Goals. Yet we recognise that this is just the beginning of that debate. As we track performance on the Social Progress Index over time we are hopeful that it will continue to inform the choices that the countries of the world need to make to ensure sustained inclusive development for all.
The Global Goals represent a historic opportunity to align the governments of the world with businesses and civil society to deliver a giant leap forward for humanity by 2030. We need to make new choices and forge new partnerships if we are to seize this opportunity. This report shows the way.
There are policies, programmes and technologies that are already being implemented that, if scaled globally, could drive massive improvements in human wellbeing.
Michael Green Executive Director The Social Progress Imperative
To start a new section, hold down the apple+shift keys and click
to release this object and type the section title in the box below.
2
To start a new section, hold down the apple+shift keys and click
to release this object and type the section title in the box below.
Social Progress in 2030 Developing beyond economic growth 3
Executive summary
To deliver inclusive growth, policy makers, businesses and global institutions need to look beyond economic performance. As the United Nations (UN) launch a new set of Global Goals for 2030, it is important to recognise that economic growth alone may not be sufficient to achieve these goals, and innovative approaches will be required to deliver social progress. Taking a holistic view on inclusive growth to encompass social and economic growth can help governments focus their policy-making to achieve the Global Goals and support businesses in delivering economic and social value to societies, ultimately promoting shared prosperity.
The UN Global Goals build upon the success of the Millennium Development Goals that set the agenda for social development for the period 2001 to 2015. According to many observers, the level of economic growth that helped raise income levels in countries such as China and India was key to achieving these goals, in particular the goal of halving the number of people living in extreme poverty.
Will economic growth be sufficient to support the new Global Goals?
Using the Social Progress Index (SPI) and its relationship with economic growth today can provide an indication of how social progress may develop over time. Under the assumption that the current relationship will hold, the results are not encouraging.
If the same relationship between GDP per capita and social progress, as indicated by the SPI, continues to hold in the future as countries’ incomes grow, the forecast income increases are unlikely to be associated with notable social progress improvements by 2030.
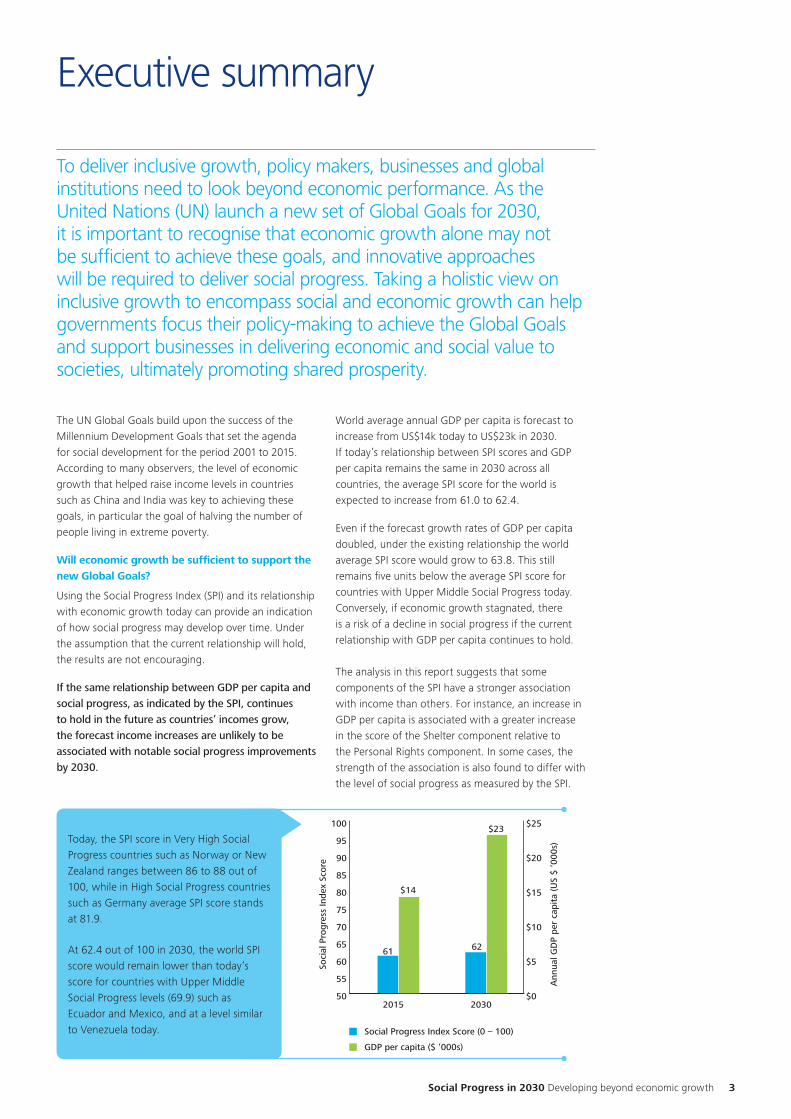
World average annual GDP per capita is forecast to increase from US$14k today to US$23k in 2030. If today’s relationship between SPI scores and GDP per capita remains the same in 2030 across all countries, the average SPI score for the world is expected to increase from 61.0 to 62.4.
Even if the forecast growth rates of GDP per capita doubled, under the existing relationship the world average SPI score would grow to 63.8. This still remains five units below the average SPI score for countries with Upper Middle Social Progress today. Conversely, if economic growth stagnated, there is a risk of a decline in social progress if the current relationship with GDP per capita continues to hold.
The analysis in this report suggests that some components of the SPI have a stronger association with income than others. For instance, an increase in GDP per capita is associated with a greater increase in the score of the Shelter component relative to the Personal Rights component. In some cases, the strength of the association is also found to differ with the level of social progress as measured by the SPI.
Today, the SPI score in Very High Social Progress countries such as Norway or New Zealand ranges between 86 to 88 out of 100, while in High Social Progress countries such as Germany average SPI score stands at 81.9.
At 62.4 out of 100 in 2030, the world SPI score would remain lower than today’s score for countries with Upper Middle Social Progress levels (69.9) such as Ecuador and Mexico, and at a level similar to Venezuela today.
50
55
60
65
70
75
80
85
90
95
100
20302015
Social Progress Index Score (0 – 100)
GDP per capita ($ ‘000s)
61 62
$14
$23
$0
$5
$10
$15
$20
$25
Soci
al P
rogr
ess
Inde
x Sc
ore
Ann
ual G
DP
per
capi
ta (U
S $
‘000
s)
To start a new section, hold down the apple+shift keys and click
to release this object and type the section title in the box below.
4
Key to these findings is that countries with Low Social Progress show a weaker link between the SPI and economic growth. While social progress relating to Basic Human Needs is shown to have some association with economic growth, areas related to Opportunity and Foundations of Wellbeing aspects of social progress are influenced by factors that go beyond mere income increases. Unless countries manage to develop progress in these areas more effectively, there is a risk that greater social progress may not materialise and ultimately risk the achievement of the Global Goals.
How can countries deliver social progress beyond economic growth?
GDP is only one of many factors that can lead to higher social progress; appropriate policies, institutions and investment are also critical. There are a number of countries, for example Costa Rica and Rwanda, that are already experiencing higher levels of social progress than may be expected given their GDP per capita levels. With a SPI score of 77.9, Costa Rica is regarded a High Social Progress country with a GDP per capita of $13k, compared to the Republic of Korea which has a similar SPI score (77.7) but a current GDP per capita of $33k.
If more countries managed to change the existing pattern and follow the path of those countries that are successfully delivering social progress today, substantial achievements could be realised globally.
The SPI rating of Costa Rica relates to a combination of different policies and actions from government, businesses and international organisations, creating the first universal social security system in Latin America, declaring education compulsory and free for all its citizens in 1869, and supporting the environment.
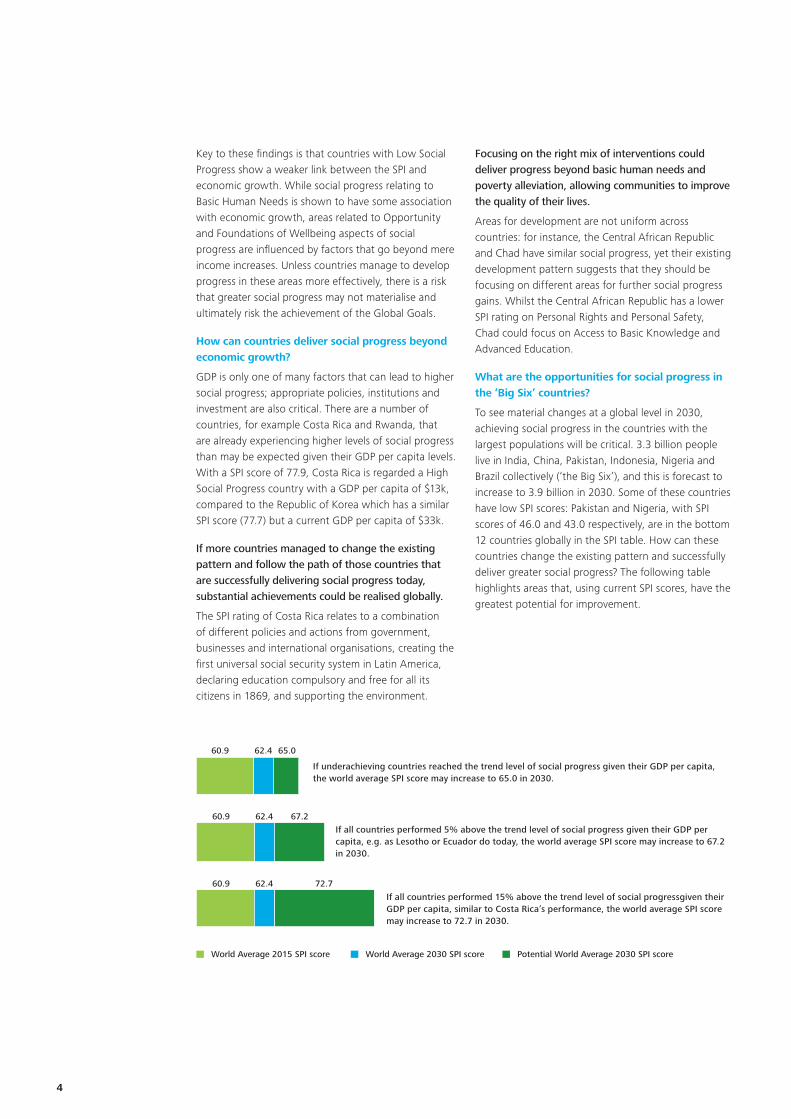
World Average 2015 SPI score
60.9 62.4 65.0
60.9 62.4 67.2
60.9 62.4 72.7
World Average 2030 SPI score Potential World Average 2030 SPI score
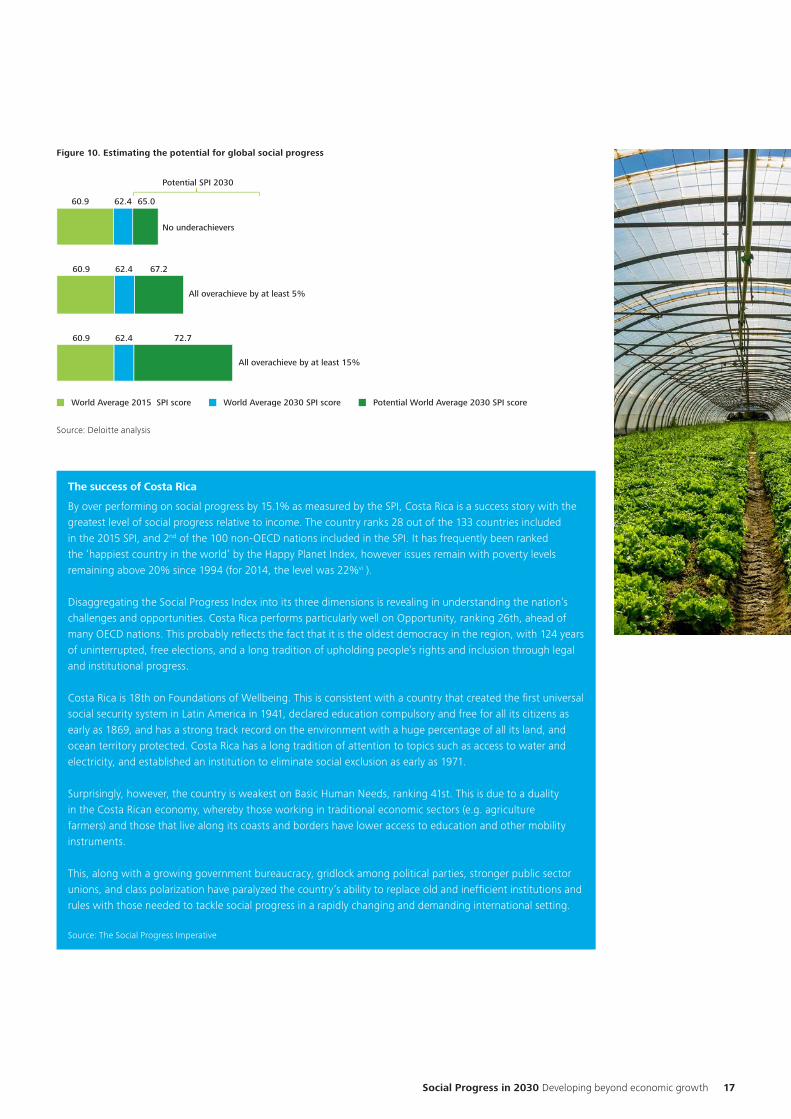
If underachieving countries reached the trend level of social progress given their GDP per capita, the world average SPI score may increase to 65.0 in 2030.
If all countries performed 5% above the trend level of social progress given their GDP per capita, e.g. as Lesotho or Ecuador do today, the world average SPI score may increase to 67.2 in 2030.
If all countries performed 15% above the trend level of social progress given their GDP per capita, similar to Costa Rica’s performance, the world average SPI score may increase to 72.7 in 2030.
Focusing on the right mix of interventions could deliver progress beyond basic human needs and poverty alleviation, allowing communities to improve the quality of their lives.
Areas for development are not uniform across countries: for instance, the Central African Republic and Chad have similar social progress, yet their existing development pattern suggests that they should be focusing on different areas for further social progress gains. Whilst the Central African Republic has a lower SPI rating on Personal Rights and Personal Safety, Chad could focus on Access to Basic Knowledge and Advanced Education.
What are the opportunities for social progress in the ‘Big Six’ countries?
To see material changes at a global level in 2030, achieving social progress in the countries with the largest populations will be critical. 3.3 billion people live in India, China, Pakistan, Indonesia, Nigeria and Brazil collectively (‘the Big Six’), and this is forecast to increase to 3.9 billion in 2030. Some of these countries have low SPI scores: Pakistan and Nigeria, with SPI scores of 46.0 and 43.0 respectively, are in the bottom 12 countries globally in the SPI table. How can these countries change the existing pattern and successfully deliver greater social progress? The following table highlights areas that, using current SPI scores, have the greatest potential for improvement.
To start a new section, hold down the apple+shift keys and click
to release this object and type the section title in the box below.
Foundations of WellbeingBasic Human Needs Opportunity
Social Progress in 2030 Developing beyond economic growth 5
2015 2030
To achieve current trend To achieve 5% above trend
Weaknesses Priority component 1 Priority component 2 Priority component 1 Priority component 2
India
• Access to Information and Communications
• Health & Wellness• Ecosystem Sustainability• Tolerance & Inclusion
Shelter (19%) Water & Sanitation (18%)
Tolerance & Inclusion (41%)
Access to Advanced Education (24%)
China
• Access to Information and Communications
• Health & Wellness• Personal Rights• Tolerance & Inclusion
Access to Advanced Education (23%)
Water & Sanitation (15%)
Personal Rights (918%) Tolerance & Inclusion (52%)
Indonesia
• Water & Sanitation• Access to Information and
Communications• Tolerance & Inclusion
Access to Advanced Education (17%)
Water & Sanitation (14%)
Water & Sanitation (70%)
Tolerance & Inclusion (63%)
Nigeria
• Nutrition & Basic Medical• Water & Sanitation• Shelter• Personal Safety• Access to Basic Knowledge• Personal Rights• Personal Freedom• Tolerance & Inclusion
Water & Sanitation (18%)
Access to Advanced Education (14%)
Water & Sanitation (103%)
Personal Safety (94%)
Pakistan
• Personal Safety• Access to Basic Knowledge• Access to Information and
Communications• Ecosystem Sustainability• Personal Rights• Personal Freedom• Tolerance & Inclusion
Access to Advanced Education (12%)
Shelter (9%) Tolerance & Inclusion (121%)
Access to Basic Knowledge (40%)
BrazilPersonal Safety Access to Advanced
Education (9%)Personal Safety (6%) Personal Safety (87%) Access to Advanced
Education (15%)
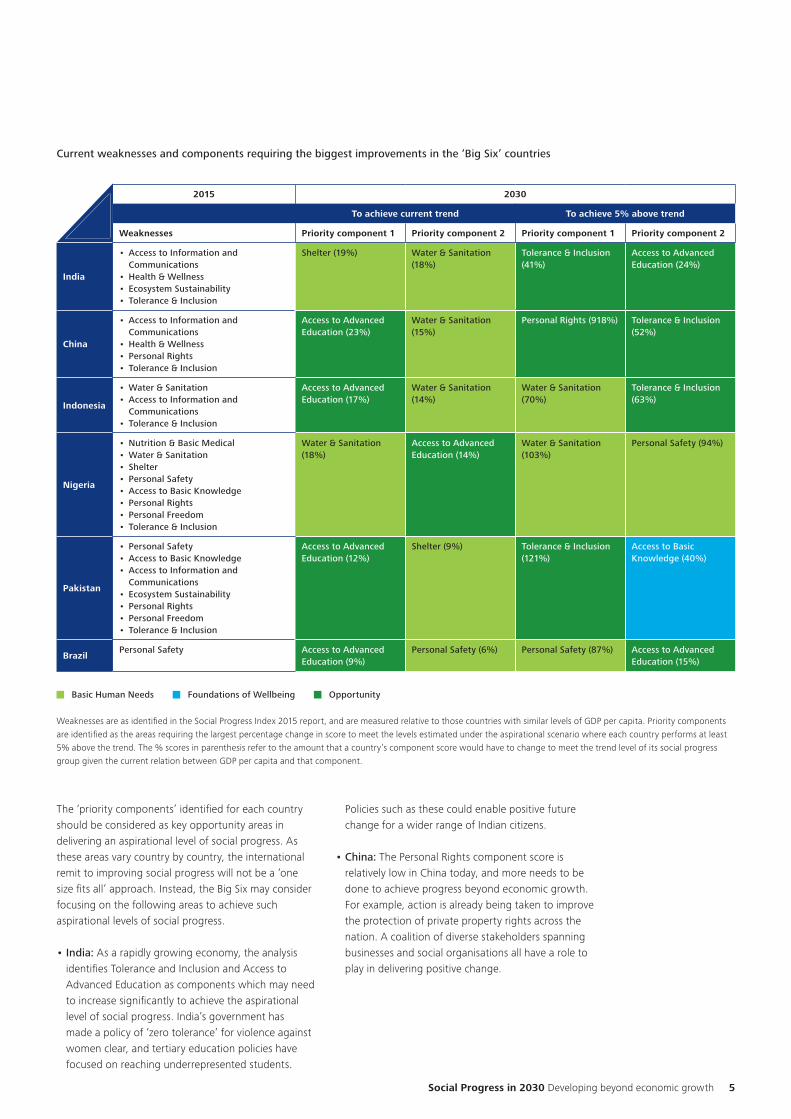
Current weaknesses and components requiring the biggest improvements in the ‘Big Six’ countries
The ‘priority components’ identified for each country should be considered as key opportunity areas in delivering an aspirational level of social progress. As these areas vary country by country, the international remit to improving social progress will not be a ‘one size fits all’ approach. Instead, the Big Six may consider focusing on the following areas to achieve such aspirational levels of social progress.
• India: As a rapidly growing economy, the analysis identifies Tolerance and Inclusion and Access to Advanced Education as components which may need to increase significantly to achieve the aspirational level of social progress. India’s government has made a policy of ‘zero tolerance’ for violence against women clear, and tertiary education policies have focused on reaching underrepresented students.
Policies such as these could enable positive future change for a wider range of Indian citizens.
• China: The Personal Rights component score is relatively low in China today, and more needs to be done to achieve progress beyond economic growth. For example, action is already being taken to improve the protection of private property rights across the nation. A coalition of diverse stakeholders spanning businesses and social organisations all have a role to play in delivering positive change.
Weaknesses are as identified in the Social Progress Index 2015 report, and are measured relative to those countries with similar levels of GDP per capita. Priority components are identified as the areas requiring the largest percentage change in score to meet the levels estimated under the aspirational scenario where each country performs at least 5% above the trend. The % scores in parenthesis refer to the amount that a country’s component score would have to change to meet the trend level of its social progress group given the current relation between GDP per capita and that component.
To start a new section, hold down the apple+shift keys and click
to release this object and type the section title in the box below.
6
• Indonesia: Ambitious plans are already in place in Indonesia to tackle the component requiring the greatest improvement in the country, Water and Sanitation. The potential for change is not significant under the current association between this component and GDP per capita; to make significant progress, the analysis indicates that innovative solutions need to be considered.
• Nigeria: Tackling the Water and Sanitation and Personal Safety components will be integral to the social development of Nigeria. While the economy is anticipated to experience annual economic growth of around 3%, a number of additional efforts will be required to ensure that the whole population has access to clean drinking water and sanitary living environments. Further, stabilising terror activity in the region will be important to achieving inclusive growth.
• Pakistan: The SPI score for Tolerance and Inclusion in Pakistan is the lowest of all countries in the SPI. International support has already enabled initiatives that promote religious tolerance, for instance through youth programmes that encourage tolerance among young people.
• Brazil: Personal Safety is identified as a weakness for Brazil by the SPI, and this area would require the greatest improvement if the country were to achieve an aspirational SPI score. Government expenditure to support safety may be complemented by private forces in improving social progress in this area, especially leading up to the 2016 Olympic Games.
Inviting a debate on the role of governments and business to deliver inclusive growth
Relying on economic growth to achieve the ambitious Global Goals may not be sufficient: more research needs to be undertaken to understand how over performers have driven progress, and what other technological or macroeconomic developments can support social progress to 2030. Recognising the importance of alternative approaches, a coalition of stakeholders spanning different sections of society needs to co-ordinate efforts to make the Global Goals achievable.
Government expenditure and policy support will remain critical. National governments could support areas such as Water and Sanitation (priority for Indonesia and Nigeria) and Access to Basic Knowledge (priority for Pakistan) through greater expenditure on infrastructure and funding for schools, including investment in more rural and remote regions.
Broader culture changes will be required to drive policy and societal changes. Areas such as Tolerance and Inclusion may only see real change through a broader cultural shift. Cultural change may also complement areas of government funding, for instance by improving attitudes towards Water and Sanitation as is the case with UNICEF’s Water, Sanitation and Hygiene programme in Nigeria.
Support from NGOs and international organisations may prioritise one of the problem areas. Despite rapid growth, these countries can still be heavily reliant on external support. There are numerous examples of NGOs that support social progress worldwide: in Pakistan, NGOs have mediated conflict resolution at the community level, thus contributing to improving Personal Safety. This has helped in remedying disputes over access to land or infrastructure, with a particular focus on involving women in the peacebuilding process.
Private sector participation could complement the public sector action. The provision of certain services through state organisations may be complemented by organisations using their expertise and delivering their core products and services. For example, to support greater Access to Advanced Education in India, the private sector will continue to play a significant role in the expansion of higher education where it currently accounts for 58% of all tertiary enrolment and is growing rapidly. Delivery of basic knowledge and improving connections between Low Social Progress countries and the rest of the world may be encouraged through the provision of mobile internet by communications multinationals, and a number of NGOs could offer guidance on this working in conjunction with business.
The Social Progress Imperative and Deloitte recognise that this study is just a starting point for a critical debate on how different organisations can contribute to achieve the Global Goals. We are inviting others to join the debate to advance the discussion and suggest critical policies and actions to achieve truly inclusive growth.
Relying on economic growth to achieve the ambitious Global Goals may not be sufficient: more research needs to be undertaken to understand how over performers have driven progress, and what other technological or macroeconomic developments can support social progress.
To start a new section, hold down the apple+shift keys and click
to release this object and type the section title in the box below.
Social Progress in 2030 Developing beyond economic growth 7
By employing the relationship that holds between today’s SPI (and its components) scores and GDP per capita, SPI (and component) forecast scores merely indicate the expected level of social progress under the assumption that today’s relationship between GDP per capita and SPI scores will continue to hold in the future as countries’ income grows.
The forecast growth data used for this analysis has been obtained from sources external to Deloitte, with the chosen sources guided and agreed on by the Social Progress Imperative. Throughout this report, one should recognise the limitations in long-term forecasting and that the estimates would improve in accuracy with regular updates.
The appendix for this paper provides more details on the methodology and data employed.
1.3 About the Social Progress Index
The unique structure of the SPI captures the many facets of social and environmental performance. By not including any economic measure, it enables a more accurate understanding of the relationship between economic development and social progress.
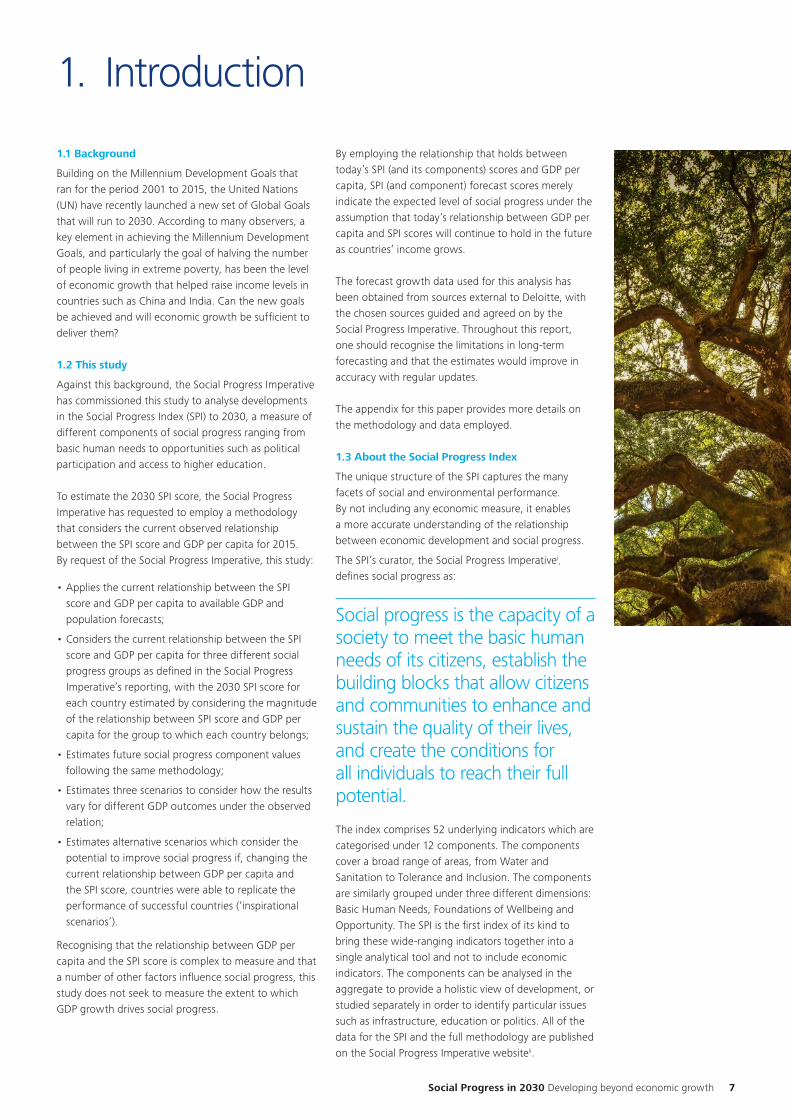
The SPI’s curator, the Social Progress Imperativei, defines social progress as:
Social progress is the capacity of a society to meet the basic human needs of its citizens, establish the building blocks that allow citizens and communities to enhance and sustain the quality of their lives, and create the conditions for all individuals to reach their full potential.
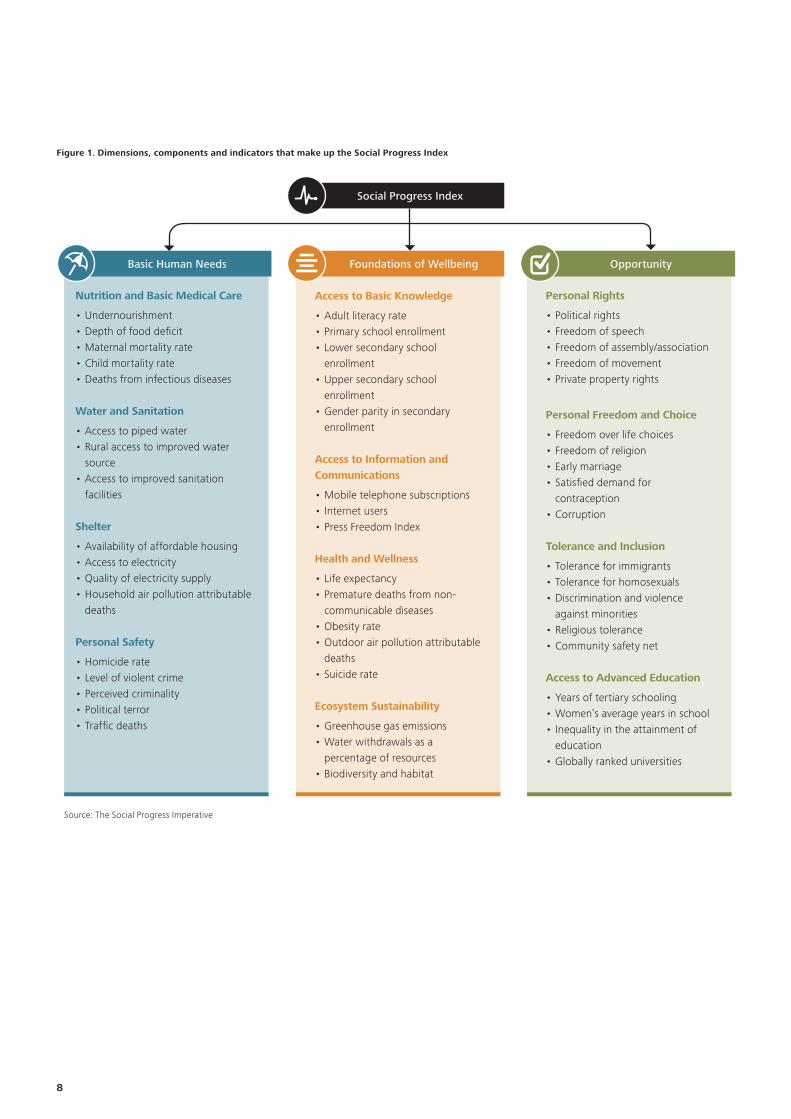
The index comprises 52 underlying indicators which are categorised under 12 components. The components cover a broad range of areas, from Water and Sanitation to Tolerance and Inclusion. The components are similarly grouped under three different dimensions: Basic Human Needs, Foundations of Wellbeing and Opportunity. The SPI is the first index of its kind to bring these wide-ranging indicators together into a single analytical tool and not to include economic indicators. The components can be analysed in the aggregate to provide a holistic view of development, or studied separately in order to identify particular issues such as infrastructure, education or politics. All of the data for the SPI and the full methodology are published on the Social Progress Imperative websiteii.
1. Introduction
1.1 Background
Building on the Millennium Development Goals that ran for the period 2001 to 2015, the United Nations (UN) have recently launched a new set of Global Goals that will run to 2030. According to many observers, a key element in achieving the Millennium Development Goals, and particularly the goal of halving the number of people living in extreme poverty, has been the level of economic growth that helped raise income levels in countries such as China and India. Can the new goals be achieved and will economic growth be sufficient to deliver them?
1.2 This study
Against this background, the Social Progress Imperative has commissioned this study to analyse developments in the Social Progress Index (SPI) to 2030, a measure of different components of social progress ranging from basic human needs to opportunities such as political participation and access to higher education.
To estimate the 2030 SPI score, the Social Progress Imperative has requested to employ a methodology that considers the current observed relationship between the SPI score and GDP per capita for 2015. By request of the Social Progress Imperative, this study:
• Applies the current relationship between the SPI score and GDP per capita to available GDP and population forecasts;
• Considers the current relationship between the SPI score and GDP per capita for three different social progress groups as defined in the Social Progress Imperative’s reporting, with the 2030 SPI score for each country estimated by considering the magnitude of the relationship between SPI score and GDP per capita for the group to which each country belongs;
• Estimates future social progress component values following the same methodology;
• Estimates three scenarios to consider how the results vary for different GDP outcomes under the observed relation;
• Estimates alternative scenarios which consider the potential to improve social progress if, changing the current relationship between GDP per capita and the SPI score, countries were able to replicate the performance of successful countries (‘inspirational scenarios’).
Recognising that the relationship between GDP per capita and the SPI score is complex to measure and that a number of other factors influence social progress, this study does not seek to measure the extent to which GDP growth drives social progress.
To start a new section, hold down the apple+shift keys and click
to release this object and type the section title in the box below.
8
Nutrition and Basic Medical Care
• Undernourishment • Depth of food deficit • Maternal mortality rate • Child mortality rate• Deaths from infectious diseases
Water and Sanitation
• Access to piped water• Rural access to improved water
source• Access to improved sanitation
facilities
Shelter
• Availability of affordable housing• Access to electricity • Quality of electricity supply• Household air pollution attributable
deaths
Personal Safety
• Homicide rate • Level of violent crime• Perceived criminality • Political terror • Traffic deaths
Access to Basic Knowledge
• Adult literacy rate • Primary school enrollment • Lower secondary school
enrollment • Upper secondary school
enrollment • Gender parity in secondary
enrollment
Access to Information and Communications
• Mobile telephone subscriptions • Internet users • Press Freedom Index
Health and Wellness
• Life expectancy • Premature deaths from non-
communicable diseases • Obesity rate• Outdoor air pollution attributable
deaths• Suicide rate
Ecosystem Sustainability
• Greenhouse gas emissions• Water withdrawals as a
percentage of resources • Biodiversity and habitat
Personal Rights
• Political rights • Freedom of speech• Freedom of assembly/association• Freedom of movement • Private property rights
Personal Freedom and Choice
• Freedom over life choices • Freedom of religion• Early marriage• Satisfied demand for
contraception • Corruption
Tolerance and Inclusion
• Tolerance for immigrants • Tolerance for homosexuals• Discrimination and violence
against minorities• Religious tolerance• Community safety net
Access to Advanced Education
• Years of tertiary schooling • Women’s average years in school • Inequality in the attainment of
education • Globally ranked universities
Social Progress Index
Basic Human Needs Foundations of Wellbeing Opportunity
Source: The Social Progress Imperative
Figure 1. Dimensions, components and indicators that make up the Social Progress Index
To start a new section, hold down the apple+shift keys and click
to release this object and type the section title in the box below.
Social Progress in 2030 Developing beyond economic growth 9
1.4 The SPI and the Global Goals
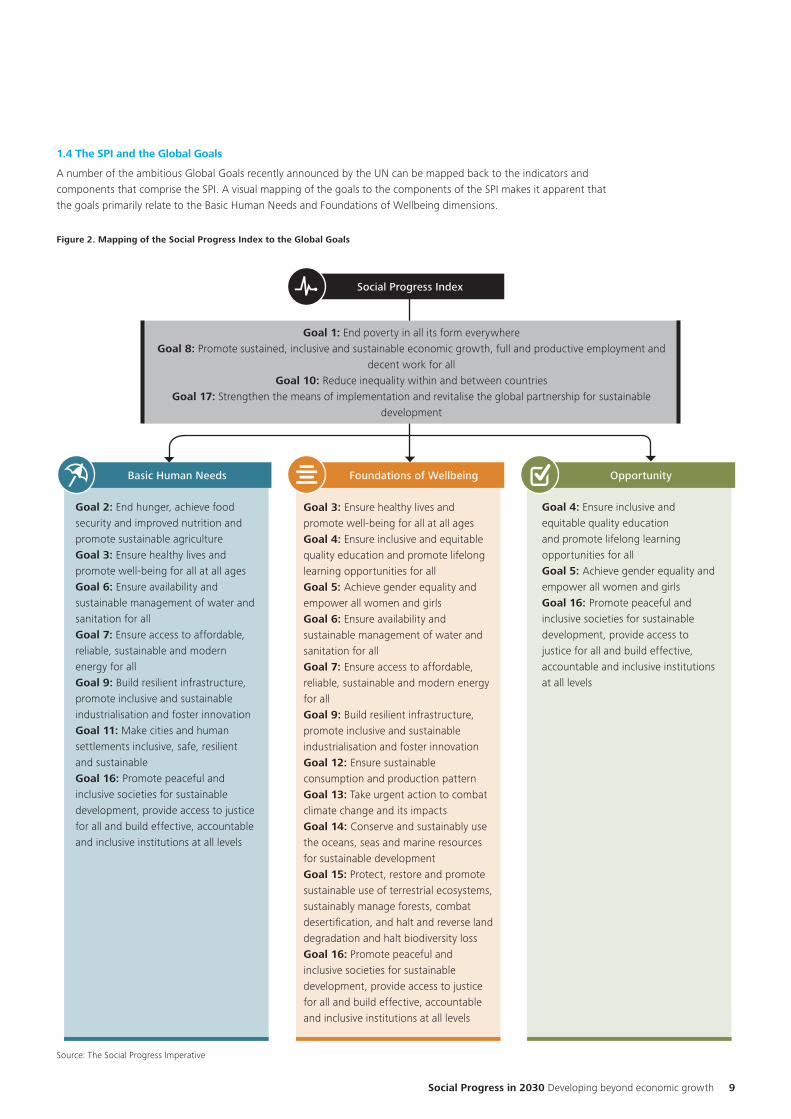
A number of the ambitious Global Goals recently announced by the UN can be mapped back to the indicators and components that comprise the SPI. A visual mapping of the goals to the components of the SPI makes it apparent that the goals primarily relate to the Basic Human Needs and Foundations of Wellbeing dimensions.
Figure 2. Mapping of the Social Progress Index to the Global Goals
Goal 1: End poverty in all its form everywhere Goal 8: Promote sustained, inclusive and sustainable economic growth, full and productive employment and
decent work for allGoal 10: Reduce inequality within and between countries
Goal 17: Strengthen the means of implementation and revitalise the global partnership for sustainable development
Goal 2: End hunger, achieve food security and improved nutrition and promote sustainable agricultureGoal 3: Ensure healthy lives and promote well-being for all at all agesGoal 6: Ensure availability and sustainable management of water and sanitation for allGoal 7: Ensure access to affordable, reliable, sustainable and modern energy for allGoal 9: Build resilient infrastructure, promote inclusive and sustainable industrialisation and foster innovationGoal 11: Make cities and human settlements inclusive, safe, resilient and sustainableGoal 16: Promote peaceful and inclusive societies for sustainable development, provide access to justice for all and build effective, accountable and inclusive institutions at all levels
Goal 3: Ensure healthy lives and promote well-being for all at all agesGoal 4: Ensure inclusive and equitable quality education and promote lifelong learning opportunities for allGoal 5: Achieve gender equality and empower all women and girlsGoal 6: Ensure availability and sustainable management of water and sanitation for allGoal 7: Ensure access to affordable, reliable, sustainable and modern energy for allGoal 9: Build resilient infrastructure, promote inclusive and sustainable industrialisation and foster innovationGoal 12: Ensure sustainable consumption and production patternGoal 13: Take urgent action to combat climate change and its impactsGoal 14: Conserve and sustainably use the oceans, seas and marine resources for sustainable developmentGoal 15: Protect, restore and promote sustainable use of terrestrial ecosystems, sustainably manage forests, combat desertification, and halt and reverse land degradation and halt biodiversity lossGoal 16: Promote peaceful and inclusive societies for sustainable development, provide access to justice for all and build effective, accountable and inclusive institutions at all levels
Goal 4: Ensure inclusive and equitable quality education and promote lifelong learning opportunities for allGoal 5: Achieve gender equality and empower all women and girlsGoal 16: Promote peaceful and inclusive societies for sustainable development, provide access to justice for all and build effective, accountable and inclusive institutions at all levels
Social Progress Index
Basic Human Needs Foundations of Wellbeing Opportunity
Source: The Social Progress Imperative
To start a new section, hold down the apple+shift keys and click
to release this object and type the section title in the box below.
10
The Millennium Development Goals that marked the start of the century arguably saw success in providing the building blocks from which to cultivate social progress. For 2015, the average world SPI performance scored best on Nutrition and Basic Medical Care (87.47) and Access to Basic Knowledge (85.98). Both of these scores highlight the important progress made following the focus on these areas by the Millennium Development Goals.
Reporting by the UN to mark the culmination of the Millennium Development Goals states that for the period 1990 to 2015, the proportion of undernourished people in developing regions (where 780 million people of the 795 million people classified as undernourished live) fell by almost half, from 23.3% to 12.9%.
The new Global Goals intend to go further in encouraging inclusive growth. There is an increase in overlap with the Opportunity dimension, which indicates that the Global Goals focus more on the Opportunity dimension than the Millennium Development Goals. This move has the potential to capture those countries where low scores in components related to equality and inclusive societies may be suppressing social progress.
This shift may be necessary to improve the social progress of certain countries. While the Millennium Development Goals tackled issues that were addressed more easily by economic growth, the Global Goals may be harder to achieve through economic growth alone; the roots of the components of the Opportunity dimension may be embedded in cultural or societal beliefs that are harder to alter.
To start a new section, hold down the apple+shift keys and click
to release this object and type the section title in the box below.
Social Progress in 2030 Developing beyond economic growth 11
2.1 World social progress in 2030 and economic growth
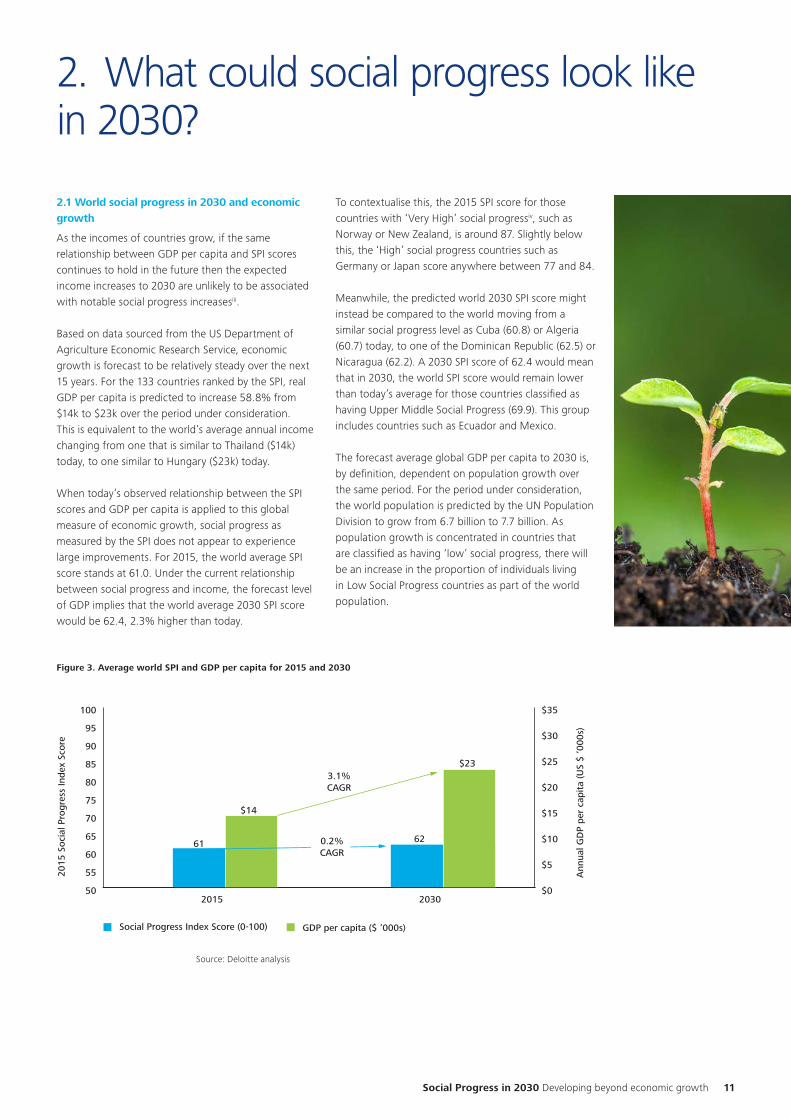
As the incomes of countries grow, if the same relationship between GDP per capita and SPI scores continues to hold in the future then the expected income increases to 2030 are unlikely to be associated with notable social progress increasesiii.
Based on data sourced from the US Department of Agriculture Economic Research Service, economic growth is forecast to be relatively steady over the next 15 years. For the 133 countries ranked by the SPI, real GDP per capita is predicted to increase 58.8% from $14k to $23k over the period under consideration. This is equivalent to the world’s average annual income changing from one that is similar to Thailand ($14k) today, to one similar to Hungary ($23k) today.
When today’s observed relationship between the SPI scores and GDP per capita is applied to this global measure of economic growth, social progress as measured by the SPI does not appear to experience large improvements. For 2015, the world average SPI score stands at 61.0. Under the current relationship between social progress and income, the forecast level of GDP implies that the world average 2030 SPI score would be 62.4, 2.3% higher than today.
To contextualise this, the 2015 SPI score for those countries with ‘Very High’ social progressiv, such as Norway or New Zealand, is around 87. Slightly below this, the ‘High’ social progress countries such as Germany or Japan score anywhere between 77 and 84.
Meanwhile, the predicted world 2030 SPI score might instead be compared to the world moving from a similar social progress level as Cuba (60.8) or Algeria (60.7) today, to one of the Dominican Republic (62.5) or Nicaragua (62.2). A 2030 SPI score of 62.4 would mean that in 2030, the world SPI score would remain lower than today’s average for those countries classified as having Upper Middle Social Progress (69.9). This group includes countries such as Ecuador and Mexico.
The forecast average global GDP per capita to 2030 is, by definition, dependent on population growth over the same period. For the period under consideration, the world population is predicted by the UN Population Division to grow from 6.7 billion to 7.7 billion. As population growth is concentrated in countries that are classified as having ‘low’ social progress, there will be an increase in the proportion of individuals living in Low Social Progress countries as part of the world population.
2. What could social progress look like in 2030?
Figure 3. Average world SPI and GDP per capita for 2015 and 2030
Source: Deloitte analysis
50
55
60
65
70
75
80
85
90
95
100
20302015
Social Progress Index Score (0-100) GDP per capita ($ ‘000s)
61 62
$14
$23
$0
$5
$10
$15
$20
$25
$30
$35
2015
Soc
ial P
rogr
ess
Inde
x Sc
ore
Ann
ual G
DP
per
capi
ta (U
S $
‘000
s)
0.2%CAGR
3.1%CAGR
To start a new section, hold down the apple+shift keys and click
to release this object and type the section title in the box below.
12
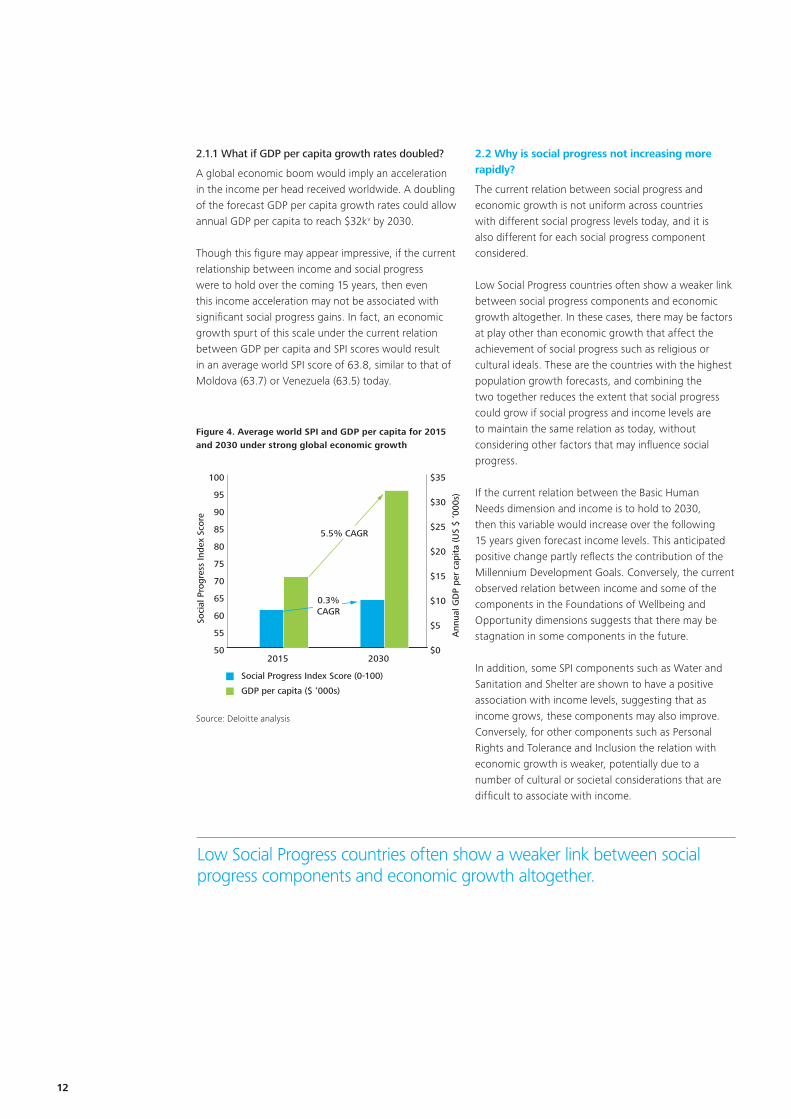
2.1.1 What if GDP per capita growth rates doubled?
A global economic boom would imply an acceleration in the income per head received worldwide. A doubling of the forecast GDP per capita growth rates could allow annual GDP per capita to reach $32kv by 2030.
Though this figure may appear impressive, if the current relationship between income and social progress were to hold over the coming 15 years, then even this income acceleration may not be associated with significant social progress gains. In fact, an economic growth spurt of this scale under the current relation between GDP per capita and SPI scores would result in an average world SPI score of 63.8, similar to that of Moldova (63.7) or Venezuela (63.5) today.
2.2 Why is social progress not increasing more rapidly?
The current relation between social progress and economic growth is not uniform across countries with different social progress levels today, and it is also different for each social progress component considered.
Low Social Progress countries often show a weaker link between social progress components and economic growth altogether. In these cases, there may be factors at play other than economic growth that affect the achievement of social progress such as religious or cultural ideals. These are the countries with the highest population growth forecasts, and combining the two together reduces the extent that social progress could grow if social progress and income levels are to maintain the same relation as today, without considering other factors that may influence social progress.
If the current relation between the Basic Human Needs dimension and income is to hold to 2030, then this variable would increase over the following 15 years given forecast income levels. This anticipated positive change partly reflects the contribution of the Millennium Development Goals. Conversely, the current observed relation between income and some of the components in the Foundations of Wellbeing and Opportunity dimensions suggests that there may be stagnation in some components in the future.
In addition, some SPI components such as Water and Sanitation and Shelter are shown to have a positive association with income levels, suggesting that as income grows, these components may also improve. Conversely, for other components such as Personal Rights and Tolerance and Inclusion the relation with economic growth is weaker, potentially due to a number of cultural or societal considerations that are difficult to associate with income.
Figure 4. Average world SPI and GDP per capita for 2015 and 2030 under strong global economic growth
50
55
60
65
70
75
80
85
90
95
100
20302015
Social Progress Index Score (0-100)
GDP per capita ($ ‘000s)
$0
$5
$10
$15
$20
$25
$30
$35
Soci
al P
rogr
ess
Inde
x Sc
ore
Ann
ual G
DP
per
capi
ta (U
S $
‘000
s)
0.3%CAGR
5.5% CAGR
Source: Deloitte analysis
Low Social Progress countries often show a weaker link between social progress components and economic growth altogether.
To start a new section, hold down the apple+shift keys and click
to release this object and type the section title in the box below.
High socialprogress
Access toAdvancedEducation
Shelter
0.95
0.75
0.980.55
1.06
2.02 0.45
1.13
1.06
Water andSanitation
Middle socialprogress
Low socialprogress
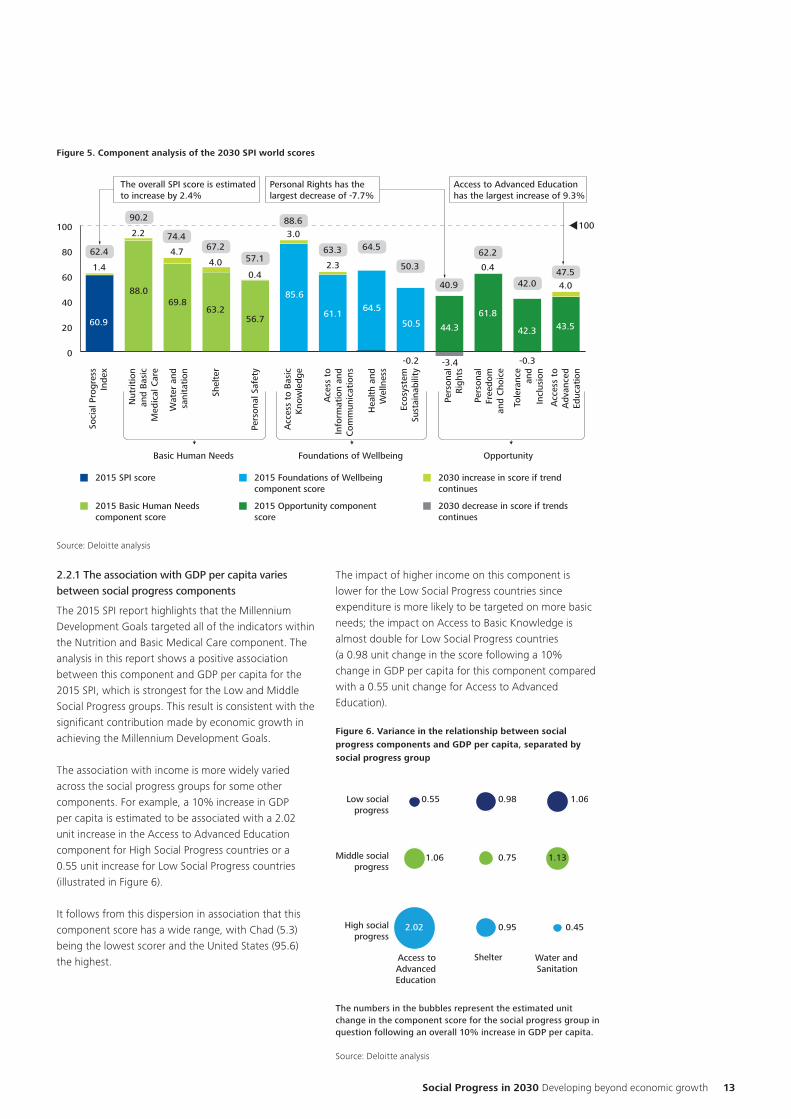
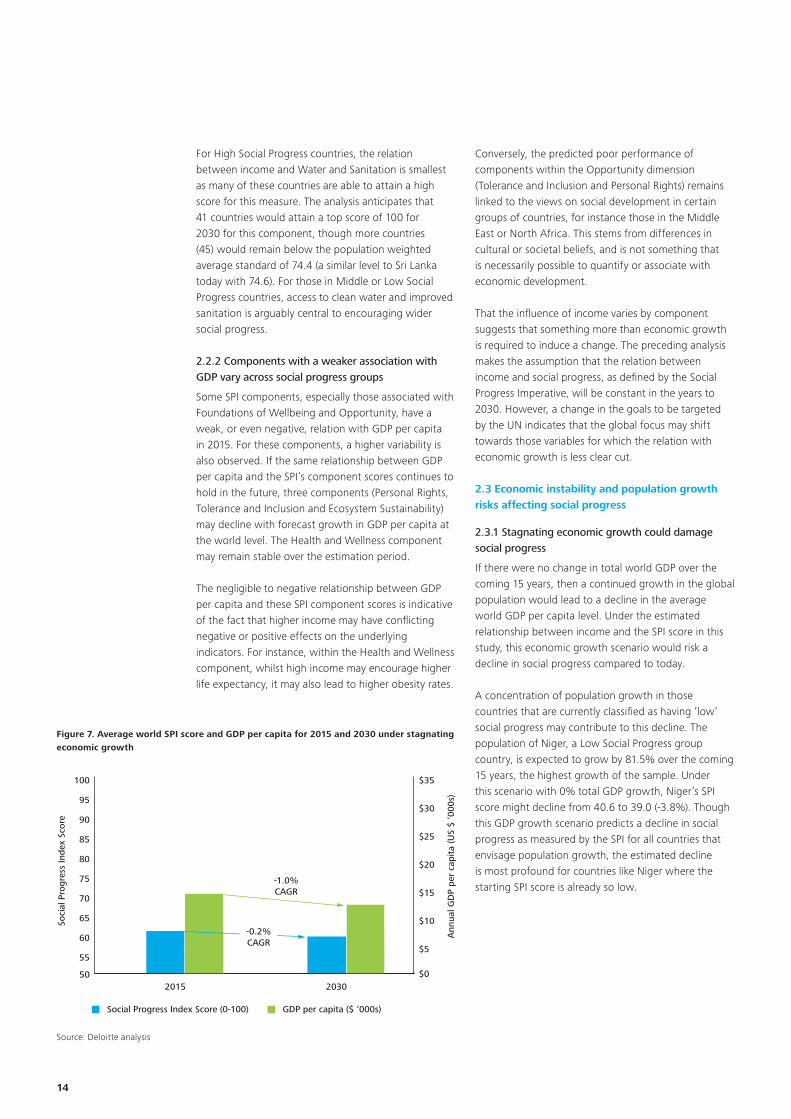
Figure 6. Variance in the relationship between social progress components and GDP per capita, separated by social progress group
The numbers in the bubbles represent the estimated unit change in the component score for the social progress group in question following an overall 10% increase in GDP per capita.
Source: Deloitte analysis
Social Progress in 2030 Developing beyond economic growth 13
Figure 5. Component analysis of the 2030 SPI world scores
0
20
40
60
80
100
60.9
88.069.8
63.256.7
85.6
61.164.5
50.5 44.3
61.8
42.3 43.5
-0.3-3.4-0.2
1.4
2.2
4.74.0
0.4
3.0
2.3 0.4
4.0
100
Basic Human Needs Foundations of Wellbeing
The overall SPI score is estimated to increase by 2.4%
Personal Rights has the largest decrease of -7.7%
Access to Advanced Education has the largest increase of 9.3%
Soci
al P
rogr
ess
Inde
x
Nut
riti
on
and
Bas
ic
Med
ical
Car
e
Wat
er a
nd
sani
tati
on
Shel
ter
Pers
onal
Saf
ety
Acc
ess
to B
asic
K
now
ledg
e
Ace
ss t
o In
form
atio
n an
d C
omm
unic
atio
ns
Hea
lth
and
Wel
lnes
s
Ecos
yste
m
Sust
aina
bilit
y
Pers
onal
R
ight
s
Pers
onal
Fr
eedo
m
and
Cho
ice
Acc
ess
to
Adv
ance
dEd
ucat
ion
Tole
ranc
e an
d In
clus
ion
2015 SPI score 2015 Foundations of Wellbeing component score
2030 increase in score if trend continues
2015 Opportunity component score
2015 Basic Human Needs component score
2030 decrease in score if trends continues
62.4
90.2
74.467.2
57.1
88.6
63.3 64.5
50.3
40.9
62.2
42.047.5
Opportunity
Source: Deloitte analysis
2.2.1 The association with GDP per capita varies between social progress components
The 2015 SPI report highlights that the Millennium Development Goals targeted all of the indicators within the Nutrition and Basic Medical Care component. The analysis in this report shows a positive association between this component and GDP per capita for the 2015 SPI, which is strongest for the Low and Middle Social Progress groups. This result is consistent with the significant contribution made by economic growth in achieving the Millennium Development Goals.
The association with income is more widely varied across the social progress groups for some other components. For example, a 10% increase in GDP per capita is estimated to be associated with a 2.02 unit increase in the Access to Advanced Education component for High Social Progress countries or a 0.55 unit increase for Low Social Progress countries (illustrated in Figure 6).
It follows from this dispersion in association that this component score has a wide range, with Chad (5.3) being the lowest scorer and the United States (95.6) the highest.
The impact of higher income on this component is lower for the Low Social Progress countries since expenditure is more likely to be targeted on more basic needs; the impact on Access to Basic Knowledge is almost double for Low Social Progress countries (a 0.98 unit change in the score following a 10% change in GDP per capita for this component compared with a 0.55 unit change for Access to Advanced Education).
To start a new section, hold down the apple+shift keys and click
to release this object and type the section title in the box below.
For High Social Progress countries, the relation between income and Water and Sanitation is smallest as many of these countries are able to attain a high score for this measure. The analysis anticipates that 41 countries would attain a top score of 100 for 2030 for this component, though more countries (45) would remain below the population weighted average standard of 74.4 (a similar level to Sri Lanka today with 74.6). For those in Middle or Low Social Progress countries, access to clean water and improved sanitation is arguably central to encouraging wider social progress.
2.2.2 Components with a weaker association with GDP vary across social progress groups
Some SPI components, especially those associated with Foundations of Wellbeing and Opportunity, have a weak, or even negative, relation with GDP per capita in 2015. For these components, a higher variability is also observed. If the same relationship between GDP per capita and the SPI’s component scores continues to hold in the future, three components (Personal Rights, Tolerance and Inclusion and Ecosystem Sustainability) may decline with forecast growth in GDP per capita at the world level. The Health and Wellness component may remain stable over the estimation period.
The negligible to negative relationship between GDP per capita and these SPI component scores is indicative of the fact that higher income may have conflicting negative or positive effects on the underlying indicators. For instance, within the Health and Wellness component, whilst high income may encourage higher life expectancy, it may also lead to higher obesity rates.
Conversely, the predicted poor performance of components within the Opportunity dimension (Tolerance and Inclusion and Personal Rights) remains linked to the views on social development in certain groups of countries, for instance those in the Middle East or North Africa. This stems from differences in cultural or societal beliefs, and is not something that is necessarily possible to quantify or associate with economic development.
That the influence of income varies by component suggests that something more than economic growth is required to induce a change. The preceding analysis makes the assumption that the relation between income and social progress, as defined by the Social Progress Imperative, will be constant in the years to 2030. However, a change in the goals to be targeted by the UN indicates that the global focus may shift towards those variables for which the relation with economic growth is less clear cut.
2.3 Economic instability and population growth risks affecting social progress
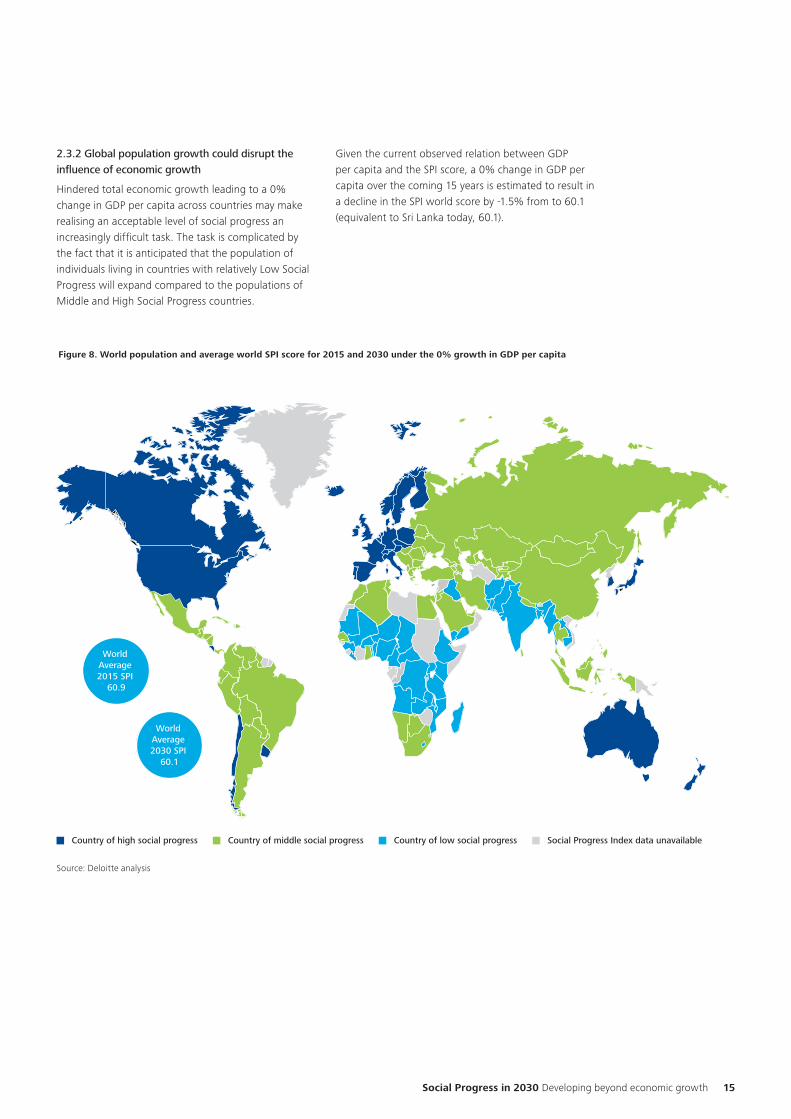
2.3.1 Stagnating economic growth could damage social progress
If there were no change in total world GDP over the coming 15 years, then a continued growth in the global population would lead to a decline in the average world GDP per capita level. Under the estimated relationship between income and the SPI score in this study, this economic growth scenario would risk a decline in social progress compared to today.
A concentration of population growth in those countries that are currently classified as having ‘low’ social progress may contribute to this decline. The population of Niger, a Low Social Progress group country, is expected to grow by 81.5% over the coming 15 years, the highest growth of the sample. Under this scenario with 0% total GDP growth, Niger’s SPI score might decline from 40.6 to 39.0 (-3.8%). Though this GDP growth scenario predicts a decline in social progress as measured by the SPI for all countries that envisage population growth, the estimated decline is most profound for countries like Niger where the starting SPI score is already so low.
50
55
60
65
70
75
80
85
90
95
100
20302015
Social Progress Index Score (0-100) GDP per capita ($ ‘000s)
$0
$5
$10
$15
$20
$25
$30
$35
Soci
al P
rogr
ess
Inde
x Sc
ore
Ann
ual G
DP
per
capi
ta (U
S $
‘000
s)
-0.2%CAGR
-1.0%CAGR
Figure 7. Average world SPI score and GDP per capita for 2015 and 2030 under stagnating economic growth
Source: Deloitte analysis
14
To start a new section, hold down the apple+shift keys and click
to release this object and type the section title in the box below.
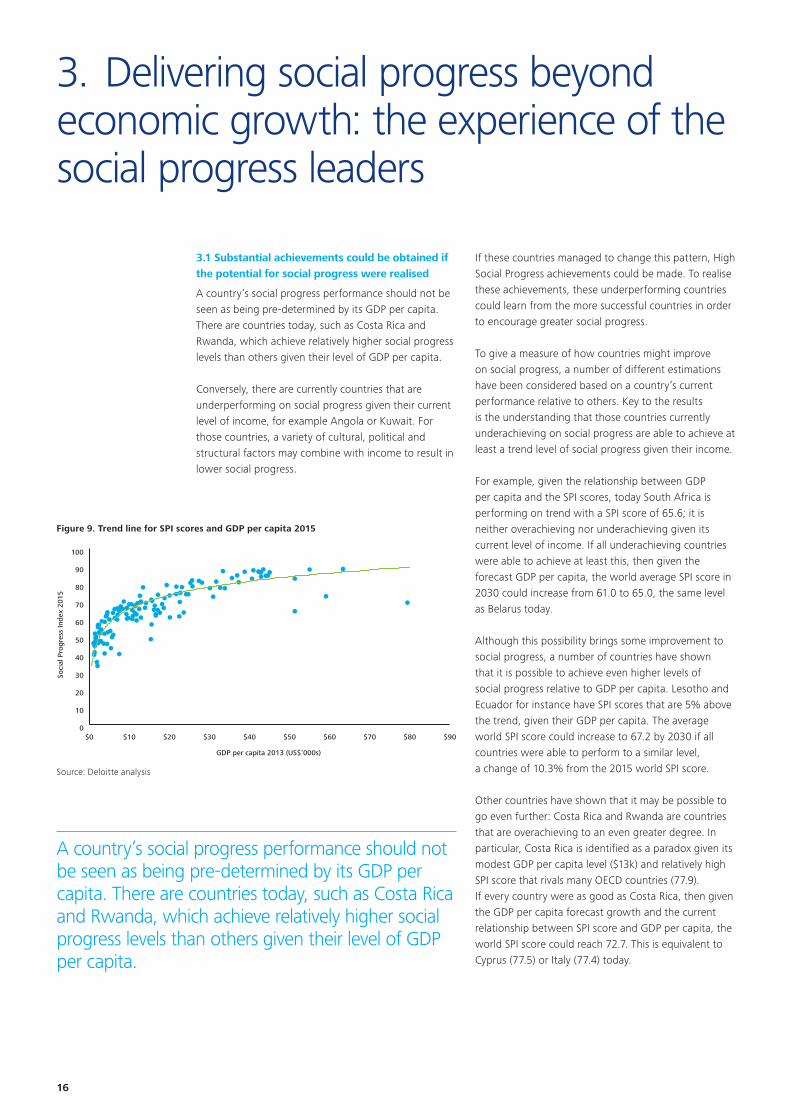
Figure 8. World population and average world SPI score for 2015 and 2030 under the 0% growth in GDP per capita
Source: Deloitte analysis
Social Progress in 2030 Developing beyond economic growth 15
2.3.2 Global population growth could disrupt the influence of economic growth
Hindered total economic growth leading to a 0% change in GDP per capita across countries may make realising an acceptable level of social progress an increasingly difficult task. The task is complicated by the fact that it is anticipated that the population of individuals living in countries with relatively Low Social Progress will expand compared to the populations of Middle and High Social Progress countries.
Country of high social progress Country of middle social progress Country of low social progress Social Progress Index data unavailable
World Average 2015 SPI
60.9
World Average 2030 SPI
60.1
Figure 8 World population and average world SPI score for 2015 and 2030 under the 0% growth in GDP per capita
Given the current observed relation between GDP per capita and the SPI score, a 0% change in GDP per capita over the coming 15 years is estimated to result in a decline in the SPI world score by -1.5% from to 60.1 (equivalent to Sri Lanka today, 60.1).
To start a new section, hold down the apple+shift keys and click
to release this object and type the section title in the box below.
3.1 Substantial achievements could be obtained if the potential for social progress were realised
A country’s social progress performance should not be seen as being pre-determined by its GDP per capita. There are countries today, such as Costa Rica and Rwanda, which achieve relatively higher social progress levels than others given their level of GDP per capita.
Conversely, there are currently countries that are underperforming on social progress given their current level of income, for example Angola or Kuwait. For those countries, a variety of cultural, political and structural factors may combine with income to result in lower social progress.
If these countries managed to change this pattern, High Social Progress achievements could be made. To realise these achievements, these underperforming countries could learn from the more successful countries in order to encourage greater social progress.
To give a measure of how countries might improve on social progress, a number of different estimations have been considered based on a country’s current performance relative to others. Key to the results is the understanding that those countries currently underachieving on social progress are able to achieve at least a trend level of social progress given their income.
For example, given the relationship between GDP per capita and the SPI scores, today South Africa is performing on trend with a SPI score of 65.6; it is neither overachieving nor underachieving given its current level of income. If all underachieving countries were able to achieve at least this, then given the forecast GDP per capita, the world average SPI score in 2030 could increase from 61.0 to 65.0, the same level as Belarus today.
Although this possibility brings some improvement to social progress, a number of countries have shown that it is possible to achieve even higher levels of social progress relative to GDP per capita. Lesotho and Ecuador for instance have SPI scores that are 5% above the trend, given their GDP per capita. The average world SPI score could increase to 67.2 by 2030 if all countries were able to perform to a similar level, a change of 10.3% from the 2015 world SPI score.
Other countries have shown that it may be possible to go even further: Costa Rica and Rwanda are countries that are overachieving to an even greater degree. In particular, Costa Rica is identified as a paradox given its modest GDP per capita level ($13k) and relatively high SPI score that rivals many OECD countries (77.9). If every country were as good as Costa Rica, then given the GDP per capita forecast growth and the current relationship between SPI score and GDP per capita, the world SPI score could reach 72.7. This is equivalent to Cyprus (77.5) or Italy (77.4) today.
Figure 9. Trend line for SPI scores and GDP per capita 2015
Source: Deloitte analysis
GDP per capita 2013 (US$’000s)
Soci
al P
rogr
ess
Inde
x 20
15
$0 $10 $20 $30 $40 $50 $60 $70 $80 $900
10
20
30
40
50
60
70
80
90
100
A country’s social progress performance should not be seen as being pre-determined by its GDP per capita. There are countries today, such as Costa Rica and Rwanda, which achieve relatively higher social progress levels than others given their level of GDP per capita.
16
3. Delivering social progress beyond economic growth: the experience of the social progress leaders
To start a new section, hold down the apple+shift keys and click
to release this object and type the section title in the box below.
Figure 10. Estimating the potential for global social progress
Source: Deloitte analysis
The success of Costa Rica
By over performing on social progress by 15.1% as measured by the SPI, Costa Rica is a success story with the greatest level of social progress relative to income. The country ranks 28 out of the 133 countries included in the 2015 SPI, and 2nd of the 100 non-OECD nations included in the SPI. It has frequently been ranked the ‘happiest country in the world’ by the Happy Planet Index, however issues remain with poverty levels remaining above 20% since 1994 (for 2014, the level was 22%vi ).
Disaggregating the Social Progress Index into its three dimensions is revealing in understanding the nation’s challenges and opportunities. Costa Rica performs particularly well on Opportunity, ranking 26th, ahead of many OECD nations. This probably reflects the fact that it is the oldest democracy in the region, with 124 years of uninterrupted, free elections, and a long tradition of upholding people’s rights and inclusion through legal and institutional progress.
Costa Rica is 18th on Foundations of Wellbeing. This is consistent with a country that created the first universal social security system in Latin America in 1941, declared education compulsory and free for all its citizens as early as 1869, and has a strong track record on the environment with a huge percentage of all its land, and ocean territory protected. Costa Rica has a long tradition of attention to topics such as access to water and electricity, and established an institution to eliminate social exclusion as early as 1971.
Surprisingly, however, the country is weakest on Basic Human Needs, ranking 41st. This is due to a duality in the Costa Rican economy, whereby those working in traditional economic sectors (e.g. agriculture farmers) and those that live along its coasts and borders have lower access to education and other mobility instruments.
This, along with a growing government bureaucracy, gridlock among political parties, stronger public sector unions, and class polarization have paralyzed the country’s ability to replace old and inefficient institutions and rules with those needed to tackle social progress in a rapidly changing and demanding international setting.
Source: The Social Progress Imperative
World Average 2015 SPI score World Average 2030 SPI score Potential World Average 2030 SPI score
60.9 62.4 65.0
No underachievers
Potential SPI 2030
60.9 62.4 67.2
All overachieve by at least 5%
60.9 62.4 72.7
All overachieve by at least 15%
Social Progress in 2030 Developing beyond economic growth 17
To start a new section, hold down the apple+shift keys and click
to release this object and type the section title in the box below.
Figure 11. Component analysis of the 2030 SPI following the path of successful countries
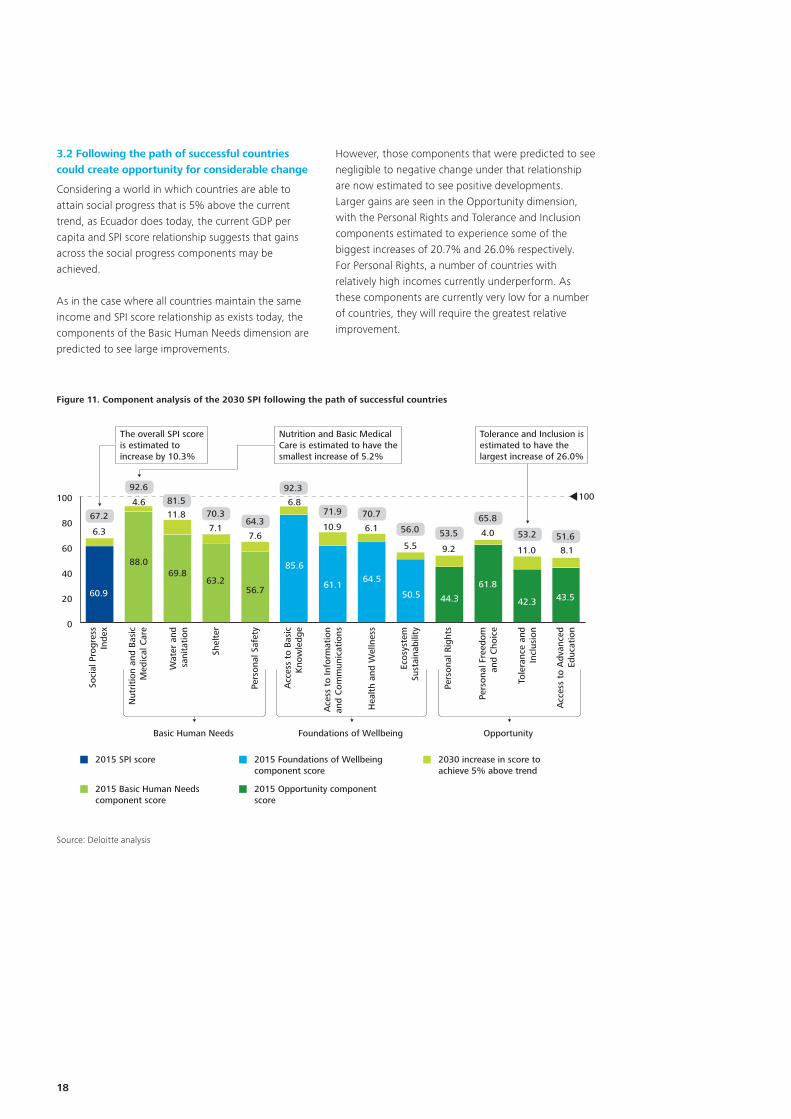
3.2 Following the path of successful countries could create opportunity for considerable change
Considering a world in which countries are able to attain social progress that is 5% above the current trend, as Ecuador does today, the current GDP per capita and SPI score relationship suggests that gains across the social progress components may be achieved.
As in the case where all countries maintain the same income and SPI score relationship as exists today, the components of the Basic Human Needs dimension are predicted to see large improvements.
However, those components that were predicted to see negligible to negative change under that relationship are now estimated to see positive developments. Larger gains are seen in the Opportunity dimension, with the Personal Rights and Tolerance and Inclusion components estimated to experience some of the biggest increases of 20.7% and 26.0% respectively. For Personal Rights, a number of countries with relatively high incomes currently underperform. As these components are currently very low for a number of countries, they will require the greatest relative improvement.
Source: Deloitte analysis
18
0
20
40
60
80
100
60.9
88.069.8
63.256.7
85.6
61.164.5
50.5 44.3
61.8
42.3 43.5
6.3
4.611.8
7.17.6
6.8
6.1
5.5 9.2
10.94.0
11.0 8.1
100
The overall SPI score is estimated to increase by 10.3%
Nutrition and Basic Medical Care is estimated to have the smallest increase of 5.2%
Tolerance and Inclusion is estimated to have the largest increase of 26.0%
Soci
al P
rogr
ess
Inde
x
Nut
riti
on a
nd B
asic
M
edic
al C
are
Wat
er a
nd
sani
tati
on
Shel
ter
Pers
onal
Saf
ety
Acc
ess
to B
asic
K
now
ledg
e
Ace
ss t
o In
form
atio
n an
d C
omm
unic
atio
ns
Hea
lth
and
Wel
lnes
s
Ecos
yste
m
Sust
aina
bilit
y
Pers
onal
Rig
hts
Pers
onal
Fre
edom
an
d C
hoic
e
Acc
ess
to A
dvan
ced
Educ
atio
n
Tole
ranc
e an
d In
clus
ion
2015 SPI score 2015 Foundations of Wellbeing component score
2015 Opportunity component score
2015 Basic Human Needs component score
2030 increase in score to achieve 5% above trend
67.2
92.6
81.570.3
64.3
92.3
71.9 70.7
56.0 53.5
65.8
53.2 51.6
Basic Human Needs Foundations of Wellbeing Opportunity
To start a new section, hold down the apple+shift keys and click
to release this object and type the section title in the box below.
Figure 12. Personal Rights component and GDP per capita
Source: Deloitte analysis
Log(GDP per capita)
Pers
onal
Rig
hts
6 8 10 120
20
40
60
80
100
Personal Rights: Middle Social Progess Group
6 8 10 120
20
40
60
80
100
Personal Rights
Social Progress in 2030 Developing beyond economic growth 19
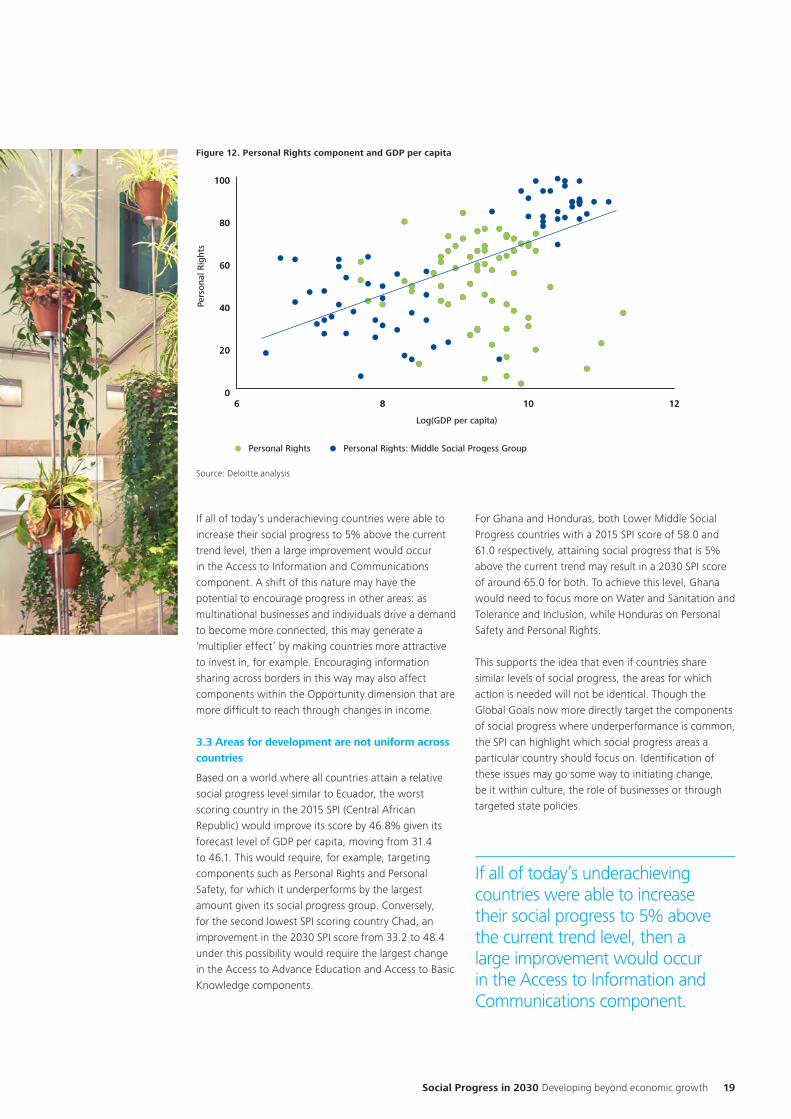
If all of today’s underachieving countries were able to increase their social progress to 5% above the current trend level, then a large improvement would occur in the Access to Information and Communications component. A shift of this nature may have the potential to encourage progress in other areas: as multinational businesses and individuals drive a demand to become more connected, this may generate a ‘multiplier effect’ by making countries more attractive to invest in, for example. Encouraging information sharing across borders in this way may also affect components within the Opportunity dimension that are more difficult to reach through changes in income.
3.3 Areas for development are not uniform across countries
Based on a world where all countries attain a relative social progress level similar to Ecuador, the worst scoring country in the 2015 SPI (Central African Republic) would improve its score by 46.8% given its forecast level of GDP per capita, moving from 31.4 to 46.1. This would require, for example, targeting components such as Personal Rights and Personal Safety, for which it underperforms by the largest amount given its social progress group. Conversely, for the second lowest SPI scoring country Chad, an improvement in the 2030 SPI score from 33.2 to 48.4 under this possibility would require the largest change in the Access to Advance Education and Access to Basic Knowledge components.
If all of today’s underachieving countries were able to increase their social progress to 5% above the current trend level, then a large improvement would occur in the Access to Information and Communications component.
For Ghana and Honduras, both Lower Middle Social Progress countries with a 2015 SPI score of 58.0 and 61.0 respectively, attaining social progress that is 5% above the current trend may result in a 2030 SPI score of around 65.0 for both. To achieve this level, Ghana would need to focus more on Water and Sanitation and Tolerance and Inclusion, while Honduras on Personal Safety and Personal Rights.
This supports the idea that even if countries share similar levels of social progress, the areas for which action is needed will not be identical. Though the Global Goals now more directly target the components of social progress where underperformance is common, the SPI can highlight which social progress areas a particular country should focus on. Identification of these issues may go some way to initiating change, be it within culture, the role of businesses or through targeted state policies.
To start a new section, hold down the apple+shift keys and click
to release this object and type the section title in the box below.
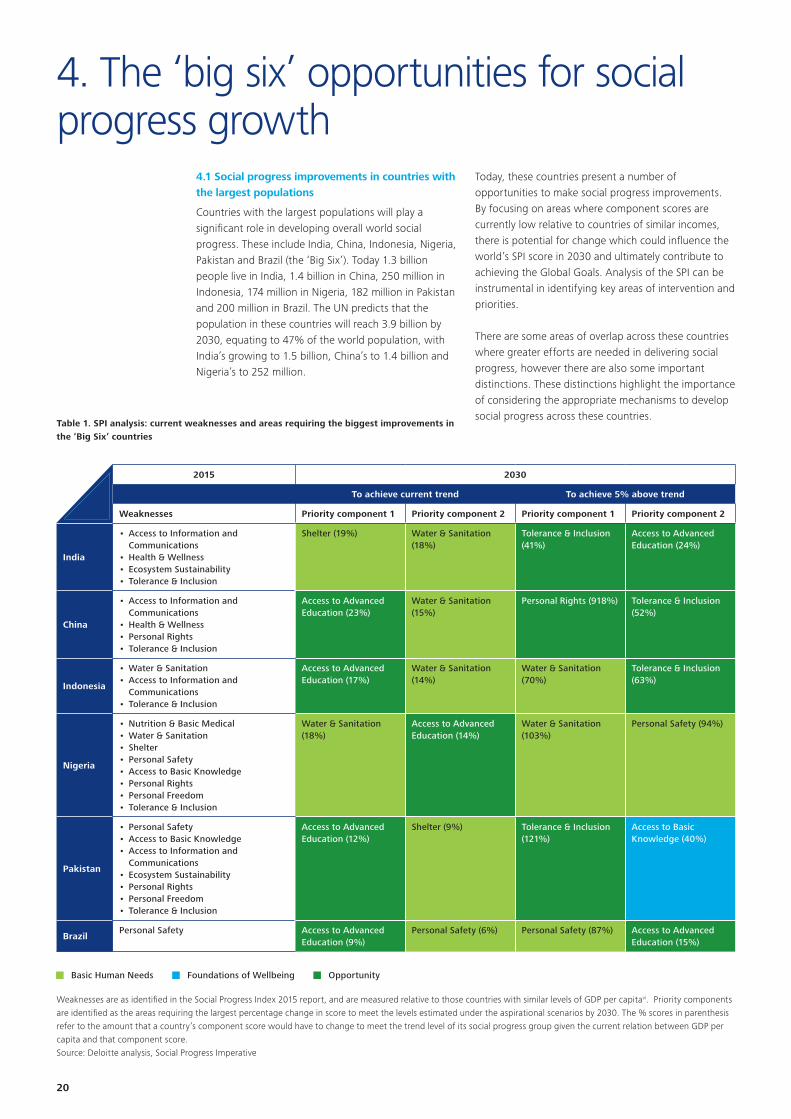
Table 1. SPI analysis: current weaknesses and areas requiring the biggest improvements in the ‘Big Six’ countries
Weaknesses are as identified in the Social Progress Index 2015 report, and are measured relative to those countries with similar levels of GDP per capitavi. Priority components are identified as the areas requiring the largest percentage change in score to meet the levels estimated under the aspirational scenarios by 2030. The % scores in parenthesis refer to the amount that a country’s component score would have to change to meet the trend level of its social progress group given the current relation between GDP per capita and that component score. Source: Deloitte analysis, Social Progress Imperative
4.1 Social progress improvements in countries with the largest populations
Countries with the largest populations will play a significant role in developing overall world social progress. These include India, China, Indonesia, Nigeria, Pakistan and Brazil (the ‘Big Six’). Today 1.3 billion people live in India, 1.4 billion in China, 250 million in Indonesia, 174 million in Nigeria, 182 million in Pakistan and 200 million in Brazil. The UN predicts that the population in these countries will reach 3.9 billion by 2030, equating to 47% of the world population, with India’s growing to 1.5 billion, China’s to 1.4 billion and Nigeria’s to 252 million.
Today, these countries present a number of opportunities to make social progress improvements. By focusing on areas where component scores are currently low relative to countries of similar incomes, there is potential for change which could influence the world’s SPI score in 2030 and ultimately contribute to achieving the Global Goals. Analysis of the SPI can be instrumental in identifying key areas of intervention and priorities.
There are some areas of overlap across these countries where greater efforts are needed in delivering social progress, however there are also some important distinctions. These distinctions highlight the importance of considering the appropriate mechanisms to develop social progress across these countries.
20
4. The ‘big six’ opportunities for social progress growth
Foundations of WellbeingBasic Human Needs Opportunity
2015 2030
To achieve current trend To achieve 5% above trend
Weaknesses Priority component 1 Priority component 2 Priority component 1 Priority component 2
India
• Access to Information and Communications
• Health & Wellness• Ecosystem Sustainability• Tolerance & Inclusion
Shelter (19%) Water & Sanitation (18%)
Tolerance & Inclusion (41%)
Access to Advanced Education (24%)
China
• Access to Information and Communications
• Health & Wellness• Personal Rights• Tolerance & Inclusion
Access to Advanced Education (23%)
Water & Sanitation (15%)
Personal Rights (918%) Tolerance & Inclusion (52%)
Indonesia
• Water & Sanitation• Access to Information and
Communications• Tolerance & Inclusion
Access to Advanced Education (17%)
Water & Sanitation (14%)
Water & Sanitation (70%)
Tolerance & Inclusion (63%)
Nigeria
• Nutrition & Basic Medical• Water & Sanitation• Shelter• Personal Safety• Access to Basic Knowledge• Personal Rights• Personal Freedom• Tolerance & Inclusion
Water & Sanitation (18%)
Access to Advanced Education (14%)
Water & Sanitation (103%)
Personal Safety (94%)
Pakistan
• Personal Safety• Access to Basic Knowledge• Access to Information and
Communications• Ecosystem Sustainability• Personal Rights• Personal Freedom• Tolerance & Inclusion
Access to Advanced Education (12%)
Shelter (9%) Tolerance & Inclusion (121%)
Access to Basic Knowledge (40%)
BrazilPersonal Safety Access to Advanced
Education (9%)Personal Safety (6%) Personal Safety (87%) Access to Advanced
Education (15%)
To start a new section, hold down the apple+shift keys and click
to release this object and type the section title in the box below.
Figure 13. India’s potential SPI scores in 2030
Source: Deloitte analysis
Social Progress in 2030 Developing beyond economic growth 21
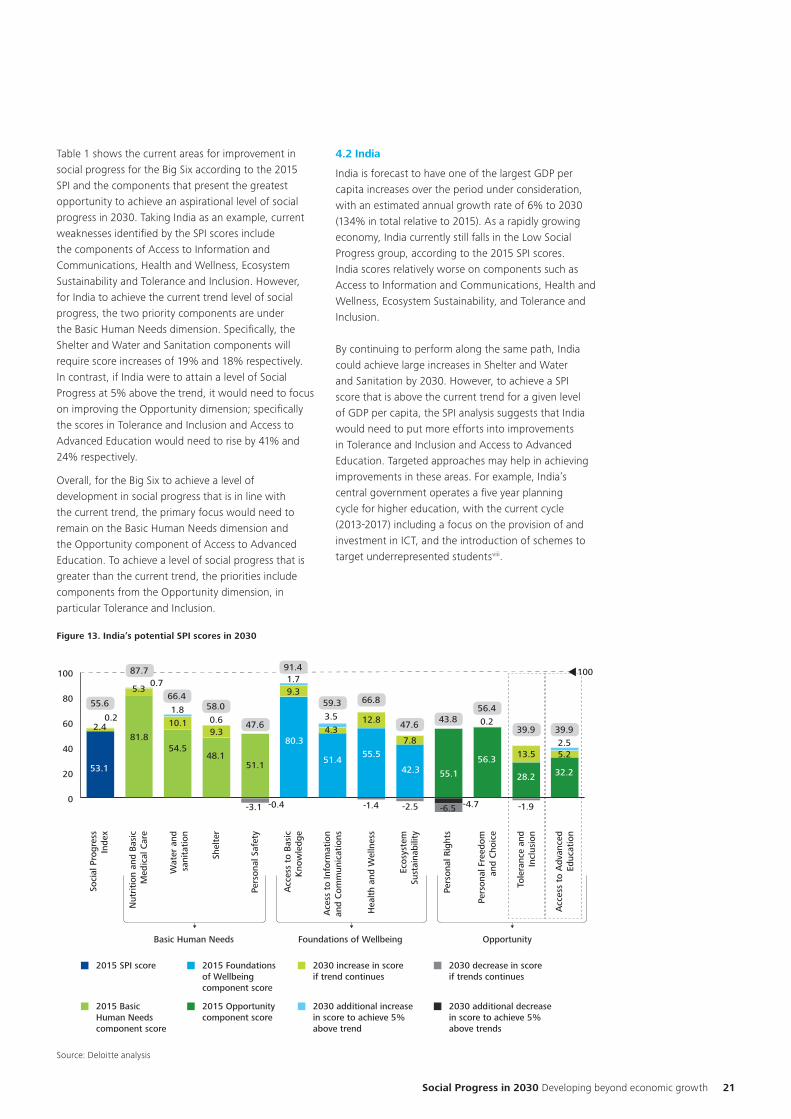
Table 1 shows the current areas for improvement in social progress for the Big Six according to the 2015 SPI and the components that present the greatest opportunity to achieve an aspirational level of social progress in 2030. Taking India as an example, current weaknesses identified by the SPI scores include the components of Access to Information and Communications, Health and Wellness, Ecosystem Sustainability and Tolerance and Inclusion. However, for India to achieve the current trend level of social progress, the two priority components are under the Basic Human Needs dimension. Specifically, the Shelter and Water and Sanitation components will require score increases of 19% and 18% respectively. In contrast, if India were to attain a level of Social Progress at 5% above the trend, it would need to focus on improving the Opportunity dimension; specifically the scores in Tolerance and Inclusion and Access to Advanced Education would need to rise by 41% and 24% respectively.
Overall, for the Big Six to achieve a level of development in social progress that is in line with the current trend, the primary focus would need to remain on the Basic Human Needs dimension and the Opportunity component of Access to Advanced Education. To achieve a level of social progress that is greater than the current trend, the priorities include components from the Opportunity dimension, in particular Tolerance and Inclusion.
4.2 India
India is forecast to have one of the largest GDP per capita increases over the period under consideration, with an estimated annual growth rate of 6% to 2030 (134% in total relative to 2015). As a rapidly growing economy, India currently still falls in the Low Social Progress group, according to the 2015 SPI scores. India scores relatively worse on components such as Access to Information and Communications, Health and Wellness, Ecosystem Sustainability, and Tolerance and Inclusion.
By continuing to perform along the same path, India could achieve large increases in Shelter and Water and Sanitation by 2030. However, to achieve a SPI score that is above the current trend for a given level of GDP per capita, the SPI analysis suggests that India would need to put more efforts into improvements in Tolerance and Inclusion and Access to Advanced Education. Targeted approaches may help in achieving improvements in these areas. For example, India’s central government operates a five year planning cycle for higher education, with the current cycle (2013-2017) including a focus on the provision of and investment in ICT, and the introduction of schemes to target underrepresented studentsviii.
Figure 13 India's potential SPI scores in 2030
0
20
40
60
80
100
53.1
81.854.5
48.151.1
80.3
51.455.5
42.3 55.1
56.3
28.2 32.2
-1.9-6.5 -4.7-2.5-1.4
2.40.2
0.75.3
10.1 12.8
9.3
0.69.3
1.8
-0.4-3.1
1.7
3.5
4.37.8
0.2
5.22.5
13.5
100
55.6
87.7
66.458.0
47.6
91.4
59.3 66.8
47.643.8
56.4
39.9 39.9
Basic Human Needs Foundations of Wellbeing
Soci
al P
rogr
ess
Inde
x
Nut
riti
on a
nd B
asic
M
edic
al C
are
Wat
er a
nd
sani
tati
on
Pers
onal
Saf
ety
Acc
ess
to B
asic
K
now
ledg
e
Ace
ss t
o In
form
atio
n an
d C
omm
unic
atio
ns
Hea
lth
and
Wel
lnes
s
Ecos
yste
m
Sust
aina
bilit
y
Pers
onal
Rig
hts
Pers
onal
Fre
edom
an
d C
hoic
e
Acc
ess
to A
dvan
ced
Educ
atio
n
Tole
ranc
e an
d In
clus
ion
Opportunity
2015 SPI score 2015 Foundations of Wellbeing component score
2015 Opportunity component score
2015 Basic Human Needs component score
2030 increase in score if trend continues
2030 additional increase in score to achieve 5% above trend
2030 additional decrease in score to achieve 5% above trends
2030 decrease in score if trends continues
Shel
ter
To start a new section, hold down the apple+shift keys and click
to release this object and type the section title in the box below.
Figure 14. China’s potential SPI scores in 2030
Source: Deloitte analysis
0
20
40
60
80
100
Figure 14 China’s potential SPI scores in 2030
59.1
93.173.7
70.457.7
94.8
52.961.7
52.2 47.2
68.5
34.9 44.3
4.6
-4.6
1.2
0.1
4.09.8
1.7 5.2
11.0
6.5
5.1
1.07.3
12.9
5.4
5.1
0.1
20.5
4.0 2.5
2.70.4
10.3
4.1
0.9
17.1
100
72.9
100 97.6
78.768.2
100
77.4 68.3
55.947.2
71.5
52.958.7
Basic Human Needs Foundations of Wellbeing
Soci
al P
rogr
ess
Inde
x
Nut
riti
on a
nd B
asic
M
edic
al C
are
Wat
er a
nd
sani
tati
on
Pers
onal
Saf
ety
Acc
ess
to B
asic
K
now
ledg
e
Ace
ss t
o In
form
atio
n an
d C
omm
unic
atio
ns
Hea
lth
and
Wel
lnes
s
Ecos
yste
m
Sust
aina
bilit
y
Pers
onal
Rig
hts
Pers
onal
Fre
edom
an
d C
hoic
e
Acc
ess
to A
dvan
ced
Educ
atio
n
Tole
ranc
e an
d In
clus
ion
Opportunity
2015 SPI score 2015 Foundations of Wellbeing component score
2015 Opportunity component score
2015 Basic Human Needs component score
2030 increase in score if trend continues
2030 additional increase in score to achieve 5% above trend
2030 additional decrease in score to achieve 5% above trends
2030 decrease in score if trends continues
Shel
ter
22
In relation to the SPI component Tolerance and Inclusion, India’s government has made clear a policy of ‘zero tolerance’ for violence against women and a strengthening of the criminal justice system for its effective implementationix. Improvements in both of these components through pathways such as these could enable long-term positive future change for a wider range of India’s population.
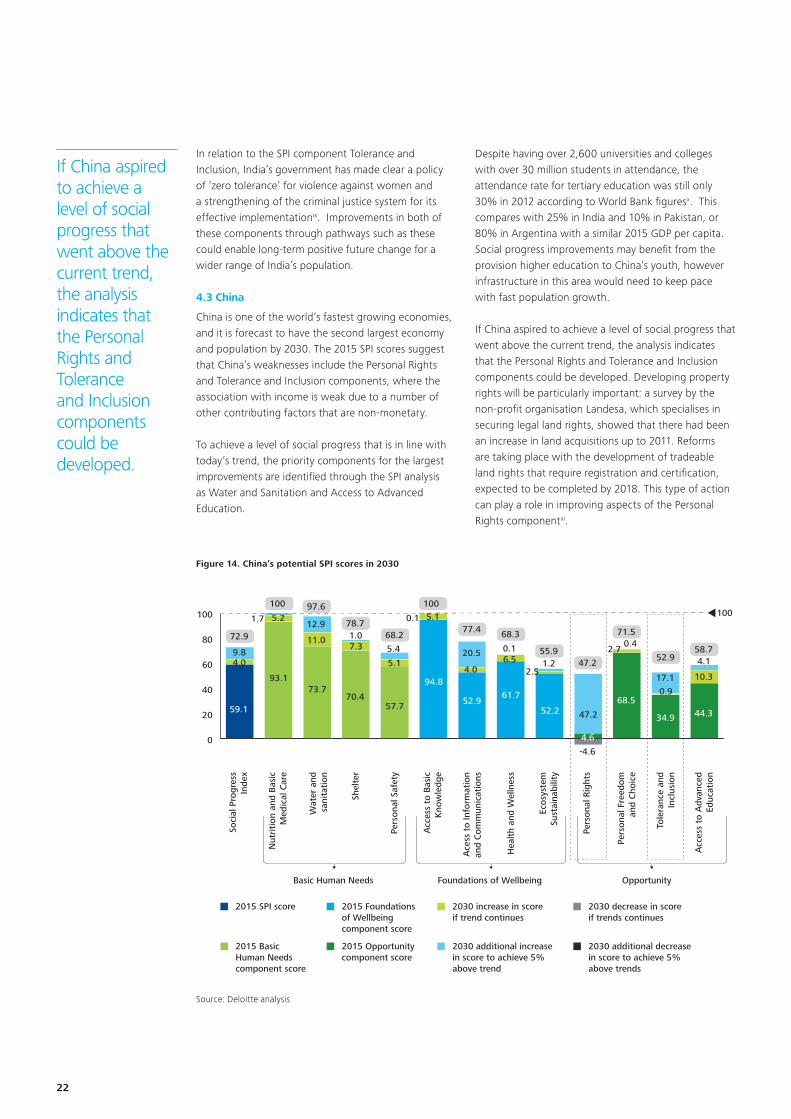
4.3 China
China is one of the world’s fastest growing economies, and it is forecast to have the second largest economy and population by 2030. The 2015 SPI scores suggest that China’s weaknesses include the Personal Rights and Tolerance and Inclusion components, where the association with income is weak due to a number of other contributing factors that are non-monetary.
To achieve a level of social progress that is in line with today’s trend, the priority components for the largest improvements are identified through the SPI analysis as Water and Sanitation and Access to Advanced Education.
Despite having over 2,600 universities and colleges with over 30 million students in attendance, the attendance rate for tertiary education was still only 30% in 2012 according to World Bank figuresx. This compares with 25% in India and 10% in Pakistan, or 80% in Argentina with a similar 2015 GDP per capita. Social progress improvements may benefit from the provision higher education to China’s youth, however infrastructure in this area would need to keep pace with fast population growth.
If China aspired to achieve a level of social progress that went above the current trend, the analysis indicates that the Personal Rights and Tolerance and Inclusion components could be developed. Developing property rights will be particularly important: a survey by the non-profit organisation Landesa, which specialises in securing legal land rights, showed that there had been an increase in land acquisitions up to 2011. Reforms are taking place with the development of tradeable land rights that require registration and certification, expected to be completed by 2018. This type of action can play a role in improving aspects of the Personal Rights componentxi.
If China aspired to achieve a level of social progress that went above the current trend, the analysis indicates that the Personal Rights and Tolerance and Inclusion components could be developed.
To start a new section, hold down the apple+shift keys and click
to release this object and type the section title in the box below.
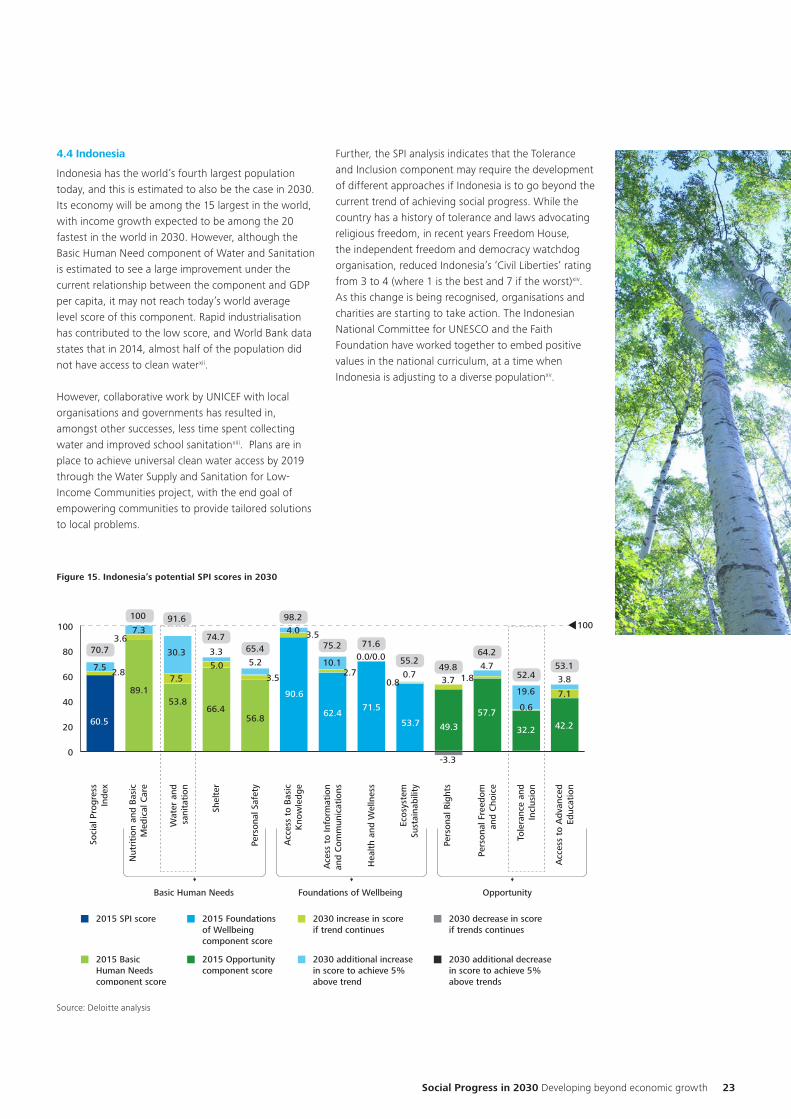
Figure 15. Indonesia’s potential SPI scores in 2030
Source: Deloitte analysis
0
20
40
60
80
100
Figure 15 Indonesia’s potential SPI scores in 2030
60.5
89.153.8
66.456.8
90.6
62.471.5
53.7 49.3
57.7
32.2 42.2
3.7
-3.3
0.72.87.5
3.67.3
7.5
3.5
3.3
5.030.3
5.2
3.5
4.0
10.12.7
0.8
0.0/0.0
1.84.7
7.1
3.8
0.6
19.6
100
70.7
100 91.6
74.765.4
98.2
75.2 71.6
55.249.8
64.2
52.453.1
Basic Human Needs Foundations of Wellbeing
Soci
al P
rogr
ess
Inde
x
Nut
riti
on a
nd B
asic
M
edic
al C
are
Wat
er a
nd
sani
tati
on
Pers
onal
Saf
ety
Acc
ess
to B
asic
K
now
ledg
e
Ace
ss t
o In
form
atio
n an
d C
omm
unic
atio
ns
Hea
lth
and
Wel
lnes
s
Ecos
yste
m
Sust
aina
bilit
y
Pers
onal
Rig
hts
Pers
onal
Fre
edom
an
d C
hoic
e
Acc
ess
to A
dvan
ced
Educ
atio
n
Tole
ranc
e an
d In
clus
ion
Opportunity
2015 SPI score 2015 Foundations of Wellbeing component score
2015 Opportunity component score
2015 Basic Human Needs component score
2030 increase in score if trend continues
2030 additional increase in score to achieve 5% above trend
2030 additional decrease in score to achieve 5% above trends
2030 decrease in score if trends continues
Shel
ter
Social Progress in 2030 Developing beyond economic growth 23
4.4 Indonesia
Indonesia has the world’s fourth largest population today, and this is estimated to also be the case in 2030. Its economy will be among the 15 largest in the world, with income growth expected to be among the 20 fastest in the world in 2030. However, although the Basic Human Need component of Water and Sanitation is estimated to see a large improvement under the current relationship between the component and GDP per capita, it may not reach today’s world average level score of this component. Rapid industrialisation has contributed to the low score, and World Bank data states that in 2014, almost half of the population did not have access to clean waterxii.
However, collaborative work by UNICEF with local organisations and governments has resulted in, amongst other successes, less time spent collecting water and improved school sanitationxiii. Plans are in place to achieve universal clean water access by 2019 through the Water Supply and Sanitation for Low-Income Communities project, with the end goal of empowering communities to provide tailored solutions to local problems.
Further, the SPI analysis indicates that the Tolerance and Inclusion component may require the development of different approaches if Indonesia is to go beyond the current trend of achieving social progress. While the country has a history of tolerance and laws advocating religious freedom, in recent years Freedom House, the independent freedom and democracy watchdog organisation, reduced Indonesia’s ‘Civil Liberties’ rating from 3 to 4 (where 1 is the best and 7 if the worst)xiv. As this change is being recognised, organisations and charities are starting to take action. The Indonesian National Committee for UNESCO and the Faith Foundation have worked together to embed positive values in the national curriculum, at a time when Indonesia is adjusting to a diverse populationxv.
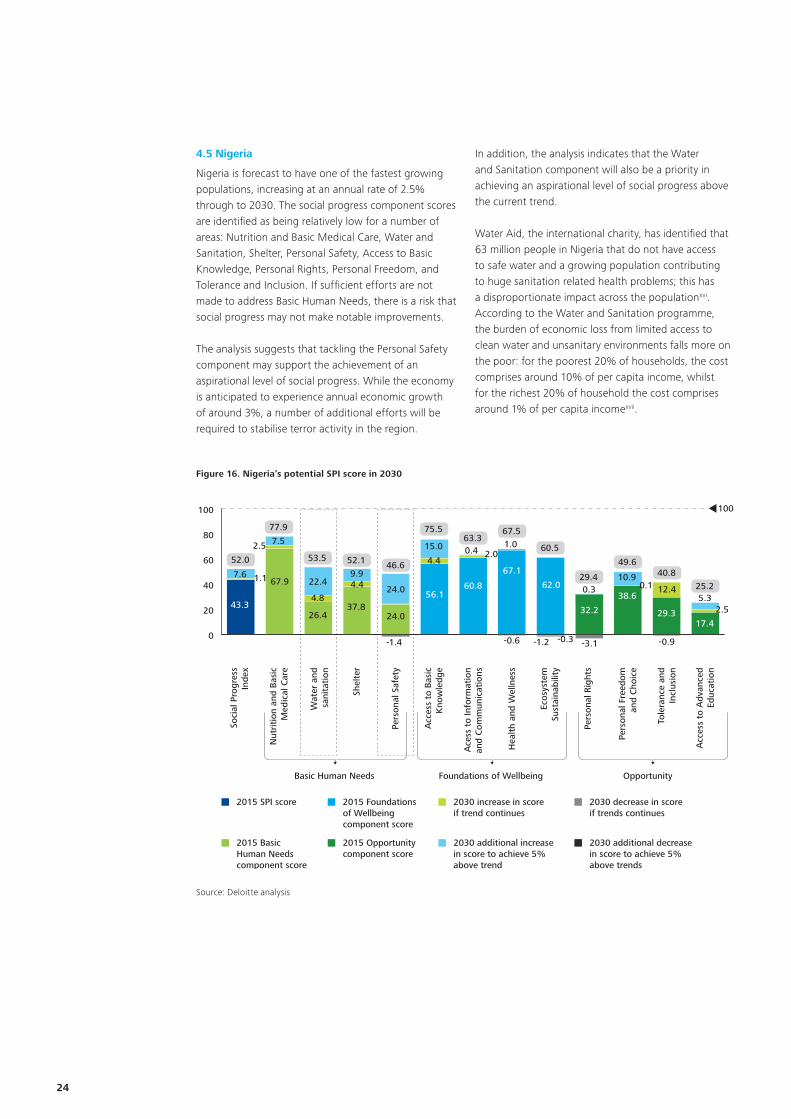
To start a new section, hold down the apple+shift keys and click
to release this object and type the section title in the box below.
Figure 16. Nigeria’s potential SPI score in 2030
Source: Deloitte analysis
Figure 16 Nigeria’s potential SPI score in 2030
0
20
40
60
80
100
43.3
67.9
26.437.8
24.0
24.0 56.160.8
67.1
62.0
32.2
38.6
29.317.4
-0.9-3.1-1.2-0.6
1.17.6
7.52.5
4.8
1.0
4.49.94.422.4
-1.4
15.0 0.4 2.0
-0.3
0.3 0.110.9
2.55.3
12.4
100
52.0
77.9
53.5 52.1 46.6
75.563.3
67.5
60.5
29.4
49.640.8
25.2
Basic Human Needs Foundations of Wellbeing
Soci
al P
rogr
ess
Inde
x
Nut
riti
on a
nd B
asic
M
edic
al C
are
Wat
er a
nd
sani
tati
on
Pers
onal
Saf
ety
Acc
ess
to B
asic
K
now
ledg
e
Ace
ss t
o In
form
atio
n an
d C
omm
unic
atio
ns
Hea
lth
and
Wel
lnes
s
Ecos
yste
m
Sust
aina
bilit
y
Pers
onal
Rig
hts
Pers
onal
Fre
edom
an
d C
hoic
e
Acc
ess
to A
dvan
ced
Educ
atio
n
Tole
ranc
e an
d In
clus
ion
Opportunity
2015 SPI score 2015 Foundations of Wellbeing component score
2015 Opportunity component score
2015 Basic Human Needs component score
2030 increase in score if trend continues
2030 additional increase in score to achieve 5% above trend
2030 additional decrease in score to achieve 5% above trends
2030 decrease in score if trends continues
Shel
ter
24
4.5 Nigeria
Nigeria is forecast to have one of the fastest growing populations, increasing at an annual rate of 2.5% through to 2030. The social progress component scores are identified as being relatively low for a number of areas: Nutrition and Basic Medical Care, Water and Sanitation, Shelter, Personal Safety, Access to Basic Knowledge, Personal Rights, Personal Freedom, and Tolerance and Inclusion. If sufficient efforts are not made to address Basic Human Needs, there is a risk that social progress may not make notable improvements.
The analysis suggests that tackling the Personal Safety component may support the achievement of an aspirational level of social progress. While the economy is anticipated to experience annual economic growth of around 3%, a number of additional efforts will be required to stabilise terror activity in the region.
In addition, the analysis indicates that the Water and Sanitation component will also be a priority in achieving an aspirational level of social progress above the current trend.
Water Aid, the international charity, has identified that 63 million people in Nigeria that do not have access to safe water and a growing population contributing to huge sanitation related health problems; this has a disproportionate impact across the populationxvi. According to the Water and Sanitation programme, the burden of economic loss from limited access to clean water and unsanitary environments falls more on the poor: for the poorest 20% of households, the cost comprises around 10% of per capita income, whilst for the richest 20% of household the cost comprises around 1% of per capita incomexvii.
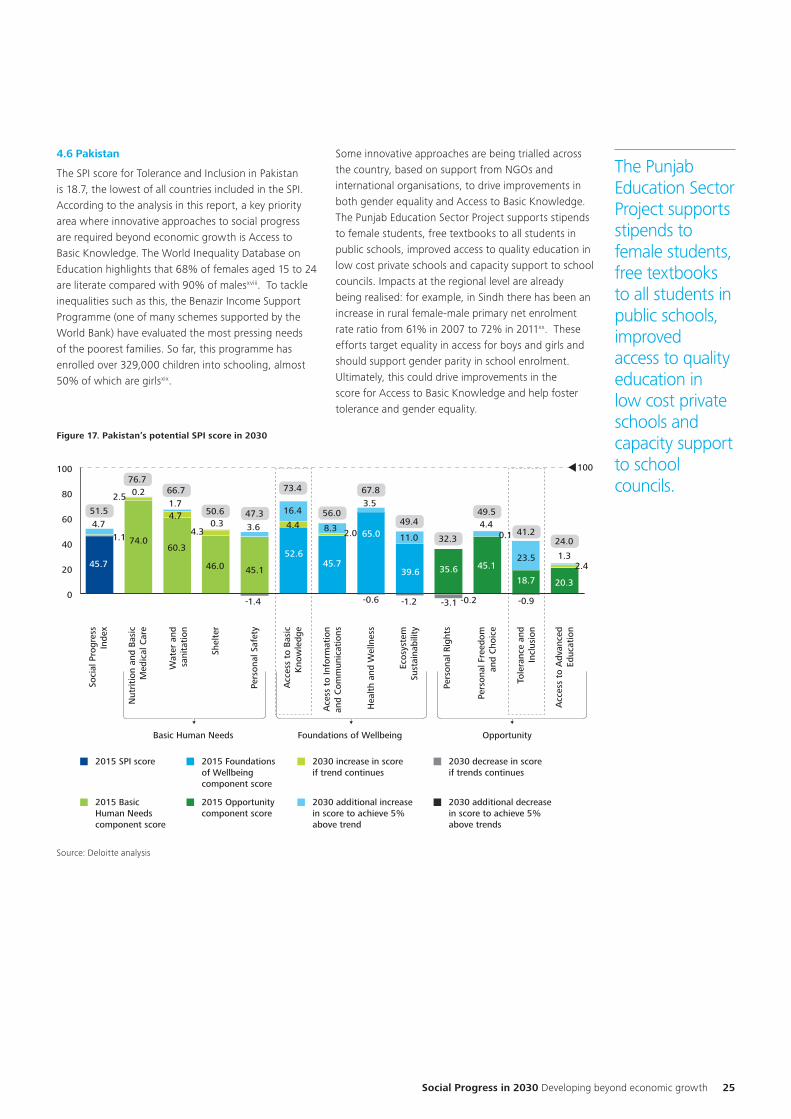
To start a new section, hold down the apple+shift keys and click
to release this object and type the section title in the box below.
Social Progress in 2030 Developing beyond economic growth 25
Figure 17. Pakistan’s potential SPI score in 2030
Source: Deloitte analysis
0
20
40
60
80
100
45.7
74.060.3
46.0 45.1
3.6
52.645.7
65.0 11.0
39.6 35.6 45.1
18.7 20.3
-0.9-3.1-1.2-0.6
1.14.7
0.22.5
4.73.5
4.40.34.3
1.7
-1.4
16.4
8.3 2.0
-0.2
0.14.4
2.41.323.5
100
51.5
76.766.7
50.6 47.3
73.4
56.0
67.8
49.4
32.3
49.5
41.224.0
Basic Human Needs Foundations of Wellbeing
Soci
al P
rogr
ess
Inde
x
Nut
riti
on a
nd B
asic
M
edic
al C
are
Wat
er a
nd
sani
tati
on
Pers
onal
Saf
ety
Acc
ess
to B
asic
K
now
ledg
e
Ace
ss t
o In
form
atio
n an
d C
omm
unic
atio
ns
Hea
lth
and
Wel
lnes
s
Ecos
yste
m
Sust
aina
bilit
y
Pers
onal
Rig
hts
Pers
onal
Fre
edom
an
d C
hoic
e
Acc
ess
to A
dvan
ced
Educ
atio
n
Tole
ranc
e an
d In
clus
ion
Opportunity
2015 SPI score 2015 Foundations of Wellbeing component score
2015 Opportunity component score
2015 Basic Human Needs component score
2030 increase in score if trend continues
2030 additional increase in score to achieve 5% above trend
2030 additional decrease in score to achieve 5% above trends
2030 decrease in score if trends continues
Shel
ter
4.6 Pakistan
The SPI score for Tolerance and Inclusion in Pakistan is 18.7, the lowest of all countries included in the SPI. According to the analysis in this report, a key priority area where innovative approaches to social progress are required beyond economic growth is Access to Basic Knowledge. The World Inequality Database on Education highlights that 68% of females aged 15 to 24 are literate compared with 90% of malesxviii. To tackle inequalities such as this, the Benazir Income Support Programme (one of many schemes supported by the World Bank) have evaluated the most pressing needs of the poorest families. So far, this programme has enrolled over 329,000 children into schooling, almost 50% of which are girlsxix.
Some innovative approaches are being trialled across the country, based on support from NGOs and international organisations, to drive improvements in both gender equality and Access to Basic Knowledge. The Punjab Education Sector Project supports stipends to female students, free textbooks to all students in public schools, improved access to quality education in low cost private schools and capacity support to school councils. Impacts at the regional level are already being realised: for example, in Sindh there has been an increase in rural female-male primary net enrolment rate ratio from 61% in 2007 to 72% in 2011xx. These efforts target equality in access for boys and girls and should support gender parity in school enrolment. Ultimately, this could drive improvements in the score for Access to Basic Knowledge and help foster tolerance and gender equality.
The Punjab Education Sector Project supports stipends to female students, free textbooks to all students in public schools, improved access to quality education in low cost private schools and capacity support to school councils.
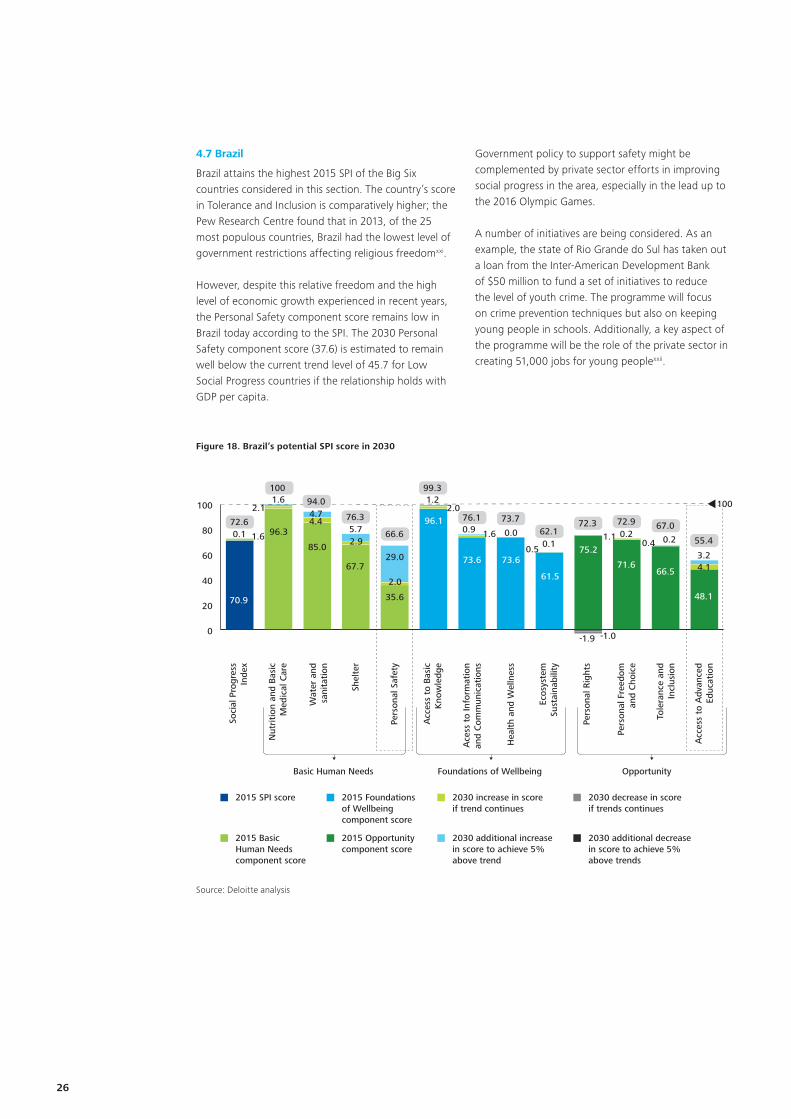
To start a new section, hold down the apple+shift keys and click
to release this object and type the section title in the box below.
26
Figure 18. Brazil’s potential SPI score in 2030
Source: Deloitte analysis
0
20
40
60
80
100
Figure 18 Brazil’s potential SPI score in 2030
70.9
96.3
85.0
67.7
35.6
96.1
73.6 73.6
61.5
75.2
71.666.5
48.1
-1.9 -1.0
0.11.60.1
2.11.6
4.42.0
5.72.9
4.7
29.0
2.0
1.2
0.9 1.6
0.5
0.0 0.2
4.13.2
0.41.1 0.2
100
72.6
100
94.0
76.3
66.6
99.3
76.1 73.762.1
72.3 72.9 67.0
55.4
Basic Human Needs Foundations of Wellbeing
Soci
al P
rogr
ess
Inde
x
Nut
riti
on a
nd B
asic
M
edic
al C
are
Wat
er a
nd
sani
tati
on
Pers
onal
Saf
ety
Acc
ess
to B
asic
K
now
ledg
e
Ace
ss t
o In
form
atio
n an
d C
omm
unic
atio
ns
Hea
lth
and
Wel
lnes
s
Ecos
yste
m
Sust
aina
bilit
y
Pers
onal
Rig
hts
Pers
onal
Fre
edom
an
d C
hoic
e
Acc
ess
to A
dvan
ced
Educ
atio
n
Tole
ranc
e an
d In
clus
ion
Opportunity
2015 SPI score 2015 Foundations of Wellbeing component score
2015 Opportunity component score
2015 Basic Human Needs component score
2030 increase in score if trend continues
2030 additional increase in score to achieve 5% above trend
2030 additional decrease in score to achieve 5% above trends
2030 decrease in score if trends continues
Shel
ter
4.7 Brazil
Brazil attains the highest 2015 SPI of the Big Six countries considered in this section. The country’s score in Tolerance and Inclusion is comparatively higher; the Pew Research Centre found that in 2013, of the 25 most populous countries, Brazil had the lowest level of government restrictions affecting religious freedomxxi.
However, despite this relative freedom and the high level of economic growth experienced in recent years, the Personal Safety component score remains low in Brazil today according to the SPI. The 2030 Personal Safety component score (37.6) is estimated to remain well below the current trend level of 45.7 for Low Social Progress countries if the relationship holds with GDP per capita.
Government policy to support safety might be complemented by private sector efforts in improving social progress in the area, especially in the lead up to the 2016 Olympic Games.
A number of initiatives are being considered. As an example, the state of Rio Grande do Sul has taken out a loan from the Inter-American Development Bank of $50 million to fund a set of initiatives to reduce the level of youth crime. The programme will focus on crime prevention techniques but also on keeping young people in schools. Additionally, a key aspect of the programme will be the role of the private sector in creating 51,000 jobs for young peoplexxii.
To start a new section, hold down the apple+shift keys and click
to release this object and type the section title in the box below.
Social Progress in 2030 Developing beyond economic growth 27
4.8 A co-ordinated and broader policy approach will be needed to improve social progress beyond the existing trend
Changes in institutional and cultural factors could play a big role in generating progress in the opportunities provided to citizens, and a coalition of diverse stakeholders spanning businesses and social organisations may be required to lead this change. A combination of approaches should support social progress in the identified problem areas.
Government expenditure and policy support will remain critical. National governments could support areas such as Water and Sanitation (priority for Indonesia and Nigeria) and Access to Basic Knowledge (priority for Pakistan) through greater expenditure on infrastructure and funding for schools, including investment in more rural and remote regions.
Broader culture changes will be required to drive policy and societal changes. Areas such as Tolerance and Inclusion may only see real change through a broader cultural shift. Cultural change may also complement areas of government funding, for instance by improving attitudes towards Water and Sanitation as is the case with UNICEF’s Water, Sanitation and Hygiene programme in Nigeriaxxiii.
Support from NGOs and international organisations may prioritise one of the problem areas. Despite rapid growth, these countries can still be heavily reliant on external support. There are numerous examples of NGOs that support social progress worldwide: in Pakistan, NGOs have mediated conflict resolution at the community level, thus contributing to improving Personal Safetyxxiv. This has helped in remedying disputes over access to land or infrastructure, with a particular focus on involving women in the peacebuilding process.
Private sector participation could complement the public sector action. The provision of certain services through state organisations may be complemented by organisations using their expertise and delivering their core products and services. For example, to support greater Access to Advanced Education in India, the private sector will continue to play a significant role in the expansion of higher education where it currently accounts for 58% of all tertiary enrolment and is growing rapidlyxxv. Delivery of basic knowledge and improving connections between Low Social Progress countries and the rest of the world may be encouraged through the provision of mobile internet by communications multinationals, and a number of NGOs could offer guidance on this working in conjunction with business.
To start a new section, hold down the apple+shift keys and click
to release this object and type the section title in the box below.
5.1 Exploring innovative approaches to deliver inclusive growth
The limits of relying on economic growth to attain development in the different facets of social progress makes the case for governments, business and international institutions to collaborate and recognise that economic development alone may not be sufficient to generate inclusive growth.
To achieve the social progress improvements required to meet the Global Goals, further insights need to be developed. Social progress components in the Wellbeing and Opportunity dimension, especially in countries where institutional or cultural barriers may impede progress, need to be further studied.
All countries are unique, with inevitable differences in economic structure, population, culture or society. However, governments of underachieving social progress countries could learn from successful social progress countries in the application of targeted policies or the attraction of certain industries that are suited to specific country characteristics. In particular, policies of institutional transformation, education and personal rights development require further analysis.
As GDP growth has helped the Millennium Development Goals, there may be a role for innovation or technology in areas such as health care, communications or education in achieving the Global Goals. As global interconnectedness increases, areas of social progress not easily affected by economic growth, such as tolerance to religion, may be impacted through the opening of borders to information.
Business also has a critical role to play. With increased stakeholder, regulatory and consumer pressures, more companies are seeking to integrate social impact into their core business. Contributing through quality employment or the provision of services typically provided by the state, may enable business to generate synergies that have valuable impacts on the social development of a country.
Despite increased awareness of macro shifts influencing business today, companies are often uncertain of nuanced social impact trends and the optimal path forward specific to their industry. The integration of social impact does not lend itself to a ‘one size fits all’ model. Strategies may account for the complexities of each industry, geography, customer-set, and ultimately, the company itself. To date, large-scale change has been inhibited due to these uncertainties. Collaboration with governments, NGOs or international organisations to improve certainty and insights could make impacts wider reaching, potentially influencing not only social progress but economic growth as well.
5.2 Inviting a debate on the role of governments and business to deliver inclusive growth
The role of governments, business and international institutions in encouraging social progress is an area for debate with important relevance for the global development of social progress. In particular, an understanding of how certain countries have attained high relative social progress could aid the progress of underachieving countries. Collaboration across stakeholders in the application of innovative approaches that extend beyond economic growth should be encouraged in supporting social progress to 2030. Recognising the importance of alternative approaches, a coalition of stakeholders spanning different sections of society needs to coordinate efforts to make the Global Goals achievable.
The Social Progress Imperative and Deloitte recognise that this study is just a starting point for a critical debate on how to different organisation can contribute to achieve the Global Goals. We are inviting others to join the debate to advance the discussion and suggest critical policies and actions to achieve truly inclusive growth.
5. How governments and business can help deliver social progress beyond economic growth
With increased stakeholder, regulatory and consumer pressures, more companies are seeking to integrate social impact into their core business.
28
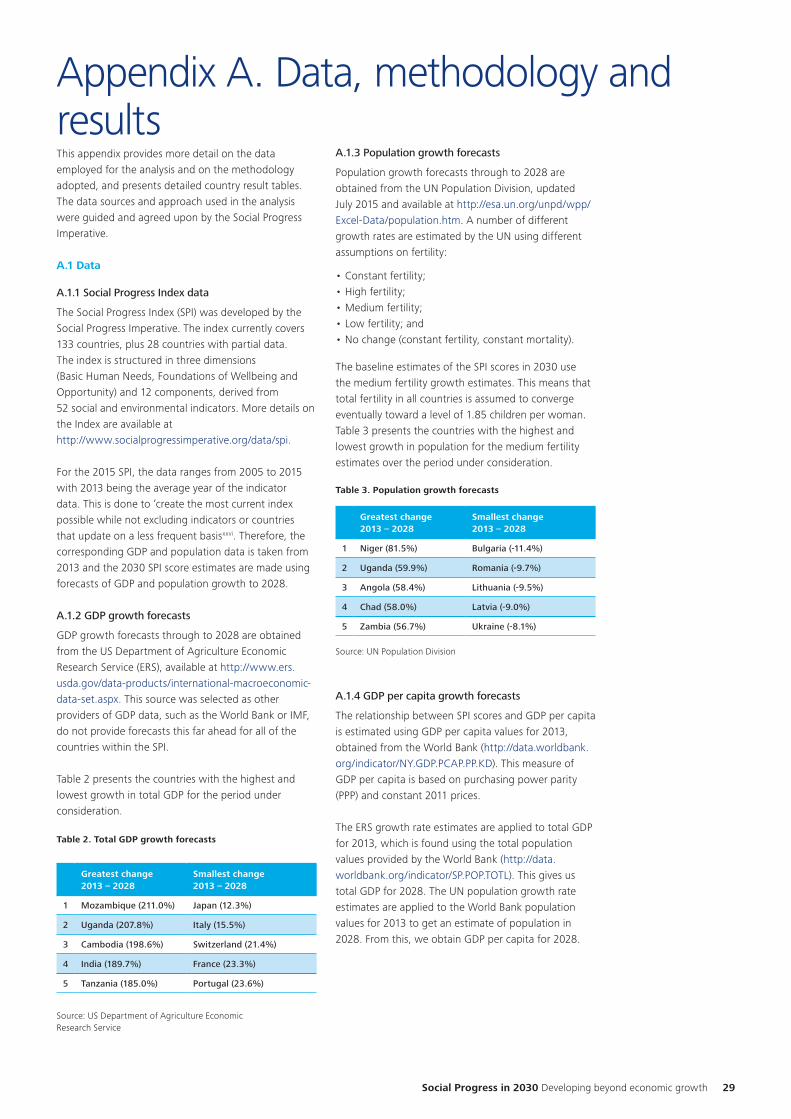
To start a new section, hold down the apple+shift keys and click
to release this object and type the section title in the box below.
This appendix provides more detail on the data employed for the analysis and on the methodology adopted, and presents detailed country result tables. The data sources and approach used in the analysis were guided and agreed upon by the Social Progress Imperative.
A.1 Data
A.1.1 Social Progress Index data
The Social Progress Index (SPI) was developed by the Social Progress Imperative. The index currently covers 133 countries, plus 28 countries with partial data. The index is structured in three dimensions (Basic Human Needs, Foundations of Wellbeing and Opportunity) and 12 components, derived from 52 social and environmental indicators. More details on the Index are available at http://www.socialprogressimperative.org/data/spi.
For the 2015 SPI, the data ranges from 2005 to 2015 with 2013 being the average year of the indicator data. This is done to ‘create the most current index possible while not excluding indicators or countries that update on a less frequent basisxxvi. Therefore, the corresponding GDP and population data is taken from 2013 and the 2030 SPI score estimates are made using forecasts of GDP and population growth to 2028.
A.1.2 GDP growth forecasts
GDP growth forecasts through to 2028 are obtained from the US Department of Agriculture Economic Research Service (ERS), available at http://www.ers.usda.gov/data-products/international-macroeconomic-data-set.aspx. This source was selected as other providers of GDP data, such as the World Bank or IMF, do not provide forecasts this far ahead for all of the countries within the SPI.
Table 2 presents the countries with the highest and lowest growth in total GDP for the period under consideration.
Table 2. Total GDP growth forecasts
Source: US Department of Agriculture Economic Research Service
Source: UN Population Division
A.1.3 Population growth forecasts
Population growth forecasts through to 2028 are obtained from the UN Population Division, updated July 2015 and available at http://esa.un.org/unpd/wpp/Excel-Data/population.htm. A number of different growth rates are estimated by the UN using different assumptions on fertility:
• Constant fertility;• High fertility;• Medium fertility;• Low fertility; and• No change (constant fertility, constant mortality).
The baseline estimates of the SPI scores in 2030 use the medium fertility growth estimates. This means that total fertility in all countries is assumed to converge eventually toward a level of 1.85 children per woman. Table 3 presents the countries with the highest and lowest growth in population for the medium fertility estimates over the period under consideration.
Table 3. Population growth forecasts
Appendix A. Data, methodology and results
Greatest change 2013 – 2028
Smallest change 2013 – 2028
1 Mozambique (211.0%) Japan (12.3%)
2 Uganda (207.8%) Italy (15.5%)
3 Cambodia (198.6%) Switzerland (21.4%)
4 India (189.7%) France (23.3%)
5 Tanzania (185.0%) Portugal (23.6%)
A.1.4 GDP per capita growth forecasts
The relationship between SPI scores and GDP per capita is estimated using GDP per capita values for 2013, obtained from the World Bank (http://data.worldbank.org/indicator/NY.GDP.PCAP.PP.KD). This measure of GDP per capita is based on purchasing power parity (PPP) and constant 2011 prices.
The ERS growth rate estimates are applied to total GDP for 2013, which is found using the total population values provided by the World Bank (http://data.worldbank.org/indicator/SP.POP.TOTL). This gives us total GDP for 2028. The UN population growth rate estimates are applied to the World Bank population values for 2013 to get an estimate of population in 2028. From this, we obtain GDP per capita for 2028.
Greatest change 2013 – 2028
Smallest change 2013 – 2028
1 Niger (81.5%) Bulgaria (-11.4%)
2 Uganda (59.9%) Romania (-9.7%)
3 Angola (58.4%) Lithuania (-9.5%)
4 Chad (58.0%) Latvia (-9.0%)
5 Zambia (56.7%) Ukraine (-8.1%)
Social Progress in 2030 Developing beyond economic growth 29
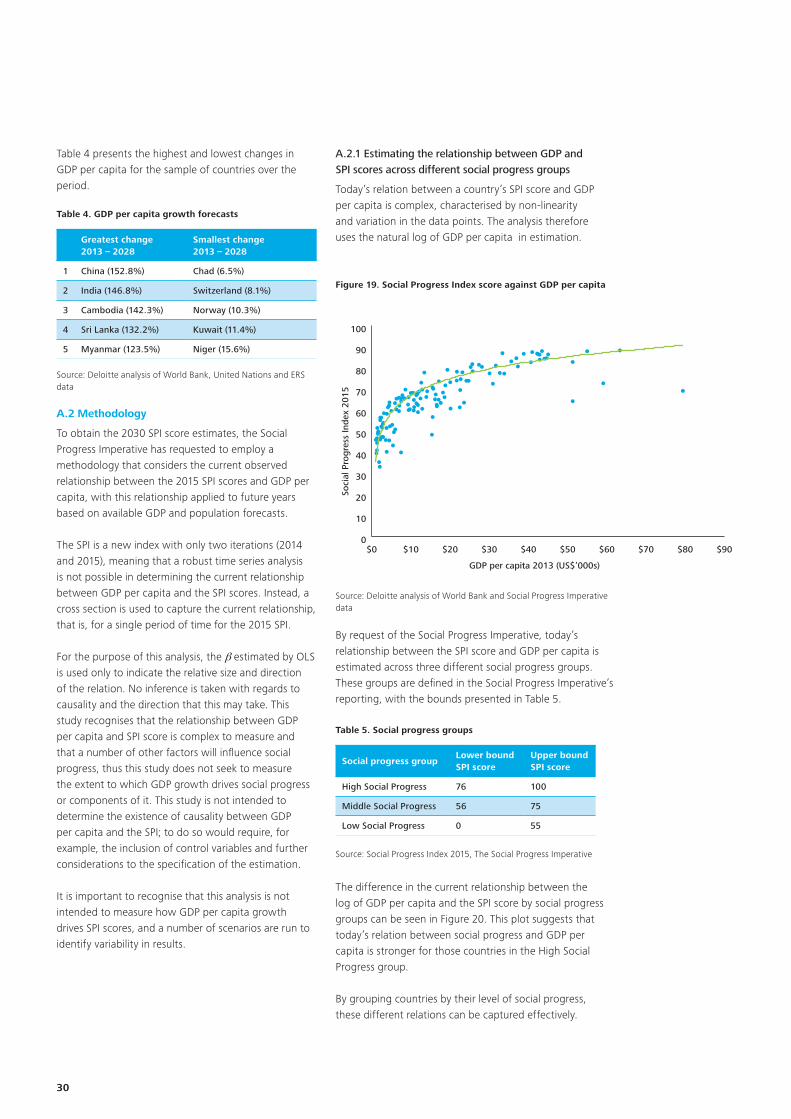
To start a new section, hold down the apple+shift keys and click
to release this object and type the section title in the box below.
Table 4 presents the highest and lowest changes in GDP per capita for the sample of countries over the period.
Table 4. GDP per capita growth forecasts
A.2 Methodology
To obtain the 2030 SPI score estimates, the Social Progress Imperative has requested to employ a methodology that considers the current observed relationship between the 2015 SPI scores and GDP per capita, with this relationship applied to future years based on available GDP and population forecasts.
The SPI is a new index with only two iterations (2014 and 2015), meaning that a robust time series analysis is not possible in determining the current relationship between GDP per capita and the SPI scores. Instead, a cross section is used to capture the current relationship, that is, for a single period of time for the 2015 SPI.
For the purpose of this analysis, the b estimated by OLS is used only to indicate the relative size and direction of the relation. No inference is taken with regards to causality and the direction that this may take. This study recognises that the relationship between GDP per capita and SPI score is complex to measure and that a number of other factors will influence social progress, thus this study does not seek to measure the extent to which GDP growth drives social progress or components of it. This study is not intended to determine the existence of causality between GDP per capita and the SPI; to do so would require, for example, the inclusion of control variables and further considerations to the specification of the estimation.
It is important to recognise that this analysis is not intended to measure how GDP per capita growth drives SPI scores, and a number of scenarios are run to identify variability in results.
Greatest change 2013 – 2028
Smallest change 2013 – 2028
1 China (152.8%) Chad (6.5%)
2 India (146.8%) Switzerland (8.1%)
3 Cambodia (142.3%) Norway (10.3%)
4 Sri Lanka (132.2%) Kuwait (11.4%)
5 Myanmar (123.5%) Niger (15.6%)
Social progress groupLower bound SPI score
Upper bound SPI score
High Social Progress 76 100
Middle Social Progress 56 75
Low Social Progress 0 55
A.2.1 Estimating the relationship between GDP and SPI scores across different social progress groups
Today’s relation between a country’s SPI score and GDP per capita is complex, characterised by non-linearity and variation in the data points. The analysis therefore uses the natural log of GDP per capita in estimation.
Figure 19. Social Progress Index score against GDP per capita
Table 5. Social progress groups
$0 $10 $20 $30 $40 $50 $60 $70 $80 $900
10
20
30
40
50
60
70
80
90
100
GDP per capita 2013 (US$’000s)
Soci
al P
rogr
ess
Inde
x 20
15
Source: Deloitte analysis of World Bank and Social Progress Imperative data
By request of the Social Progress Imperative, today’s relationship between the SPI score and GDP per capita is estimated across three different social progress groups. These groups are defined in the Social Progress Imperative’s reporting, with the bounds presented in Table 5.
The difference in the current relationship between the log of GDP per capita and the SPI score by social progress groups can be seen in Figure 20. This plot suggests that today’s relation between social progress and GDP per capita is stronger for those countries in the High Social Progress group.
By grouping countries by their level of social progress, these different relations can be captured effectively.
Source: Social Progress Index 2015, The Social Progress Imperative
Source: Deloitte analysis of World Bank, United Nations and ERS data
30
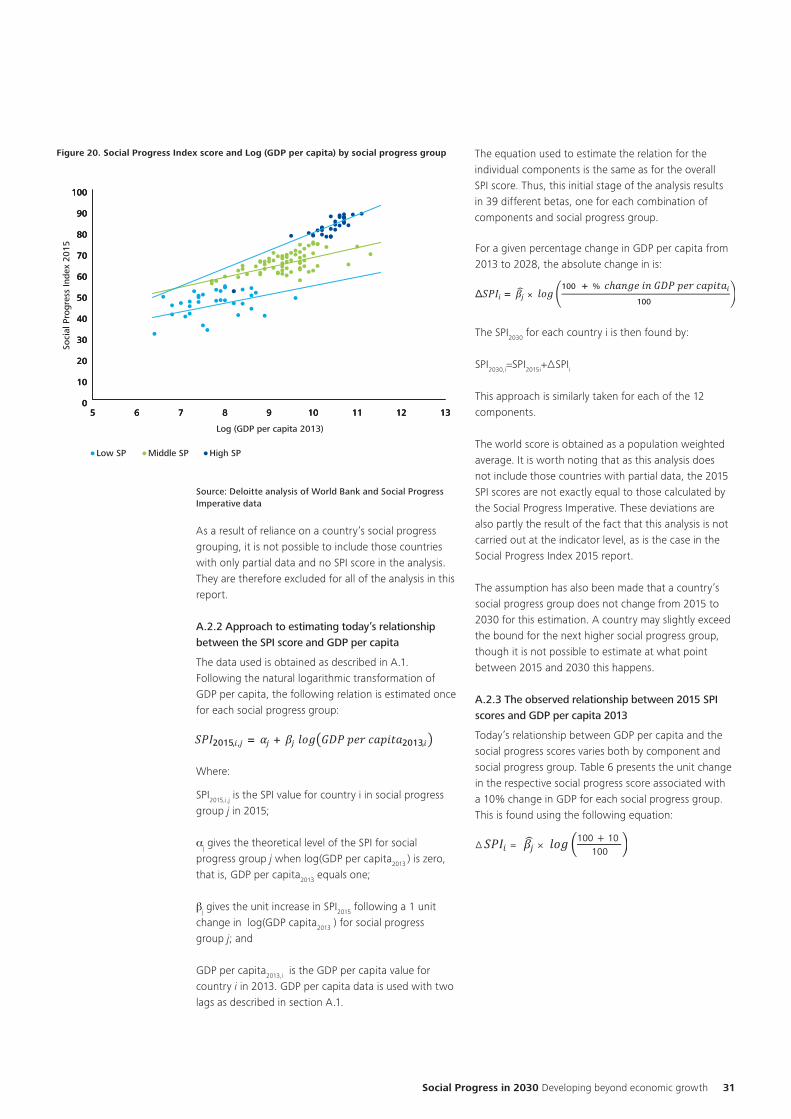
To start a new section, hold down the apple+shift keys and click
to release this object and type the section title in the box below.
5 6 7 8 9 10 11 12 130
10
20
30
40
50
60
70
80
90
100
5 6 7 8 9 10 11 12 130
10
20
30
40
50
60
70
80
90
100
5 6 7 8 9 10 11 12 130
10
20
30
40
50
60
70
80
90
100
Log (GDP per capita 2013)
Soci
al P
rogr
ess
Inde
x 20
15
Low SP Middle SP High SP
Figure 20. Social Progress Index score and Log (GDP per capita) by social progress group
Source: Deloitte analysis of World Bank and Social Progress Imperative data
As a result of reliance on a country’s social progress grouping, it is not possible to include those countries with only partial data and no SPI score in the analysis. They are therefore excluded for all of the analysis in this report.
A.2.2 Approach to estimating today’s relationship between the SPI score and GDP per capita
The data used is obtained as described in A.1. Following the natural logarithmic transformation of GDP per capita, the following relation is estimated once for each social progress group:
For a given percentage change in GDP per capita from 2013 to 2028, the absolute change in is:
2015, , = + 2013,
Where:
SPI2015,i,j is the SPI value for country i in social progress group j in 2015;
aj gives the theoretical level of the SPI for social progress group j when log(GDP per capita2013 ) is zero, that is, GDP per capita2013 equals one;
bj gives the unit increase in SPI2015 following a 1 unit change in log(GDP capita2013 ) for social progress group j; and
GDP per capita2013,i is the GDP per capita value for country i in 2013. GDP per capita data is used with two lags as described in section A.1.
∆ = ×100 + % ℎ
100
The SPI2030 for each country i is then found by:
SPI2030,i=SPI2015i+∆SPIi
This approach is similarly taken for each of the 12 components.
The world score is obtained as a population weighted average. It is worth noting that as this analysis does not include those countries with partial data, the 2015 SPI scores are not exactly equal to those calculated by the Social Progress Imperative. These deviations are also partly the result of the fact that this analysis is not carried out at the indicator level, as is the case in the Social Progress Index 2015 report.
The assumption has also been made that a country’s social progress group does not change from 2015 to 2030 for this estimation. A country may slightly exceed the bound for the next higher social progress group, though it is not possible to estimate at what point between 2015 and 2030 this happens.
A.2.3 The observed relationship between 2015 SPI scores and GDP per capita 2013
Today’s relationship between GDP per capita and the social progress scores varies both by component and social progress group. Table 6 presents the unit change in the respective social progress score associated with a 10% change in GDP for each social progress group. This is found using the following equation:
∆ = ×100 + 10
100
The equation used to estimate the relation for the individual components is the same as for the overall SPI score. Thus, this initial stage of the analysis results in 39 different betas, one for each combination of components and social progress group.
Social Progress in 2030 Developing beyond economic growth 31
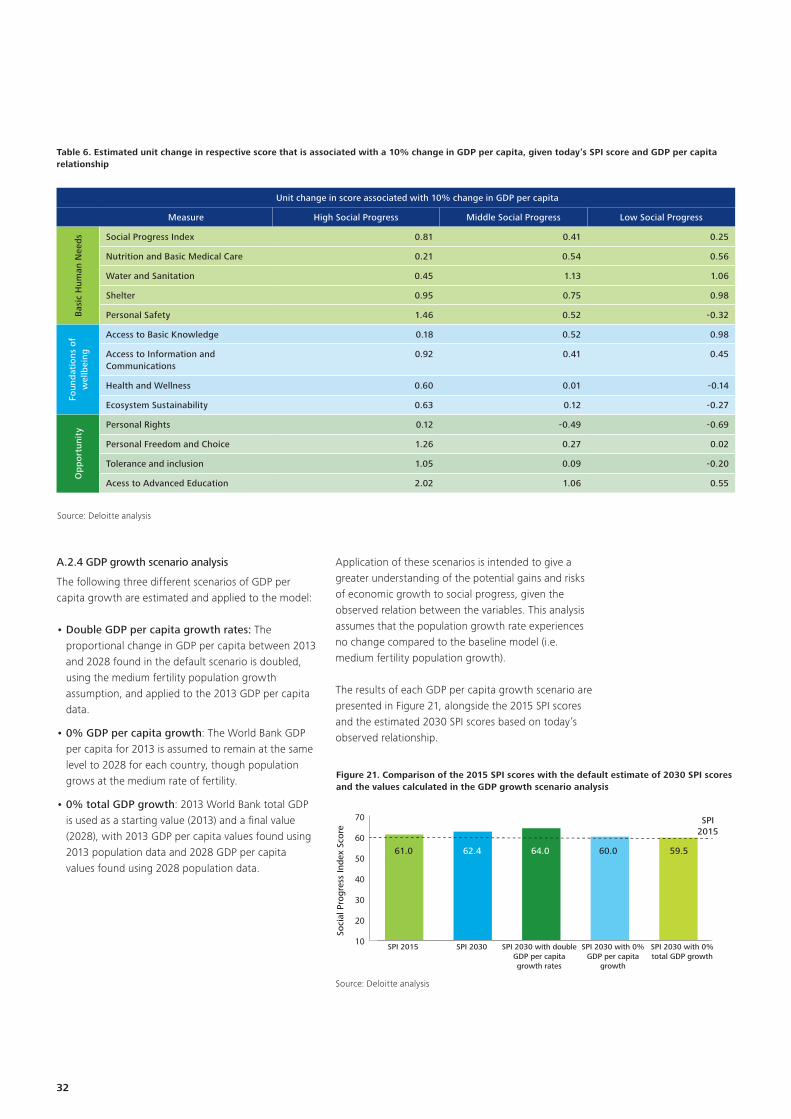
To start a new section, hold down the apple+shift keys and click
to release this object and type the section title in the box below.
Unit change in score associated with 10% change in GDP per capita
Measure High Social Progress Middle Social Progress Low Social Progress
Bas
ic H
uman
Nee
ds Social Progress Index 0.81 0.41 0.25
Nutrition and Basic Medical Care 0.21 0.54 0.56
Water and Sanitation 0.45 1.13 1.06
Shelter 0.95 0.75 0.98
Personal Safety 1.46 0.52 -0.32
Foun
dat
ions
of
wel
lbei
ng
Access to Basic Knowledge 0.18 0.52 0.98
Access to Information and Communications
0.92 0.41 0.45
Health and Wellness 0.60 0.01 -0.14
Ecosystem Sustainability 0.63 0.12 -0.27
Op
po
rtun
ity Personal Rights 0.12 -0.49 -0.69
Personal Freedom and Choice 1.26 0.27 0.02
Tolerance and inclusion 1.05 0.09 -0.20
Acess to Advanced Education 2.02 1.06 0.55
Table 6. Estimated unit change in respective score that is associated with a 10% change in GDP per capita, given today’s SPI score and GDP per capita relationship
A.2.4 GDP growth scenario analysis
The following three different scenarios of GDP per capita growth are estimated and applied to the model:
• Double GDP per capita growth rates: The proportional change in GDP per capita between 2013 and 2028 found in the default scenario is doubled, using the medium fertility population growth assumption, and applied to the 2013 GDP per capita data.
• 0% GDP per capita growth: The World Bank GDP per capita for 2013 is assumed to remain at the same level to 2028 for each country, though population grows at the medium rate of fertility.
• 0% total GDP growth: 2013 World Bank total GDP is used as a starting value (2013) and a final value (2028), with 2013 GDP per capita values found using 2013 population data and 2028 GDP per capita values found using 2028 population data.
Application of these scenarios is intended to give a greater understanding of the potential gains and risks of economic growth to social progress, given the observed relation between the variables. This analysis assumes that the population growth rate experiences no change compared to the baseline model (i.e. medium fertility population growth).
The results of each GDP per capita growth scenario are presented in Figure 21, alongside the 2015 SPI scores and the estimated 2030 SPI scores based on today’s observed relationship.
10
20
30
40
50
60
70
Soci
al P
rogr
ess
Inde
x Sc
ore
SPI 2015 SPI 2030 SPI 2030 with doubleGDP per capitagrowth rates
SPI 2030 with 0%GDP per capita
growth
SPI 2030 with 0%total GDP growth
61.0 62.4
SPI2015
64.0 60.0 59.5
Figure 21. Comparison of the 2015 SPI scores with the default estimate of 2030 SPI scores and the values calculated in the GDP growth scenario analysis
32
Source: Deloitte analysis
Source: Deloitte analysis
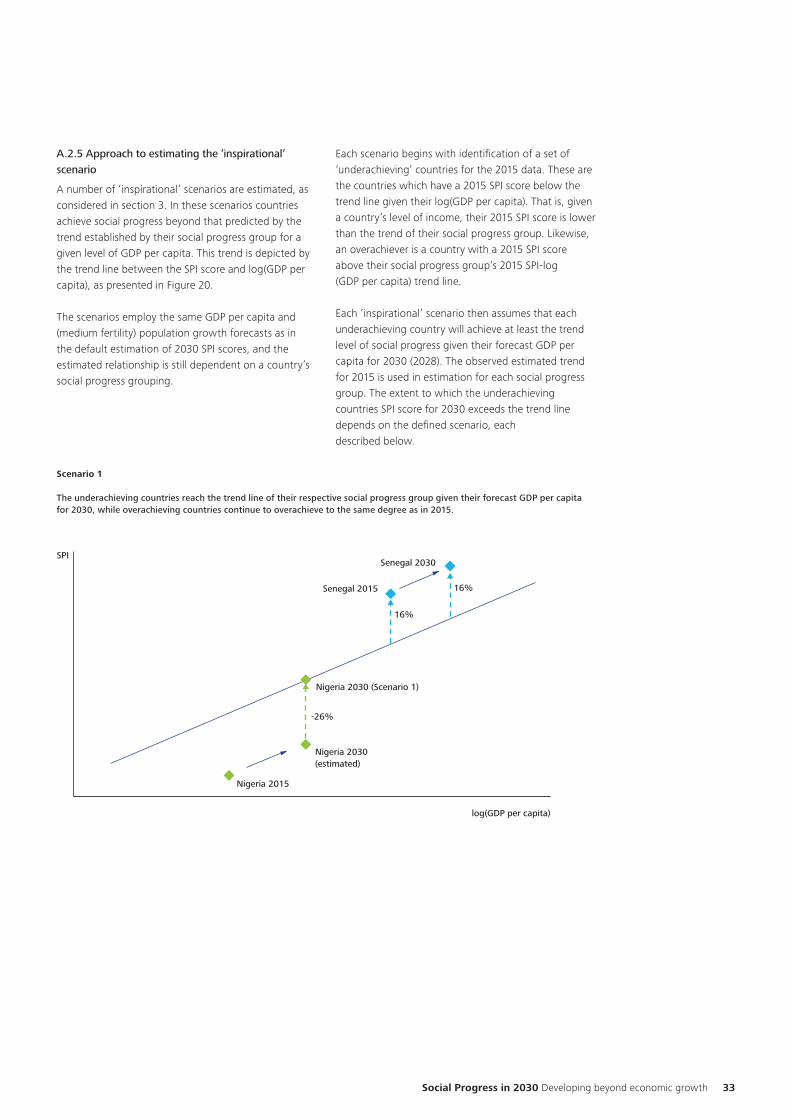
To start a new section, hold down the apple+shift keys and click
to release this object and type the section title in the box below.
Social Progress in 2030 Developing beyond economic growth 33
A.2.5 Approach to estimating the ‘inspirational’ scenario
A number of ‘inspirational’ scenarios are estimated, as considered in section 3. In these scenarios countries achieve social progress beyond that predicted by the trend established by their social progress group for a given level of GDP per capita. This trend is depicted by the trend line between the SPI score and log(GDP per capita), as presented in Figure 20.
The scenarios employ the same GDP per capita and (medium fertility) population growth forecasts as in the default estimation of 2030 SPI scores, and the estimated relationship is still dependent on a country’s social progress grouping.
Each scenario begins with identification of a set of ‘underachieving’ countries for the 2015 data. These are the countries which have a 2015 SPI score below the trend line given their log(GDP per capita). That is, given a country’s level of income, their 2015 SPI score is lower than the trend of their social progress group. Likewise, an overachiever is a country with a 2015 SPI score above their social progress group’s 2015 SPI-log (GDP per capita) trend line.
Each ‘inspirational’ scenario then assumes that each underachieving country will achieve at least the trend level of social progress given their forecast GDP per capita for 2030 (2028). The observed estimated trend for 2015 is used in estimation for each social progress group. The extent to which the underachieving countries SPI score for 2030 exceeds the trend line depends on the defined scenario, each described below.
Scenario 1
The underachieving countries reach the trend line of their respective social progress group given their forecast GDP per capita for 2030, while overachieving countries continue to overachieve to the same degree as in 2015.
Scenario 1
log(GDP per capita)
SPI
Nigeria 2015
Nigeria 2030 (estimated)
Nigeria 2030 (Scenario 1)
Senegal 2030
Senegal 2015
16%
16%
-26%
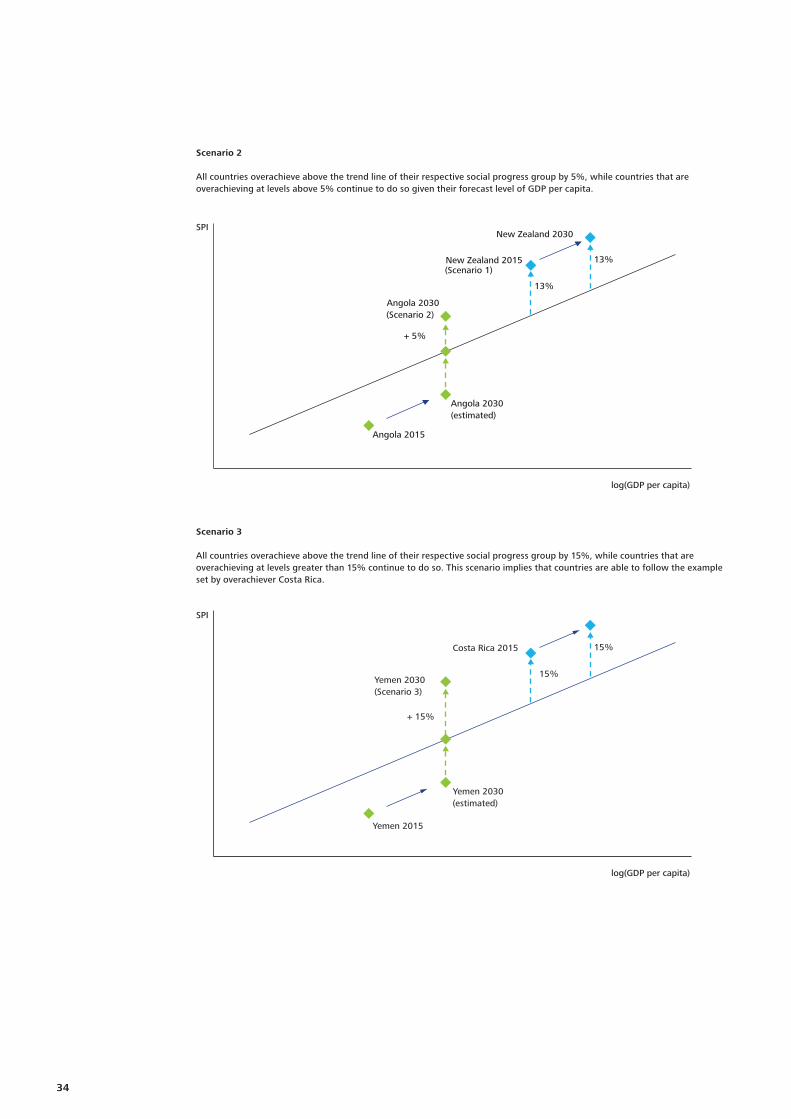
To start a new section, hold down the apple+shift keys and click
to release this object and type the section title in the box below.
34
Scenario 2
All countries overachieve above the trend line of their respective social progress group by 5%, while countries that are overachieving at levels above 5% continue to do so given their forecast level of GDP per capita.
Scenario 3
All countries overachieve above the trend line of their respective social progress group by 15%, while countries that are overachieving at levels greater than 15% continue to do so. This scenario implies that countries are able to follow the example set by overachiever Costa Rica.
Scenario 2
log(GDP per capita)
SPI
(Scenario 1)
Angola 2015
Angola 2030 (estimated)
New Zealand 2030
New Zealand 2015
13%
+ 5%
Angola 2030 (Scenario 2)
13%
Scenario 3
log(GDP per capita)
SPI
Yemen 2015
Yemen 2030 (estimated)
Costa Rica 2015
15%
+ 15%
Yemen 2030 (Scenario 3)
15%
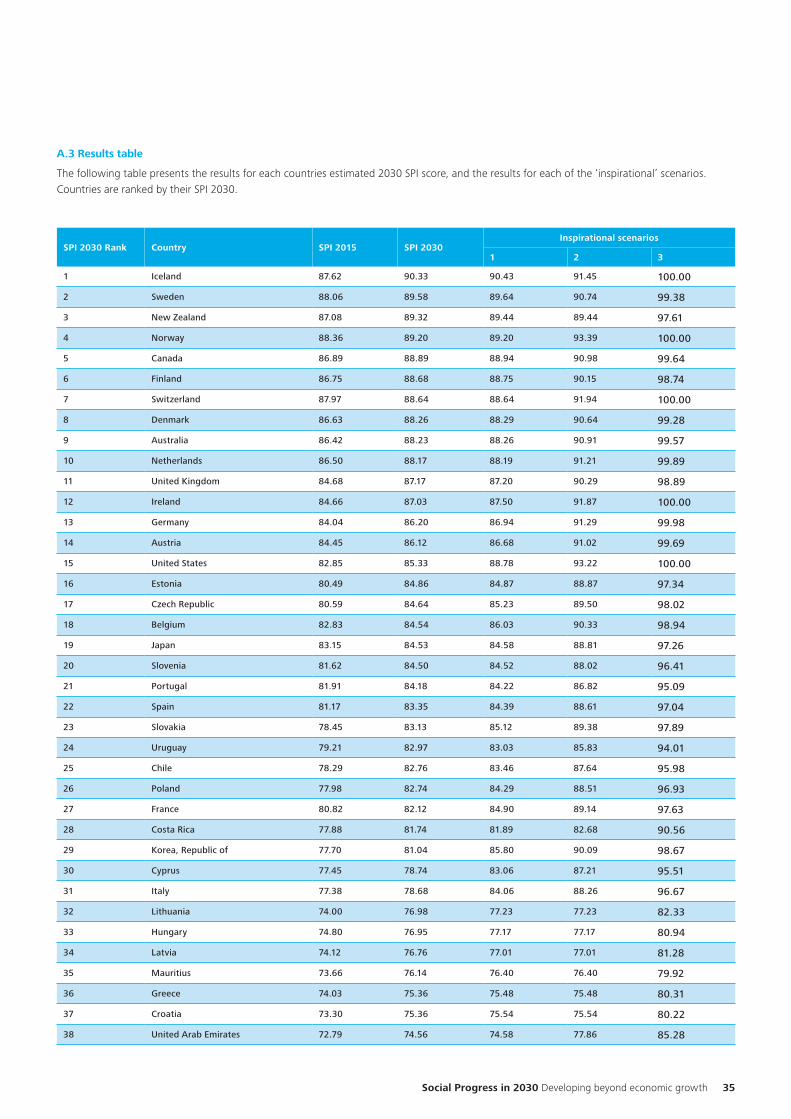
To start a new section, hold down the apple+shift keys and click
to release this object and type the section title in the box below.
Social Progress in 2030 Developing beyond economic growth 35
A.3 Results table
The following table presents the results for each countries estimated 2030 SPI score, and the results for each of the ‘inspirational’ scenarios. Countries are ranked by their SPI 2030.
SPI 2030 Rank Country SPI 2015 SPI 2030Inspirational scenarios
1 2 3
1 Iceland 87.62 90.33 90.43 91.45 100.00
2 Sweden 88.06 89.58 89.64 90.74 99.38
3 New Zealand 87.08 89.32 89.44 89.44 97.61
4 Norway 88.36 89.20 89.20 93.39 100.00
5 Canada 86.89 88.89 88.94 90.98 99.64
6 Finland 86.75 88.68 88.75 90.15 98.74
7 Switzerland 87.97 88.64 88.64 91.94 100.00
8 Denmark 86.63 88.26 88.29 90.64 99.28
9 Australia 86.42 88.23 88.26 90.91 99.57
10 Netherlands 86.50 88.17 88.19 91.21 99.89
11 United Kingdom 84.68 87.17 87.20 90.29 98.89
12 Ireland 84.66 87.03 87.50 91.87 100.00
13 Germany 84.04 86.20 86.94 91.29 99.98
14 Austria 84.45 86.12 86.68 91.02 99.69
15 United States 82.85 85.33 88.78 93.22 100.00
16 Estonia 80.49 84.86 84.87 88.87 97.34
17 Czech Republic 80.59 84.64 85.23 89.50 98.02
18 Belgium 82.83 84.54 86.03 90.33 98.94
19 Japan 83.15 84.53 84.58 88.81 97.26
20 Slovenia 81.62 84.50 84.52 88.02 96.41
21 Portugal 81.91 84.18 84.22 86.82 95.09
22 Spain 81.17 83.35 84.39 88.61 97.04
23 Slovakia 78.45 83.13 85.12 89.38 97.89
24 Uruguay 79.21 82.97 83.03 85.83 94.01
25 Chile 78.29 82.76 83.46 87.64 95.98
26 Poland 77.98 82.74 84.29 88.51 96.93
27 France 80.82 82.12 84.90 89.14 97.63
28 Costa Rica 77.88 81.74 81.89 82.68 90.56
29 Korea, Republic of 77.70 81.04 85.80 90.09 98.67
30 Cyprus 77.45 78.74 83.06 87.21 95.51
31 Italy 77.38 78.68 84.06 88.26 96.67
32 Lithuania 74.00 76.98 77.23 77.23 82.33
33 Hungary 74.80 76.95 77.17 77.17 80.94
34 Latvia 74.12 76.76 77.01 77.01 81.28
35 Mauritius 73.66 76.14 76.40 76.40 79.92
36 Greece 74.03 75.36 75.48 75.48 80.31
37 Croatia 73.30 75.36 75.54 75.54 80.22
38 United Arab Emirates 72.79 74.56 74.58 77.86 85.28
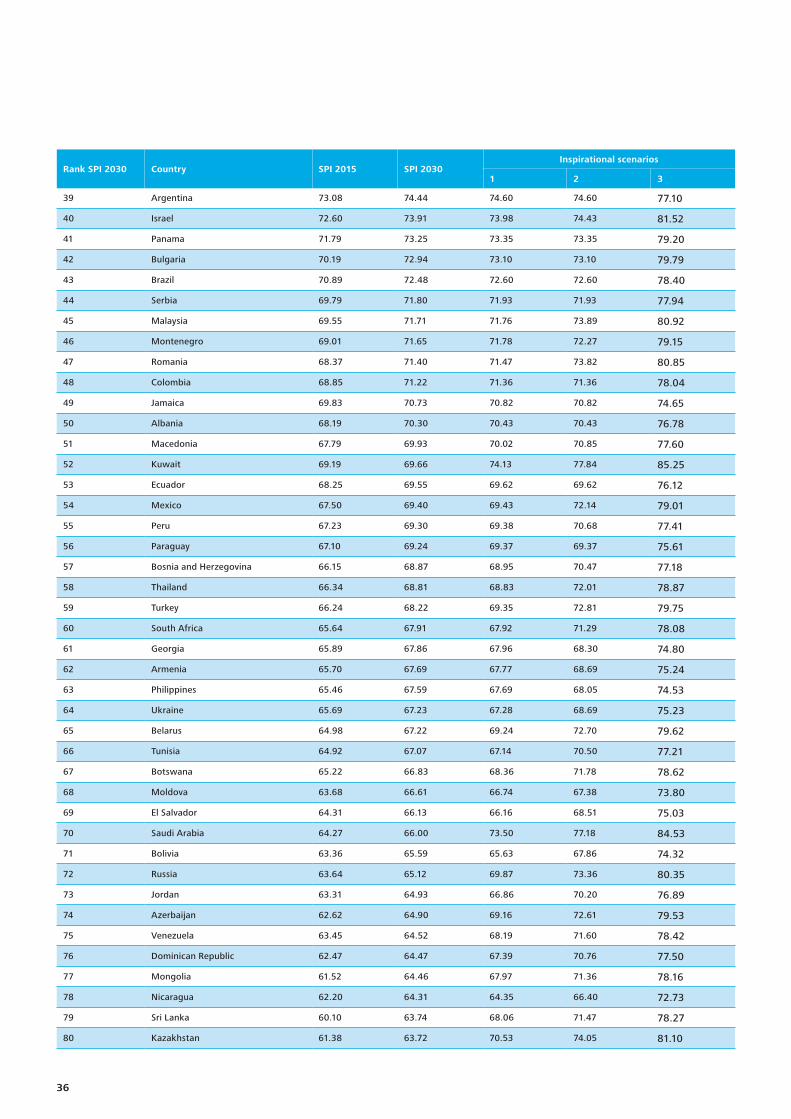
To start a new section, hold down the apple+shift keys and click
to release this object and type the section title in the box below.
36
Rank SPI 2030 Country SPI 2015 SPI 2030Inspirational scenarios
1 2 3
39 Argentina 73.08 74.44 74.60 74.60 77.10
40 Israel 72.60 73.91 73.98 74.43 81.52
41 Panama 71.79 73.25 73.35 73.35 79.20
42 Bulgaria 70.19 72.94 73.10 73.10 79.79
43 Brazil 70.89 72.48 72.60 72.60 78.40
44 Serbia 69.79 71.80 71.93 71.93 77.94
45 Malaysia 69.55 71.71 71.76 73.89 80.92
46 Montenegro 69.01 71.65 71.78 72.27 79.15
47 Romania 68.37 71.40 71.47 73.82 80.85
48 Colombia 68.85 71.22 71.36 71.36 78.04
49 Jamaica 69.83 70.73 70.82 70.82 74.65
50 Albania 68.19 70.30 70.43 70.43 76.78
51 Macedonia 67.79 69.93 70.02 70.85 77.60
52 Kuwait 69.19 69.66 74.13 77.84 85.25
53 Ecuador 68.25 69.55 69.62 69.62 76.12
54 Mexico 67.50 69.40 69.43 72.14 79.01
55 Peru 67.23 69.30 69.38 70.68 77.41
56 Paraguay 67.10 69.24 69.37 69.37 75.61
57 Bosnia and Herzegovina 66.15 68.87 68.95 70.47 77.18
58 Thailand 66.34 68.81 68.83 72.01 78.87
59 Turkey 66.24 68.22 69.35 72.81 79.75
60 South Africa 65.64 67.91 67.92 71.29 78.08
61 Georgia 65.89 67.86 67.96 68.30 74.80
62 Armenia 65.70 67.69 67.77 68.69 75.24
63 Philippines 65.46 67.59 67.69 68.05 74.53
64 Ukraine 65.69 67.23 67.28 68.69 75.23
65 Belarus 64.98 67.22 69.24 72.70 79.62
66 Tunisia 64.92 67.07 67.14 70.50 77.21
67 Botswana 65.22 66.83 68.36 71.78 78.62
68 Moldova 63.68 66.61 66.74 67.38 73.80
69 El Salvador 64.31 66.13 66.16 68.51 75.03
70 Saudi Arabia 64.27 66.00 73.50 77.18 84.53
71 Bolivia 63.36 65.59 65.63 67.86 74.32
72 Russia 63.64 65.12 69.87 73.36 80.35
73 Jordan 63.31 64.93 66.86 70.20 76.89
74 Azerbaijan 62.62 64.90 69.16 72.61 79.53
75 Venezuela 63.45 64.52 68.19 71.60 78.42
76 Dominican Republic 62.47 64.47 67.39 70.76 77.50
77 Mongolia 61.52 64.46 67.97 71.36 78.16
78 Nicaragua 62.20 64.31 64.35 66.40 72.73
79 Sri Lanka 60.10 63.74 68.06 71.47 78.27
80 Kazakhstan 61.38 63.72 70.53 74.05 81.10
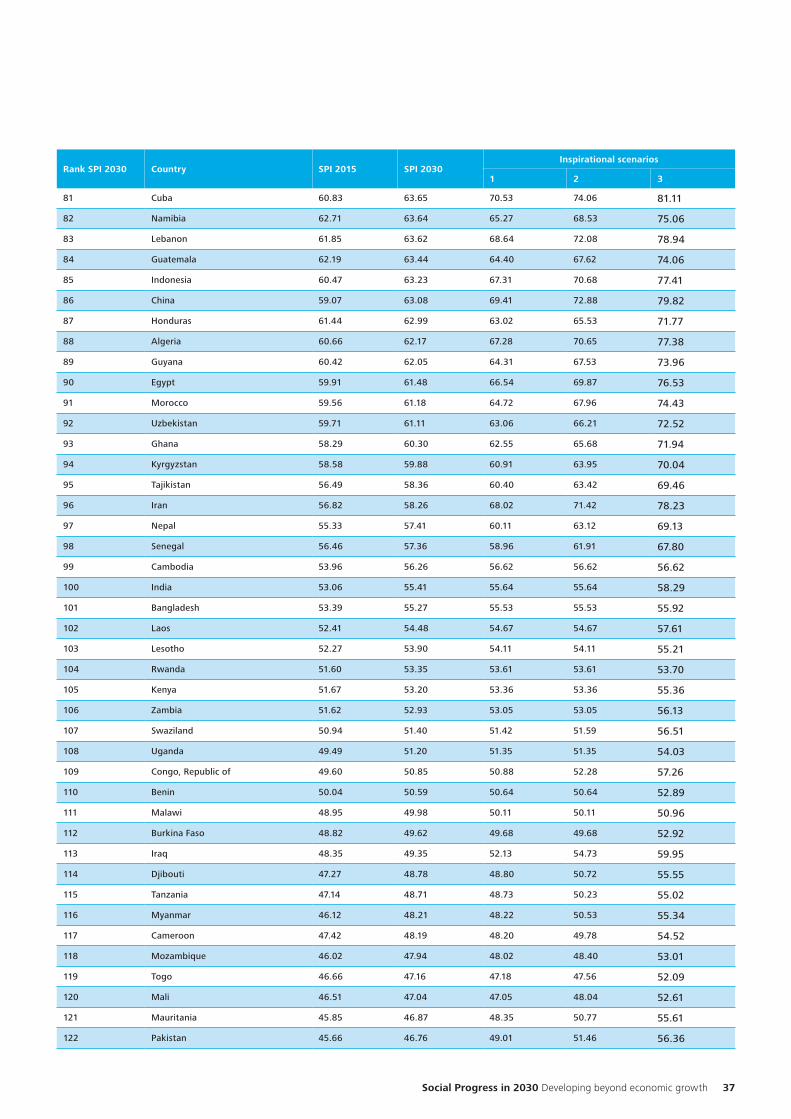
To start a new section, hold down the apple+shift keys and click
to release this object and type the section title in the box below.
Social Progress in 2030 Developing beyond economic growth 37
Rank SPI 2030 Country SPI 2015 SPI 2030Inspirational scenarios
1 2 3
81 Cuba 60.83 63.65 70.53 74.06 81.11
82 Namibia 62.71 63.64 65.27 68.53 75.06
83 Lebanon 61.85 63.62 68.64 72.08 78.94
84 Guatemala 62.19 63.44 64.40 67.62 74.06
85 Indonesia 60.47 63.23 67.31 70.68 77.41
86 China 59.07 63.08 69.41 72.88 79.82
87 Honduras 61.44 62.99 63.02 65.53 71.77
88 Algeria 60.66 62.17 67.28 70.65 77.38
89 Guyana 60.42 62.05 64.31 67.53 73.96
90 Egypt 59.91 61.48 66.54 69.87 76.53
91 Morocco 59.56 61.18 64.72 67.96 74.43
92 Uzbekistan 59.71 61.11 63.06 66.21 72.52
93 Ghana 58.29 60.30 62.55 65.68 71.94
94 Kyrgyzstan 58.58 59.88 60.91 63.95 70.04
95 Tajikistan 56.49 58.36 60.40 63.42 69.46
96 Iran 56.82 58.26 68.02 71.42 78.23
97 Nepal 55.33 57.41 60.11 63.12 69.13
98 Senegal 56.46 57.36 58.96 61.91 67.80
99 Cambodia 53.96 56.26 56.62 56.62 56.62
100 India 53.06 55.41 55.64 55.64 58.29
101 Bangladesh 53.39 55.27 55.53 55.53 55.92
102 Laos 52.41 54.48 54.67 54.67 57.61
103 Lesotho 52.27 53.90 54.11 54.11 55.21
104 Rwanda 51.60 53.35 53.61 53.61 53.70
105 Kenya 51.67 53.20 53.36 53.36 55.36
106 Zambia 51.62 52.93 53.05 53.05 56.13
107 Swaziland 50.94 51.40 51.42 51.59 56.51
108 Uganda 49.49 51.20 51.35 51.35 54.03
109 Congo, Republic of 49.60 50.85 50.88 52.28 57.26
110 Benin 50.04 50.59 50.64 50.64 52.89
111 Malawi 48.95 49.98 50.11 50.11 50.96
112 Burkina Faso 48.82 49.62 49.68 49.68 52.92
113 Iraq 48.35 49.35 52.13 54.73 59.95
114 Djibouti 47.27 48.78 48.80 50.72 55.55
115 Tanzania 47.14 48.71 48.73 50.23 55.02
116 Myanmar 46.12 48.21 48.22 50.53 55.34
117 Cameroon 47.42 48.19 48.20 49.78 54.52
118 Mozambique 46.02 47.94 48.02 48.40 53.01
119 Togo 46.66 47.16 47.18 47.56 52.09
120 Mali 46.51 47.04 47.05 48.04 52.61
121 Mauritania 45.85 46.87 48.35 50.77 55.61
122 Pakistan 45.66 46.76 49.01 51.46 56.36
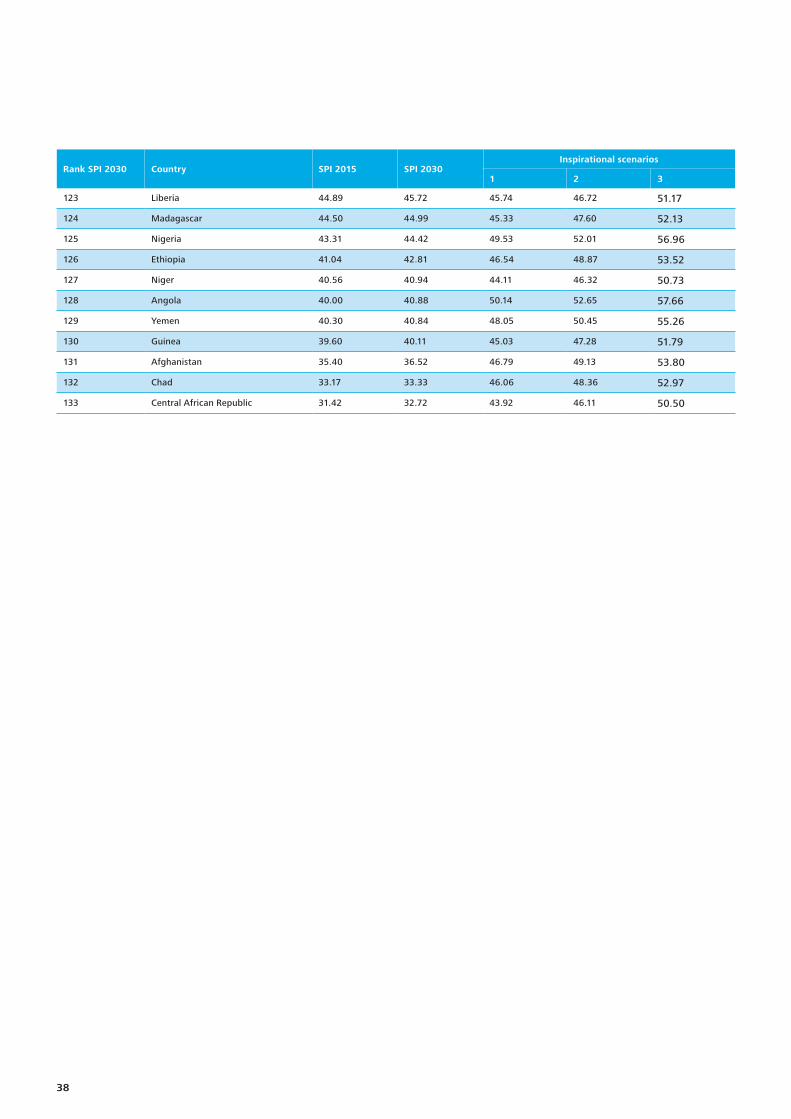
To start a new section, hold down the apple+shift keys and click
to release this object and type the section title in the box below.
38
Rank SPI 2030 Country SPI 2015 SPI 2030Inspirational scenarios
1 2 3
123 Liberia 44.89 45.72 45.74 46.72 51.17
124 Madagascar 44.50 44.99 45.33 47.60 52.13
125 Nigeria 43.31 44.42 49.53 52.01 56.96
126 Ethiopia 41.04 42.81 46.54 48.87 53.52
127 Niger 40.56 40.94 44.11 46.32 50.73
128 Angola 40.00 40.88 50.14 52.65 57.66
129 Yemen 40.30 40.84 48.05 50.45 55.26
130 Guinea 39.60 40.11 45.03 47.28 51.79
131 Afghanistan 35.40 36.52 46.79 49.13 53.80
132 Chad 33.17 33.33 46.06 48.36 52.97
133 Central African Republic 31.42 32.72 43.92 46.11 50.50
To start a new section, hold down the apple+shift keys and click
to release this object and type the section title in the box below.
Contacts
The Social Progress Imperative
Michael Green
Executive DirectorThe Social Progress [email protected]
Deloitte
David Cruickshank
Global ChairmanDeloitte Touche Tohmatsu [email protected]
Author
Davide Strusani
Director, Economic Consulting Deloitte [email protected]
Social Progress in 2030 Developing beyond economic growth 39
To start a new section, hold down the apple+shift keys and click
to release this object and type the section title in the box below.
Endnotes
i. The Social Progress Imperative, which includes both the Social Progress Index and the Social Progress Network, is a non-profit organisation incorporated in the United States in 2012. http://www.socialprogressimperative.org/
ii. Publications by the Social Progress Imperative, including the Social Progress Index 2015 Report and the Social Progress Index 2015 Methodological Report, are available at http://www.socialprogressimperative.org/publications.
iii. This result assumes that factors unrelated to income also remain unchanged.
iv. The Social Progress Imperative sets out six different levels of social progress in their 2015 report: Very High, High, Upper Middle, Lower Middle, Low and Very Low. This can be reduced to three groups: High, Middle and Low.
v. Note that under this scenario it is GDP per capita growth rates that double, not GDP per capita itself.
vi. http://data.worldbank.org/country/costa-rica
vii. Social Progress Index 2015 Report, available http://www.socialprogressimperative.org/publications
viii. http://www.britishcouncil.org/sites/britishcouncil.uk2/files/understanding_india_report.pdf
ix. http://www.theguardian.com/world/2014/jun/09/india-government-zero-tolerance-violence-women
x. https://www.sensepublishers.com/media/1041-tertiary-education-at-a-glance-china.pdf and World Bank http://data.worldbank.org/indicator/SE.TER.ENRR
xi. http://www.landesa.org/china-survey-6/
xii. http://www.worldbank.org/en/news/feature/2014/03/21/indonesia-communities-work-to-improve-sanitation-access-to-clean-water
xiii. 2014 Nigeria: Impact Evaluation of Water, Sanitation and Hygiene (WASH) within the UNICEF Country Programme of Cooperation, Government of Nigeria and UNICEF, 2009-2013 http://www.unicef.org/evaldatabase/index_81154.html
xiv. https://freedomhouse.org/report/freedom-world/2014/indonesia#.VfAr7BFVikp
xv. http://tonyblairfaithfoundation.org/foundation/news/face-faith-be-developed-across-indonesia
xvi. http://www.wateraid.org/ng/what-we-do/the-crisis/water
xvii. https://www.wsp.org/sites/wsp.org/files/publications/WSP-ESI-Nigeria-brochure.pdf
xviii. http://www.education-inequalities.org/countries/pakistan#?dimension=sex&group=all&year=latest
xix. http://www.worldbank.org/en/results/2015/04/22/reaching-poorest-safety-net-pakistan
xx. http://www.worldbank.org/projects/P102608/punjab-education-sector-project?lang=en
xxi. http://www.pewforum.org/2015/02/26/religious-hostilities/
xxii. http://www.iadb.org/en/projects/project-description-title,1303.html?id=BR-L1343
xxiii. http://www.unicef.org/nigeria/NG_resources_wash2010.pdf
xxiv. http://www.saferworld.org.uk/where/pakistan
xxv. http://www.britishcouncil.org/sites/britishcouncil.uk2/files/understanding_india_report.pdf
xxvi. Social Progress Index 2015 Methodological Report http://www.socialprogressimperative.org/system/resources/
W1siZiIsIjIwMTUvMDQvMDkvMDIvMzcvMTgvOTMyLzIwMTVfTWV0aG9kb2xvZ3lfUmVwb3J0LnBkZiJdXQ/2015%20Methodology%20Report.pdf
40

Deloitte refers to one or more of Deloitte Touche Tohmatsu Limited (“DTTL”), a UK private company limited by guarantee, and its network of member firms, each of which is a legally separate and independent entity. Please see www.deloitte.co.uk/about for a detailed description of the legal structure of DTTL and its member firms.
Deloitte LLP is the United Kingdom member firm of DTTL.
This publication has been written in general terms and therefore cannot be relied on to cover specific situations; application of the principles set out will depend upon the particular circumstances involved and we recommend that you obtain professional advice before acting or refraining from acting on any of the contents of this publication. Deloitte LLP would be pleased to advise readers on how to apply the principles set out in this publication to their specific circumstances. Deloitte LLP accepts no duty of care or liability for any loss occasioned to any person acting or refraining from action as a result of any material in this publication.
© 2015 Deloitte LLP. All rights reserved.
Designed and produced by The Creative Studio at Deloitte, London. J1348