Embed Size (px)
Citation preview

Social Preferences and Political Participation
Forthcoming, Journal of Politics
Christopher T. Dawes
Department of Political Science, University of California, San Diego
Peter John Loewen
Department of Political Science, University of Toronto
James H. Fowler
School of Medicine and Department of Political Science, University of California, San Diego

Abstract
Models of political participation have begun to incorporate actors who possess “social
preferences”. However, these models have failed to take into account the potentially
incongruent political goals of di!erent social preference types. These goals are likely
to play an important role in shaping political behavior. To examine the e!ect of
distinct social preferences on political activity we conducted an experiment in which
participants played five rounds of a modified dictator game (Andreoni and Miller 2002).
We used the decisions in these games to determine their preference type and mapped
these types to reported political activity. Our results show that subjects who were
most interested in increasing total welfare in the dictator game were more likely to
participate in politics than subjects with selfish preferences, whereas subjects most
interested in reducing the di!erence between their own well-being and the well-being
of others were no more likely to participate than subjects with selfish preferences.
Keywords Political participation; behavioral economics; experiments; elec-
tions.
1

Rational choice models of political participation based on the assumption that actors
are purely self-interested typically fail to explain why so much participation occurs (Fiorina
1990).1 In these models the cost of participation, even if small, typically outweighs the
expected personal benefit of participation. If this is the case, we should observe very little
political participation, but in fact large numbers of citizens are politically active. Alternative
models have begun to incorporate actors who care not only about themselves, but also about
the well-being of others. In particular, formal models based on an assumption that actors
have “social preferences” have been constructed to explain voting behavior (Edlin et. al.
2007, Fowler 2006, Jankowski 2002, Jankowski 2004, Sandroni and Feddersen 2006) and
political participation more broadly (Fowler and Kam 2006). They have also been tested
empirically (Fowler 2006, Fowler and Kam 2006, Loewen 2010). This approach is motivated
in part by a vast literature within behavioral economics which shows that in an experimental
setting many individuals are willing to help others, often anonymous to them, even when
it is personally costly to do so. In models assuming political actors with social preferences,
individuals consider the benefits to themselves and to others they care about and weigh
them against the cost of participation. This decision-making calculus is “rational” in the
sense that individuals have complete and coherent preferences, but these preferences are not
purely selfish (Charness and Rabin 2002).
Thus far, the political science literature has treated social preferences in nearly mono-
lithic fashion–the principal type of social preference that has been considered is one in which
there is a direct correspondence between how concerned actors are for others and how much
2

they participate (Edlin, Gelman, and Kaplan 2007, Fowler 2006, Jankowski 2002, Jankowski
2004). The only exception to this has been allowing actors to express di!ering degrees of con-
cern for di!erent groups of citizens (Fowler and Kam 2006, Loewen 2010). While behavioral
economists have modeled, and observed in the laboratory, several distinct forms of concern
for the payo!s of others, thus far no studies have empirically related di!erent types of social
preferences to political participation. Our contribution is to demonstrate the di!ering rela-
tionships between di!erent types of social preferences and a composite measure of political
participation. By doing so, we move beyond both the more narrow consideration of uniform
social preferences and the act of voting. Our work thus speaks to both a social preferences
literature and to the much broader empirical literature concerned with the individual-level
di!erences that motivate political participation, whether senses of duty (Blais 2002), race
and gender (Leighley and Nagler 1992), information (Klassen 2005) or socioeconomic status
(Verba et. al. 1995).
Two prominent types of social preferences that have been identified are Rawlsian
and utilitarian preferences (Andreoni and Miller 2002).2 Both of these types extend utility
beyond narrow self-interest, but they di!er in important ways. Rawlsians care more about
reducing the di!erence between their own well-being and the well-being of others, whereas
utilitarians care more about increasing everyone’s average well-being. This di!erence is
important for applications of social preferences to political participation. Utilitarians might
participate more than those who are purely selfish, but only if political outcomes have an
e!ect on total social welfare. Similarly, Rawlsians might participate more than those who
3

are purely selfish, but only if political outcomes can be used to redistribute resources to
those most in need. In reality, politics probably influences both welfare and the distribution
of resources, but it is not clear which e!ect dominates or how much they a!ect participation
among those with other-regarding preferences.
This issue poses a potential limitation for empirical studies linking social preferences
to individual political behavior. Individuals with Rawlsian preferences and individuals with
utilitarian preferences both behave altruistically, or express a desire for altruism, rendering
them observationally equivalent if not examined carefully. In the parlance of the dictator
game, both types of subjects may give away money to others, though they may have di!erent
underlying motivations for this action. If these two groups do have di!erent views on politics
as a means for benefitting others, the more complex underlying relationship between social
preferences and political participation may be clouded by lumping the two groups together.
What is required is a behavioral measure which can reveal distinct motivations and then
map these motivations to political participation.
To examine the e!ect of distinct social preferences on political activity we designed
a two part study. First, we instructed participants to play five rounds of a modified dictator
game and used the decisions in these games to determine their preference type (Andreoni
and Miller 2002). Second, participants completed a detailed survey of their recent political
activity. This research design allows us to map revealed preferences to a large variety of
political activities. To preview our results, we find that subjects who were most interested in
increasing total welfare in the dictator game were more likely to participate in politics than
4
subjects with selfish preferences, whereas subjects most interested in reducing the di!erence
between their own well-being and the well-being of others were no more likely to participate
in politics than subjects with selfish preferences. These results highlight the importance of
accounting for heterogeneity when studying the link between social preferences and political
behavior. Indeed, the results that follow suggest that di!erent social preferences are related
to distinctly di!erent rates of political participation.
Social Preferences and Political Participation
Utilitarianism, in the words of John Harsanyi (1980, p.116), is concerned with “maximiz-
ing social utility...defined as the sum, or arithmetic mean, of all utilities.” Harsanyi (1980)
theorized that the paradox of voting could be overcome by individuals guided by utilitarian
principles. Voters deciding the fate of some policy measure they view as socially desirable,
he argued, would go to the polls, even though it was costly to do so, because voting would
yield higher social utility than abstaining. Edlin, Gelman, and Kaplan’s (2007) social benefit
model of voting, for example, is an extension of this thinking. The model assumes that the
benefit associated with participation is Bs+!NBo, where N is the number of people a!ected
by the political outcome, Bs is the benefit to oneself and Bo is the benefit to the average
voter if the preferred outcome occurs, and ! is a scalar measure, between zero and one, of
an individual’s level of altruism. The expected value of participation is P (Bs + !NBo)! C
where P is the probability that participation generates the desired political outcome. If
5

P " 1N (as many scholars have argued – see Gelman, King, and Boscardin 1998; Gelman,
Katz, and Bafumi 2004; Mulligan and Hunter 2003), this calculus of voting reduces to a
decision to vote when !Bo > C. This model is largely similar to those proposed by others
(Fowler 2006, Jankowski 2002, Jankowski 2004, Sandroni and Feddersen 2006). We note
that its logic extends to any act of political participation which resembles a collective action
problem and not only the act of voting.
Rawlsian preferences, on the other hand, have not been explicitly linked to politi-
cal participation in any formal or empirical model. Harsanyi (1975), in a criticism of John
Rawls’ maximin principle, o!ers a possible explanation for why a desire to reduce the dif-
ference between one’s own well-being and the well-being of others may not translate into
increased political participation. Harsanyi argues that focusing on this di!erence “would
require us to give absolute priority to the interests of the worst-o! individual, no matter
what, even under the most extreme conditions. Even if his interests were a!ected only in a
very minor way, and all other individuals in society had opposite interests of the greatest
importance, his interests would always override anybody else’s.”(p. 596) Political outcomes
are often redistributive, favoring one group over another, but individuals with Rawlsian pref-
erences would only support redistributions that strictly go to the worst-o!. Because politics
rarely is the venue for this type of redistribution, individuals with Rawlsian preferences may
devote their altruism to other outlets better capable of achieving their distributional goals.
For example, Andreoni and Vesterlund (2001) provide evidence of a possible link between
Rawlsian preferences and charitable giving. In the context of voting and other means of po-
6

litical engagement then, we should expect utilitarians to exhibit greater participation than
Rawlsians. Accordingly, our work examines this link between di!erent social preferences and
political participation across a number of acts of political engagement (Verba, Schlozman,
and Brady 1995).
Research Design
Our study was conducted at the University of California, Davis in the spring of 2005. Sub-
jects were recruited from various social science majors and were o!ered course credit for
participating in the study. A total of 234 subjects participated in the complete study. The
study had two parts. First, subjects were asked to make five decisions in what is called
the “dictator game”. Upon completion of the first task they were asked to complete a
questionnaire eliciting information about their political behavior and views, age, sex, and
socio-economic background. Subjects in the study ranged in age from 19 to 49 with an
average age of 20.6 years. The subject pool was 41% women and 56% of subjects identified
themselves as white.
The dictator game involves two “players”. The first player determines a split of some
endowment, usually a sum of money, between herself and the other player. The second player
simply receives whatever the first player has allocated to her and thus has no strategic role in
the game. If the first individual were only concerned with her own well-being, she would keep
the entire endowment and pass nothing. Therefore, any positive allocation to the second
7
player is viewed as altruistic behavior. For a review of the literature on the dictator game
see Camerer (2003).
Subjects in our study were asked to play five modified dictator games, modeled after
Andreoni and Miller (2002). In each dictator game, subjects were asked to split 10 lottery
tickets between themselves and an anonymous recipient. Subjects were informed that every
ticket they contributed would give the recipient either 1, 2, or 3 chances to win the prize
and every ticket they kept would give themselves either 1, 2, or 3 chances to win the prize,
depending on the game.3 The order of the games was randomized. This design serves to
vary the relative price of giving in order to check decisions against rationality conditions and
determine the social preference type of the subject.4
Subjects were informed that their participation made them eligible to win $100. They
were told that a number corresponding to a ticket would be randomly drawn and matched
with the subject holding it. As noted above, the drawing was weighted according to the type
of ticket held, with some giving the holder one chance, some giving them two chances, and
some giving them three chances. At the conclusion of the study, the winning number was
announced by email and a winner came forward with the winning ticket to claim the $100
prize. Fowler (2005) has shown that this type of experimental design yields results consistent
with those reported in experiments where subjects were asked to split a cash endowment.
Our results are also very similar to Andreoni and Miller (2002) leading us to conclude the
lottery prompts subjects to treat the experiment as if they were being paid for a randomly
chosen decision.
8

Though economists sometimes criticize low-stakes experiments like this one, a survey
of the experimental economics literature by Camerer and Hogarth (1999) shows that stake
size has only a small e!ect on average behavior and the biggest e!ect of stakes on behavior
is changing from zero to positive stakes. Furthermore, Carpenter, Verhoogen, and Burks
(2005) show specifically for the dictator game that changing from low stakes to high stakes
has no e!ect on mean allocations.
Finally, compared to verbal questions in which it is costless for a subject to succumb
to social desirability, behavioral measures from choices made in the dictator game require
subjects to pay a cost to reveal false social preferences in the name of social desirability.
By comparison, it is never financially costly in conventional survey research for a subject to
lie about their preferences. Accordingly, on the preferences side, at least, our design works
against social desirability better than conventional survey questions. Moreover, we have no
reason to believe that those who succumb to social desirability would be more likely to reveal
di!erent kinds of social preferences. For example, it is not clear whether egalitarian motives
or motives to maximize group welfare represent the most desirable outcome perceived by
subjects. As a result, desirability should not bias e!orts to classify subjects who express
social preferences.
9
Preferences
The modified dictator game provides two critical pieces of information. First, allocation
choices (subject to the budget constraint) in each relative price condition can be analyzed
to see if they meet the conditions required for rationality. Over 94% of our subjects made
consistent choices across the five games.5 Second, these choices can be used to determine
each subject’s preference type. A set of rational choices can be represented by a utility
function and thus key parameters of interest can be estimated econometrically in order to
provide more information about preferences.
Classification
Subjects were classified into three utility types: selfish, Rawlsian, and utilitarian. Strong
selfish types choose according to the utility function Us("s, "o) = "s, strong Rawlsians6
choose according to Us("s, "o) = min{"s, "o}, and strong utilitarians choose according to
Us("s, "o) = "s + "o where "s is the subject’s own payo! in the dictator game, "o is the
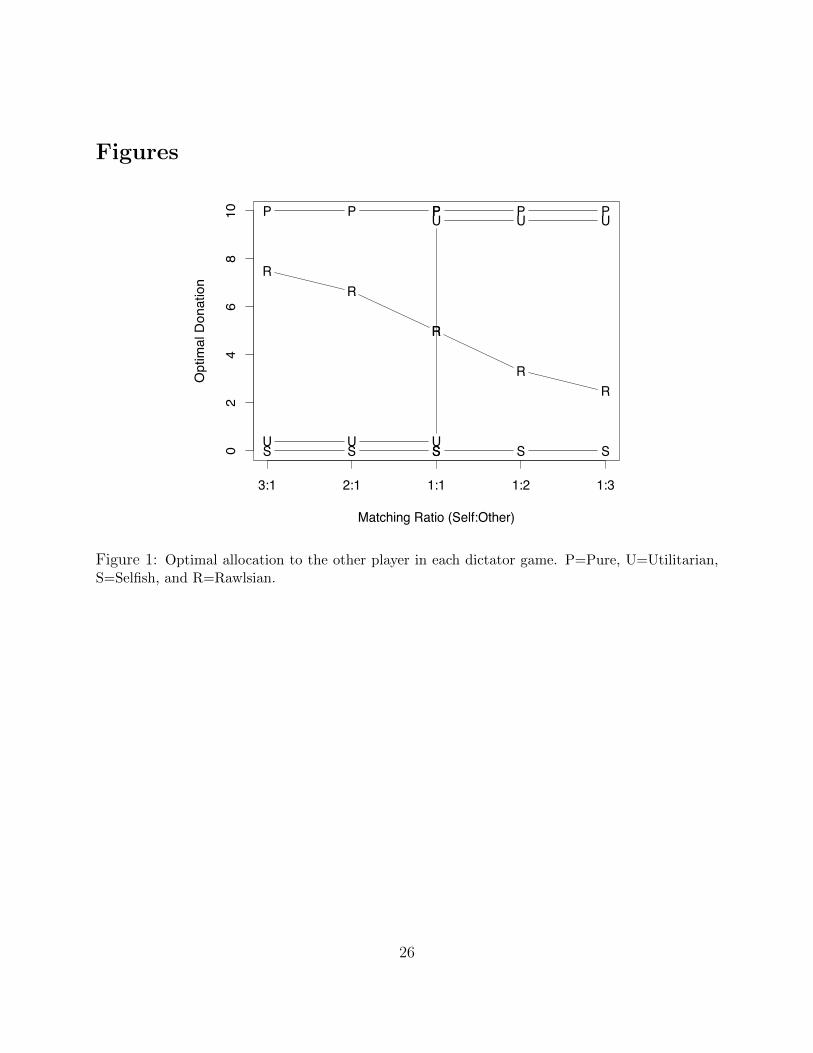
payo! to the other player, and Us is the subject’s utility. Optimal utility for each player
varies by type. These optimal utilities for each game are presented graphically in Figure
1. Notice that Rawlsians achieve optimal utility by giving progressively less as it becomes
less expensive to give.7 Meanwhile, utilitarians should keep everything when it is expensive
and give everything away when it is cheap. In other words, Rawlsians achieve maximum
utility by ensuring equal chances between themselves and the other player in each game,
10

while Utilitarians maximize utility by ensuring the greatest number of total chances between
themselves and other player.
[Figure 1 About Here]
Those subjects not perfectly falling into one of these three categories are grouped
into the category they most resemble based on the Euclidean distance of their allocation
choices from those of the strong utilitarian type.8 The breakdown of subjects into categories
is presented in Table 1. Pure subjects are those who gave all of their endowment away in
each of the five games.
[Table 1 About Here]
Our experiment yielded fewer subjects with utilitarian preference types and more self-
ish and Rawlsian types than Andreoni and Miller (2002). They find 47.2% of their sample
made up of selfish utility-types, 30.4% Rawlsian, and 22.4% utilitarian. The discrepancy
between our results and those of Andreoni and Miller may be explained by sampling di!er-
ences. Our study recruited subjects from a variety of social science majors, whereas Andreoni
and Miller used only upper-level economics students. Fehr, Naef, and Schmidt (2006), in
an experiment studying preferences for e"ciency versus equity, found that a majority of
economics students chose e"cient allocations over egalitarian ones, whereas a majority of
non-economics social science majors in the subject pool favored allocations consistent with
a desire to avoid inequality. It is likely that the significantly higher number of utilitarians
Andreoni and Miller found is partially an artifact of their sampling technique.
11

We perform two further tests of our estimates of subjects’ preferences, namely by
econometrically estimating a demand function for each utility type and by examining how
each utility type is related to stated preferences for equality. These further tests support our
classifications and can be found in the frist two sections of the Online Appendix.
Political Participation
Subjects in our study were asked a series of yes/no questions about what type of political
activity they engage in, as well as more detailed questions about their political attitudes and
interest in politics. We follow Verba, Schlozman, and Brady’s (1995) construction of an index
of overall political activity as the unweighted sums of yes/no responses. The components of
the index are volunteering for a candidate’s campaign, volunteering for a local government
board or council or attending regularly, initiating contact with a government o"cial, engaging
in informal community work, participating in a protest, contributing money to a candidate,
being a member of or giving money to an organization that takes stands on political issues,
and voting in the 2004 general election. Therefore, there is maximum of eight total acts
of political participation. We note that this index covers a range of conventional and non-
conventional (or formal and informal) activities, and is widely used (e.g. Burns, Schlozman,
and Verba 2001). Moreover, it resembles earlier measures of participation (e.g. Verba and
Nie 1972). It displays a respectably high internal consistency within our sample (Cronbach’s
! = 0.67).9
12

The study averages are: 28% of subjects volunteered for a campaign, 30% volunteered
for a local government or council, 47% initiated contact with a government o"cial, 39% did
informal community work, and 44% participated in a protest, 23% contributed money to
a candidate, 48% were members of or gave money to an organization that takes stands on
political issues and 75% voted in the 2004 general election. Subjects participated in 3.35
activities on average. This compares closely with Verba et al’s average estimate of 3 acts of
participation for college educated respondents (1995, p 207).
A simple examination of the raw data, presented in Table 2, suggests that utilitarian
participation is significantly greater than that of Rawlsian (p = 0.04 one-tailed test), pure
(p = 0.02 one-tailed test) and selfish (p = 0.005 one-tailed test) subjects. This analysis
is only suggestive of a relationship between social preferences and political participation.
An appropriate test must include controls for other variables known to influence political
participation.
[Table 2 About Here]
Regression Analysis
The first regression presented in Table 3 is a simple model with dichotomous variables for
Rawlsian and utilitarian preferences, as revealed in decisions made in the dictator game. We
also include a dichotomous variable for pure subjects, i.e. those who gave away their entire
endowment in all five games. The base category, not included in the model, is the selfish
13

utility type. Therefore, the participation among Rawlsian and utilitarian preferences types
is being compared to participation of selfish types. In other words, we are asking if Rawlsians
and utilitarians participate significantly more than selfish preference types. The simple model
shows that only the utilitarian preference type is significant (at the 5% level). We note that
this significant result is despite the small number of utilitarians present within our sample.
Utilitarians also appear more likely to participate than Rawlsians (F(1,231)=2.95, p=0.04
one-tailed).
[Table 3 About Here]
In order to control for other political, socioeconomic, and non-political institutional
a"liation variables that may influence levels of participation, we include several variables
studied by Verba, Schlozman, and Brady (1995) (their book provides an exhaustive review
of these variables). These variables include political controls for the respondent’s level of
interest in politics, how politically informed they are, their feelings about whether or not they
have a say in what government does, their party identification and how strongly they identify
with the party; socioeconomic controls for whether or not their family income is at or above
the sample median, gender, ethnicity, and age; and religious attendance and contributions
to control for non-political activity. Even with these controls added and even given our
small number of utilitarians, the coe"cient on utilitarian preferences remains significant
(p = 0.03). However, we note that in this specification, the di!erence in participation
between utilitarians and Rawlsians is less clear (F(1,218)=1.80, p=0.09, one-tailed). As was
14

found by Verba, Schlozman, and Brady (1995), political interest exerts a strong (significant)
influence on participation, whereas e"cacy and strength of partisanship do not. Our results
di!er from Verba, Schlozman, and Brady’s (1995) in that we do not find political information
and family income to be significant. This di!erence is most likely due to the lack of variation
present in these two variables, given our convenience sample. Finally, we find that that
partisan strength is not related to participation, but that partisanship is related. Republican
respondents are less likely to report engaging in political participation than Democratic
respondents.
A potential criticism of our analysis is that there are only eighteen utilitarian subjects
in our sample. A limited number of utilitarians makes it more di"cult to detect di!erences
in participation by preference type, due to a potential lack of power. But, as our results
show, we do not encounter this problem. We find a significant di!erence between utilitarian
and selfish voters even with a limited number of utilitarians in our sample.
Another objection is that valuable information is being lost by using dichotomous
variables for each utility type and that our results may be driven by our small number of
pure utilitarians. To address this objection, we have reestimated our models using contin-
uous measures of each utility type. For each measure, we calculate the Euclidean distance
between a purely selfish or altruistic allocation type and a strong Rawlsian or utilitarian
type. According to these measures, an individual with a 1 on Rawlsianism is the maximum
possible distance from another pure type, while an individual with a 0 on Rawlsianism is
the maximum possible distance from the pure Rawlsian type. The same logic applies for an
15

individual with a 1 or 0 on utilitarianism. We present these results in Table 4. As can be
seen, our results are robust to this other specification.
[Table 4 About Here]
The simple model and the model with controls are very similar to those presented
in Tables 2 and 3. The continuous measure of utilitarian preferences is significant with and
without controls but the measure of Rawlsian preferences is not in either case. A likelihood
ratio test also rejects adding a measure of selfish preferences to the model (the null hypothe-
sis that the coe"cient is zero fails to be rejected, p = 0.17). Once again, utilitarians appear
more likely to participate than Rawlsians (F(1,232)-2.83, p=0.04 one-tailed) in the simple
model. They also appear more likely to participate in the model with controls (F(1,219)
p=0.04 one-tailed). All of the control variables also maintain their signs and similar mag-
nitudes and significance. The interpretation of the utilitarian coe"cient is that as one gets
closer to having pure utilitarian preferences, the more politically active one becomes, con-
trolling for other potentially significant influences.
Finally, we note that we present a number of robustness checks in the Online Ap-
pendix. First, we replaced our revealed measures for utilitarian and Rawlsian preferences
with responses from the question used to probe expressed preferences for equality. When
added to the full model with controls, the coe"cient on this variable is insignificant (p =
0.18), suggesting that the dictator game measures more precisely capture the components
of altruism that contribute to political activity better than simple expressed preferences
16
for equality.10 Second, we present Huber regressions to account for the e!ects of possible
outliers on our estimations. Third, we present regressions which consider each participa-
tory act separately. Finally, we present results with pure altruists excluded, to demonstrate
that our results are not driven by this classification. Our results hold across each of these
specifications.
Conclusion
Our research design allows us to map individuals’ revealed social preferences to political
activity, and we are able to show that utilitarian social preferences make one more likely
to be politically active. This suggests that utilitarians view political activity as a means
to increase social welfare. Individuals with Rawlsian preferences, on the other hand, are no
more likely than selfish individuals to participate in politics. This is potentially because they
do not view politics as a means to help those least fortunate. An area for future research
is to explore the non-political activities of utilitarians and Rawlsians, such as religious or
charitable contributions and volunteering, to determine if this is indeed the case.
Our work has two clear limitations. First, we have elicited just two types of social
preferences, while others exist. Future work could distinguish further other variants, such
as paternalist or nosy preferences (Sen 1976) or spitefulness (van Lange 1999). Second, our
experiment was conducted on a convenience sample of university students. The relationships
we have uncovered may exist only among similar populations. Future replications of our
17

experiment on more general populations would test the generalizability of our findings.
Our current results speak directly to existing work on social preferences and political
participation, especially given their conflicting results. For example, Fowler (2006) finds that
altruism, as measured in a single dictator game, has a positive but not significant direct e!ect
on the tendency to vote, while Fowler and Kam (2006) find that general altruism and altruism
particular to certain groups, as revealed in dictator games, both predict political activity.
Finally, Loewen (2010) finds that general altruism, as measured in dictator games, does not
predict the decision to vote, but altruism towards certain groups does. He also finds that
turnout increases as the size of groups increases. Our results qualify this previous work by
highlighting the importance of di!erent types of social preferences. Such di!erences cannot
be uncovered in a conventional dictator game. Since Rawlsians tend to split their allocation
50-50 in a normal dictator game, utilitarians might do the same since the total amount
divided remains the same for any split. Thus, both the pool of self-interested subjects (those
who give nothing) and the pool of altruistic subjects (those who give something) might
contain utilitarians. Moreover, the pool of altruists contains Rawlsians who apparently
do not participate in politics any more than self-interested subjects do. The inability to
distinguish these disparate motivations means that a simple attempt to correlate giving in
a single dictator game with political participation is likely to show only a weak (if any)
correlation.
Our finding that utilitarians participate more than selfish individuals and Rawlsians
do not also carries important implications for political theory, formal models of participation,
18

cross-national empirical accounts of participation, and individual-level accounts of turnout.
First, it supports Harsanyi’s twin arguments about the e!ect of redistributive and welfare-
maximizing social preferences on participation. He noted that since utilitarians care less
about their own costs and more about policies that make everyone better o!, they would be
more likely to vote than purely self-interested individuals. He also argued that Rawlsians
would find politics a much less suitable domain for action than utilitarians because it is
di"cult to use sweeping policies to target redistribution to the least fortunate. As a result,
they may not participate because they view time spent on political activity as a substitute
for time spent on nonpolitical activities aimed at directly helping the poor. The empirical
evidence in this article supports both of these claims.
Second, the evidence also supports assumptions made in a recent game theoretic
analysis of other-regarding preferences by Sandroni and Feddersen (2006). They assume that
individuals are motivated primarily by aggregate welfare and they show that a large fraction
of a population of such individuals will choose to participate. However, our results also
suggest that the population is heterogeneous, with most people exhibiting selfish preferences
and others exhibiting nonutilitarian other-regarding preferences. Although the Sandroni and
Feddersen model predicts that many utilitarians will participate, these individuals may make
up only a small fraction of the population. Our results may not be representative as they are
based on a laboratory experiment with college students, but they do suggest that Rawlsians
and self-interested individuals may make up a large and relatively nonparticipatory part of
the population.
19

Third, our findings speak to work examining and explaining cross-national variation
in political participation, especially institutional explanations (e.g. Powell 1982, Jackman
1987). If such work overlooks di!erences in the distribution of social preferences within vari-
ous populations, or does not take account of important national di!erences in redistributive
politics, then it risks overstating the importance of formal institutions in the explanation of
varying rates of political participation (Blais 2006). Our work suggests that future analysis
should pay greater attention to the degree and type of redistribution present in di!erent
countries.
Fourth, our findings add to an expansive literature on individual-level determinants
of political participation (e.g. Finkel 1985, Leighley and Nagler 1992a, 1992b, Schlozman et.
al. 1995, Hetherington 1999, Blais 2000). This literature has catalogued an exhaustive list of
individual-level di!erences that correlate with voter turnout, such that we know the typical
e!ects of income, education, age, gender, martial status, political interest, information, trust,
religious attendence, and scores of other variables. We add to this work by demonstrating
that other individual-level di!erences, namely di!erent social preferences, also account for
variation in political participation. They do not stand in for these other determinants, as
the e!ects of control variables show. Instead, they explain an element of the decision to vote
largely uncovered by this empirical literature. Moreover, our paper suggests an experimental
framework may be best suited for uncovering such additional determinants.
An area of future research is to explore the properties of social preferences, including
their origins and malleability. For example, are social preferences fixed or able be changed
20

under certain conditions and over the course of the life cycle (see Fehr, Bernhard and Rock-
enbach 2008)? Also, are di!erent social preference types learned or do they have a more
fundamental basis? Research in behavioral genetics, using both twin study (e.g. Cesarini
et. al. 2009), and genetic association designs (Knafo et. al. 2007), has shown a genetic
component to the other regarding behavior revealed in economic games. Searching for a
genetic basis for di!erent social preferences is a promising avenue of research and, based on
the results we present here, has important implications for the study of political behavior.
Accounting for actors with social preferences has done much to advance our under-
standing of the phenomenon of widespread political participation. However, as our results
have shown, there is theoretically and empirically important variation in social preferences.
The puzzle of participation may persist until we can understand how people with di!erent
kinds of preferences are motivated to take part in political life. What is more certain is that
such preferences should form a starting point for the explanation of political participation.
21

Tables
Strong Weak Total PercentSelfish 60 68 128 55.4Rawlsian 73 73 31.6Utilitarian 3 15 18 7.8Pure 12 12 5.2
Table 1: Subject Types. Subjects are classified according the procedure described in the Appendix.
22

Number of Activities S.E.Selfish 3.08 0.17Rawlsian 3.56 0.25Utilitarian 4.56 0.49Pure 3.08 0.51Experiment Total 3.35 0.13
Table 2: Participation Raw Averages. Cell entries indicate the average number of politicalactivities undertaken by each subject type and their standard errors.
23

Simple Model With ControlsVariable Coef S.E. p Coef S.E. pSocial Preference Type
Rawlsian 0.53 0.32 0.10 0.47 0.29 0.10Utilitarian 1.52 0.55 0.01 1.14 0.48 0.02Pure 0.08 0.66 0.90 0.27 0.59 0.64
Political VariablesPolitical Interest 3.50 0.55 0.00High Political Info 0.08 0.31 0.80Internal E"cacy 0.44 0.48 0.35External E"cacy 0.53 0.61 0.39Partisan Strength 0.62 0.41 0.14Partisan ID -0.91 0.40 0.02Citizen 0.54 0.64 0.40
Socioeconomic StatusHigh Income 0.34 0.26 0.19Female 0.45 0.28 0.11White 0.56 0.26 0.03Age 0.92 0.53 0.08
Religious ActivitiesAttendance 0.93 0.52 0.08Contribution 0.02 0.30 0.94
(Intercept) 3.00 0.19 0.00 -1.79 0.83 0.03LogLik (model) -496.4 -456.2LogLik (null) -500.7 -500.7
Table 3: Dependent variable: Political Activity Index. N=234. The models are estimated usingtobit regression. All variables are rescaled to [0,1] for ease of interpretation. Social PreferenceTypes are measured dichotomously.
24

Simple Model With ControlsVariable Coef S.E. p Coef S.E. p
Rawlsianism 0.42 0.58 0.47 0.30 0.52 0.57Utilitarianism 2.32 0.97 0.02 1.98 0.85 0.02
Political VariablesPolitical Interest 3.60 0.55 0.00High Political Info 0.08 0.31 0.79Internal E"cacy 0.39 0.47 0.41External E"cacy 0.49 0.61 0.42Partisan Strength 0.51 0.41 0.21Partisan ID -0.99 0.40 0.01Citizen 0.37 0.65 0.56
Socioeconomic StatusHigh Income 0.37 0.65 0.56Female 0.49 0.28 0.08White 0.57 0.26 0.03Age 0.97 0.52 0.06
Religious ActivitiesAttendance 0.96 0.52 0.07Contribution 0.06 0.30 0.84
(Intercept) 2.39 0.42 0.00 -2.11 0.86 0.02LogLik (model) -497.7 -456.7LogLik (null) -495.0 -495.0
Table 4: Dependent variable: Political Activity Index. N=234. The models are estimated usingtobit regression. All variables are rescaled to [0,1] for ease of interpretation. Social PreferenceTypes are measured continuously.
25
Figures
U U U
U U U0
24
68
10
Matching Ratio (Self:Other)
Opt
imal
Don
atio
n
3:1 2:1 1:1 1:2 1:3
RR
RR
RR
P P PP P P
S S SS S S
Figure 1: Optimal allocation to the other player in each dictator game. P=Pure, U=Utilitarian,S=Selfish, and R=Rawlsian.
26

Appendix
Political Activity Index
The Political Activity Index is comprised of eight acts of participation. They include: Vote:
“In talking to people about elections, we find that they are sometimes not able to vote because
they are not registered, they do not have the time, or they have di"culty getting to the polls.
Did you happen to vote in the 2004 general election in November?” Volunteer Candidate:
“Have you ever as a volunteer - that is, for no pay at all or for only a token amount -
for a candidate running for national, state, or local o"ce?” Contribute to a Candidate:
“Have you ever contributed money to an individual candidate, a party group, a political
action committee, or any other organization that supports candidates in elections?” Join
a Political Organization or Donate to a Political Organization: “Are you a member of any
organizations that take stands on any public issues, either locally or nationally?” or “Not
counting membership dues, have you given money to any organizations that take stands on
any public issues, either locally or nationally?” Attend Local Board Meetings or Volunteer
Local Board : “Have you ever regularly attended meetings of an o"cial local government
board or council?” or “Have you ever served in a voluntary capacity, that is, for no pay at
all or for only a token amount, on any local governmental board or council that deals with
community problems and issues such as a town council, a school board, a zoning board, a
planning board, or the like?” Informal Community Work : “Aside from membership on a
board or council or attendance at meetings, have you ever informally gotten together with or
27
worked with others in your community or neighborhood to try to deal with some community
problem?” Government Contact : “Aside from contacts made as a regular part of your job,
have you ever initiated any contacts with a government o"cial or someone on the sta! of
such an o"cial, such as someone in the White House, a Congressional or Senate O"ce, or
a federal agency like the EPA or IRS?” Protest : “Have you ever taken part in a protest,
march, or demonstration on some national or local issue (other than a strike against your
employer)?” (0 = No, 1 = Yes).
28

Summary Statistics
Selfish Rawlsian Utilitarian PureVote 0.76 0.79 0.83 0.42Board 0.28 0.29 0.50 0.08Volunteer 0.26 0.27 0.56 0.17Contact 0.48 0.41 0.61 0.50Informal 0.36 0.40 0.61 0.33Protest 0.34 0.52 0.61 0.67Organization 0.44 0.56 0.50 0.58Contribute 0.16 0.32 0.33 0.33
Appendix Table 1: Experiment means for components of the political activity index bypreference classification.
29

0.1
Politica
lActivityIn
dex
Componen
tReg
ressions
Vote
Board
Volun
teer
Con
tact
Inform
alProtest
Organ
ization
Con
tribute
Coe!
pCoe!
pCoe!
pCoe!
pCoe!
pCoe!
pCoe!
pCoe!
pRaw
lsian
0.46
0.31
0.00
1.00
0.12
0.77
-0.25
0.46
0.08
0.80
0.80
0.02
0.45
0.17
1.17
0.01
Utilitarian
0.17
0.82
0.84
0.14
1.17
0.04
0.39
0.49
0.97
0.07
1.14
0.04
0.10
0.86
0.84
0.19
Pure
-1.98
0.03
-2.20
0.06
-0.47
0.61
0.44
0.56
-0.25
0.72
1.49
0.04
1.06
0.13
0.71
0.46
Political
Interest
1.63
0.07
2.45
0.00
3.14
0.00
1.68
0.01
1.76
0.01
2.00
0.00
1.85
0.00
3.09
0.00
Info
0.13
0.79
-0.43
0.28
0.36
0.43
0.49
0.18
-0.24
0.49
0.33
0.35
0.17
0.62
-0.11
0.82
IntE!
0.70
0.34
0.38
0.55
0.26
0.70
0.01
0.98
0.05
0.93
0.24
0.67
0.31
0.56
0.69
0.35
Ext
E!
2.29
0.01
1.09
0.18
1.50
0.10
0.38
0.59
-0.23
0.75
-0.55
0.43
-1.07
0.13
1.36
0.17
Strength
0.63
0.30
-0.38
0.48
1.42
0.02
0.69
0.15
-0.79
0.10
-0.21
0.67
1.10
0.02
1.49
0.03
ID-0.70
0.29
-1.54
0.01
0.56
0.27
-0.01
0.98
-1.18
0.02
-0.93
0.06
0.45
0.33
-1.33
0.03
Citizen
18.94
0.99
-0.26
0.80
-2.15
0.02
15.85
0.99
0.31
0.74
-1.36
0.15
-0.04
0.96
-1.09
0.31
SES
Income
0.66
0.10
-0.12
0.72
0.38
0.28
0.44
0.14
0.10
0.73
-0.24
0.43
0.16
0.59
0.07
0.85
Fem
ale
1.09
0.02
-0.22
0.54
0.97
0.01
0.29
0.38
0.25
0.44
-0.02
0.96
0.59
0.07
-0.12
0.77
White
0.98
0.02
0.30
0.38
0.14
0.70
0.35
0.25
0.52
0.09
0.02
0.96
0.33
0.27
0.92
0.03
Age
0.95
0.24
0.79
0.24
0.84
0.25
0.65
0.29
-0.77
0.21
0.49
0.43
0.70
0.25
2.02
0.01
Religious
Attend
1.36
0.11
1.47
0.03
-1.71
0.02
0.45
0.47
1.18
0.06
0.37
0.55
0.10
0.87
0.62
0.42
Con
trib
-1.19
0.01
0.19
0.62
0.81
0.05
-0.12
0.73
0.05
0.89
-0.17
0.63
-0.03
0.93
0.65
0.16
(Intercept)
-22.23
0.99
-2.98
0.02
-4.67
0.00
-18.98
0.98
-1.07
0.35
-0.33
0.77
-2.82
0.01
-6.77
0.00
LL(m
odel)
-89.05
-119.77
-110.44
-140.98
-141.55
-141.24
-146.28
-96.29
LL(null)
-127.94
-139.11
-137.27
-159.63
-154.44
-158.29
-160.06
-125.61
Appendix
Tab
le2:
N=23
4.Com
pon
ents
ofthePolitical
ActivityIndex
areestimated
usinglogitregression
.Allvariab
les
arerescaled
to[0,1]forease
ofinterpretation
.
30

First Di!erences
Rawlsian UtilitarianFirst Di!erence 2.5% 97.5% First Di!erence 2.5% 97.5%
Vote 0.00 0.00 0.05 0.00 -0.01 0.01Board 0.01 -0.12 0.15 0.17 -0.07 0.43Volunteer 0.00 -0.12 0.14 0.25 0.01 0.53Contact -0.03 -0.17 0.11 0.08 -0.16 0.32Informal 0.01 -0.14 0.15 0.20 -0.03 0.43Protest 0.18 0.02 0.32 0.24 0.02 0.49Organization 0.10 -0.05 0.26 -0.01 -0.22 0.23Contribute 0.13 0.02 0.29 0.12 -0.03 0.38
Appendix Table 3: Simulated first di!erences and 95% confidence intervals based on theregressions in Appendix Table 2. The first di!erence is the change in dependent variableresulting from a switch from selfish preferences to either Rawlsian (first three columns) orUtilitarian (second three columns) preferences. All other variables are held at their means.The reported results are based on 1000 simulations.
31
Question Wording and Coding
Political Information Political is the number of correct answers to the following 4 multiple
choice and open answer questions. “Which party currently has the most members in the
House of Representatives in Washington?” (Republican / Democrat) “Which party currently
has the most members in the Senate in Washington?” (Republican / Democrat) “Who has
the final responsibility to decide if a law is constitutional or not?” (President / Congress
/ Supreme Court) “Whose responsibility is it to nominate judges to the Federal Courts?”
(President / Congress / Supreme Court). This variable is severely skewed–72% of all sub-
jects scored 4 out of 4 on a test of political information. Therefore, we created a dichotomous
variable for high information (4 out of 4).
Political Interest is the mean answer to two questions: “Thinking about your local commu-
nity, how interested are you in local community politics and local community a!airs?” and
“How interested are you in national politics and national a!airs?” (0 = not much interested,
1/2 = somewhat interested, 1 = very much interested).
For external e!cacy we follow Craig, Niemi and Silver (1990) and Niemi, Craig, and Mattei
(1991) by creating an index that sums responses from four questions: “People like me don’t
have any say about what the government does”; “I don’t think public o"cials care much
what people like me think”; “How much do you feel that having elections makes the govern-
ment pay attention to what the people think?”; and “Over the years, how much attention
do you feel the government pays to what the people think when it decides what to do?” The
32

first two questions are coded 0 = agree strongly, 1/4 = agree somewhat, 1/2 = neither, 3/4
= disagree somewhat, and 1 = disagree strongly. The third and fourth questions are coded
1 = a good deal, 1/2 = some, and 0 = not much.
Internal e!cacy is the answer to the question “please indicate whether you agree or disagree
with the following statement: ‘Sometimes politics and government seem so complicated that
a person like me can’t really understand what’s going on.’” (0 = agree strongly, 1/4 = agree
somewhat, 1/2 = neither, 3/4 = disagree somewhat, 1 = disagree strongly).
For the remaining variables we follow the coding procedure in Timpone (1998) and the ques-
tion wording used in the NES.
Strength of party identification is coded 0 = independents and apoliticals, 1/3 = indepen-
dents leaning towards a party, 2/3 = weak partisans, and 1 = strong partisans.
Partisan Identification is based on the standard NES set of questions where 0 = Strong
Democrat, 1/6 = Democrat, 1/3 = Independent Leaning Democrat, 1/2 = Independent,
2/3 = Independent Leaning Republican, 5/6 = Republican, and 1 = Strong Republican.
The remaining questions are based on those that appear in Verba, Schlozman, and Brady
(1995).
Citizen is 1 for U.S. citizen and 0 for all others.
Income is the answer to: “Please choose the category that describes the total amount of
income earned in 2003 by the people in your household. Consider all forms of income, in-
cluding salaries, tips, interest and dividend payments, scholarship support, student loans,
parental support, social security, alimony, and child support, and others.” (1 = $15,000 or
33

under, 2 = $15,001 - $25,000, 3 = $25,001 - $35,000, 4 = $35,001 - $50,000, 5 = $50,001 -
$65,000, 6 = $65,001 - $80,000, 7 = $80,001 - $100,000, 8 = over $100,000). The median
income for our sample is the seventh of eight categories $80,000-$100,000. Therefore, we
created a dichotomous variable for high income ($80,000 or more).
Female is 1 for female, 0 for male.
White is 1 for white and 0 for all others.
Age is coded 1/6 = 18 years old, 1/3 = 19, 1/2 = 20, 2/3 = 21, 5/6 = 22, 1 = 23 or older.
Religious Attendance is the answer to the question “How often do you attend religious ser-
vices?” (0 = never, 1/3 = a few times a year, 1/2 = once or twice a month, 2/3 = almost
every week, 1 = every week).
Religious Contribution is the answer to “Not counting membership dues, have you given
money to any religious organization?” (0 = no, 1 = yes).
34

Notes
1Loewen acknowledges the support of the Killam Trusts and the Social Science and Humanities Research
Council of Canada. An online appendix for this article is available at http://jhfowler.ucsd.edu and
http://www.cambridge.org/jop/DOI. Data and supporting materials necessary to reproduce the numerical
results in the paper will be made available at http://jhfowler.ucsd.edu and http://www.cambridge.org/
jop/DOI upon publication.
2Andreoni and Miller also refer to these as “Leontief” and “substitute” preferences, respectively.
3This thus gives us five payo! conditions, 3:1, 2:1, 1:1, 1:2, 1:3.
4The relative price of giving is simply the value of keeping the ticket divided by the value of the ticket
to the other player if passed. For example, if a ticket is worth 1 chance if kept and 3 chances to the other
player if passed, the relative price of giving is 0.33.
5For details on the Weak Axiom of Revealed Preference (WARP) see Varian (1992). In short, subjects’
choices are in violation of WARP if they choose the most expensive Rawlsian (or utilitarian) allocation while
not choosing the less expensive Rawlsian (or utilitarian) allocation. Three subjects violated WARP in two
or more of their five decisions. Ten subjects violated WARP in one of five decisions. Our results do not
change when we exclude individuals who violated WARP.
6Single tickets are not divisible. As a result, we cannot classify an individual as a strong Rawlsian. This
is because a strong Rawlsian would keep 6.67 tickets when the value of given tickets was worth double and
7.5 when they were worth triple. She would give 3.33 tickets when the value of kept tickets was worth double
and 2.5 when they were worth triple. There is no way of knowing if a strong Rawlsian subject is choosing
to round up or down.
7This point is best illustrated using a numerical example. Giving to the other player is most expensive
in our game when the fraction of the endowment kept is tripled and least expensive when the fraction sent
is tripled. When giving is most expensive, a Rawlsian subject maximizes her utility when she keeps 2.5
35

(assuming a perfectly divisible endowment), which is tripled, and passes 7.5 (min{2.5#3, 7.5} = 7.5). When
giving is least expensive, a Rawlsian maximizes her utility when she keeps 7.5 and passes 2.5, which is tripled
(min{7.5, 2.5# 3} = 7.5).
8Because strong utilitarians may choose any allocation when the relative price is one, the Euclidean
distance is calculated for a vector of four allocation decisions in which the relative price is not equal to one.
9We also conducted a maximum-likelihood factor analysis on our eight measures of participation. This
analysis revealed only one factor with an eigenvalue greater than one (1.64). Factor loadings of the scale
components ranged from 0.26 (for vote) to 0.54 (for campaign volunteering). Our results do not change
significantly if we drop the weakest loading factor. Likewise, our results do not change significantly if we
consider political and non-political factors separately.
10Furthermore, the failure of this variable to significantly predict greater participation suggests that our
subjects are not succumbing to social desirability on either our behavioral measures of social preferences or
our dependent variable.
36

References
[1] J. Andreoni and J. Miller. Giving according to garp: An experimental test of the
consistency of preferences for altruism. Econometrica, 70(2):737–753, 2002.
[2] J. Andreoni and L. Vesterlund. Which is the fair sex? gender di!erences in altruism.
Sta! general research papers, Iowa State University, Department of Economics, 2001.
[3] A. Blais. To Vote or Not Vote: The Merits and Limits of Rational Choice Theory.
University of Pittsburgh Press, 2000.
[4] A. Blais. What a!ects voter turnout? Annual Review of Political Science, 9:111–125,
2006.
[5] G. Bolton and A. Ockenfels. Erc: A theory of equity, reciprocity, and competition.
American Economic Review, 42(1):166–193, 2000.
[6] N. Burns, K. Schlozman, and S. and Verba. The Private Roots of Public Action. Harvard
University Press, 2001.
[7] C. Camerer. Behavioral Game Theory: Experiments in Strategic Interaction. Princeton
University Press, 2003.
[8] C. Camerer and R. Hogarth. The e!ects of financial incentives in experiments: A review
and capital-labor production framework. Journal of Risk and Uncertainty, 19(1-3):7–42,
1999.
37

[9] J. Carpenter, E. Verhoogen, and S. Burks. The e!ects of stakes in distribution experi-
ments. Economics Letters, 86(2):152–162, 2005.
[10] D. Cesarini, C. Dawes, M. Johannesson, P. Lichtenstein, and B. Wallace. Genetic
variation in preferences for giving and risk taking. Quarterly Journal of Economics,
124(2):809–842, 2009.
[11] G. Charness and M. Rabin. Understanding social preferences with simple tests. Quar-
terly Journal of Economics, 117:817–869, 2002.
[12] J. Citrin, E. Schickler, and J. Sides. What if everyone voted? simulating the impact of
increased turnout in senate elections. American Journal of Political Science, 47(1):75–
90, 2003.
[13] S. Craig, R. Niemi, and G. Silver. Political e"cacy and trust: A report on the nes pilot
study items. Political Behavior, 12(3):289–314, 1990.
[14] A. Downs. An Economic Theory of Democracy. Harper, 1957.
[15] C. Eckel and P. Grossman. Altruism in anonymous dictator games. Games and Eco-
nomic Behavior, 16(2):181–191, 1996.
[16] A. Edlin, A. Gelman, and N. Kaplan. Voting as a rational choice: Why and how people
improve the well-being of others”. Rationality and Society, 19(3):293–314, 2007.
38

[17] T. Feddersen and A. Sandroni. A theory of participation in elections. American Eco-
nomic Review, 96(4):1271–1282, 2006.
[18] E. Fehr and U. Fischbacher. The nature of human altruism. Nature, 425(6960):785–791,
2003.
[19] E. Fehr, M. Naef, and K. Schmidt. Inequality aversion, e"ciency, and maximin pref-
erences in simple distribution experimetns: Comment. American Economic Review,
96(5):1912–1917, 2006.
[20] E. Fehr and K. Schmidt. A theory of fairness, competition and cooperation. Quarterly
Journal of Economics, 114:817–868, 1999.
[21] M. Fiorina. Information and rationality in elections. In J. Ferejohn and J. Kuklinski,
editors, Information and Democratic Processes. University of Illinois Press, 1990.
[22] A. Fischer. The probability of being decisive. Public Choice, 101(3-4):267–283, 1999.
[23] R. Fisman, S. Kariv, and D. Markovits. Individual preferences for giving. Working
Paper, 2006.
[24] R. Forsythe, J. Horowitz, N. Savin, and M. Sefton. Fairness in simple bargaining
experiments. Games and Economic Behavior, 6(3):347–369, 1994.
[25] J. Fowler. Altruism and turnout. Journal of Politics, 68(3):674–683, 2006.
39

[26] J. Fowler and C. Kam. Beyond the self: Social identity, altruism, and political partici-
pation. Journal of Politics, 69(3):813–827, 2006.
[27] A. Gelman, J. Katz, and J. Bafumi. Standard voting power indexes don’t work: An
empirical analysis. British Journal of Political Science, 34:657–674, 2004.
[28] A. Gelman, G. King, and W. Boscardin. Estimating the probability of events that
have never occurred: When is your vote decisive? Journal of American Statistical
Association, 93:1–9, 1998.
[29] J. Gri"n and B. Newman. Are voters better represented? Journal of Politics,
67(4):1206–1227, 2005.
[30] J. Harsanyi. Can the maximin principle serve as a basis for morality? a critique of John
Rawls’s theory. American Political Science Review, 69(2):594–606, 1975.
[31] J. Harsanyi. Rule utilitarianism, rights, obligations and the theory of rational behavior.
Theory and Decision, 12:115–133, 1980.
[32] R. Jackman. Political institutions and voter turnout in industrial democracies. American
Political Science Review, 81:405–24., 1987.
[33] R. Jackman. Rationality and political participation. American Journal of Political
Science, 37(1):279–290, 1993.
40
[34] R. Jankowski. Buying a lottery ticket to help the poor-altruism, civic duty, and self-
interest in the decision to vote. Rationality and Society, 14(1):55–77, 2002.
[35] R. Jankowski. Altruism and the decision to vote: Explaining and testing high voter
turnout. Working Paper, 2004.
[36] A. Knafo, S. Israel, A. Darvasi, R. Bachner-Melman, F. Uzefovsky, L. Cohen, E. Feld-
man, E. Lerer, E. Laiba, Y. Raz, L. Nemanov, I. Gritsenko, C. Dina, G. Agam, B. Dean,
G. Bornstein, and R. Ebstein. Individual di!erences in allocation of funds in the dic-
tator game associated with length of the arginine vasopressin 1a receptor rs3 promoter
region and correlation between rs3 length and hippocampal mrna. Genes, Brain and
Behavior, 7:266–275, 2008.
[37] J. Ledyard. The paradox of voting and party competition. In G. Horwich and J. Quirk,
editors, Essays in Comtemporary Fields of Economics. Purdue University Press, 1982.
[38] P.J. Loewen. A"nity, antipathy, and political participation: How our concern for others
makes us vote. Canadian Journal of Political Science., 43(3):661–687, 2010.
[39] K. Monroe. The Heart of Altruism: Perceptions of a Common Humanity. Princeton
University Press, 1998.
[40] C. Mulligan and C. Hunter. The empirical frequency of a pivotal vote. Public Choice,
116:31–54, 2003.
41

[41] C. Niemi, S. Craig, and F. Mattei. Measuring internal political e"cacy in the 1988
national election study. American Political Science Review, 85(4):1407–1413, 1991.
[42] G.B. Powell. Comparative Democracies: Participation, Stability, and Violence. Harvard
University Press, Cambridge, MA, 1982.
[43] Amartrya Sen. Liberty, unanimity and rights. Economica, 43:217–245, 1976.
[44] R. Timpone. Structure, behavior, and voter turnout in the united states. American
Political Science Review, 92(1):145–158, 1998.
[45] Paul A. M. van Lange. The pusuit of joint outcomes and equality in outcomes: An inte-
grative model of social value orientation. Journal of Personality and Social Psychology,
77:337–349, 1999.
[46] H. Varian. Microeconomic Analysis. Norton and Company, 1992.
[47] S. Verba and N. Nie. Participation in America. Harper and Row, New York, 1972.
[48] S. Verba, K. Schlozman, and H. Brady. Voice and Equality: Civic Volunteerism in
American Politics. Harvard University Press, 1995.
[49] R. Wolfinger and S. Rosenstone. Who Votes? Yale University Press, 1980.
42

Social Preferences and Political Participation: Online
Appendix
Christopher T. Dawes, Peter John Loewen, and James H. Fowler
November 9, 2010
1

Online Appendix
Econometric Estimation of Subject Types
To check our classification of subjects into weak types, we econometrically estimate the
demand function for each weak utility type to make sure that the values of key parameters
are reasonable. To do this we assume that subjects not characterized by strong utility types
have underlying preferences represented by a CES utility function.1 We follow Andreoni and
Miller (2002) in this approach, thus allowing a comparison between their results and ours.
The CES is a flexible functional form that allows di!erent types of altruistic giving to be
represented by a single parameter (Fisman, Kariv, and Markovits 2005). The CES utility
function is given by:
Us = (a!!s + (1! a)!!
o)1/!
where the share parameter a indicates selfishness and " captures the convexity of preferences
through the elasticity of substitution # = 1/("!1). Maximizing this function subject to the
budget set2 yields the simplified demand function:3
!s
m! =A
pr + A
1CES stands for constant elasticity of substitution. For more details on the properties of the CES utility
function see Varian (1992).2The budget set is !s + p!o = m! where p is the relative price of giving and m! is the ticket endowment
multiplied by the hold value of the tickets (or the ticket endowment in terms of the price of keeping the
tickets).3A = [a/(1! a)]1/(1"!) and r = !"/(1! ")
2
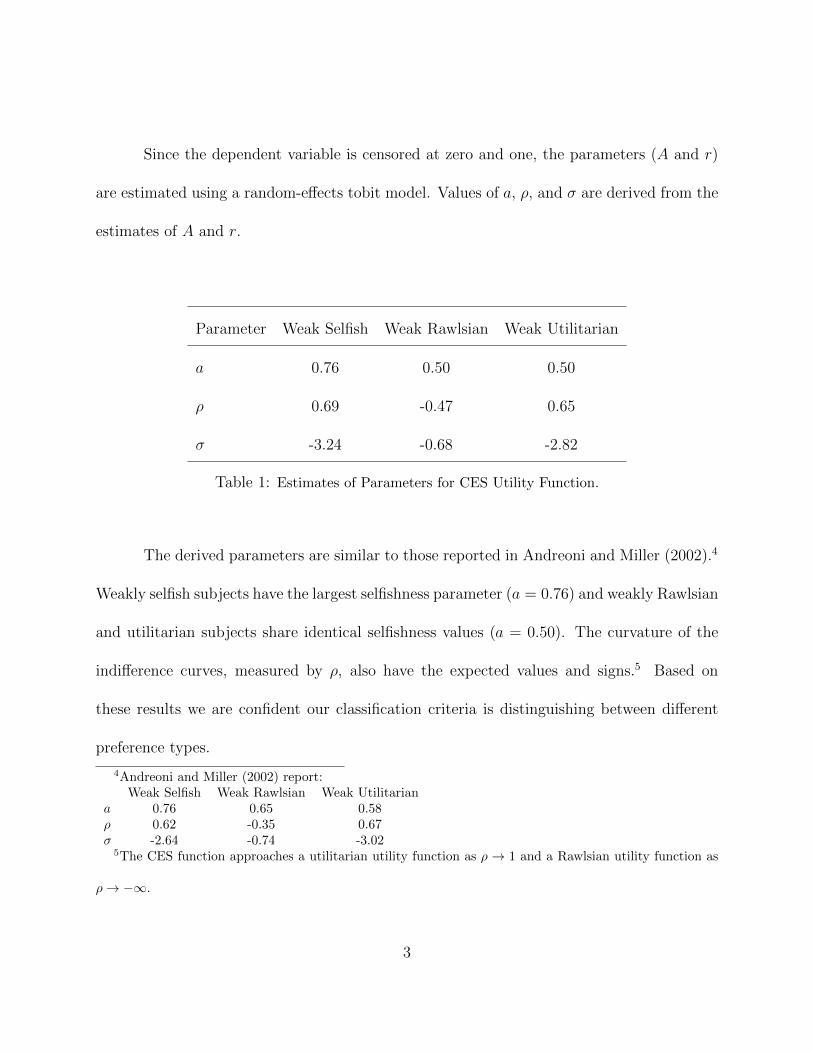
Since the dependent variable is censored at zero and one, the parameters (A and r)
are estimated using a random-e!ects tobit model. Values of a, !, and " are derived from the
estimates of A and r.
Parameter Weak Selfish Weak Rawlsian Weak Utilitarian
a 0.76 0.50 0.50
! 0.69 -0.47 0.65
" -3.24 -0.68 -2.82
Table 1: Estimates of Parameters for CES Utility Function.
The derived parameters are similar to those reported in Andreoni and Miller (2002).4
Weakly selfish subjects have the largest selfishness parameter (a = 0.76) and weakly Rawlsian
and utilitarian subjects share identical selfishness values (a = 0.50). The curvature of the
indi!erence curves, measured by !, also have the expected values and signs.5 Based on
these results we are confident our classification criteria is distinguishing between di!erent
preference types.
4Andreoni and Miller (2002) report:Weak Selfish Weak Rawlsian Weak Utilitarian
a 0.76 0.65 0.58! 0.62 -0.35 0.67" -2.64 -0.74 -3.02
5The CES function approaches a utilitarian utility function as ! ! 1 and a Rawlsian utility function as
! ! "#.
3

Robustness Check of Subject Types
As an additional check of our classification of social preferences we compare each classified
utility type’s response to an expressed preference for equality. As part of our study, we asked
subjects the question, “If people were treated more equally in this country we would have
many fewer problems. Do you agree strongly, agree somewhat, neither agree nor disagree,
disagree somewhat, or disagree strongly with this statement?” The responses by Rawlsian
and utilitarian preference types are presented in Appendix Figure 1.
Selfish Rawlsian Utilitarian Pure
Perc
enta
ge o
f Res
pond
ents
0.0
0.1
0.2
0.3
0.4
0.5
Agree StronglyAgree SomewhatNeitherDisagree SomewhatDisagree Strongly
Figure 1: “If people were treated more equally in this country we would have many fewer problems”
4

Rawlsians, based on their agreement with the statement, appear to be concerned with equity
as we would expect. Utilitarians, on average, do not exhibit the same expressed preference for
equality as Rawlsians even though both behave altruistically. A Mann-Whitney U test reveals
that the average response of Rawlsians is statistically di!erent from that of Utilitarians
(p = 0.05, two-tailed test).
Results with Stated Preferences for Equality
With ControlsVariable Coef S.E. p
Equality preference -0.15 0.11 0.19Political Variables
Political Interest 3.51 0.56 0.00High Political Info 0.08 0.31 0.80Internal E"cacy 0.48 0.48 0.32External E"cacy 0.58 0.62 0.35Partisan Strength 0.58 0.42 0.17Partisan ID -0.70 0.44 0.11Citizen 0.47 0.65 0.47
Socioeconomic StatusHigh Income 0.42 0.26 0.11Female 0.58 0.27 0.04White 0.62 0.27 0.04Age 1.10 0.53 0.04
Religious ActivitiesAttendance 0.89 0.52 0.09Contribution 0.14 0.30 0.62
(Intercept) -1.46 0.84 0.08LogLik (model) -458.6LogLik (null) -500.7
Table 2: Dependent variable: Political Activity Index. N=234. The models are estimated usingtobit regression. All variables are rescaled to [0,1] for ease of interpretation.
5

Additional results
In this section, we present three sets of additional results. First, to address the possibility
that our results are driven by outliers, we reestimate Tables 3 and 4 in the text using Huber
regressions. Second, to test whether our results are driven by the aggregation of acts in
our index, we reestimate Tables 3 and 4 using a logit regression in which each individual
act is an observation. We correct for multiple observations per respondent by calculating
robust standard errors and include a fixed e!ect for each act to capture di!erences in the
baseline probability of undertaking each act. The results suggest that our results are robust
to outliers and not driven by the aggregation of political activities in an index. Third,
we present reestimations of Tables 3 and 4 when pure altruists our excluded. Our results
continue to hold, suggesting that the di!erence between utilitarians and Rawlsians is not
driven by our treatment of altruists.
6

Huber Regressions
Simple Model With ControlsVariable Coef R.S.E. p Coef R.S.E. pSocial Preference Type
Rawlsian 0.44 0.30 0.15 0.39 0.28 0.16Utilitarian 1.48 0.52 0.00 1.10 0.50 0.03Pure 0.01 0.53 0.99 0.14 0.51 0.78
Political VariablesPolitical Interest 3.09 0.48 0.00High Political Info 0.02 0.51 0.78Internal E!cacy 0.41 0.46 0.37External E!cacy 0.56 0.40 0.33Partisan Strength 0.52 0.40 0.19Partisan ID -0.75 0.37 0.05Citizen 0.37 0.56 0.52
Socioeconomic StatusHigh Income 0.26 0.25 0.30Female 0.43 0.26 0.10White 0.52 0.23 0.03Age 0.90 0.49 0.07
Religious ActivitiesAttendance 0.73 0.47 0.12Contribution 0.01 0.29 0.96
(Intercept) 3.08 0.18 0.00 -1.09 0.72 0.14F 3.11 7.01Prob > F 0.027 0.000
Table 3: Dependent variable: Political Activity Index. N=234. The models are estimated usingHuber regression. All variables are rescaled to [0,1] for ease of interpretation. Social PreferenceTypes are measured dichotomously. F tests for the di!erence between Rawlsians and Utilitariansreturn one-tailed p-values of 0.03 and 0.08.
7

Simple Model With ControlsVariable Coef R.S.E. p Coef R.S.E. p
Rawlsianism 0.33 0.53 0.54 0.21 0.48 0.66Utilitarianism 2.18 0.93 0.02 1.85 0.81 0.02
Political VariablesPolitical Interest 3.19 0.48 0.00High Political Info 0.02 0.29 0.94Internal E!cacy 0.37 0.46 0.42External E!cacy 0.52 0.58 0.37Partisan Strength 0.44 0.40 0.27Partisan ID -0.82 0.37 0.03Citizen 0.23 0.56 0.68
Socioeconomic StatusHigh Income 0.28 0.24 0.26Female 0.47 0.26 0.07White 0.53 0.24 0.03Age 0.94 0.50 0.06
Religious ActivitiesAttendance 0.74 0.47 0.12Contribution 0.04 0.28 0.88
(Intercept) 2.42 0.39 0.00 -1.40 0.76 0.07F 2.88 7.58Prob > F 0.058 0.000
Table 4: Dependent variable: Political Activity Index. N=234. The models are estimated usingHuber regression. All variables are rescaled to [0,1] for ease of interpretation. Social PreferenceTypes are measured continuously. F tests for the di!erence between Rawlsians and Utilitariansreturn one-tailed p-values of 0.04 and 0.03.
8

Replication with non-aggregated acts
Simple Model With ControlsVariable Coef R.S.E. p Coef R.S.E. pSocial Preference Type
Rawlsian 0.25 0.17 0.14 0.25 0.17 0.13Utilitarian 0.83 0.29 0.00 0.66 0.29 0.02Pure 0.00 0.31 0.99 0.05 0.35 0.89
Political VariablesPolitical Interest 1.94 0.30 0.00High Political Info 0.04 0.18 0.82Internal E!cacy 0.28 0.28 0.33External E!cacy 0.37 0.24 0.30Partisan Strength 0.34 0.24 0.17Partisan ID -0.47 0.24 0.04Citizen 0.23 0.40 0.56
Socioeconomic StatusHigh Income 0.17 0.15 0.25Female 0.28 0.16 0.08White 0.34 0.14 0.02Age 0.55 0.30 0.07
Religious ActivitiesAttendance 0.46 0.30 0.12Contribution 0.01 0.17 0.96
Wald !2 186.39 7.01Prob > !2 0.00 0.000
Table 5: Dependent variable: Individual political activity. N=1872. The models are estimatedusing logistic regression. All variables are rescaled to [0,1] for ease of interpretation. Social Prefer-ence Types are measured dichotomously. Standard errors are corrected for eight observations perrespondent. Fixed e!ects for each political activity are estimated but not presented. F tests forthe di!erence between Rawlsians and Utilitarians return one-tailed p-values of 0.02 and 0.08.
9

Simple Model With ControlsVariable Coef R.S.E. p Coef R.S.E. p
Rawlsianism 0.19 0.30 0.53 0.16 0.29 0.57Utilitarianism 1.22 0.52 0.02 1.13 0.50 0.02
Political VariablesPolitical Interest 2.00 0.31 0.00High Political Info 0.04 0.18 0.81Internal E!cacy 0.26 0.28 0.37External E!cacy 0.34 0.35 0.33Partisan Strength 0.28 0.24 0.26Partisan ID -0.51 0.23 0.02Citizen 0.15 0.39 0.71
Socioeconomic StatusHigh Income 0.18 0.15 0.21Female 0.30 0.16 0.06White 0.34 0.15 0.02Age 0.57 0.30 0.06
Religious ActivitiesAttendance 0.47 0.29 0.11Contribution 0.03 0.17 0.88
Wald !2 188.29 248.60Prob > !2 0.00 0.00
Table 6: The models are estimated using logistic regression. N=1872. All variables are rescaledto [0,1] for ease of interpretation. Social Preference Types are measured continuously. Standarderrors are corrected for eight observations per respondent. Fixed e!ects for each political activityare estimated but not presented. F tests for the di!erence between Rawlsians and Utilitariansreturn one-tailed p-values of 0.04 and 0.04.
10

Replication with pure altruists excluded
Simple Model With ControlsVariable Coef S.E. p Coef S.E. pSocial Preference Type
Rawlsian 0.53 0.32 0.10 0.51 0.29 0.08Utilitarian 1.51 0.56 0.00 1.15 0.49 0.01
Political VariablesPolitical Interest 3.67 0.57 0.00High Political Info 0.06 0.32 0.84Internal E!cacy 0.60 0.49 0.22External E!cacy 0.48 0.62 0.44Partisan Strength 0.88 0.43 0.04Partisan ID -0.98 0.41 0.02Citizen 0.46 0.68 0.50
Socioeconomic StatusHigh Income 0.32 0.27 0.23Female 0.36 0.28 0.20White 0.62 0.27 0.02Age 1.13 0.55 0.04
Religious ActivitiesAttendance 0.97 0.55 0.08Contribution -0.04 0.31 0.89
(Intercept) 2.99 0.20 0.00 -2.114 0.89 0.02LogLik (model) -432.4 -431.9LogLik (null) -476.5 -476.5
Table 7: Dependent variable: Political Activity Index. N=222. The models are estimated usingtobit regression. All variables are rescaled to [0,1] for ease of interpretation. Social PreferenceTypes are measured dichotomously. Pure altruists are excluded. F tests for the di!erence betweenRawlsians and Utilitarians return one-tailed p-values of 0.05 and 0.10.
11

Simple Model With ControlsVariable Coef S.E. p Coef S.E. p
Rawlsianism 0.44 0.60 0.46 0.41 0.53 0.44Utilitarianism 2.34 1.00 0.02 2.06 0.87 0.02
Political VariablesPolitical Interest 3.79 0.57 0.00High Political Info 0.06 0.32 0.84Internal E!cacy 0.57 0.49 0.25External E!cacy 0.42 0.62 0.50Partisan Strength 0.78 0.43 0.07Partisan ID -1.03 0.41 0.01Citizen 0.29 0.69 0.67
Socioeconomic StatusHigh Income 0.35 0.27 0.19Female 0.41 0.28 0.15White 0.62 0.27 0.02Age 1.17 0.55 0.03
Religious ActivitiesAttendance 0.96 0.55 0.08Contribution -0.01 0.31 0.96
(Intercept) 2.36 0.45 0.00 -2.54 0.94 0.01LogLik (model) -473.6 -432.4LogLik (null) -476.5 -476.5
Table 8: Dependent variable: Political Activity Index. N=222. The models are estimated usingtobit regression. All variables are rescaled to [0,1] for ease of interpretation. Social PreferenceTypes are measured continuously. Pure altruists are excluded. F tests for the di!erence betweenRawlsians and Utilitarians return one-tailed p-values of 0.05 and 0.05.
12