Social Media and Outage Management: Enabling Customer ...smartgrid.epri.com/doc/2013-08-28 Smart...
52
Social Media and Outage Management: Enabling Customer Participation Smart Grid Information Webcast August 28, 2013 John J. Simmins, Ph.D. Technical Executive Jennifer Robinson Project Manager Christina Haddad Senior Research Engineer
Social Media and Outage Management: Enabling Customer ...smartgrid.epri.com/doc/2013-08-28 Smart Grid Informaiton Webcast... · Social Media and Outage Management: Enabling Customer
Social Media…. • 9 out of 10 businesses use social media. (Source: eMarketer)
• Facebook has 955M monthly active users, of which 58% are active daily. (Facebook, June 2012.) Over half of Facebook members use the social media platform regularly.
• Average Facebook user has 130 friends and is connected to 80 pages. (Social Media Examiner)
• Over 800 million unique users visit YouTube each month. (Source: YouTube)
• Twitter isn’t a social media community for most users. (Source: Beevolve)
So what are you trying
to do?
Influence
Presenter
Presentation Notes
9 out of 10 businesses use social media. (Source: eMarketer) Facebook has 955M monthly active users, of which 58% are active daily. (Facebook, June 2012.) Over half of Facebook members use the social media platform regularly. Average Facebook user has 130 friends and is connected to 80 pages. (Social Media Examiner) Over 800 million unique users visit YouTube each month. (Source: YouTube) Twitter isn’t a social media community for most users. (Source: Beevolve) About three out four users have 50 or less followers on Twitter. The average user follows 109 people and one in ten people on Twitter doesn’t follow anyone
161A: ICT Coordination, Analysis and Technology Transfer • Smart Grid Standards Tracking, Analysis and Contribution • Communications Technology Tracking and Analysis • Realized Costs, Impacts and Benefits of Smart Grid Deployments • Enterprise architecture best practices
IntelliGrid (P161) Structure Enabling Information & Communication Technologies (ICT)
P161 Focuses on the area of interest to IT, OT, and Communications.
161B: ICT For Transmission • Transmission related research on
• Data structures, • Synchrophasors & • Data integration for planning, operations and maintenance
161C: ICT for Distribution • Create the infrastructure for advanced distribution automation
• Common Information Model (CIM) Development • Geospatial Information System (GIS) Data Management • Advanced Distribution Automation Communications
161D: ICT for AMI and DER • Supporting members in AMI & DER integration
• Open, interoperable AMI systems • Demand response communication technologies, architectures, and standards • Integration of customer-sited distributed energy resources
Com
munications
Data M
anagement &
Analysis
Planning and Implem
entation
Interoperability & Standards
Presenter
Presentation Notes
As utilities move forward with building a smarter grid, several data challenges face them. The challenges vary for the G&T utility, vertically and non vertically integrated utilities but fall into five, broad categories. [mouse click] Interoperability The promises of open standards have yet to be realized in many circumstances. Gaps still exist in the standards and the devices or applications that are supposed to utilize the standards. How utilities move forward with technology roll-outs in such an environment may be problematic. Pooling of knowledge and sharing experiences lowers the overall risk for everyone. Gaps in standards need to be addressed through the feedback of real utilities doing real implementations. This project can help drive the standards development process, the standards testing process, and the integration best practice body of knowledge. Developing the business requirements and identifying gaps can be fed back into the standards setting organizations through formal processes that EPRI is already engaged in. These business requirements will also drive the development of interoperability and certification test cases. Finally, by collecting and sharing the experience of real implementations, a multi-media repository of knowledge can be developed that can be used by project members for future implementations. [mouse click] Communications As challenging as utility communication needs are today, they will only get more demanding. Choosing technologies that are future-proof is complicated as we are expecting a given communication media to handle different types of information – such as meter and operational data. Issues around the handling of data based on criticality and the quantity of data over a communication technology will continue to dominate the discussion. The assumption that bandwidth and connectivity can be expected to increase is reasonable based on history but are no guarantee that the expected improvements in the technology aren’t going to be overwhelmed by the increases in the quantity of data. [mouse click] Data Management The utility industry has not traditionally been an industry that relied on extensive data collection and analysis. Institutional knowledge of a more or less static grid has typically been acquired by experience in the field. The lack of operational data has been address by building in more capacity in terms of lines and devices than the closely observing grid conditions. A smart grid tends to be more stochastic with the conditions changing more rapidly than even a seasoned operator can anticipate. Distributed generation can change voltage levels and power flow as the sun or wind fluctuates. Devices may be operating on the grid that function independent of the control center to maintain grid conditions within specification. These devices can inundate the control center with data at rates too fast for humans to respond. Relationships between events that appear in the data are difficult or impossible to determine due to the disparate systems collecting the data or the very structure of the data itself. Static data, such as geospatial data, will become more dynamic and the accuracy of such data will become critical. The delivery and utilization of data will become equally important as the delivery and flow of electrical energy in the evolving smart grid. Failing to anticipate the amount, type and value of data will diminish the capability of the smart grid and will reduce the value of the investment of utilities in the components that make up the smart grid. By properly anticipating and planning for the impact of vast amounts of new data, the industry will increase reliability and decrease operational costs. [mouse click] Enterprise Architecture What is the infrastructure that will move all this data? What are the requirements now and in the future? The concept of Enterprise Architecture is still new to many utilities. Work has been done in other industries in this field for some time but the unique challenges to the utility industry need to be considered. The wide variations in the origin of data, the periodicity, the quantity, the need for multiple systems to receive similar information pose challenges that other industries don’t face. Concepts can be applied from manufacturing or the military but for the most part, the utility industry needs to define its own special architectural needs. The Open Group Architecture Framework (TOGAF®) is a framework for enterprise architecture which provides a comprehensive approach for designing, planning, implementation, and governance of an enterprise information architecture. TOGAF is a registered trademark of The Open Group in the United States and other countries. The Department of Defense Architecture Framework (DoDAF) is an architecture framework for the United States Department of Defense, that provides structure for a specific stakeholder concern through viewpoints organized by various views. [mouse click] Planning and Implementation Underpinning all these considerations is the need to plan and coordinate between the horizontal and vertical portions of this diagram is the real challenge. Coordinating across organizations is especially challenging. Open standards are supposed to make this easier but as we’ve seen, standards are not mature or ubiquitous. A distribution company must receive pricing information from a G&T. A G&T may request a demand response event and desires to monitor the results of the customer response – usually through the distributor. These are requirements that do not exist in other industries and the basic research needs to be done – in the real world – to find out how it all fits together.
Outage management now -- Sandy helped put social media for outage management on the map Note: John, I have permission to use the base graphics for this pres only. I do NOT have permission for the ones that appear through animation…use at your own risk. From http://www.journalism.org/index_report/hurricane_sandy_and_twitter A report from Pew Research Center’s Project for Excellence in Journalism, “..from October 29 through Wednesday the 31st: …34% of the Hurricane Sandy Twitter conversations involved news and information 25% “…involved people sharing photos and videos, speaking to the degree to which visuals have become a more common element of this realm” “…pictures and video of the storm, post-storm destruction, falsified pictures about the disaster and self portraits of people during the storm…” “14% of the conversation about the storm involved jokes”
“…more than 20 million tweets about the storm from October 27 through November 1…more than twice the usage from the two previous days”
Journalism.org
…and the fakes… …from mashable.com
Presenter
Presentation Notes
Outage management now -- Sandy helped put social media for outage management on the map Note: John, I have permission to use the base graphics for this pres only. I do NOT have permission for the ones that appear through animation…use at your own risk. From http://www.journalism.org/index_report/hurricane_sandy_and_twitter A report from Pew Research Center’s Project for Excellence in Journalism, “..from October 29 through Wednesday the 31st: …34% of the Hurricane Sandy Twitter conversations involved news and information 25% “…involved people sharing photos and videos, speaking to the degree to which visuals have become a more common element of this realm” “…pictures and video of the storm, post-storm destruction, falsified pictures about the disaster and self portraits of people during the storm…” “14% of the conversation about the storm involved jokes”
Some of the misinformation persists; getting rearticulated and repeated on the web…
Storms are getting worse and more
deadly…
Tornado Deaths 2010 45 2011 553 2012 70 2013 39
Three year average: 222
Source: NOAA
Presenter
Presentation Notes
Outage management now -- Sandy helped put social media for outage management on the map Note: John, I have permission to use the base graphics for this pres only. I do NOT have permission for the ones that appear through animation…use at your own risk. From http://www.journalism.org/index_report/hurricane_sandy_and_twitter A report from Pew Research Center’s Project for Excellence in Journalism, “..from October 29 through Wednesday the 31st: …34% of the Hurricane Sandy Twitter conversations involved news and information 25% “…involved people sharing photos and videos, speaking to the degree to which visuals have become a more common element of this realm” “…pictures and video of the storm, post-storm destruction, falsified pictures about the disaster and self portraits of people during the storm…” “14% of the conversation about the storm involved jokes”
• Examine utility industry use of social media –Research journals –News articles –~160 utilities
• Websites • Social media accounts
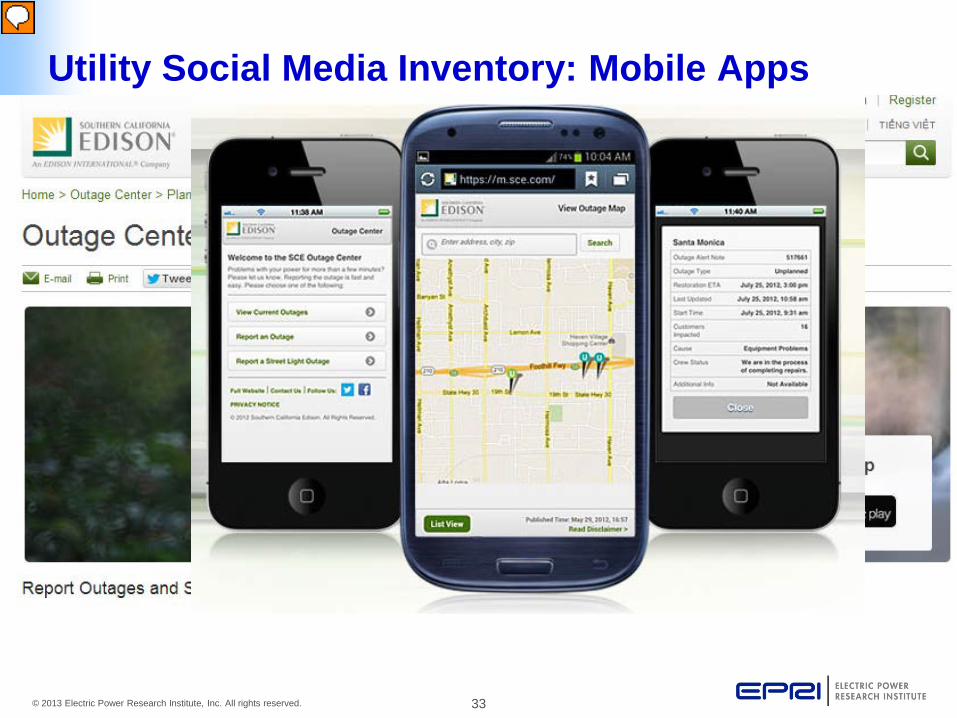
• Inventory of mobile apps
Presenter
Presentation Notes
In our preliminary research we looked at utility industry use of social media primarily for outage management. This consisted of a literature review of different journals, news articles and about 160 utility company websites and social media accounts. We also started an inventory of utility’s with mobile applications as well. A Pike research study we came across from 2011 stated that there were approximately 57 million customers worldwide using social media to engage utilities and that number is expected to increase to 624 by 2017. The bottom line is that there is still a great opportunity to reach out and engage the customer base in the next 5 years through social media.
From our research the top 3 social media outlets for utilities were Facebook, YouTube, and Twitter. The most common applications included outage and emergency management, education, outreach, news, job postings, and bill pay. Many indicated that they saw a dramatic increase in subscribers to their social media pages following a major weather event and the top question posed by customers on social media was when will the power be restored?
A quick summary of the findings show that the Facebook application was mostly used for education purposes, while others included outreach, and outage and emergency management. 19% of the sites though they were established had little to no content or activity. And 84% of the 160 companies reviewed had a Facebook account. As an example we’ve pulled a few updates from TXU Energy. They are very active on their facebook page and have close to 78,000 likes. This status from August 16th is giving customers information about where to do in the event of an outage, the next provides a link to information for residential solar installation, and the final screenshot provides an education status on saving energy. The TXU Facebook page seems to cover all of the bases including outage management support, education, and community outreach.
With the Twitter accounts these were primarily used for Education, though the Twitter accounts were used slightly more for Outage and Emergency management than the Facebook accounts were. Also, 73% of the companies reviewed had a Twitter account. Two of the industry leaders on Twitter are PSEG and ConEd. PSEG maintains three twitter accounts one for community involvement, one related to news and another related to outages and safety messaging. ConEd saw a dramatic increase in Twitter followers following Hurricane Sandy and has led to increased activity with Social Media. The screenshot from ConEd from mid-July is showing direct communication with the customers regarding outages. Asking if power has been restored, where to call, and indicating where power has been restored and inquiring if the customer is still having problems.
This slide shows a summary of the mobile application inventory . The majority of the mobile applications were being used for Outage and Emergency management while the next most common application was for Bill payment. Some also used the mobile app for news and education purposes. However, only 36% of the companies reviewed had a mobile application of some kind.
For example, SCE has a mobile app that allows the customer to report an outage, view outage locations, and check on the status of power outages to see when service may be restored.
Key Findings: Common Themes • Define a strategy and clear objectives, but be flexible
• Be proactive
– Notify customers what to expect when a storm approaches and inform them how often they will be updated
– Proactively prepare for and address negative comments
• Integrate with existing communication channels
• Know the audience and develop niche group communications around certain topics
• Show Don’t Tell: Show pictures of damage or of executives talking to the public (e.g. Flickr & YouTube)
• Become regular presence on social media / communicate often
• Identify internal staffing and resource needs early
• Perform dry run of outage and emergency management that incorporates social media information
Presenter
Presentation Notes
We came across some common themes from this initial research that could be termed best practices. The definition of a clear strategy and objective for using social media was important, but being flexible with the plans as new uses make themselves known was also noted. Being proactive by notifying customers via social media when a storm approaches in addition to letting them know how often they will be updated on the situation was a plus. Proactively preparing and addressing negative comments shows that the utility is active on their site. Integration with existing communication channels is another best practice. Knowing the audience and developing social media pages specific to certain customer groups and topics was also helpful to gain increased participation on the sites. Providing visuals of storm damage or executive visions and Identifying staffing needs for this type of communication is also important. Performing a dry run of Outage and Emergency management that incorporates the use of social media information could also be quite helpful.
– Direct two-way customer communication, opportunities for engagement
– Monitor public perceptions of outage restoration
– Provide timely and more accurate communications on ETRs
– Potential for faster and more precise movement of equipment to crews
– Crews standing by for shorter periods of time
Challenges
– Cyber security
– Verifying accuracy of data and information received through social media
– Consolidating collected outage and damage data
– Difficult to monitor website traffic from onlookers
Presenter
Presentation Notes
So what are the key takeaways from this research? Let me emphasize some of the opportunities and challenges with the use of social media as a communications outlet. Some benefits included: crews standing by for shorter period of time. The utility having direct 2 way communication with the customer. More accurate movement of equipment to crews during storms, and the use of Google Earth with social media information and monitoring public perception of outage restoration. Another opportunity is the ability to communicate different types of information to the customers via social media and like I mentioned previously the need for social communication specialists if those roles have not already been established. Some challenges and concerns that need further investigating emerged including the cyber security aspect of using social media which we will have a session on tomorrow morning, verifying the accuracy of data and information, integrating the information to make it actionable, and the challenge associated with accurately identifying the participation level with social media.
23 April 2013 • 1:08 p.m., a fake AP tweet went out,
reporting two explosions in the White House and that President Barack Obama had been injured.
• Two-minute period of panic selling forced the Dow down from around 14700 to 14554, 150 points, or about 1 percent. – S&P 500 – NASDAQ – crude oil all dropped 1 percent.
• Within 5 minutes, it has recovered. • Syrian Electronic Army
Presenter
Presentation Notes
A single hoax message sent via Twitter, the social media platform, erased billions of value from US stock markets on Tuesday, drawing attention to an electronic Trojan horse that hackers may manipulate with apparent ease.
• Spoofing of messages from the utility or users –Syrian Electronic Army
• Phishing attacks –Tweets of impending
outages –Leads to fake site –Privacy
• False reporting of outages
• Denial of service
Presenter
Presentation Notes
Common IT attacks: These can be attacks on external facing utility servers Spoofing of messages: The example is from when the Syrian Electronic Army hacked the AP twitter feed and reported an attack on the white house. There are also examples of ‘zombie’ twitter accts that people use to boost the number of followers that they have. Phishing attacks: An example could be tweets of impending outage with a phony link at which a customer could view details. In addition to possibly gaining customer information, it could also lead to customer mistrust if they were redirected to offending sites. This would lead to customers ignoring messages from the utility and reduce the messaging systems effectiveness.
This seems like the main challenge to me… Deter: Increased barriers can be technological. For example, tie the app on a users phone to their account and only use that information for making decisions Penalties can include legal, such as what you have for the abuse of 911 Detect: Maybe the utility requires data from multiple sources before they take action. This can help for detecting fake information. Respond: what are the internal policies and procedures for responding to false messages or other abuse? This will be easier for some forms of social media / smart device sources than others. Also need to ensure that policies and procedures are in place for when security protections are breached.
• Leaders are expecting measurable ROI – Tie social to key business results, only
customer satisfaction? • Keeping up as customers migrate to
mobile and social • Customers want more granularity of
information • Mobile/social/web/call center – consistent
info across all • Social to scale – systems, processes, tech
to move beyond small teams • Employees as ambassadors
– Tools/tips to support this (e.g., social text, likebook)
Presenter
Presentation Notes
Customers are migrating to mobile and social; utilities are expected to be present. How can utilities keep up? Leaders are expecting measurable ROI. How can we measure the return on using social technology with certainty. Customers want more granularity of information – now Mobile/social/web/call center must have same info Better use of employees as brand/company ambassadors Taking social to scale – how to create systems, processes & technology to move beyond small teams of talented employees How to tie social media results to key business results. Is there more than just customer sat?
– Or if they do, then what? • Changing field work processes, getting folks to
see the value • Incomplete/inaccurate damage assessments • Accurate ETORs not readily available • Paper orders main platform for mutual aid
crews • Getting info from the field – customer, timely • Integrating mobile outage system into existing
Presenter
Presentation Notes
Texas TDUs don’t “own” customer – no bill, no account, incomplete contact info $ (6 mentions) Incomplete/inaccurate damage assessments Paper orders -- #1 platform for mutual aid crews to enter data How to get info from the field – customer, timely Key management doesn’t consider this a priority (2 mentions) How do you change work processes in the field, get folks to see the value in changing Integrating a mobile outage system into what we already have (website, SAP, etc.)
• Working with IT – Creating it internally or externally
• Front end/back end communication • Technology • Social monitoring/response/workflow mgmt
tools not yet widely used by utilities – No clear leaders (and they don’t “get” us) – No utility wants to be the first
• Difficult to tie account # with email, social (360 view)
• Unique customer situation with Texas TDUs/REPs
Presenter
Presentation Notes
Creating it internally or externally 360 view of customer is difficult to create (i.e., tie account # with email, social ids) Technology Work with IT Accurate ETR not readily available Front end/back end communication Social monitoring/response/workflow mgmt tools aren’t widely used by utilities yet, so there aren’t clear leaders in the space (and they don’t “get” us) No utility wants to be the first
• Consider cost of scaling customer service through social
• Technology is available – varied uses/approaches
• Social media team – Not just one group, cross-
functional participation
Presenter
Presentation Notes
Technology is available – varied uses/approaches Determine what will sell at your company and work toward making that happen Social media team – not just owned by one group, cross-functional participation Keep new followers engaged after the storm Engage existing fans and employees (training) Build communities Need to collect twitter & FB info on customers Once customers have opted into a channel, offer/expand its use Customer expectations vary based on weather/temp, day of week, neighbors’ power restored, return to work expectations, etc. We need to think about the cost of scaling customer service through social media
• Engage existing fans and employees (training) – Build communities
• Need to collect twitter & FB info – At sign-up, other time
• Once customers have opted into a channel, offer/expand its use
• Customer expectations vary (e.g., weather, temp, day of week, neighbors’ power restored, return to work expectations)
Presenter
Presentation Notes
Technology is available – varied uses/approaches Determine what will sell at your company and work toward making that happen Social media team – not just owned by one group, cross-functional participation Keep new followers engaged after the storm Engage existing fans and employees (training) Build communities Need to collect twitter & FB info on customers Once customers have opted into a channel, offer/expand its use Customer expectations vary based on weather/temp, day of week, neighbors’ power restored, return to work expectations, etc. We need to think about the cost of scaling customer service through social media