Embed Size (px)
Citation preview

Governance Infrastructure and U.S. Foreign Direct Investment
Steven Globerman Western Washington University
College of Business and Economics
Daniel Shapiro Simon Fraser University
Faculty of Business Administration
Address Correspondence to: Daniel Shapiro
Simon Fraser University, Harbour Centre Faculty of Business Administration
515 West Hastings Street Vancouver, B.C.
Canada V6B 5K3
Email: [email protected]
May 2002 (revised) The authors thank Industry Canada, Microeconomic Policy Branch for financial support. Dr. Someshwar Rao was inspirational in suggesting the original focus of the study. Mark Wilson provided excellent research assistance. An earlier version of this paper was presented at seminars at Rutgers University and Western Washington University. The comments of seminar participants are gratefully acknowledged. Discussions with Paul Storer were especially helpful, as were the comments of three unidentified reviewers.
1

JIBS
Governance Infrastructure and U.S. Foreign Direct Investment
Abstract
This paper examines the statistical importance of governance infrastructure as a
determinant of U.S. foreign direct investment. In broad terms, governance infrastructure
represents attributes of legislation, regulation, and legal systems that condition freedom of
transacting, security of property rights and transparency of government and legal processes. Our
econometric analysis employs a two-stage estimation procedure. In the first stage, the probability
that a country is an FDI recipient is estimated. The results indicate that countries that fail to
achieve a minimum threshold of effective governance are unlikely to receive any U.S. FDI.
Countries that receive no U.S. FDI are typically countries that do not promote free and
transparent markets, have ineffective governments, and are often countries whose legal systems
are not rooted in English Common Law. In the second stage, the analysis is restricted to those
countries that did receive FDI flows. The estimated equations focus on the determinants of the
amount of FDI received. Given that a country is a recipient of U.S. FDI, governance
infrastructure, including the nature of the legal system, is an important determinant of the amount
received.
Keywords: foreign direct investment, capital flows, multinational corporations, infrastructure,
governance
2

Introduction
The international business literature has recognized the importance of country-specific
political and institutional factors as determinants of foreign direct investment (FDI) flows.
Empirical analyses of FDI routinely include some kind of variable to control for inter-country
differences in the broad political environment (Tuman and Emmert, 1999; Mody and Srinivasan,
1998; Stevens, 2000; Bevan and Estrin, 2000; Morisset, 2000; Altomonte, 2000; Wei, 2000),
albeit with somewhat mixed results (Dawson,1998). At the same time, recent empirical evidence
indicates that cross-country differences in growth and productivity are related to differences in
political, institutional and legal environments (OECD, 2001; Hall and Jones, 1999; Keefer and
Knack, 1997; Knack and Keefer, 1995; Levine, 1998; Kaufman et. al. 1999b).1
We refer to these broad political and legal institutions as the governance infrastructure of
a country. The governance infrastructure of a country helps to define its investment environment.
A .favorable. governance infrastructure creates beneficial conditions for investment and
economic growth. Since the investment environment of a country affects both domestic and
foreign investors, we expect that FDI will be attracted to regions characterized by more
favourable governance infrastructures, all other things constant. Also, since inward FDI
contributes to improved productivity in developed host economies (Blomstrom, Kokko and
Globerman, 2001), the linkage between FDI and governance infrastructure is of obvious policy
relevance. Our paper therefore focuses on the linkage between specific measures of governance
infrastructure and U.S. FDI flows.
This paper extends the FDI literature in several ways.2 First, we utilize newly developed
measures to examine the effects of governance infrastructure on U.S. FDI outflows to a broad
sample of developed and developing countries over the period 1995-97. Specifically, we employ
the indices developed by Kaufman et. al. (1999a), and the legal classification systems developed
by LaPorta et. al. (1998a,b) and the University of Ottawa Law School to measure governance
infrastructure.3 These various measures, described below, cover a broad range of institutional,
legal and policy characteristics available for a large sample of countries. In particular, they
include factors not commonly found in the FDI literature, notably classifications of the nature of
the legal system, as well as measures of the effectiveness of government, the regulatory
environment, and the degree of graft.
3

Second, we use a two-stage estimation procedure to account for the possibility of sample
selection bias (Heckman, 1979). In the present context, sample selection bias may arise if the
sample is limited to countries that are recipients of U.S. FDI. In fact, there are a large number of
countries in which either no positive FDI flows from the United States were recorded for our
sample period, or the country was not listed at all in the Bureau of Economic Analysis data that
we employ. In order to avoid sample selection bias, we first estimate the likelihood of a country
enjoying positive inflows of FDI from the United States and then estimate the determinants of
the magnitude of the positive inflows. In the first stage, the probit method is used to estimate the
probability that the US invests in a particular country. In the second stage, ordinary least squares
estimates of the determinants of the amount of FDI (given that it is positive) are provided. The
second stage equation includes Mills’ Ratio which is derived from the first-stage estimates and
which accounts for selection bias. Separate estimates of our equations are provided for samples
including both developing and developed countries, as well as for developing countries,
separately.
Finally, we investigate the possibility that the determinants of FDI, and in particular the
importance of governance infrastructure, are different across industries. It is often suggested that
an increasing share of FDI is either skill-seeking or efficiency-seeking, often in high-technology
industries (Dunning, 1993). Such investments are primarily attracted by the availability of
skilled human capital, as well as by the availability of infrastructure investments, particularly in
transportation and communications. We therefore provide separate estimates for U.S. FDI flows
in two high-technology industries.
Our results indicate that governance infrastructure is an important determinant of location
choice by U.S. investors. Countries that receive no U.S. FDI are typically countries that have
weak governance structures, and are often countries whose legal systems are not rooted in
English Common Law. For those countries that do not receive FDI, investments in governance
infrastructure should result in more foreign investment. Since most of the countries that do not
receive U.S. FDI are small and developing, the benefits, in terms of inflows, are most
pronounced for those countries. Moreover, given that a country is a recipient of U.S. FDI,
governance infrastructure, including the nature of the legal system, is an important determinant
of the amount received. Thus, investments in better governance infrastructure will also increase
FDI inflows.
4

The study proceeds as follows. In the next section, we discuss the definition and
measurement of governance infrastructure. We then present the model to be estimated, and the
data employed, followed by a discussion of the estimation technique and results. A summary and
conclusions is provided in the final section.
Governance Infrastructure
Broadly speaking, governance infrastructure comprises public institutions and policies
created by governments as a framework for economic, legal and social relations. We are most
concerned with those elements of the governance infrastructure that can affect the investment
decisions of multinational corporations (MNCs). A beneficial governance infrastructure might
therefore include: an effective, impartial and transparent legal system that protects property and
individual rights; public institutions that are stable, credible and honest; and government policies
that favour free and open markets.4 These conditions encourage FDI, and presumably private
domestic investment as well, by protecting privately held assets from arbitrary direct or indirect
appropriation. In a related manner, the same conditions encourage sunk cost investments by
MNCs that facilitate efficient operation in host countries. Thus, our basic hypothesis is that
countries with better governance infrastructures are more likely to attract U.S. FDI, other things
equal.
As we use the term, governance infrastructure is similar to the notion of social
infrastructure used by Hall and Jones (1999) in that the definition includes both institutions and
policies. We prefer the term governance infrastructure because it is readily distinguishable from
related notions of physical infrastructure, social capital and human capital.5
We measure governance infrastructure using several indicators. We first employ the six
governance measures estimated by Kaufmann, Kraay, and Zoido-Lobaton (1999a and 1999b).
These indices (which we will refer to as KKZL indices) describe various aspects of the
governance structures of a broad cross-section of countries. The six indices measure: 1. Voice,
political freedom and civil liberties (VOICE): 2.Political instability, terrorism and violence
(STAB); 3. The rule of law, crime, contract enforcement and property rights (LAW); 4. The level
of graft and corruption in public and private institutions (GRAFT); 5. The extent of regulation
and market openness, including tariffs and import controls (REG); and 6. Measures of
government effectiveness and efficiency (GOV).
5

The indices have been estimated (using an unobserved components model) employing 31
different qualitative indicators from 13 different sources, including BERI, DRI/McGraw Hill, the
Heritage Foundation, the World Bank, the World Economic Forum and the Economist
Intelligence Unit.6 Thus, they are effectively meta-indices encompassing a wide range of
measures and sources, and they should provide more precise measures of governance than
individual indicators. Another advantage is that the measures are available for a large number of
countries (between 145 and 158). A disadvantage is that they are estimated, and thus subject to
measurement error. In addition, the indices are so highly correlated with each other that it is
very difficult to use them all in a single equation. We have therefore created an aggregate
measure estimated as the first principal component of the six measures. We refer to this
aggregated governance infrastructure index as GII. We also consider the role of the individual
indices as explained below.
Although the KKZL measures are comprehensive, and do provide an index of the rule of
law, they do not explicitly account for the recent literature which focuses on the importance of
the origins of the legal system.7 In particular, LaPorta et. al. (1998a, 1999, 2001) and Djankov
et. al. (2002) argue that countries whose commercial legal systems are rooted in English
Common Law better protect shareholders and creditors, better preserve property rights, and are
associated with less regulation of markets. These studies therefore suggest that English Common
Law facilitates the development of capital markets and investment opportunities. We therefore
expect that countries whose legal systems originate in English Common Law will attract more
FDI. Conversely, the greater formalism of civil law regimes is associated with higher expected
durations of judicial proceedings, more corruption, less honesty and fairness and inferior access
to justice. As a consequence, investment incentives in civil law regimes should be weaker than
in common law regimes, all other things constant.
LaPorta et. al. (1998b) have classified a large number of countries according to the origin
of their commercial or corporate legal codes. Specifically, they classify countries’ legal systems
as having their origins in English Common Law (ENGLAW), civil law of French, German or
Scandinavian origin (FRELAW, GERLAW, SCALAW), or socialist law (SOCLAW). One
disadvantage of this measure is that it classifies all formerly communist countries in the last
category, and therefore possibly conflates the role of legal systems with other factors.
6

The University of Ottawa Faculty of Law provides an alternative taxonomy. They
classify legal systems according to whether their origins are in common or civil law, but provide
somewhat different categories within each. Pure common law systems (COMLAW1) are based
primarily on English Common Law, and assign a pre-eminent position to case law, not
legislation. Mixed common law systems (COMLAW2) blend English Common Law with
elements of customary or religious (usually Muslim) law. Pure civil law (CIVLAW1) systems
are based on the Roman system and give precedence to codified, written law; mixed civil law
(CIVLAW2) systems combine elements of civil law with customary or religious law. Under this
classification method, most formerly communist countries are defined as having either pure or
mixed civil law systems.
We therefore measure governance infrastructure in a number of ways. We view the two
legal system classifications as substitutes. Hence, we do not consider them in the same
estimating equation. The relationship among these measures is further discussed below.
Modelling U.S. FDI Flows
The basic question we seek to address is whether governance infrastructure, as measured
by some or all of the indicators discussed above, affects U.S. FDI flows across countries. Our
two-stage model is summarized in the following way:
(1) FDIit* = α0 + α1 GOVERNANCEit + α2 X1 it-1 + ε1it,
where FDIit* is a latent variable, defined such that FDIit = 1 (country i is a recipient of U.S. FDI)
if FDIit* >0 and FDIit = 0 (country i is not a recipient of U.S. FDI) if FDIit* = 0 or <0;8
GOVERNANCE is one or more of the measures (or sets of measures) defined above; X1 is a
vector of control variables; and ε1it is a normally distributed error term. We hypothesize that
α1>0 for the continuous governance measures, and for countries whose legal systems originate in
English Common Law.
(2) Ln FDIit = β0 + β1 GOVERNANCEit + β2 X2 it-1 + β3 Mills + ε2it,
7

where Ln FDI is the natural logarithm of the dollar value of U.S. FDI flows received by country i
in time t; GOVERNANCE is as above; X2 is a vector of control variables, some of which are the
same as X1 above; Mills is the inverse of Mills’ ratio derived from (1); and ε2it is a normally
distributed error term. We hypothesize that β1>0 for the continuous governance measures, and
for countries whose legal systems originate in English Common Law. The natural log value of
FDI is utilized so as to minimize the influence of .extreme. values of that variable. In fact, our
results, to be reported, are insensitive to the precise specification of the FDI variable.
Equation (1) is a simple Probit specification, whereby a country is an FDI recipient if it
surpasses a critical value of an index, FDI*. The value of the index is a linear combination of its
governance infrastructure (GOVERNANCE) and other variables (X1). Equation (2) is a basic
linear equation, confined to observations where FDI>0. It includes the inverse of Mills’ ratio to
test for sample selection bias (Heckman, 1979).
Data and Measurement
The data for this study were obtained for a cross-section of countries over the period
1994-1997. The variables and their sources are summarized in Table 1, and are discussed in
more detail below. The FDI data are measured over the three-year period, 1995-97, while other
explanatory variables were measured, where possible, using a one-year lag. Thus, for each
country there are a maximum of three years of data. At the time the data were collected, 1997
marked the last year for which FDI data were available, and this determined the end-date. At the
same time, several key independent variables were available only from the mid-1990s, which
conditions the chosen start-date. For some variables, data were available for every year, but for
others, including the governance infrastructure measures, they were not. Hence, our ability to
create a complete time-series panel was limited. Nevertheless, we pooled the data to increase
sample size and the reliability of the estimates.9
The number of observations was limited by the availability of data. For the first-stage
probit estimates, the number of sample countries was limited by the availability of the KKZL
indices and other variables. Specifically, we were able to compile data for 143 countries, of
which 88 were recipients of positive U.S. FDI flows in at least one year. Some data were missing
for individual years, resulting in 404 observations of which 223 were positive. The 88 countries
(223 observations) served as the basis for the second-stage estimates. Developing and transition
8

economies were defined as non-OECD members excepting Hong Kong and Singapore, resulting
in 115 countries so classified (320 observations), of which 62 (152 observations) were FDI
recipients. Given the limited industry detail regarding U.S. FDI, two industries were explicitly
identified as technology-intensive: electrical equipment and chemicals. In order to ensure a
sufficient number of observations, we pooled these two industries, resulting in 39 countries (108
observations) that were recipients of high-tech FDI.
The Dependent Variables
We measure FDI in terms of flows, mainly for practical reasons relating to data
availability. In the first stage of the estimation process, the dependent variable is defined to take
a value of unity if there were positive U.S. FDI flows to the sample country in a given year
during the sample period (1995-97), and zero otherwise.10 In the second stage, the logarithm of
the average dollar value of U.S. FDI received in that year is used as the dependent variable. The
logarithmic specification was chosen because it is consistent with gravity models, but in practice
the results are not changed when absolute or proportionate measures are used.11 High-
technology industries are defined as the chemical and allied industries, and the electric and
electronics industry, and U.S. FDI in high-tech is the sum of FDI in these industries.
Included Control Variables
The choice of control variables (independent variables in addition to governance
measures) was based on the existing theoretical and empirical literature, although the
specification chosen was constrained by data availability. Our goal was to create parsimonious
specifications for each equation while effectively controlling for the large number of factors that
have been found to influence FDI flows. Conceptually, the same variables should be included in
both the first- and second-stage estimations. We will discuss the exact specification of each
equation in the next section.
Although the FDI literature has discussed a large number of potential determinants of
FDI, surprisingly few are consistently significant across the broad set of empirical studies that
have been performed.12 One variable that is consistently statistically significant is a measure of
the host country’s size, usually identified by a measure of real gross domestic product (GDP).13
Large market size is expected to attract FDI because of economies of scale in production and
9

distribution for products sold in the host market. In addition, large markets may be associated
with agglomeration economies that lower costs for all producers in that market. Contributing to
the relevant agglomeration economies may be the availability of highly specialized inputs that
cannot be found in smaller markets.14 Like FDI, and for similar reasons, GDP is measured in
logarithms in our models. The GDP coefficient measures the elasticity of FDI flows in the
second-stage estimations, and should be positive.
To the extent possible, we attempted to measure the relevant independent variables for a
prior period. GDP is therefore measured in U.S. dollars over the period 1994-1996. The GDP
variable was lagged both to allow for adjustment lags, and to reduce the potential for a bias
created by the dependent variable (FDI) causing higher values of GDP.
We use the U.N. Human Development Index (HDI) as a summary measure of a variety of
factors that have been found to influence FDI. This index is now available for 168 countries,
although not for every year. HDI is derived from three sub-indices: GDP/population, educational
literacy and enrolment, and life expectancy at birth. The measures are available for 1995 and
1997, and we use their average value for 1996. The health and education components are direct
measures of human capital. The GDP per capita component is a measure of wealth that has
traditionally been used to measure consumer demand, but it may also serve as a proxy measure
for the amount of physical infrastructure.15 Increased values of human capital and physical
infrastructure should be positively related, on average, to inward FDI (Mody and Srinivasan,
1998), but the role of health has to our knowledge not been explored. In addition, recent
evidence suggests that the location decisions of foreign investors may be influenced by quality of
life variables, (Peterson, Malhota and Wagner, 1999). In this regard, GDP per capita is a
measure of quality of life, although one that has been recently questioned (OECD, 2001).
Indeed, HDI might be viewed as a broad measure of quality of life. Other things equal, we expect
that higher levels of HDI will attract more FDI.
The literature also suggests that FDI flows may be affected by exchange rates. We
measure these effects in two ways. First, we include dummy variables identifying countries that
operated with fixed exchange rates (in 1996). We further distinguish those countries whose
currencies were pegged to the U.S. dollar (FIXUS) from those whose currencies were fixed, but
not in terms of the U.S. dollar (FIXNUS). The presumption is that a country will fix its currency
against the major currency (or currencies) in which its trade and investment flows are most
10

heavily concentrated. As such, if currency volatility discourages FDI flows, countries operating
fixed exchange rate regimes should be characterized by more FDI than those operating floating
rate regimes, all other things constant. Currency volatility will discourage FDI if risk-averse
investors view such volatility as a direct cost (if hedging is used to reduce the volatility) or an
indirect cost (if risk is unhedged).16 Thus we expect that countries with fixed exchange rates
should attract more FDI, but since we are dealing with U.S. FDI flows, these effects may be
limited to those countries that peg their currencies to the U.S. dollar.
We also include a variable (DEXR) that measures whether a domestic currency
appreciated or depreciated against the U.S. dollar over the sample period. Specifically, the
variable is measured as the ratio of the value of the exchange rate (in U.S. dollars) in a given
year (lagged one year relative to FDI) to its average value over the two previous years. Froot
and Stein (1991), among others, argue that companies must usually fund international expansion
through their retained earnings. Hence, companies located in countries with relatively strong
currencies should enjoy increased purchasing power in international asset markets, while the
opposite will be true for companies headquartered in weak currency regions. In the context of
our model, U.S. MNCs should find it cheaper to acquire assets in countries whose currencies are
depreciating against the U.S. dollar, other things constant. Conversely, asset acquisitions should
become more expensive in countries with appreciating currencies. Based on this argument the
sign of DEXR should be negative.
One relevant caveat is that MNCs frequently fund a substantial portion of their overseas
investments using financial capital raised abroad. In such cases, it is theoretically unclear which,
if any, specific currency represents the home currency. Another caveat is that U.S. MNCs expect
to earn dividends and other receipts on their foreign direct investments, and those remittances
will be converted from the host country currency to U.S. dollars. Hence, an appreciating dollar
implies lower U.S. dollar-based returns on U.S. direct investments in the country experiencing a
depreciating home currency (Safarian and Hejazi, 2001).
Obviously, the practical relevance of this latter point is sensitive to the nature of a foreign
affiliate’s activities. For example, if the affiliate is primarily exporting products priced in U.S.
dollars, such as oil, the resulting income stream to the parent might be naturally hedged against
depreciation of the local currency. It is also sensitive to the anticipated permanence of the
change in the local currency’s value. Specifically, if the change reflects purchasing power parity
11

differences between the U.S. dollar and the local currency, it is unlikely to be reversed soon after
a foreign investment is made. In many cases, therefore, the positive influence (on inward FDI
from the U.S.) of lower U.S. dollar-equivalent asset prices might be offset by lower U.S. dollar-
equivalent returns on the relevant assets. In this regard, recent evidence suggests that currency
movements largely reflect underlying purchasing power changes, even over periods as short as
several years (Taylor, 2000; Popell, 2001).
Finally, we include a variable to account for physical proximity to the U.S. This term is
measured by a dummy variable that equals 1 if the country is contiguous with the U.S. (Canada
and Mexico). The latter are also signatories, with the U.S., to the North American Free Trade
Agreement (NAFTA), which lowers barriers to FDI. Thus, this variable should be positively
related to FDI. We refer to the variable as PROXIMITY, but it may well reflect NAFTA effects.
Omitted Control Variables
In closing this section, we acknowledge some possible control variables that are omitted
from our models. Two obvious candidates are unit labour costs and tax rates. Neither is
included because the appropriate data could not be found for a sufficiently large sample of
countries. Data on wage rates are available, but wage rates are misleading because they can
reflect productivity advantages (and are thus correlated with GDP per capita). Consequently, it
is not surprising that GDP per capita and relative wage rates are frequently either statistically
insignificant or appear with the .wrong. signs in FDI regression equations.17
Likewise, most available tax measures are inappropriate. The conceptually appropriate
measure to compare across countries is the marginal effective tax rate. This rate differs across
industrial sectors, and it is extremely difficult to measure (Chen, 2000). As well, there is
considerable intra-country variation in tax rates within large countries, and simple averages may
disguise the ability of a particular region to attract FDI. Finally, any aversion to high taxes might
be mitigated by their link to the provision of infrastructure that, in turn, is highly valued by
international investors. We were able to calculate one proxy measure for taxes, the ratio of
government tax revenue to GDP. This measure does not capture the impact of taxation at the
margin, and was not statistically significant in any preliminary estimated equations.
Another variable commonly found in the literature is a measure of the openness of the
economy, often measured as (imports + exports)/GDP (Grosse and Goldberg, 1991; Goldberg
12

and Grosse, 1994). In fact, this concept is captured by one of the KKZL indices, the measure of
regulatory burden (REG), which includes factors such as tariffs and other trade restrictions.
Thus, this measure, as well as the over-all GII index is, to some degree a measure of the
openness of an economy.
We also attempted to measure cultural distance using a dummy variable that equals 1 if
the recipient country has English as an official language. Common language is expected to
facilitate FDI flows. This variable was highly collinear with the legal system terms and, in
particular, with either the LaPorta et. al. English Law variable or the University of Ottawa Pure
Common Law term (r=.62 in both cases). The language dummy variable was typically positive
and statistically significant in the absence of the legal terms, but often lost significance when the
latter were included (and vice-versa). Thus we cannot rule out the possibility that the legal
system terms, to some degree, measure cultural proximity. On the other hand, studies that
previously interpreted similar language terms as representing cultural factors exclusively may
have confused cultural effects with the effects of legal systems.
Finally, we considered the relationship between environmental quality and environmental
regulation, and FDI flows. Although environmental regulation may increase the costs of doing
business, and thus deter FDI, a clean environment may be associated with a higher quality of life,
and thus attract FDI. The KKZL regulation measure does not consider environmental regulation.
One relevant measure is the Environmental Sustainability Index (ESI), created by The World
Economic Forum, in conjunction with Columbia and Yale Universities. The ESI index is
derived from 22 factors that contribute to environmental sustainability including air quality,
public health and environmental regulation. The ESI index therefore reflects environmental
infrastructure in the form of policy choices made by governments, as well as human capital
reflected in public health conditions. However, it is available only for a relatively limited sample
of countries, as well as for only a single time period that post-dates the time period for the
dependent variable. Specifically, the earliest year for which ESI is available is 2000.
Nevertheless we included this variable in provisional estimates (not reported) and found that it
was never statistically significant. This result is broadly consistent with other studies reporting
that tighter environmental regulations do not discourage inward FDI (Wheeler, 2001;
Smarzynska and Wei, 2001).
Estimation and Results
13

Specification and Estimation
The equations to be estimated are (1) and (2) above. For the first-stage (probit)
equations, the dependent variable equals 1 if the country received positive FDI flows in that year,
and zero otherwise. For the second stage equations, the dependent variable is the logarithm of
the dollar amount of FDI received in that year. The independent variables may be broadly
classified as either governance infrastructure variables (the KKZL indices and the legal system
variables) or as control variables (ln GDP, HDI, proximity, and exchange rate variables). All
independent variables are candidates for inclusion in either equation.
The first specification issue, common to both equations, is how to choose from among the
governance infrastructure variables. A representative correlation matrix for selected variables,
including all of the governance infrastructure variables, is presented in Table 2, together with the
means of the relevant variables. Since we will work with several different samples, several
correlation matrices are potentially relevant. However, the correlation coefficients for the
different samples are not very different from those presented in Table 2, which refers to the full
sample of 143 countries (404 observations) considered.
Clearly, the various KKZL measures (VOICE, STAB, GOV, REG, LAW, and GRAFT)
are highly correlated with each other, with correlation coefficients that range from 0.65 to 0.92.
Given this degree of intercorrelation, it is not possible to use the relevant variables in the same
equation. As a consequence, they are either entered individually, or we use a summary measure
that is their first principal component, denoted as GII.18
Since the KKZL variables are estimated, and because they are not available for each year,
we also consider the Index of Economic Freedom (IEF), published by the Heritage Foundation
and the Wall Street Journal. This index is based on a number of sub-indices, all of which are
related to open and free markets, and macro-economic stability. The index is available for each
year of our sample period. As can be seen, it is highly correlated with most of the KKZL
variables, and with GII.19
It is also clear (and not surprising) that many of the LaPorta et. al. legal system variables
are quite highly correlated with the University of Ottawa legal system variables. Thus, the two
legal system variables are never included in the same equation. On the other hand, the
correlation between individual legal system variables and the KKZL variables is moderate,
14
suggesting that they can be included in the same equation. It is of particular interest that the
KKZL Rule of Law measure is only moderately correlated with any of the legal system terms.
The KKZL measure in fact includes a variety of outcome terms, including costs of crime, extent
of tax evasion, police effectiveness, and various measures of the rule of law and the protection of
property rights. It does not, however, take into account the legal tradition of the country. Thus it
would appear that the KKZL Rule of Law measure and the legal system variables contain
different information.
Finally, we note that the Human Development Index (HDI) is highly correlated with the
individual KKZL variables, although in varying degrees. For example, the simple correlation
coefficient between HDI and GII is 0.68, thereby posing a potential multicollinearity problem if
both variables are included in the same estimating equation.20 Hence, we at times drop HDI
from our estimating equation when its presence clearly affects the governance infrastructure
terms that are our main concern.
The same basic specification strategy is followed for both equations (1) and (2) above.
In both cases, we first estimate a .full model. that includes one of the KKZL variables, one set of
legal system variables plus all of the control variables (ln GDP, proximity, the exchange rate
terms, year dummy variables and HDI). We then test restricted versions of the model until we
arrived at a parsimonious and statistically acceptable specification.21
Equation (1) is estimated by maximum likelihood techniques, and the restricted models
are tested using likelihood ratio tests (Greene, 1993: 369-70). Equation (2) is estimated by
ordinary least squares with heteroscedastic-consistent standard errors. Restrictions are tested
using standard F-tests. The Mills ratio, derived from Equation (1) is also included in the second
stage estimate. The estimation technique is a standard application of the method developed by
Heckman (1979), and explained in Greene (1993: 711-13).
The preferred equations were subjected to specification tests. For equation (1), Lagrange
multiplier specification tests (Verbeek, 2000: 188) reject the need to include higher order terms
for GII (or any of its components) and HDI. In the second stage equation, we tested for
specification error through a series of one and two power RESET tests (Verbeek, 2000: 58-61).
The simple linear specification described by equation (2) passed those tests, and, therefore, no
interactive or higher order terms are included.
15

Finally, all residuals were inspected for evidence of outliers. Unless otherwise reported, none
were found. In addition, the role of potentially influential observations, specifically India and
China, was examined by excluding one or both from the sample. Unless otherwise indicated,
those exclusions did not affect our results.
Results
The primary results for the FDI models are found in Tables 3 (first stage probit estimates)
and Tables 4 and 5 (second stage estimates). Each table presents results for total U.S. FDI flows
to all countries, total U.S. FDI flows to developing and transition economies, and U.S. high-tech
FDI flows to all countries.
First Stage Results
In the first stage of the estimation process (Table 3), the dependent variable is defined to
take a value of unity if there were positive U.S. FDI flows to the sample country in a given year
(1995-97), and zero otherwise. For these equations, the proximity variable could not be included
because it perfectly predicted FDI = 1, and would not allow convergence of the parameter
estimates. The specification tests discussed above indicated that a full model (containing ln
GDP, one KKZL variable, one set of legal system dummies, HDI , two exchange rate terms and
two year dummy variables) was always rejected in favor of a restricted model that contained
only ln GDP plus one KKZL variable or one set of legal system variables. Indeed, when a full
model is estimated, almost all of the estimated coefficients are statistically insignificant. As a
consequence, we estimate and report each governance variable coefficient in a separate equation
(Table 3). Each reported coefficient is part of a separate estimated equation containing an
unreported constant term and an unreported term for ln GDP, both of which are always
statistically significant. In general, the estimates show good explanatory power as indicated by
their ability to correctly classify countries.
These results indicate that governance is an important determinant of the probability that
a country will receive U.S. FDI. In general, there is little difference in the results between the
total sample and a sample restricted to developing and transition economies. In both cases, the
more aggregate measures, GII and IEF are positive and statistically significant, although the
coefficients are typically larger in the sample of developing and transition economies. However,
16
not all of the KKZL variables are individually statistically significant. For these two samples,
neither the rule of law, nor political instability/violence are statistically significant. Moreover,
judging from the size of the coefficients and the log likelihood statistic, a limited regulatory
burden is the most important of the KKZL variables. It is important to recall that this term
includes measures such as openness to trade, FDI restrictions, and price controls. Therefore,
open economies are more likely to be recipients of U.S. FDI flows. Government effectiveness
and graft appear to be the next most important factors. It is typically the case that the coefficients
are higher in the sample of developing and transition economies. In particular, the graft
coefficient is much higher, indicating that U.S. investors tend not to locate in developing and
transition countries where corruption is high.
Although the rule of law term is not statistically significant in the two samples, the results
clearly indicate that countries whose legal systems are rooted in English Common Law are more
likely to be recipients of U.S. FDI flows. This is true regardless of the legal classification system
employed. The University of Ottawa classification scheme reveals that countries that adopt legal
systems that mix common law with customary or religious law are less likely to receive FDI, as
are all civil law countries. However, the LaPorta et.al. classification suggests that countries
adopting French civil law are more likely to receive FDI than are other civil law countries, or
countries whose legal systems are socialist.22 In part, the differing results reflect differences in
the allocation of socialist and former communist countries. Specifically, the University of
Ottawa system classifies them as civil law countries, while La Porta does not. When the
countries classified by La Porta et. al. as socialist are removed from the sample, none of the
remaining La Porta legal system variables are significant. However, using the University of
Ottawa classification, it is still the case that Pure Common Law countries are more likely to
receive FDI.
We therefore conclude that governance infrastructure is an important determinant of
whether a country is a recipient of U.S. FDI flows. We can conclude that governance variables
related to open markets, government effectiveness, graft and political accountability are
important determinants of FDI. Moreover, countries whose legal systems are rooted in English
Common Law are also more likely to be recipients of U.S. FDI.
It is noteworthy that the HDI term (and each of its components) is not statistically
significant when total flows are considered. This is true whether HDI is entered alone (with Ln
17

GDP), or whether it is entered with other variables. In general, U.S. firms are more likely to
locate in countries characterized by relatively large domestic economies and relatively good
governance. These factors appear to dominate wealth, education and health.
The results for high-tech FDI are somewhat different. The overall statistical fit of the
Probit model is better, as evidenced by the high fraction of correct predictions. The estimated
coefficients are also generally higher than those for total FDI flows. In particular, the regulatory
burden term is much larger, while the government effectiveness term is also higher. The rule of
law term is now significant at the .10 level. Countries with common law backgrounds are more
likely to receive high-tech FDI, which is consistent with the view that the common law provides
greater protection for property rights. In addition, HDI has a statistically significant and positive
impact on the probability that a country will receive high-tech FDI, as do each of its components
(not shown). Moreover, when HDI is included in an equation with governance variables, it
remains statistically significant. Thus, there is some evidence that wealth and human capital are
uniquely important for FDI in high-tech industries than for other industries. Governance
infrastructure is also distinctly important in high-tech industries.
Second Stage Results
In estimating the second stage equations, we again began with a model including all
control variables and then tested restricted versions using F-tests. In this case, the full model
(excluding year dummy variables) was always preferred, and the results are reported in Table 4.
For ease of exposition, Table 4 contains results that use GII as a summary measure of the KKZL
governance indices, together with separate equations using the two legal system classifications.
Results obtained using each of the individual KKZL indices are summarized in Table 5 and will
be discussed below. The dependent variable is specified as the natural log value of U.S. FDI
(total or high-tech). The tables present separate results for the full sample of countries, for the
sample of developing and transition economies and for countries that receive high-tech
investments. The Mills ratio was never statistically significant and is, therefore, not included.23
Table 4 provides representative results obtained from ordinary least squares estimation of
the pooled data. For all samples, one set of estimates is provided using the University of Ottawa
legal classification method, and another set is provided using the La Porta et. al. system.24
Additional specifications are provided in order to illustrate specific issues.
18

The main variables of interest are GII and the legal system variables. For the most part,
the results are similar to those reported for the first stage estimates. That is, both effective
governance and legal systems rooted in English Common Law tend to increase the amount of
U.S. FDI received by a country. However, the effects depend to a degree on the precise
specification of the estimating equation, as well as the sample. For example, the Pure Common
Law variable is more statistically robust in the All Countries and High-Tech samples than in the
Developing and Transition Economies sample.
We estimated equations with and without HDI (or its components). We did so because of
the intercorrelation between GII and HDI, and because of the possible causal relationship
between them. For the total sample (columns 1-4), we find that the GII index is positive and
statistically significant when HDI is excluded, but it tends to lose significance in equations that
contain HDI (or any of its components) and the University of Ottawa legal variables (column 2).
The same variable remains statistically significant when HDI is included in an equation with the
La Porta variables (column 4). Thus, there is some evidence that wealth and human capital exert
an independent and positive effect on FDI inflows.
However, the results are somewhat different when the sample is restricted to developing
and transition economies (columns 5-7). As before, the GII term is positive and statistically
significant when HDI (or any of its components) is excluded, but it loses significance when HDI
is included, even for equations using the La Porta et. al. legal system classification (column 7).
We interpret this result as indicative of the statistical difficulty in distinguishing human capital
effects from governance effects.
The results are again different for high-tech FDI flows (columns 8-10). The GII term in
this sample is always positive and statistically significant, as before; however, HDI term is rarely
statistically significant, whether GII is included or not. On the other hand the education
component of the HDI index is always positive and statistically significant, even with GII in the
equation. Thus, it appears that governance improvements will increase FDI flows in high-tech
industries, but investments in education have additional and independent effects.
Although it is generally true that countries whose legal systems emerged out of the
English Common Law tend to attract more FDI (but not necessarily more high-tech FDI), other
things equal, the relative impact of this effect depends on the method of classifying the legal
system. Using the University of Ottawa classification, it is typically the case that countries with
19

Pure Common Law systems receive more FDI than do those with pure or mixed civil law
systems. Using the La Porta method, countries using the English Common Law receive more
FDI than do countries with socialist legal systems, but not necessarily more than all civil law
countries. For the total sample, it appears that countries using either the English or French
system receive more FDI than do all other countries, including those adopting the German or
Scandinavian system. For developing and transition economies, countries whose legal systems
are based on French Law receive more FDI than all countries. These differences are attributable
to the classification of socialist countries. When the socialist countries are removed from the
sample, the apparent advantage of French legal systems disappears.
Given these differences between the two legal classification systems, can we say that one
classification system is preferable? To explore this issue, We treat equations using the two
systems as being non-nested, and use the Davidson-MacKinnon J-test to test the hypothesis that
one (or the other) is the .true. model (Greene, 1993:222-224). For example, we test the null
hypothesis that the model in column 1 (Table 4) is preferred to the model in column 3 (the
alternative), and then reverse the procedure and test the null that the column 3 model is preferred
to the column 1 alternative. The null hypothesis is rejected in both cases, and this is the case for
all samples and specifications. Thus, it is apparently the case that neither classification method
is fully comprehensive, and that further research is required into the optimal method of
classifying national legal systems.
One example of the differences between the two methods is provided by the results for
high- tech FDI. When the University of Ottawa classification method is employed, we find that
pure common law countries attract more FDI, and this is true regardless of whether India
and/China are included in the sample. However, when the La Porta method is employed, the
results do depend critically on the composition of the sample. For example, columns 9 and 10 in
Table 4 present results when China is included and excluded from the sample. China is
classified by La Porta et. al. as a socialist law country. It is also a country that receives
significant amounts of high-tech FDI. When China is included (column 9), the results indicate
that countries with any other form of legal system receive significantly less high-tech FDI than
do countries with socialist legal systems, other things equal. When China is excluded (Column
10), we observe that countries using the English Common Law receive more FDI, other things
equal, and more than countries using any other legal system.25
20

It is possible that non-legal institutions protect property rights in China in a unique way
that might explain the difference in results when China is included in the sample. In this regard,
Zhang (2001) argues that Western FDI in China is motivated by its comparative political
stability. Our governance or legal variables might not adequately capture this attribute.
Before concluding this section, we comment on the control variables. We find that the
coefficient for the GDP variable is positive and highly significant in all equations and for all
samples. Market size is therefore a critical determinant of both the probability of receiving FDI,
and the amount received by any particular country. The remaining control variables have
somewhat different impacts, depending on the sample and specification. For the most part, the
proximity variable is positive and statistically significant. Other things equal, both Canada and
Mexico receive additional US FDI, likely the combined result of location and NAFTA
membership. Since Canada and Mexico are not included in the sample of developing and
transition economies, there is no proximity term for that sample.
Countries with fixed exchange rates attract more total FDI, but only if their exchange rate
is pegged to the U.S. dollar. This holds for all countries, but not necessarily for all forms of FDI.
Specifically, we find some evidence that this variable is statistically significant for high-tech FDI
(column 8), but not for all specifications (Columns 9 and 10). The exchange rate term is rarely
statistically significant. When it is, the sign of the coefficient is negative. The exchange rate
variable is consistently insignificant for the high-tech industries. In general, exchange rate
regimes and exchange rate changes seem to have little effect on high-tech FDI. This result might
reflect the possession of market power on the part of high-tech MNCs that, in turn, enables the
latter to pass through to customers most, or all, of the explicit and implicit costs of exchange rate
hedging. For other industries in which sellers do not enjoy such market power, a stable foreign
currency is an important incentive, at the margin, to invest abroad.
Decomposing Indices
In this section we investigate the possibility that specific elements of the GII index may
be more influential than the over-all index that we have used as a summary measure in Table 4.
The disaggregated results are found in Table 5. Rather than present all of the estimated
coefficients for each specification, we present only the estimated coefficient for the relevant
component of GII or the legal system. In order to minimize problems of multicollinearity, as
well as to conserve space, we present estimates obtained from a specification that did not include
21

HDI or the legal systems variables. Thus, the estimates reported are obtained from the
estimation of an equation that includes the reported variables plus a constant, Ln GDP, the
proximity variable, and the two exchange rate terms. For completeness, we also estimate these
equations using only the legal systems variables as governance measures.
To facilitate comparisons, we also present the results for GII itself. The results confirm
that this broad measure of governance is always positive and statistically significant in any
sample, and the coefficient is remarkably stable. It can be seen, however, that while all
components of GII are themselves statistically significant, their magnitude and explanatory
power (as measured by the R2) are not. In particular, the most important of the sub-indices, as
judged by both the magnitude of the coefficients and the predictive power of the equation, is
government effectiveness and regulatory burden, and this is true of all samples. The latter term
is the most important, with predictive power exceeding that of GII, and with a coefficient that is
larger than those for all the other governance measures.
Thus, countries that adopt policies favoring free and open markets will receive more U.S.
FDI, and this result seems robust across samples. This conclusion is confirmed by the results
obtained using the Index of Economic Freedom as a measure of governance. However, it is also
true that other governance factors are important, although possibly not to the same degree. In
particular, good governance also implies maintaining effective government institutions, and this
is important for all samples.
Most of the KKZL coefficients, as well as the Index of Economic Freedom coefficient,
are slightly lower for the sample of developing and transition economies than for the All
Countries sample. However, developing and transitional economies arguably have greater scope
for improving governance, since the governance indices for those economies are substantially
lower than those for developed countries. A movement towards average governance for
developed countries should therefore encourage a substantial increase in inward FDI flows.
The results in Table 5 also tend to confirm the importance of English Common Law
origins in attracting FDI when the University of Ottawa classification method is employed.
However, the results are more ambiguous when the La Porta method is used. In the latter case,
countries whose legal systems originate in the English Common Law receive more FDI than do
countries with socialist legal origins, but they do not necessarily receive more than civil law
countries.
22

In summary, our results point in a consistent direction. Specifically, they confirm the
well-established fact that the size of a national economy strongly conditions how attractive that
location is to foreign investors. They also strongly support the notion that governance
infrastructure is an important direct determinant of whether a country will receive any U.S. FDI,
and, if so, how much. An inference suggested by our results is that countries wishing to receive
FDI, most of which are small and developing, should consider improvements in political
governance. Of the governance indicators considered, regulatory burden and government
effectiveness are the most important. While legal systems are less amenable to change, our
results also suggest that countries whose legal systems are based on English Common Law are
likely to have an advantage in attracting FDI.
Summary and Policy Conclusions
This study assesses whether and to what extent governance infrastructure attributes of
national economies influence U.S. FDI flows into those economies. Governance infrastructure is
measured in terms of the nature of political, economic and legal institutions and policies. The
measures of governance infrastructure that are employed have not previously been used in the
FDI literature, and cover a variety of factors such as government effectiveness, freedom of
markets, political freedom and the nature of the legal system.
Our analysis uses a two-stage estimation procedure. In the first stage, the probability that
a country is an FDI recipient is estimated. The results indicate that countries that fail to achieve
a minimum threshold of effective governance are unlikely to receive any U.S. FDI. In the
second stage, the analysis is restricted to those countries that did receive FDI flows. The
estimated equations focus on the determinants of the amount of FDI received, with a correction
for possible sample selection bias. The results indicate that governance infrastructure also plays
a critical role in the determination of the volume of U.S. FDI flows across countries. In addition,
no evidence of sample selection bias was found.
We find differences in results across different samples of countries, as well as different
policy implications. For example, improvements in governance are likely to be more important
for developing and transition economies than for all countries, on average. Developing
economies are the least likely to receive any positive FDI, and improvements in governance that
put those countries over the minimum threshold will encourage positive FDI flows. In addition,
23

although we found that the marginal benefits (in terms of increased FDI inflows) of governance
improvements for developing and transition economies that do receive FDI are lower than for all
countries, the total benefits are likely to be greater, because the scope for governance
improvement is commensurately greater.
We also find evidence that countries whose legal systems originate in English Common
Law attract more U.S. FDI, other things equal. However, the strength of this result depends on
the method of classifying legal systems. Since the evidence suggests that neither of the existing
classification methods used in this study is perfect, further research is required into the
appropriate classification method. In particular, subsequent research must address the problem
of how to classify the legal systems of formerly socialist countries. Classification
notwithstanding, it is clear that formerly socialist countries received less FDI, other things equal.
It is doubtful that this can be fully explained as a result of their legal system.
In addition, our results suggest that previous studies have, to some degree, confused
issues of culture with issues arising from the nature of the legal system. Many, if not most,
countries that have adopted English Common Law are also English speaking. Studies that use
language as a measure of cultural proximity may therefore be capturing characteristics of the
common law system that protect property rights and attract investment.
There is some evidence that FDI flows in high-technology industries respond to
somewhat different determinants than is the case for all industries. The differences are
particularly marked in the first stage, where both governance and wealth and human capital are
found to be important. The probability that a country will be the recipient of high-tech FDI
increases with its investments in human capital and with higher GDP per capita, while this is not
so for all FDI. In the second stage, the amount of high-tech FDI received is more closely linked
to investments in human capital (education) than is the case for the total sample of industries.
The results also shed some light on the specific governance factors that are likely to
attract U.S. FDI. Reliable estimation of the regression coefficients for individual governance
measures is hampered by collinearity among many of the measures. Nevertheless, relatively
robust findings are identified for specific governance infrastructure attributes. In this regard,
good political governance is characterized by policies promoting open markets, as well as by
effective and non-corrupt public institutions. Countries that improve their governance
24

infrastructures in these respects are not only likely to increase the probability that they will
receive U.S. FDI, but they will also receive greater absolute amounts.
Hence, one of our most important conclusions is that political governance contributes in
a very important way to attracting inward FDI from the United States. Furthermore, improved
governance does not necessarily oblige governments to make large investments of taxpayers’
money. In this regard, our findings reinforce similar conclusions drawn in UNCTAD (1998) and
Altomonte (2000). Indeed, improved governance might be more consistent, in many cases, with
a smaller economic and regulatory role for government. As well, any set of policies that broadly
promotes economic growth will indirectly promote increased inward FDI by encouraging a
higher level of real GDP. However, it is also the case that countries whose legal systems are not
rooted in English Common Law will find it relatively more difficult to attract U.S. FDI, other
things equal. Because changing the legal system is both difficult and expensive, such countries
will have to compensate by improving other aspects of their governance infrastructure.
Although our study focuses on the role of governance, we obtain other results of interest.
For the most part, these results are consistent with those obtained in earlier studies. For
example, we find that market size is statistically the most important predictor of whether a
country will receive FDI and, if so, the amount. We also find that investments in human capital
and the general quality of life are likely to attract more FDI, although these relationships may
also be linked to good governance. In particular, countries that meet minimum governance
standards tend to be countries with higher levels of wealth, health and education. Whatever the
indirect linkage to governance, our results clearly identify an educated work force as an
important determinant of U.S. FDI in high-tech industries.
Another of our findings is that fixed exchange rate regimes attract greater FDI flows.
This result is indirectly consistent with other studies that find that currency stability promotes
inward FDI flows. In our case, it is fixity to the U.S. dollar that matters which is unsurprising
given our focus on FDI flows originating from the United States. The weaker relationship
between exchange rate regime and U.S. high-tech FDI might reflect the previously mentioned
supposition that sellers of high-tech products face relatively inelastic demands curves, and
therefore have less difficulty passing on the relevant costs associated with hedging foreign
exchange risk. Exploration of this and other possible explanations is a focus of future research.
We also find that currency appreciations or depreciations are not consistently related to inward
25

FDI flows in a statistically significant manner. This latter result is theoretically unsurprising, and
it is consistent with evidence from other studies (Safarian and Hejazi, 2001).
Available data dictated that we focus on the nation-state as the unit of analysis. However,
regions are increasingly emerging as clusters for specific types of foreign investment, and those
clusters frequently cut across political boundaries. Our findings therefore highlight the potential
importance of regional trade and investment agreements that harmonize attributes of governance
infrastructure across political jurisdictions. Additional research focusing on the relationship
between governance infrastructure and related variables and FDI originating in other developed
countries would shed further light on the importance of political reform as an instrument of
economic growth in developing countries.
For international managers, our findings highlight the importance of understanding the
political processes that lead to changes in governance infrastructure. Such changes clearly affect
the ability of foreign-owned firms to do business profitably in host economies. Yet the
determinants of such changes are not obvious.26 Perhaps political risk analysis in multinational
companies would be better focused on political and social initiatives affecting the likelihood of
governance reforms than on the likelihood of changes in government. In addition, managers
should consider more carefully the importance of the legal system in protecting shareholder
rights and property rights.
26

References
Altomonte, C. 2000. Economic Determinants and Institutional Frameworks: FDI in Economies in Transition. Transnational Corporations, Vol. 9(2):75-106.
Barrell, R. & N. Pain. 1997. Foreign Direct Investment, Technological Change and Economic Growth Within Europe. The Economic Journal, Vol. 107: 1770-1786.
Bevan, A., & S. Estrin. 2000. The Determinants of Foreign Direct Investment in Transition Economies. Centre for New and Emerging Markets, Discussion Paper Number 9, London Business School.
Blomstrom, M., A. Kokko, & S. Globerman. 2001. The Determinants of Host Country Spillovers from Foreign Direct Investment: A Review and Synthesis of the Literature, in N. Pain, ed., Inward Investment, Technological Change and Growth, London: NIESR: 34-65.
Brewer, T.L. 1983. The Instability of Governments and the Instability of Controls on Funds Transfers By Multinational Enterprises: Implications for Political Risk Analysis. Journal of International Business Studies, Winter147-157.
Brewer, T.L. 1993. Government Policies, Market Imperfections and Foreign Direct Investment. Journal of International Business Studies, First Quarter: 101- 120.
Brunetti, A. 1997. Political Variables in Cross-Country Growth Analysis. Journal of Economic Surveys, Vo. 11(2): 163-190.
Caves, R.E. 1996. Multinational Enterprise and Economic Analysis, Cambridge: Cambridge University Press.
Chen, D. 2000. The Marginal Effective Tax Rate: The Only Tax Rate that Matters in Capital Allocation. C.D. Howe Institute Backgrounder, August: 1.
Cheng, L.K. & Y.K. Kwan. 2000. What are The Determinants of the Location of Foreign Direct Investment? The Chinese Experience. Journal of International Economics, August: 379-400.
Djankov, S., R. LaPorta, F. Lopez-de-Silanes & A. Shleifer. 2002. Courts: The Lex Mundi Project. Washington, D.C.: The World Bank, mimeo.
Dunning, J.H. 1993. Multinational Enterprises and the Global Economy, Wokingham, England: Addison-Wesley Publishing Company.
Froot, K.A. & J.C. Stein. 1991. Exchange Rates and Foreign Direct Investment: An Imperfect Capital Markets Approach. Quarterly Journal of Economics.
Globerman, S. & D. Shapiro. 1999. The Impact of Government Policies on Foreign Direct Investment: The Canadian Experience. Journal of International Business Studies, Vol. 30(3): 513-532.
Globerman, S. & D. Shapiro. 2001. National Infrastructure and Foreign Direct Investment. Ottawa: Industry Canada, mimeo.
Goldberg, L.G. & R. Grosse. 1994. Location Choice of Foreign Banks in the United States. Journal of Economics and Business, Vol. 46(5): 513-533.
Gray, H.P. & J.H. Dunning. 2000. .Towards a Theory of Regional Policy. in J.H. Dunning, ed., Regions, Globalization and the Knowledge-Based Economy, Oxford: Oxford University Press: 409-434.
Greene, W. H. 1993. Econometric Analysis, second edition, New York: Macmillan.
Grosse, R. & L.G. Goldberg. 1991. Foreign Bank Activity in the United States: An Analysis by Country of Origin. Journal of Banking and Finance, Vol. 15: 1093-1112.
27

Hall, R. & C.I. Jones. 1999. Why Do Some Countries Produce so Much More Output Per Worker than Others. Quarterly Journal of Economics, 114 (1): 83-86.
Heckman, J. 1979. Sample Selection Bias as a Specification Error. Econometrica, Vol. 47: 153-161.
Kaufmann, D., A. Kraay & P. Zoido-Lobaton. 1999a. Aggregating Governance Indicators. World Bank Working Paper #2195.
Kaufmann, D., A. Kraay & P. Zoido-Lobaton. 1999b. Governance Matters. World Bank Working Paper #2196.
Keefer, P. & S. Knack. 1997. Why Don’t Poor Countries Catch Up? A Cross-National Test of an Institutional Explanation. Economic Inquiry, Vol.XXXV, July: 590-602.
Knack, S. & P. Keefer. 1995. Institutions and Economic Performance: Cross-Country Tests Using Alternative Institutional Measures. Economics and Politics 7 November: 207-227.
Knack, S. & P. Keefer. 1997. Does Social Capital Have an Economic Payoff? Quarterly Journal of Economics 112(4): 1251-1288.
Kogut, B. & S.J. Chang. 1996. Platform Investments and Volatile Exchange Rates: Direct Investment in the U.S. by Japanese Companies. Review of Economics and Statistics, Vol. 78(2):221-231.
Krugman, P. 1991. Geography and Trade, Leuven, Belgium: Leuven University Press.
LaPorta, R., F. Lopez-de-Silanes, A. Shleifer & R. Vishny. 1998a. Legal Determinants of External Finance. Journal of Political Economy, Vol. 106:1113-1155.
LaPorta, R., F. Lopez-de-Sialnes, A. Shleifer & R. Vishny. 1998b. The Quality of Government. NBER Working Paper 6727, Cambridge, Mass.: National Bureau of Economic Research, mimeo.
LaPorta, R., F. Lopez-de-Silanes, A. Shleifer & R. Vishny. 1999. Investor Protection and Corporate Valuation. NBER Working Paper 7403, Cambridge, Mass.: NBER, mimeo.
LaPorta, R., F. Lopez-de-Silanes, A. Shleifer & R. Vishny. 2001. Investor Protection and Corporate Governance. Cambridge, Mass.: Harvard University, mimeo.
Levine, R. 1998. The Legal Environment, Banks and Long-Run Economic Growth. Journal of Money, Credit and Banking, Vol. 30: 596-613.
List, J.A. 2001. US County-Level Determinants of Inbound FDI: Evidence from a Two-Step Modified Count Data Model. International Journal of Industrial Organization 19: 953-973.
Loree, D.W. & S. Guisinger. 1995. Policy and Non-Policy Determinants of U.S. Equity Foreign Direct Investment. Journal of International Business Studies, Second Quarter: 281-299.
Mauro, P. 1995. Corruption and Growth. Quarterly Journal of Economics, Vol. 110(3): 681-712.
Mody, A. & K. Srinivasan. 1998. Japanese and U.S. Firms as Foreign Investors: Do They March to the Same Tune. Canadian Journal of Economics, Vol. 31(4): 778-800.
Morisset, J. 2000. FDI in Africa: Policies Also Matter. Transnational Corporations, Vol. 9(2): 107-126.
OECD 2001. The Well-Being of Nations: The Role of Human and Social Capital, Paris: OECD.
Papell, D.H. 2001. The Great Appreciation, the Great Depreciation and the Purchasing Power Parity Hypothesis. Houston: University of Houston, mimeo.
Peterson, M., N.K. Malhota & J. Wagner. 1999. .Country Quality of Life and Foreign Direct Investment Decisions. Global Outlook, Vol. 11(1): 51-62.
28

Safarian, A.E & W. Hejazi. 2001. Canada and Foreign Direct Investment: A Study of Determinants. Toronto: University of Toronto Press, mimeo.
Slater, Courtney, ed. 1999. Foreign Trade of the United States, First edition, Washington, D.C.: Bernan Press.
Smarzynska, B.K. & S.J. Wei. 2001. .Pollution Havens and Foreign Direct Investment: Dirty Secret of Popular Myth. NBER Working Paper, W8465, Cambridge, Mass.: NBER, mimeo.
Stevens, G.V.G. 2000. Politics, Economics and Investment: Explaining Plants and Equipment Spending by U.S. Direct Investors in Argentina, Brazil and Mexico. Journal of International Money and Finance, Vol. 19(2): 115-135.
Thomsen, S. 2000. Investment Patterns in a Longer-Term Perspective. Organization for Economic Co-operation and Development, Working Paper on International Investment Number 2000/2, mimeo.
Tuman, J. & C. Emmert. 1999. Explaining Japanese Foreign Direct Investment in Latin America, 1979-1992. Social Science Quarterly, Vol. 80(3):539-555.
Verbeek, M. 2000. A Guide to Modern Econometrics, New York: John Wiley and Sons.
United Nations Conference on Trade and Development (UNCTAD). 1998. World Investment Report 1998: Trends and Determinants, New York and Geneva: United Nations.
Wei, S.J. 2000. How Taxing Is Corruption on International Investors? Review of Economics and Statistics, Vol. 82(1): 1-11.
Wheeler, D. 2001. Racing to the Bottom? Foreign Investment and Air Pollution in Developing Countries. World Bank Working Paper, Washington, D.C.: World Bank, mimeo.
Wheeler, D. & A. Mody. 1992. International Investment Locational Decisions-The Case of U.S. Firms. Journal of International Economics, Vol. 33: 57-76.
Zhang, K.H. 2001. What Explains the Boom of Foreign Direct Investment in China?. Economia Internazionale, Vol. 54(2):251-274.
Zhao, H. & G. Zhu. 2000. Location Factors and Country-of-Origin Differences: An Empirical Analysis of FDI in China. Multinational Business Review, Spring: 60-73.
29
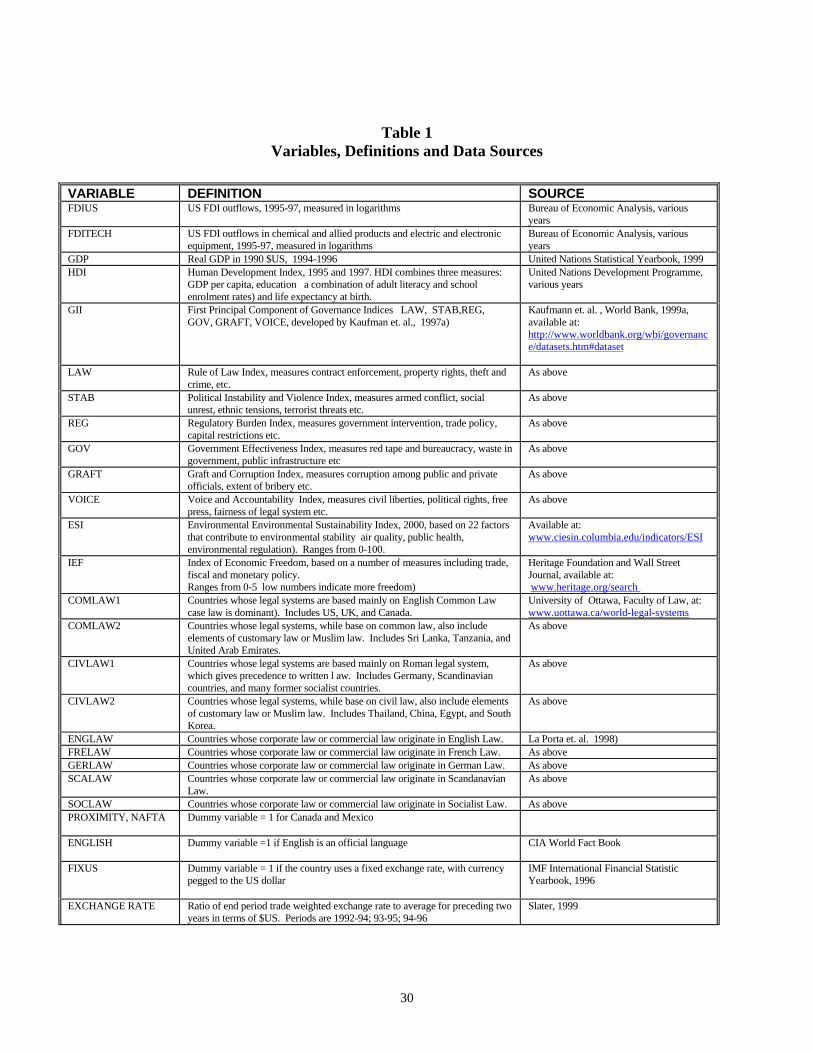
Table 1 Variables, Definitions and Data Sources
VARIABLE DEFINITION SOURCE FDIUS US FDI outflows, 1995-97, measured in logarithms Bureau of Economic Analysis, various
years FDITECH US FDI outflows in chemical and allied products and electric and electronic
equipment, 1995-97, measured in logarithms Bureau of Economic Analysis, various years
GDP Real GDP in 1990 $US, 1994-1996 United Nations Statistical Yearbook, 1999 HDI Human Development Index, 1995 and 1997. HDI combines three measures:
GDP per capita, education a combination of adult literacy and school enrolment rates) and life expectancy at birth.
United Nations Development Programme, various years
GII First Principal Component of Governance Indices LAW, STAB,REG, GOV, GRAFT, VOICE, developed by Kaufman et. al., 1997a)
Kaufmann et. al. , World Bank, 1999a, available at: http://www.worldbank.org/wbi/governance/datasets.htm#dataset
LAW Rule of Law Index, measures contract enforcement, property rights, theft and crime, etc.
As above
STAB Political Instability and Violence Index, measures armed conflict, social unrest, ethnic tensions, terrorist threats etc.
As above
REG Regulatory Burden Index, measures government intervention, trade policy, capital restrictions etc.
As above
GOV Government Effectiveness Index, measures red tape and bureaucracy, waste in government, public infrastructure etc
As above
GRAFT Graft and Corruption Index, measures corruption among public and private officials, extent of bribery etc.
As above
VOICE Voice and Accountability Index, measures civil liberties, political rights, free press, fairness of legal system etc.
As above
ESI Environmental Environmental Sustainability Index, 2000, based on 22 factors that contribute to environmental stability air quality, public health, environmental regulation). Ranges from 0-100.
Available at: www.ciesin.columbia.edu/indicators/ESI
IEF Index of Economic Freedom, based on a number of measures including trade, fiscal and monetary policy. Ranges from 0-5 low numbers indicate more freedom)
Heritage Foundation and Wall Street Journal, available at: www.heritage.org/search
COMLAW1 Countries whose legal systems are based mainly on English Common Law case law is dominant). Includes US, UK, and Canada.
University of Ottawa, Faculty of Law, at: www.uottawa.ca/world-legal-systems
COMLAW2 Countries whose legal systems, while base on common law, also include elements of customary law or Muslim law. Includes Sri Lanka, Tanzania, and United Arab Emirates.
As above
CIVLAW1 Countries whose legal systems are based mainly on Roman legal system, which gives precedence to written l aw. Includes Germany, Scandinavian countries, and many former socialist countries.
As above
CIVLAW2 Countries whose legal systems, while base on civil law, also include elements of customary law or Muslim law. Includes Thailand, China, Egypt, and South Korea.
As above
ENGLAW Countries whose corporate law or commercial law originate in English Law. La Porta et. al. 1998) FRELAW Countries whose corporate law or commercial law originate in French Law. As above GERLAW Countries whose corporate law or commercial law originate in German Law. As above SCALAW Countries whose corporate law or commercial law originate in Scandanavian
Law. As above
SOCLAW Countries whose corporate law or commercial law originate in Socialist Law. As above PROXIMITY, NAFTA
Dummy variable = 1 for Canada and Mexico
ENGLISH
Dummy variable =1 if English is an official language CIA World Fact Book
FIXUS Dummy variable = 1 if the country uses a fixed exchange rate, with currency pegged to the US dollar
IMF International Financial Statistic Yearbook, 1996
EXCHANGE RATE Ratio of end period trade weighted exchange rate to average for preceding two years in terms of $US. Periods are 1992-94; 93-95; 94-96
Slater, 1999
30

Table 2
Correlation Matrix: Governance Infrastructure and Other Measures N=404
MEAN
(SD) HDI GDP VOICE STAB GOV REG LAW GRAFT GII COM
LAW1 COM LAW2
CIV LAW1
CIV LAW2
ENG LAW
FRE LAW
GER LAW
SCA LAW
SOC LAW
HDI .68 (.20)
1.00
GDP 9.87 (1.94)
.55 1.00
VOICE
.13 (.89)
.60 .34 1.00
STAB
-.02 (.92)
.62 .37 .70 1.00
GOV .03 (.85)
.63 .43 .74 .80 1.00
REG .13 (.76)
.49 .27 .70 .69 .73 1.00
LAW .06 (.90)
.67 .44 .70 .88 .89 .71 1.00
GRAFT .04 (.89)
.65 .43 .74 .76 .92 .65 .88 1.00
GII .05 (.98)
.68 .43 .85 .90 .95 .83 .94 .92 1.00
COM LAW1
.08 (.27)
.27 .07 .24 .24 .36 .29 .28 .39 .34 1.00
COM LAW2
.26 (.44)
-.27 -.19 -.13 -.11 -.15 -.05 -.04 -.11 -.12 -.16 1.00
CIV LAW1
.43 (.49)
.38 .22 .33 .22 .16 .20 .12 .14 .21 -.25 -.51 1.00
CIV LAW2
.23 (.43)
-.33 -.10 -.34 -.29 -.26 -.37 -.27 -.29 -.35 -.16 -.33 -.48 1.00
ENG LAW
.27 (.45)
-.07 -.13 .01 .05 .08 .15 .14 .19 .11 .44 .68 -.57 -.32 1.00
FRE LAW
.44 (.49)
-.20 -.06 -.21 -.30 -.21 -.12 -.32 -.32 -.28 -.25 -.31 .05 .42 -.56 1.00
GER LAW
.05 (.21)
.25 .39 .31 .29 .33 .18 .36 .32 .33 -.07 -.13 .16 .05 -.14 -.20 1.00
SCA LAW
.04 (.18)
.23 .13 .32 .30 .36 .20 .34 .42 .36 -.06 -.11 .14 -.11 -.12 -.17 -.04 1.00
SOC LAW
.18 (.39)
.08 -.04 -.05 .03 -.18 -.22 -.12 -.18 -.13 -.14 -.30 .34 -.12 -.30 -.43 -.11 -.09 1.00
IEF 3.12 (.76)
.57 .33 .64 .60 .75 .79 .72 .69 .77 .38 -.02 .08 -.31 .22 -.23 .31 .21 -.24
Notes: Variables are defined in Table 1.
31

Table 3
Probit Estimates of Governance Coefficients1
(1)
All Countries (2)
Developing and Transition Economies
(3) All Countries,
High Tech Industries Coefficient
(standard error)
%
Log
Likelihood
Coefficient (standard
error)
%
Log
Likelihood
Coefficient (standard
error)
%
Log
LikelihoodRule of law .05
(.08) .67 -253.6 .03
(.10) .63 -219.0 .16*
(.08) .82 -164.3
Voice and accountability
.17*** (.07)
.68 -251.4 .24*** (.09)
.61 -215.8 .26*** (.08)
.83 -161.3
Political instability/violence
.05 (.08)
.67 -.253.6 .03 (.08)
.61 -218.9 .13 (.09)
.80 -164.9
Government effectiveness
.24*** (.08)
.67 -249.9 .33*** (.11)
.65 -214.9 .38*** (.09)
.83 -157.8
Regulatory burden
.48*** (.09)
.73 -239.1 .50*** (.10)
.69 -205.9 .93*** (.16)
.84 -143.2
Graft
.22*** (.08)
.68 -250.3 .33*** (.12)
.61 -215.3 .26*** (.09)
.84 -161.7
GII2
.20*** (.07)
.68 -250.1 .26*** (.09)
.61 -215.2 .29*** (.08)
.82 -159.6
Index of Economic Freedom (IEF)
.21*** (.10)
.70 -241.8 .27*** (.11)
.65 -196.7 .61*** (.12)
.84 -148.3
Pure Common Law3
Mixed Common Law Pure Civil Law
.87*** (.33) .20
(.18) -.07 (.16)
.70 -.245.8 .62* (.39) .13
(.18) -.20 (.18)
.65 -213.5 1.84*** (.36)
1.03*** (.30)
.85*** (.27)
.83 -151.0
English Law4
French Law German Law Scandanavian Law
1.40*** (.21)
1.22*** (.19) -.06 (.39) .69* (.42)
.74 -230.0 1.17*** (.21)
1.13*** (.19)
.71 197.6 2.05*** (.40)
1.77*** (.39)
1.40*** (.49)
1.27*** (.50)
.84 -142.4
Human Development Index
.33 (.38)
.67 -253.4 .27 (.40)
.63 -218.8 2.04*** (.57)
.82 -159.23
No. observations (no. positive)
404 (223)
320 (152)
404 (108)
Notes: 1. The dependent variable equals 1 if the US invests in that country (industry) and 0 otherwise. Figures in parentheses are standard
errors computed from analytic second derivatives (Newton). % refers to correct predictions. Each equation contains unreported constant and LnGDP terms. Each is statistically significant in all equations.
2. GII is the first principal component of the voice, regulation, rule of law, graft, government effectiveness and political instability terms.
3. Categories are defined by the University of Ottawa Law School. The omitted category is Mixed Civil Law. 4. Categories are derived from LaPorta et. al. (1999). Omitted category is Socialist Law. *** p < .001, ** p < .05, *p < .01, two-tailed tests.
32

Table 4
Regression Results, US FDI1
All Countries
Developing and Transition Economies
High Tech Industries
(1) (2) (3) (4) (5) (6) (7) (8)2
(9)2 (10)3
Ln GDP
.67*** (.07)
.64*** (.06)
.67*** (.07)
.63*** (.07)
.70*** (.09)
.73*** (.10)
.68*** (.10)
.70*** (.10)
.49*** (.09)
.49*** (.09)
Governance Infrastructure Index (GII)
.42*** (.14)
.13 (.16)
.53*** (.12)
.36** (.12)
.59*** (.21)
.60*** (.18)
.15 (.24)
.54** (.25)
.55** (.23)
.55** (.23)
Pure Common Law
1.16*** (.30)
1.16*** (.32)
.91** (.41)
2.07*** (.46)
Mixed Common Law
-.17 (.22)
.10 (.22)
-.28 (.25)
.46 (1.08)
English Law
.83** (.35)
.98*** (.35)
.83* (.47)
1.14*** (.47)
-1.19*** (.40)
3.68*** (.78)
French Law .95*** (.38)
.97*** (.38)
1.42*** (.49)
1.47*** (.48)
-1.80*** (.38)
3.07*** (.82)
German Law
.64 (.46)
.83* (.47)
-1.99*** (.48)
2.88*** (.81)
Scandanavian Law
-1.00 (.67)
-.75 (.59)
-4.87*** (.86)
Proximity 1.39*** (.45)
1.32*** (.42)
1.56*** (.32)
1.43*** (.31)
.77 (.65)
1.27** (.59)
1.27** (.59)
Fixed Exchange-US
1.58*** (.36)
1.52*** (.33)
1.69*** (.29)
1.61*** (.29)
2.02*** (.33)
1.75*** (.34)
1.67*** (.31)
.96*** (.33)
-.33 (.35)
-.33 (.35)
Exchange Rate Change4
-.49*** (.14)
-.43 (.28)
.04 (.30)
.04 (.31)
-.35* (.19)
.04 (.25)
.01 (.38)
.05 (.06)
.06 (.04)
.06 (.04)
Human Development Index (HDI)
2.83*** (.74)
2.95*** (.74)
3.14*** (.80)
Education Index
3.25* (1.75)
3.73** (1.59)
3.73** (1.59)
Constant
-2.48*** (.68)
-4.18*** (.79)
-3.12*** (.89)
-4.88*** (.98)
-2.67*** (.86)
-4.02*** (1.22)
-5.87*** (1.30)
-7.17** (1.60)
-3.56** (1.61)
-8.43*** (1.60)
R2 .58 .60 .59 .61 .37 .41 .46 .42 .47 .45
n 223 223 223 223 152 152 152 108 108 105
1. Dependent variable is Ln FDI. Estimation is by ordinary least squares. Figures in parentheses are heteroscedastic-
consistent (White) standard errors. 2. All countries that receive US FDI in chemicals and electronics included. 3. Excludes China. 4. The coefficient for Exchange Rate Change has been multiplied by 1000.
*** p < .001, ** p < .05, *p < .01, two-tailed test.
33

Table 5
Regression Coefficients, GII Sub-Indices and Legal Variables
(1) All Countries
(2) Developing and
Transition
(3) High Technology
Coefficient (standard
error)
R2
Coefficient (standard
error)
R2
Coefficient (standard
error)
R2
GII .60*** (.12)
.56 .59*** (.20)
.36 .61*** (.18)
.33
Rule of law
.57*** (.13)
.54 .43*** (.19)
.34 .51*** (.19)
.31
Voice and accountability
.43*** (.12)
.52 .31* (.18)
.33 .43** (.21)
.29
Political instability/violence
.50*** (.13)
.53 .33* (.20)
.33 .42** (.21)
.29
Government effectiveness
.73*** (.13)
.57 .73*** (.21)
.37 .76*** (.19)
.35
Regulatory burden
1.03*** (.20)
.58 .89*** (.22)
.40 1.69*** (.33)
.38
Graft
.52*** (.13)
.54 .43* (.25)
.34 .58*** (.18)
.33
Index of Economic Freedom
1.02*** (.16)
.60 .92*** (.21)
.42 .82*** (.28)
.33
Pure Common Law Mixed Common Law
1.63*** (.26)
-.26 (.23)
.55 .96*** (.42)
-.17 (.26)
.33 2.16*** (.35) .18
(.44)
.41
English Law French Law German Law Scandanavian Law
1.05*** (.37)
1.01*** (.36)
1.54*** (.54) .30
(.51)
.52 .96*** (.42)
1.46*** (.43)
.38 2.54*** (.79)
1.83*** (.76)
2.27*** (.82)
.33
n 223 152 105
For all samples, the coefficient estimates were obtained from OLSQ estimates of a model that included log GDP, a proximity dummy variable (not included in the sample of developing and emerging countries), a dummy variable if the country had a fixed exchange rate in terms of the US dollar, and a variable for the change in the exchange rate. The high technology sample excludes China. Figures in parentheses are heteroscedastic-consistent (White) standard errors. *** p < .001, ** p < .05, *p < .01, two-tailed tests. ,
34

Notes
1 For a broader survey of the literature see Brunetti (1997). 2 Dunning (1993) offers an extensive review of empirical studies of the determinants of FDI. Globerman and Shapiro (1999) provide an updated literature review with particular emphasis on the influence of government policies. 3 The University of Ottawa data are available at: www.uottawa.ca/world-legal-systems.4 Several of these factors are discussed in Brewer (1993) as aspects of government policies to address .market failures.. See, also, Gray and Dunning (2000). 5 The relationship among these ideas is discussed in Globerman and Shapiro (2001). 6 The complete list of sources is provided in Kaufmann et. al. (1999a). 7 Differences between the KKZL Rule of Law measure, and the legal system classification methods are discussed below. 8 Inward FDI can be negative, since the FDI variable measures net inflows. Hence, a negative value indicates net outward FDI. 9 We also estimated the models using averaged data, but this did not alter the basic results. 10 As noted above, we began with the sample of 143 of which 88 received positive US FDI flows over the period 1995-97. The remaining countries either received no FDI, negative FDI, or were recorded as missing values. We classified all of the latter as having no FDI. This particular classification does not affect the results. For example, excluding missing values from the .no FDI. category does alter our conclusions. 11 We estimated second-stage equations in which the dependent variable was specified as the proportion of total global FDI received by any country (PFDI), or the logistic transformation of PFDI. These measures were highly correlated with Ln FDI, suggesting some indifference as to the choice among them. The results are in fact similar, regardless of measure, and so we only present results based on the (natural) logarithmic specification. 12 Dunning (1993) identifies an exhaustive list of such variables and also discusses empirical evidence regarding their importance. For additional summaries of available evidence, see Caves (1996) and Globerman and Shapiro (1999). 13 Some studies identify a near perfect positive correlation between FDI and GDP across host countries. See, for example, Morisset’s (2000) study of African countries. 14 The various sources of agglomeration (or external) economies are discussed in Krugman (1991). 15 A number of studies have confirmed the importance of physical infrastructure as a determinant of FDI. See, for example, Kumar (1996), Zhao and Zhu (2000), Cheng and Kwan (2000), Wheeler and Mody (1992), Mody and Srinivasan (1998) and Loree and Guisinger (1995). In our sample, for example, GDP/capita is highly correlated with telephones/capita (r = .94). 16 Several studies document a negative association between measures of foreign exchange volatility and FDI flows. See, for example, Kogut and Chang (1996) and Barrell and Pain (1997). 17 Altomonte (2000) references several studies that provide ambivalent findings on the relationship between labour costs and the geographical distribution of FDI. 18 In fact, when they are entered jointly in any equation, none of the KKZL variables are statistically significant, whereas many are significant when entered individually. We experimented with various subsets of the sub-indices, but there was no improvement on the reported results. 19 We also attempted to assess the reliability of the KKZL measures by comparing them to the measure of political risk published by Institutional Investor Magazine (IIM). This measure is often used in the FDI literature (Keefer and Knack, 1997; Mody and Srinivasan, 1998; Bevan and Estrin, 2000), but was not available for our full sample. The correlation coefficient between the IIM risk variable and GII is r=.87, and similar values were obtained for the KKZL sub-measures. 20 Causality may also be an issue in that HDI may be seen as a development outcome, caused by GII. Evidence to this effect is found in Kaufman et.al. (1999b). However, in the context of an FDI equation, each is likely to exert a separate effect. 21 Country-specific fixed effects were not included because many important variables (notably the KKZL measures and the legal system variables) are time invariant and therefore capture permanent differences across countries. 22 Note that there are no countries in the sample of developing and transition economies whose legal systems are German or Scandinavian in origin.
35

23 In Table 4, the Mills Ratio was derived from first stage probit equations containing a constant, ln GDP and GII. In Table 5, the Mills Ratio was obtained from probit equations containing a constant, ln GDP and the relevant governance variable. The use of other specifications does not alter the results in any way. 24 We have not included a separate term for pure civil law because it was never statistically significant. Thus, in the equations using the University of Ottawa definition of the legal system, the omitted category is all civil law countries. 25 Note that China was the only country receiving high-tech FDI in this period that was classified as having a socialist legal system. When it is excluded, the omitted category became Scandanavian law countries. 26 For example, Brewer (1983) suggests that policy instability is not closely linked to political instability.
36