Embed Size (px)
Citation preview

s
SOCIAL ECONOMIC IMPACT and
RETURN ON FUNDING INVESTMENT ANALYSIS For the Year 2018
Section Page
What is Social Return on Investment? 1
Oregon’s Civil Legal Aid Social Economic Impact 5 and Return on Funding Investment Value Summary
SROI Methodology and Valuation Process 18
2018 SROI Impact Map 22
Draft Opinion Letter 54
Note: The Valuation Schedules for the Impact Map are contained in the accompanying separate volume.
WHAT IS SOCIAL ECONOMIC IMPACT and SOCIAL RETURN ON INVESTMENT?
In normal financial analysis, Return on Investment is the ratio of money gained or lost relative to the money invested. In social service organizations, Social Return on Investment measures the financial value created by the organization through delivery of services to the community.
Social Return on Investment (SROI) is an approach to measuring and understanding the financial impact of a social services organization. While SROI is built on the logic of cost/benefit analysis, it is different in that it measures the comparable value of organizations whose results cannot be easily measured in money. In the same way that a business plan contains more information than simply financial projections, SROI provides information about actual and long- term results of services, and the qualitative, quantitative, and financial information on which to base decisions about the delivery of social services by organizations.
There are two types of SROI analysis:
• Evaluative analysis - which is based on actual outputs and outcomes that have already taken place or are currently in process;
• Forecast analysis - which predicts the values created when the activities meet their intended results.
An SROI analysis can take many different forms. It can encompass the social value generated by an entire organization or focus on just one specific aspect of the organization’s work.
SROI analysis has been developing since the 1960’s. The SROI process has become more fully developed during the last decade, primarily based on a detailed multi-year study conducted by The SROI Network, The New Economics Foundation, New Philanthropy Capital, the National Council on Voluntary Organization, and the Government of Scotland.
Page 1

There are two separate phases of SROI:
Phase 1 is the measurement of the value delivered to the community by the services currently being delivered by the organization (the “Outputs”). The most accurate and understandable measurement basis for these outputs is the Fair Market Value of the services being delivered - what it would cost the community to acquire the same services that a social service provider delivers if that provider did not exist - plus the value of benefits received during the immediate period under study. This result is a measurement of the comparative efficiency of the organization in delivering or providing the services.
Phase 2 is the measurement of the long-term value of the results of these output services delivered - known as the “Outcomes”. These measurements may take years to realize. For example, people with disabilities who receive training on independent living skills and how to more fully integrate within the community require significantly less financial support from the community over the course of their lives.
By way of another example, people who receive assistance in finding and retaining employment require less future financial support from their communities, plus their future demands on the law enforcement and legal systems are less, their future needs for community-based medical assistance are less, and their future tax payments are greater.
A SROI analysis can fulfill a range of purposes. It can be used as a tool for strategic planning, as a basis for funding and investment decisions, as a basis for communicating impact and financial results to stakeholders, and as a methodology for comparative evaluation of an organization’s long-term effectiveness.
While not the only basis for funding and investment decisions, the SROI results provide the most accurate and comprehensible answer to three of the important questions asked by funding decision makers:
• What are the long-term economic impacts from these services?• What are the financial benefits we receive for our funding?• What is the measurable “bang for the buck”?
Page 2

The History of Social Return on Investment and the
Development of An Internationally Standardized Valuation
Methodology
Social Return on Investment has existed as a conceptual research area for over 60 years.
• The First True Comprehensive Social Economic Impact MeasurementProcess:
• The Government of Scotland – 1990’s. The results:
• Development of a Standardized Methodology:• The establishment of the SROI Network• Release of the initial SROI Methodology paper 2001 • Release of the first SROI Methodology Framework draft 2004 • Release of finalized SROI Methodology Framework 2005
• Measuring Value – 2nd Edition Published 2008 • Updated SROI Methodology Framework 2012 • Consolidation of the SROI Network and
Social Industry Analysts Association into 2014 Social Value International
• Updated SROI Methodology Framework 2017
Currently the SROI International economic impact/social return on investment model is the internationally accepted and accredited standard in over 30 countries including the U.K., Canada, France, Japan, Russia, Australia, Italy, Sweden, South Africa, and many others. Social Value – United States is the U.S. Affiliate of Social Value International.
Page 3

ABOUT COMMUNITY SERVICES ANALYSIS LLC
Community Services Analysis LLC is a leading provider of Social Return on Investment Analysis in the United States. Since 2007, CSACO has completed over 220 Economic Impact and SROI studies for individual organizations, social services membership associations, and local and state governmental agencies around the country, including such clients as the State of Pennsylvania Department of Education, the State of California Department of Rehabilitation, the City of Philadelphia, United Way, United Cerebral Palsy, Habitat for Humanity, the State of Arizona Library and Public Archives, IEEE (the Institute of Electrical and Electronic Engineers) Humanitarian Foundation, the Community Investment Corporation, and multiple Legal Aid organizations nationwide.
Community Services Analysis LLC was the first organization in the United States to be a member of The SROI Network (now Social Value International), the international Social Return on Investment standards and accreditation organization, and has been recognized by many national social services organizations such as ANCOR (the American Network of Community Options and Resources), ACCSES (the American Congress of Community Support and Employment Services), NFSN (the National Family Support Network) , and NLADA (the National Legal Aid and Defenders Association). CSACO is also a founding board member of Social Value – United States and is a member of the American Evaluation Association.
In 2013, following a detailed analysis of multiple Cost Benefit/Return on Investment methodologies and providers, the National Legal Aid and Defenders Association selected CSACO as their exclusive SROI analysis national partner.
In 2018 CSACO was named the national economic impact analysis partner for the National Family Support Network.
Page 4

OREGON’S LEGAL AID ORGANIZATIONS ECONOMIC IMPACT and
SOCIAL RETURN ON FUNDING INVESTMENT
EXECUTIVE SUMMARY for FISCAL YEAR 2018
In normal financial analysis, Return on Investment is the ratio of money gained or lost relative to the money invested. In social service organizations, Social Return on Investment measures both the immediate value and long-term consequential financial values created by the organization through delivery of services to the community.
Social Return on Investment (SROI) is an internationally standardized and accepted process for measuring and understanding the financial impact of a social services organization. While SROI is built on the logic of cost/benefit analysis, it is different in that it measures the comparable value of organizations whose results cannot be easily measured in money.
The organizations providing Civil Legal Aid services in the State of Oregon that participated in this analysis are:
Legal Aid Services of Oregon Legal Aid Services of Oregon (LASO) is a statewide non-profit organization that provides access to legal help for people to protect their livelihoods, their health, and their families.
Legal Aid Services of Oregon's eight regional offices serve the general low-income population, and two specialized statewide programs serve farmworkers and provide representation on Native American issues.
LASO’s offices are located in:
Albany Regional Office Central Oregon Regional Office Klamath Falls Regional Office Lincoln County Office Pendleton Regional Office Portland Regional Office Roseburg Office Salem Regional Office
Page 5
The Native American Program Oregon Law Center Oregon Law Center (OLC) provides legal help to people struggling to make ends meet on matters related to their homes, livelihoods, medical care and physical safety against domestic violence. They provide services through a network of 11 offices plus a statewide hotline telephone service. OLC’s offices are located in: Coos Bay Regional Office Grants Pass Regional Office Hillsboro Regional Office Hillsboro Farmworker Office Lane County Legal Aid Office McMinnville Office Portland Regional Office Ontario Regional Office Salem Regional Office St. Helens Office Woodburn Farmworker Office Center for Non-Profit Legal Services The Center for Non-Profit Legal Services provides civil legal assistance to the low-income and elderly residents of Jackson County. In addition to providing direct services on an individual basis, the organization also works to change unjust laws to low-income people as a group to prevent future legal crisis for those who live in poverty.
Page 6

HIGHLIGHTS OF OREGON’S LEGAL AID PROVIDERS SOCIAL RETURN ON INVESTMENT ANALYSIS RESULTS
($ in thousands) TOTAL NUMBER OF SERVICES PROVIDED IN OREGON DURING FISCAL YEAR 2018 11,433 IMMEDIATE NET DIRECT VALUE OF SERVICES The direct value of Legal Aid services is the fair market replacement cost value of those service (what it would cost the members of the community to replace the services if the Legal Aid organization did not exist, plus the actual dollar amount of legal settlements and court awards. $11,869,000 LONG-TERM NET CONSEQUENTIAL VALUE The long-term impacts of Legal Aid services are the consequential financial impacts to the community resulting from the outcomes of the legal aid services. These consequential benefits include savings in community supports costs, reductions in community medical care expenses, additional community income and taxation revenues from benefit programs, savings in housing and support costs for homeless families, and savings in community law enforcement, court systems, and other government agency costs. $45,825,000 TOTAL NET VALUE OF SERVICES $57,694,000 TOTAL INVESTMENT FUNDING FOR OREGON CIVIL LEGAL AID OPERATIONS DURING 2018 $16,831,000
SOCIAL IMPACT RETURN ON INVESTMENT 343%
For every $1 invested in Oregon Legal Aid during the year, the citizens of Oregon receive $3.43 of immediate and long-term consequential financial benefits.
The Social Return on Investment analysis completed for Oregon’s Legal Aid organizations is a measurement of the values delivered during the fiscal year 2018. These values are based on the number of clients and the types of legal matters handled during this period. The Social Return on Investment value varies between the different Legal Aid organizations based on the number of matters, the types of legal issues, the long-term outcomes achieved in these matters, and the amount of time donated by volunteer lawyers to each organization.
Page 7
The Social Return on Investment for Oregon’s Legal Aid organizations is higher than comparative values for many other types of social service organizations based on two primary factors: Many types of legal services delivered result in significant future cost savings or additional income to the State of Oregon. These long-term values include (among many others):
• Multiple year income from Social Security and/or Disability benefits that were previously denied, terminated, or reduced;
• Long-term savings on children’s medical and other support costs
resulting from child support payments that were previously not obtained;
• Obtaining unemployment compensation benefits that had previously
been unfairly denied; • Significant savings on costs for emergency housing and family
assistance resulting from enforcement of landlord/tenant law; • Cost savings and benefits resulting from other legal aid services
available to qualified low-income individuals and families.
Another significant reason for the high value of Oregon’s Legal Aid Social Return on Investment is the number of volunteer (“pro bono”) hours of legal services delivered by attorneys in Oregon. These pro bono services would be less available and less efficient if not for the operations of the Legal Aid organizations. Oregon’s Legal Aid operations provide the necessary infrastructure, including attorney recruitment, training, and recognition, client screening, administrative support, technical assistance, and follow-up services for clients and pro bono volunteers. Oregon’s Legal Aid organizations provide services in over 100 types of civil legal problems. Their major areas of services are: (Impact Values rounded to 000’s)
Page 8

Family Issues:
Matters involving domestic violence, divorce, separation and annulment, child custody and visitation, guardianship, and adoption. During 2018 Oregon’s Legal Aid services provided legal services in and closed 4,447 legal matters resulting in $2,613,800 in immediate gross direct financial benefits and $5,235,200 in gross long-term consequential financial benefits.
FAMILY LAW ISSUES NUMBER OF CASES
GROSS DIRECT
SERVICE IMPACT VALUES
GROSS LONG-TERM
OUTCOME IMPACTS
Adoption 8 $2,000 $205,236
Custody and Visitation 1,611 $778,400 $1,546,111
Divorce/Separation/Annulment 1,404 $611,600 $525,782
Adult Guardianship 64 $49,000 $579,600
Gender/Name Change 16 $9,200 $0
Parental Rights Termination 10 $2,000 $0
Paternity 6 $1,200 $0
Domestic Abuse 1,100 $1,066,400 $1,633,452
Support 76 $30,800 $635,580
Other Family Issues 100 $34,800 $0
Delinquent Juvenile 0 $0 $0
Neglected and Abused Dependents 8 $7,200 $36,480
Emancipation 42 $20,800 $72,960
Minor Guardianship 2 $400 $0
Other Juvenile 8 $2,000 $205,236
Page 9

Housing Issues:
Matters involving loss of housing due to foreclosure, eviction from subsidized or private housing, public housing issues, private landlord/tenant problems, and sub-standard housing conditions. During 2018 Oregon’s Legal Aid services provided legal services in and closed 3,740 legal matters resulting in $4,010,700 in gross immediate direct financial benefits and $11,491,700 in gross long-term consequential financial benefits.
HOUSING ISSUES NUMBER
OF CASES
GROSS DIRECT
SERVICE IMPACT VALUES
GROSS LONG-TERM OUTCOME IMPACTS
Federally Subsidized Housing 1,254 $1,739,266 $8,640,972
Homeownership and Real Property 20 $17,200 $7,500
Private Landlord/Tenant Issues 1,798 $1,552,641 $1,412,240
Public Housing 160 $133,377 $127,000
Mobile Homes 184 $137,010 $91,440
Housing Discrimination 72 $305,497 $252,111
Mortgage Foreclosures 136 $50,181 $907,940
Mortgage Predatory Lending/Practices 0 $0 $0
Other Housing Issues 116 $75,470 $52,500
Page 10

Health Care Issues:
Matters involving Medicaid, Medicare, private health insurance, long-term health care facilities, home and community-based care, state and local health care, and other health issues. During 2018 Oregon’s Legal Aid services provided legal services in and closed 402 legal matters resulting in $178,400 in immediate gross direct financial benefits and $11,858,900 in gross long-term consequential financial benefits.
HEALTH CARE ISSUES NUMBER OF CASES
GROSS DIRECT
SERVICE IMPACT VALUES
GROSS LONG-TERM OUTCOME IMPACTS
Medicare 192 $69,200 $1,842,852
Medicaid 22 $4,400 $0
Govt. Children's Health Ins. Program 76 $26,800 $2,985,840
Home and Community Based Care 2 $400 $0
Private Health Insurance 58 $52,400 $6,912,000
Long Term Health Care Facilities 52 $25,200 $118,222
State and Local Health Care 192 $69,200 $1,842,852
Other Health Issues 22 $4,400 $0
Page 11

Employment Issues:
Matters involving issues involving discrimination, wages, tax issues, employment rights, and fair labor standards.
During 2018 Oregon’s Legal Aid services provided legal services in and closed 704 legal matters resulting in $427,600 in immediate gross direct financial benefits and $129,900 in gross long-term consequential benefits.
EMPLOYMENT ISSUES NUMBER OF CASES
GROSS DIRECT
SERVICE IMPACT VALUES
GROSS LONG-TERM
OUTCOME IMPACTS
Employment Discrimination 214 $90,800 $0
Wage Claims and Fair Labor Standards
84 $77,200 $18,464
Earned Income Tax Credit 22 $22,800 $4,800
Tax Issues 262 $180,000 $44,160
Employment Rights 50 $24,400 $10,880
Agricultural Worker Issues 20 $5,600 $45,320
Other Employment Issues 52 $26,800 $6,240
Page 12
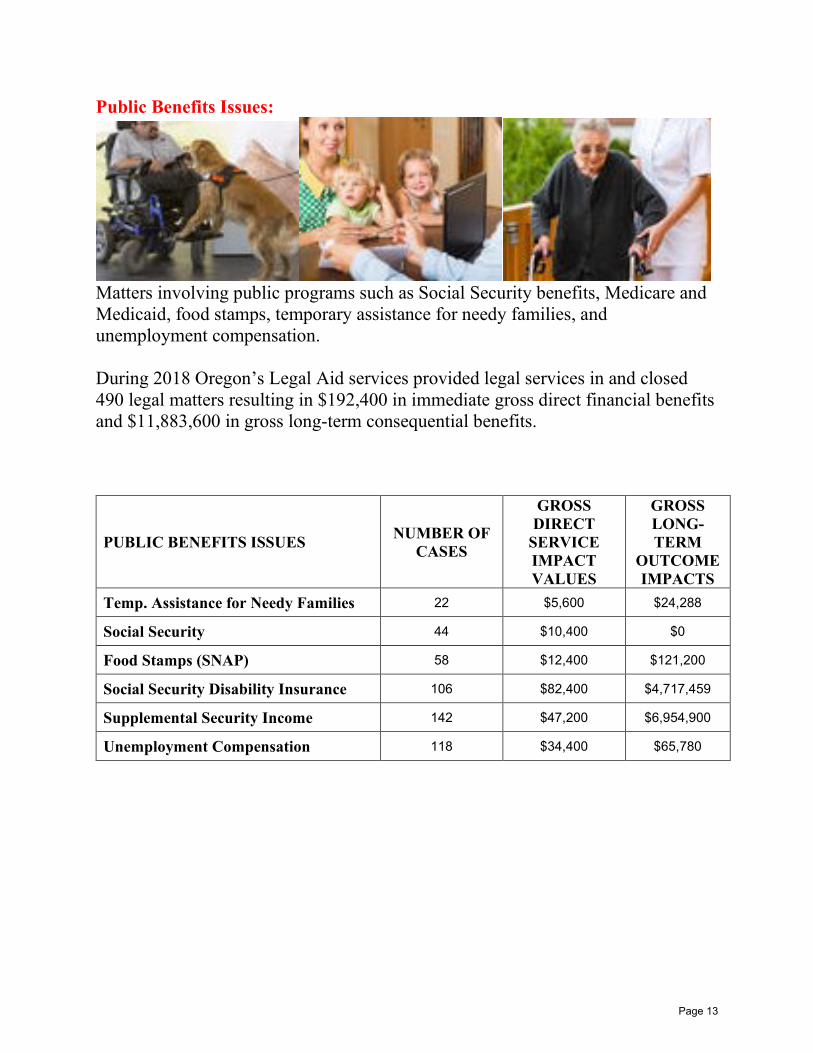
Public Benefits Issues:
Matters involving public programs such as Social Security benefits, Medicare and Medicaid, food stamps, temporary assistance for needy families, and unemployment compensation. During 2018 Oregon’s Legal Aid services provided legal services in and closed 490 legal matters resulting in $192,400 in immediate gross direct financial benefits and $11,883,600 in gross long-term consequential benefits.
PUBLIC BENEFITS ISSUES NUMBER OF CASES
GROSS DIRECT
SERVICE IMPACT VALUES
GROSS LONG-TERM
OUTCOME IMPACTS
Temp. Assistance for Needy Families 22 $5,600 $24,288
Social Security 44 $10,400 $0
Food Stamps (SNAP) 58 $12,400 $121,200
Social Security Disability Insurance 106 $82,400 $4,717,459
Supplemental Security Income 142 $47,200 $6,954,900
Unemployment Compensation 118 $34,400 $65,780
Page 13

Consumer Protection:
Matters involving bankruptcy, debt and wage garnishments, tax issues, debt collections, and repossessions. During 2018 Oregon’s Legal Aid services provided legal services in and closed 777 legal matters resulting in $2,881,400 in gross immediate direct financial benefits and $5,316,200 in gross long-term consequential financial benefits.
CONSUMER PROTECTION ISSUES NUMBER OF CASES
GROSS SERVICE IMPACT VALUES
GROSS LONG-TERM
OUTCOME IMPACTS
Bankruptcy & Debtor Relief 512 $2,733,200 $5,220,000
Collections/Repossessions/Garnishments 150 $96,600 $51,600
Contracts & Warranties 38 $8,000 $800
Collection Practices/Credit 18 $6,800 $2,400
Predatory Lending (Not Mortgage) 0 $0 $0
Loans & Installment Purchases 2 $3,200 $3,200
Public Utilities 10 $5,200 $8,800
Unfair Sales Practices 12 $10,800 $9,600
Other Consumer Finance Issues 35 $17,600 $19,836
Page 14

Other Community Issues:
Matters involving varied areas such as education, employment, mental health and disabilities, immigration, wills and estates, powers of attorney and advance directives, criminal record expungements, licenses (including Specialized Driver’s Licenses), civil rights, torts, civil rights, licenses, and other individual miscellaneous legal issues. During 2018 Oregon’s Legal Aid services legal services in and closed XXX legal matters resulting in $XXX in gross immediate direct financial benefits and $XXX in gross long-term consequential financial benefits.
OTHER COMMUNITY SUPPORT ISSUES
NUMBER OF CASES
GROSS DIRECT
SERVICE IMPACT VALUES
GROSS LONG-TERM OUTCOME IMPACTS
Education Issues 16 $23,200 $2,200
Veterans Benefits 4 $3,600 $44,460
State and Local Income Maintenance 8 $1,600 $0
Other Income Maintenance Issues 18 $4,000 $5,976
Immigration and Naturalization 90 $47,600 $612,000
Criminal Record Expungement 28 $18,400 $0
Mental Health Issues 18 $16,400 $24,000
Prisoner's Rights 28 $18,400 $135,960
Physically Disabled Rights 241 $87,600 $2,445,110
Civil Rights 52 $20,800 $0
Other Individual Rights 0 $0 $0
Page 15

Assistance for Non-Profits 4 $3,600 $44,460
Indian Tribal Law 124 $107,200 $0
Licenses (Incl. Specialized Drivers) 6 $2,000 $18,000
Torts 6 $1,600 $0
Wills and Estates 124 $48,000 $124,000
Advance Directives/Power of Attorney 10 $2,800 $0
Municipal Legal Needs 0 $0 $0
Other Miscellaneous Legal Issues 100 $30,800 $0
Government and Legal System Cost Savings: Cost savings to the community’s government agencies and court systems provided through work reduction and increases in efficiencies from the legal aid and assistance services provided by Legal Aid.
During 2018 Oregon’s Civil Legal Aid organizations provided services and assistance in a total of XXX legal matters which reduced the services required by the court systems and other Oregon government agencies, resulting in $2,606,000 in immediate direct financial savings for the court systems and other government operations. Note to these total values: These are the consolidated values for all the participating Legal Aid organizations in Oregon. Not all services are provided by every organization.
Page 16
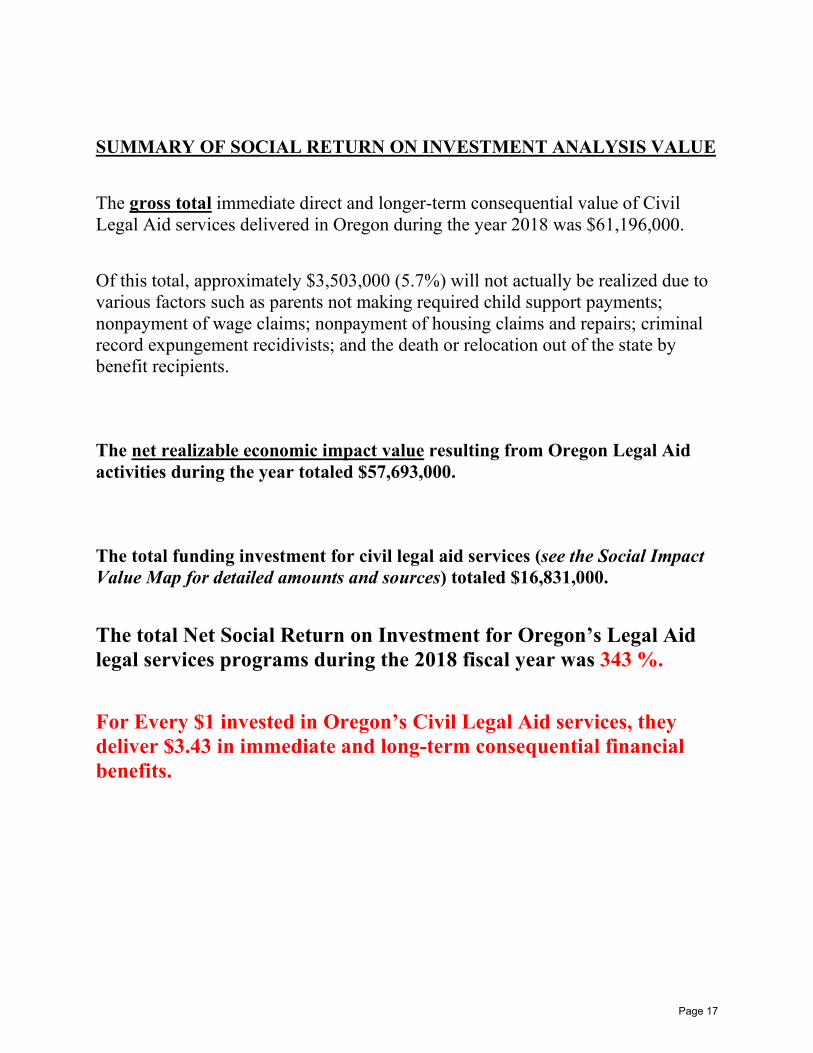
SUMMARY OF SOCIAL RETURN ON INVESTMENT ANALYSIS VALUE The gross total immediate direct and longer-term consequential value of Civil Legal Aid services delivered in Oregon during the year 2018 was $61,196,000. Of this total, approximately $3,503,000 (5.7%) will not actually be realized due to various factors such as parents not making required child support payments; nonpayment of wage claims; nonpayment of housing claims and repairs; criminal record expungement recidivists; and the death or relocation out of the state by benefit recipients. The net realizable economic impact value resulting from Oregon Legal Aid activities during the year totaled $57,693,000. The total funding investment for civil legal aid services (see the Social Impact Value Map for detailed amounts and sources) totaled $16,831,000. The total Net Social Return on Investment for Oregon’s Legal Aid legal services programs during the 2018 fiscal year was 343 %. For Every $1 invested in Oregon’s Civil Legal Aid services, they deliver $3.43 in immediate and long-term consequential financial benefits.
Page 17

csaco COMMUNITY SERVICES ANALYSIS LLC
Social Return on Investment Analysis Impact Map and Valuation Schedules
Description of the SROI Methodology and Data Elements
STAKEHOLDERS and CHANGES
Stakeholders Stakeholders are defined as the people or organizations that experience change (whether positive or negative) as a result of the activities being analyzed. In SROI analysis the primary stakeholders are those who provide the inputs that enable the services being analyzed.
Intended Changes Intended changes are those anticipated changes that result from the completion of the activities being delivered through the inputs from stakeholders. These anticipated changes typically are the reasons that the stakeholders have contributed the input resources.
Unintended Changes Unintended changes are those short- and long-term results that are not expected and were not part of the basis for the stakeholders providing the input resources. (An example of unintended changes is the increase in transportation time and fuel costs resulting from state and local regulations requiring disability services providers to pick up and drop off disabled persons at their doors).
These unintended changes are not forecast, but all changes – both intended and unintended – have financial impacts and are relevant to a SROI analysis.
INPUTS
Input Elements Inputs are activities resulting in changes with a goal of achieving the planned outputs and the projected outcomes. The SROI analysis process focuses on those input resources that can be measured in financial value terms and that are used up in the course of the activity (i.e. money and time).
Page 18

Unit of Measure (UOM) The Unit of Measure is the basis for identifying the quantity of the individual input element. This may be in units such as Dollars, Hours, Portions of Hours, or other measurements as appropriate to each input.
Value per Unit of Measure Value per Unit of Measure is the calculated financial impact of each input element per the appropriate Unit of Measure used for that input. These values can also include non-monetized inputs such as contributions of goods and services.
OUTPUTS
Output Deliverables
Outputs are the quantitative summary of the deliverable results from an activity. These results are the planned short-term goals of the activities and are typically well measured on a timely basis as completed.
Value per Unit of Measure
Value per Unit of Measure is the calculated financial impact of each output per the appropriate Unit of Measure used for that output.
Basis for Valuation The Basis for Valuation is a description of the methodology and reasoning for the selection of the most appropriate Value per Unit of Measure for each output.
Output SROI Gross Fiscal Impact The Gross Fiscal Impact is the Fair Market Value replacement cost for each output service delivered. This is the short-term SROI value that primarily measures the immediate SROI value and the comparative efficiency of the services delivered to the community by the provider.
OUTCOMES
Outcome Results (Description of Change)
Outcomes are the results of the output services delivered. These outcomes may either be the projected and anticipated changes that were the basis of the stakeholders provision of the resources required, or may be unintended and unanticipated changes resulting from these same outputs.
Page 19

The description of the outcomes needs to be as precise as possible to avoid uncertainty on the measurement indicator basis used and the basis for valuation. Care must also be taken not to confuse outcomes resulting from resource inputs from one shareholder with inputs from other shareholders that can result in double counting of the outcome valuations.
Measurement Indicators Indicators are measurement points that demonstrate that changes are taking place – that the outcomes are being achieved. These indicators are actions that are capable of being measured on a quantitative basis and that are capable of having financial impacts associated with their changes.
Frequently these outcomes have intermediate results that can occur over a period of years, but there may be observable and measurable changes along the way. It is important to understand what these intermediate changes may be and the financial impacts of these intermediate results, as the time period involved requires indicator tracking to gauge the progress of the activity and because the activities being analyzed may not bring about the anticipated final results but only some intermediate changes in the chain.
Duration of Change Many types of outcome have a finite life expectance of the resulting benefits. The duration of change element defines this expected useful life of the outcome (when appropriate).
The Duration of Change element is also related to the ‘Drop-Off” factor, which defines the reduction of benefits attributed to the outcome over longer periods of time.
BASIS FOR VALUATIONS
The Basis for Valuation is a description of the methodology and reasoning behind the selection of the most appropriate value per Unit of Measure for each outcome. When needed for complete understanding, alternative values are identified and discussed.
There can be types of outcomes that are difficult to value in monetary terms that are routinely left out of traditional economic appraisals. There are several techniques available in SROI analysis to approximate financial values via “proxy” methods that measure financial values via indirect comparative approaches:
• Contingent Valuation assesses via survey people’s willingness to pay, or to accept compensation, for a hypothetical product or service.
• Revealed Preference infers valuations from the price of related market-supplied goods or services;
Page 20

• The Travel Cost method recognizes that people are generally willing to travel some distance to access goods or services on which they place a value. This inconvenience and expense can be translated into money to derive an estimate of the values of the benefits of those goods and services.
Source of Valuation The Source of Valuation is a description or listing of the research sources used in determining the Basis for Valuation.
VALUATION NEGATIVE IMPACTS
Deadweight % Deadweight is a measure of the amount of the individual outcome that would have happened even if the output activity had not taken place. It is expressed as a percentage.
Attribution %
Attribution is an assessment of how much of the outcome was not caused by the contribution of each individual output service. This is expressed as a percentage.
The assessment of individual output service contribution can be a highly variable process with multiple conflicting factors. The relative contribution weight of an individual factor can vary from individual to individual, and the calculations can become problematic over long periods of time.
Drop-Off % In longer periods of time (greater than one year), the amount of outcome is likely to be less, or if the same, will be more likely to be influenced by other factors. Drop-off is an assessment of the ongoing reduced attribution to the outcome factors.
It is expressed as a fixed percentage of deduction from the remaining level of outcome at the end of each year.
SROI NET FISCAL IMPACT
The Outcome Net Fiscal Impact is the total value of all fiscal benefits for each direct output valuation and each consequential outcome valuation (both anticipated and unanticipated) following inclusion of the Valuation Impact and Net Present Value discounting.
Page 21

Stage 1 - Stakeholders Goals & Resource Inputs
Stakeholder Goals
The goals of Legal Aid services are to:
- Empower individuals, protect fundamental rights, strengthen communities, create opportunities, and achieve justice.
Social Economic Impact and Return on Funding Investment from Oregon Legal Aid Services for the Year 2018
- Resolve the serious legal problems of low income people, provide economic and family stability, and reduce poverty through effective legal assistance;
- Ensure that state and federal laws affecting low income people are enforced and reduce the systematic barriers to justice that these people face;
Who does this have an effect on and what are the desired results of the funding provided?
Page 22

Input Sources Value of Inputs
Sources of Investment FundingWhat is the value of
the inputs in U.S. currency?
State and Local Grants $7,654,531
Federal Grants $5,183,718
Private Grants $3,423,038
Attorney Fees $433,289
Contract Revenues $136,435
TOTAL INVESTMENT FUNDING $16,831,011
Inputs
Page 23
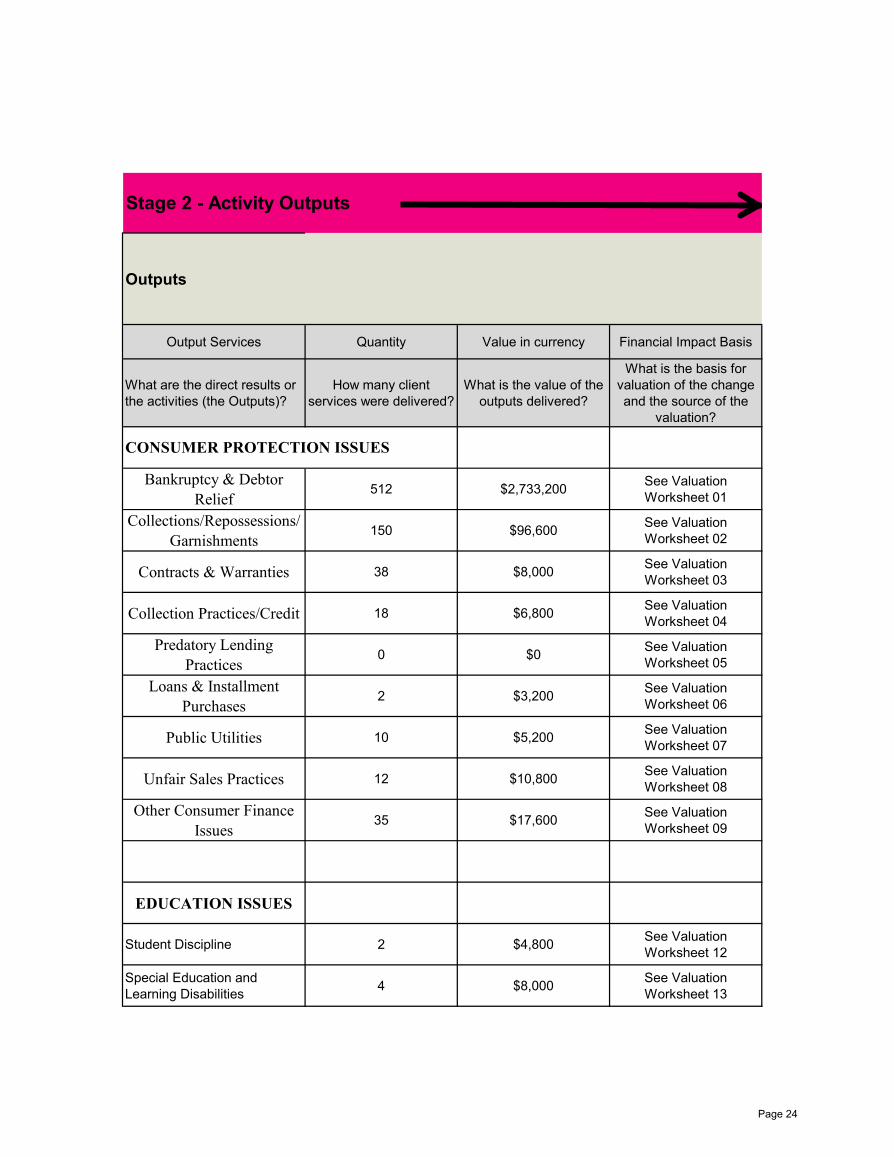
Outputs
Output Services Quantity Value in currency Financial Impact Basis
What are the direct results or the activities (the Outputs)?
How many client services were delivered?
What is the value of the outputs delivered?
What is the basis for valuation of the change and the source of the
valuation?
Bankruptcy & Debtor Relief
512 $2,733,200 See Valuation Worksheet 01
Collections/Repossessions/ Garnishments
150 $96,600 See Valuation Worksheet 02
Contracts & Warranties 38 $8,000 See Valuation Worksheet 03
Collection Practices/Credit 18 $6,800 See Valuation Worksheet 04
Predatory Lending Practices
0 $0 See Valuation Worksheet 05
Loans & Installment Purchases
2 $3,200 See Valuation Worksheet 06
Public Utilities 10 $5,200 See Valuation Worksheet 07
Unfair Sales Practices 12 $10,800 See Valuation Worksheet 08
Other Consumer Finance Issues
35 $17,600 See Valuation Worksheet 09
EDUCATION ISSUES
Student Discipline 2 $4,800 See Valuation Worksheet 12
Special Education and Learning Disabilities 4 $8,000 See Valuation
Worksheet 13
Stage 2 - Activity Outputs
CONSUMER PROTECTION ISSUES
Page 24
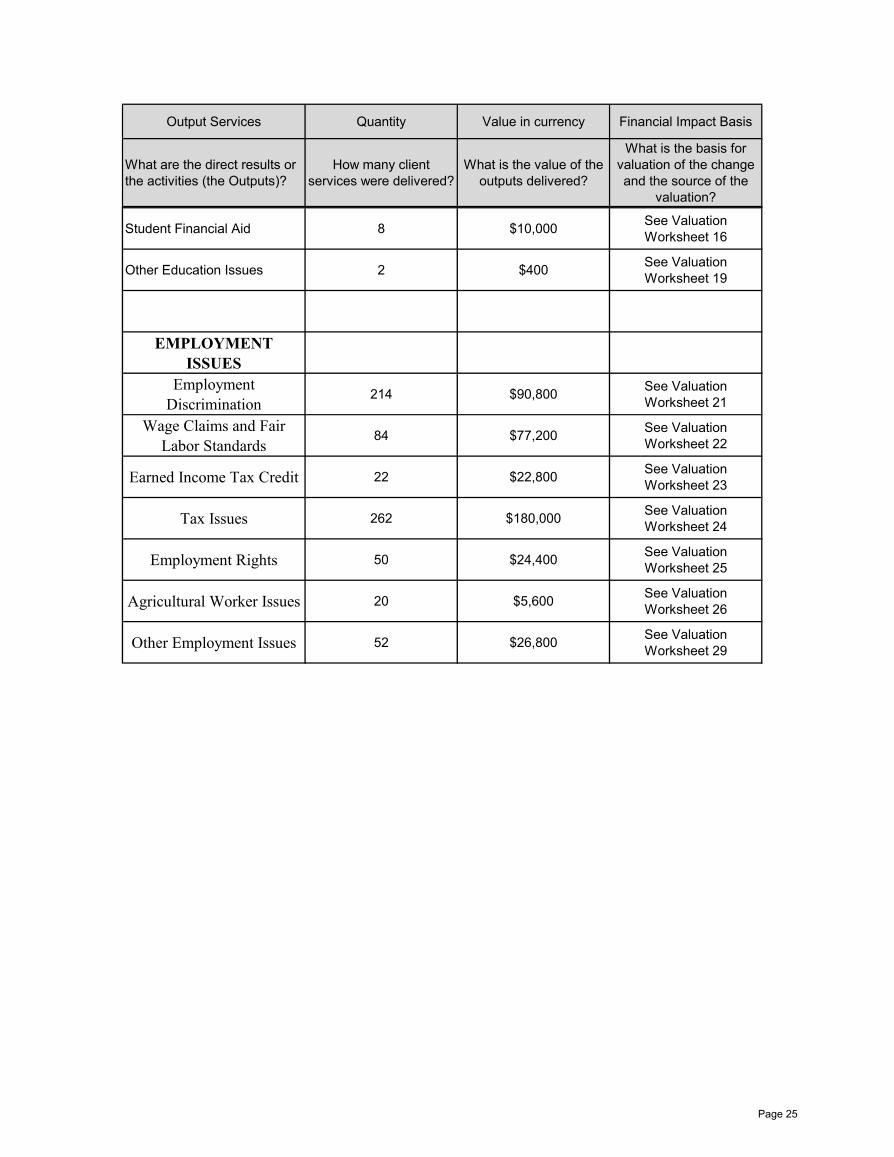
Output Services Quantity Value in currency Financial Impact Basis
What are the direct results or the activities (the Outputs)?
How many client services were delivered?
What is the value of the outputs delivered?
What is the basis for valuation of the change and the source of the
valuation?
Student Financial Aid 8 $10,000 See Valuation Worksheet 16
Other Education Issues 2 $400 See Valuation Worksheet 19
EMPLOYMENT ISSUES
Employment Discrimination
214 $90,800 See Valuation Worksheet 21
Wage Claims and Fair Labor Standards
84 $77,200 See Valuation Worksheet 22
Earned Income Tax Credit 22 $22,800 See Valuation Worksheet 23
Tax Issues 262 $180,000 See Valuation Worksheet 24
Employment Rights 50 $24,400 See Valuation Worksheet 25
Agricultural Worker Issues 20 $5,600 See Valuation Worksheet 26
Other Employment Issues 52 $26,800 See Valuation Worksheet 29
Page 25

Output Services Quantity Value in currency Financial Impact Basis
What are the direct results or the activities (the Outputs)?
How many client services were delivered?
What is the value of the outputs delivered?
What is the basis for valuation of the change and the source of the
valuation?
Adoption 8 $2,000 See Valuation Worksheet 30
Custody and Visitation 1,611 $778,400 See Valuation Worksheet 31
Divorce/Separation/ Annulment
1,404 $611,600 See Valuation Worksheet 32
Conservatorship 64 $49,000 See Valuation Worksheet 33
Name Change 16 $9,200 See Valuation Worksheet 34
Parental Rights Termination
10 $2,000 See Valuation Worksheet 35
Paternity 6 $1,200 See Valuation Worksheet 36
Domestic Abuse 1,100 $1,066,400 See Valuation Worksheet 37
Support 76 $30,800 See Valuation Worksheet 38
Other Family Issues 100 $34,800 See Valuation Worksheet 39
Delinquent 0 $0 See Valuation Worksheet 41
Neglected & Abused Dependents
8 $7,200 See Valuation Worksheet 42
Minor Guardianship 42 $20,800 See Valuation Worksheet 44
Other Juvenile 2 $400 See Valuation Worksheet 49
Medicaid Issues 192 $69,200 See Valuation Worksheet 51
DOMESTIC RELATIONS AND FAMILY ISSUES
HEALTH CARE ISSUES
Page 26

Output Services Quantity Value in currency Financial Impact Basis
What are the direct results or the activities (the Outputs)?
How many client services were delivered?
What is the value of the outputs delivered?
What is the basis for valuation of the change and the source of the
valuation?
Medicare Issues 22 $4,400 See Valuation Worksheet 52
Home and Community Based Care 76 $26,800 See Valuation
Worksheet 54
Private Health Insurance 2 $400 See Valuation Worksheet 55
Long Term Health Care 58 $52,400 See Valuation Worksheet 56
Other Health Issues 52 $25,200 See Valuation Worksheet 59
HOUSING ISSUES
Federally Subsidized Housing
1,254 $1,739,266 See Valuation Worksheet 61
Homeownership and Real Property
20 $17,200 See Valuation Worksheet 62
Private Landlord/Tenant Issues
1,798 $1,552,641 See Valuation Worksheet 63
Public Housing 160 $133,377 See Valuation Worksheet 64
Mobile Homes 184 $137,010 See Valuation Worksheet 65
Housing Discrimination 72 $305,497 See Valuation Worksheet 66
Mortgage Foreclosures 136 $50,181 See Valuation Worksheet 67
Mortgage Predatory Lending
0 $0 See Valuation Worksheet 68
Other Housing Issues 116 $75,470 See Valuation Worksheet 69
Temp. Assistance for Needy Families
22 $5,600 See Valuation Worksheet 71
PUBLIC BENEFITS ISSUES
Page 27
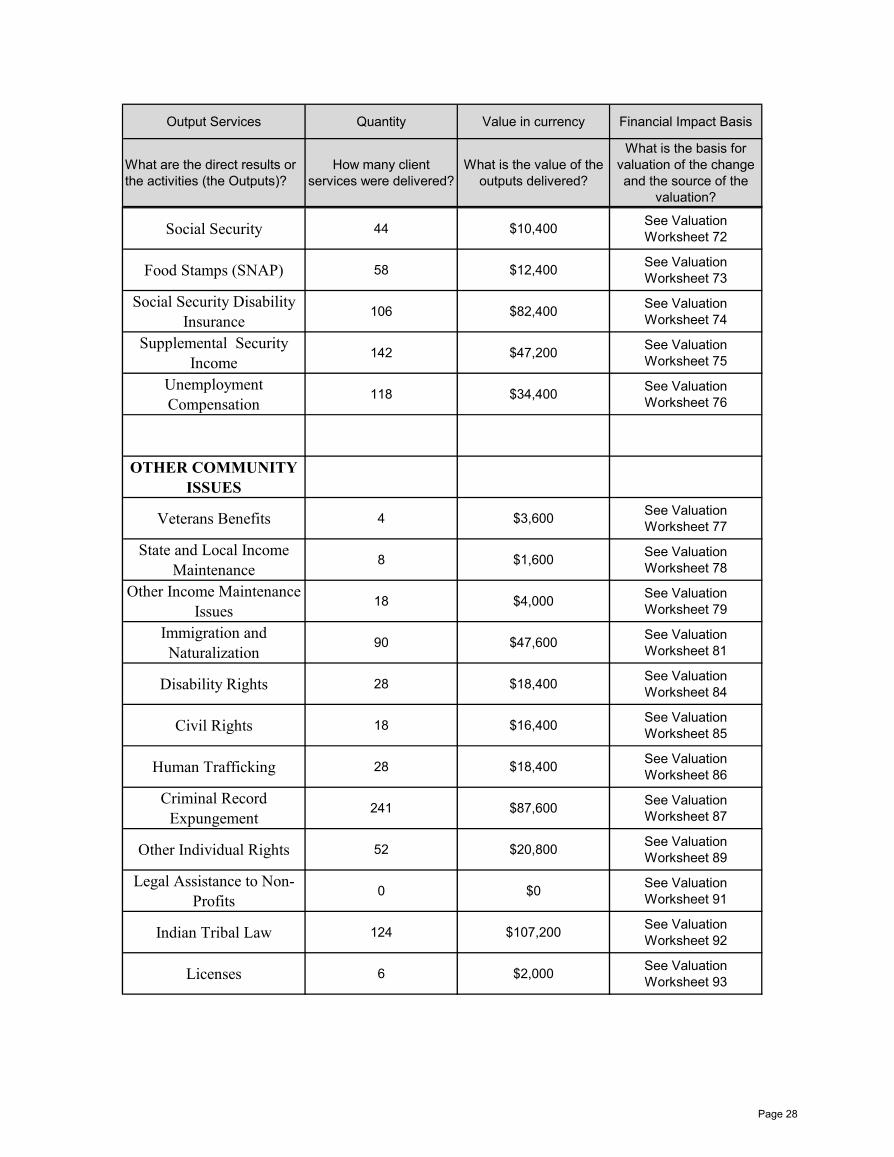
Output Services Quantity Value in currency Financial Impact Basis
What are the direct results or the activities (the Outputs)?
How many client services were delivered?
What is the value of the outputs delivered?
What is the basis for valuation of the change and the source of the
valuation?
Social Security 44 $10,400 See Valuation Worksheet 72
Food Stamps (SNAP) 58 $12,400 See Valuation Worksheet 73
Social Security Disability Insurance
106 $82,400 See Valuation Worksheet 74
Supplemental Security Income
142 $47,200 See Valuation Worksheet 75
Unemployment Compensation
118 $34,400 See Valuation Worksheet 76
OTHER COMMUNITY ISSUES
Veterans Benefits 4 $3,600 See Valuation Worksheet 77
State and Local Income Maintenance
8 $1,600 See Valuation Worksheet 78
Other Income Maintenance Issues
18 $4,000 See Valuation Worksheet 79
Immigration and Naturalization
90 $47,600 See Valuation Worksheet 81
Disability Rights 28 $18,400 See Valuation Worksheet 84
Civil Rights 18 $16,400 See Valuation Worksheet 85
Human Trafficking 28 $18,400 See Valuation Worksheet 86
Criminal Record Expungement
241 $87,600 See Valuation Worksheet 87
Other Individual Rights 52 $20,800 See Valuation Worksheet 89
Legal Assistance to Non-Profits
0 $0 See Valuation Worksheet 91
Indian Tribal Law 124 $107,200 See Valuation Worksheet 92
Licenses 6 $2,000 See Valuation Worksheet 93
Page 28

Output Services Quantity Value in currency Financial Impact Basis
What are the direct results or the activities (the Outputs)?
How many client services were delivered?
What is the value of the outputs delivered?
What is the basis for valuation of the change and the source of the
valuation?
Torts 6 $1,600 See Valuation Worksheet 94
Wills and Estates 124 $48,000 See Valuation Worksheet 95
Advance Directives/ Powers of Attorney
10 $2,800 See Valuation Worksheet 96
Municipal Legal Needs 0 $0 See Valuation Worksheet 97
Other Miscellaneous Legal Issues
100 $30,800 See Valuation Worksheet 99
Govt/Court System Efficiency Savings
11,433 $1,130,700
GOVERNMENT and LEGAL COST SAVINGS
Page 29

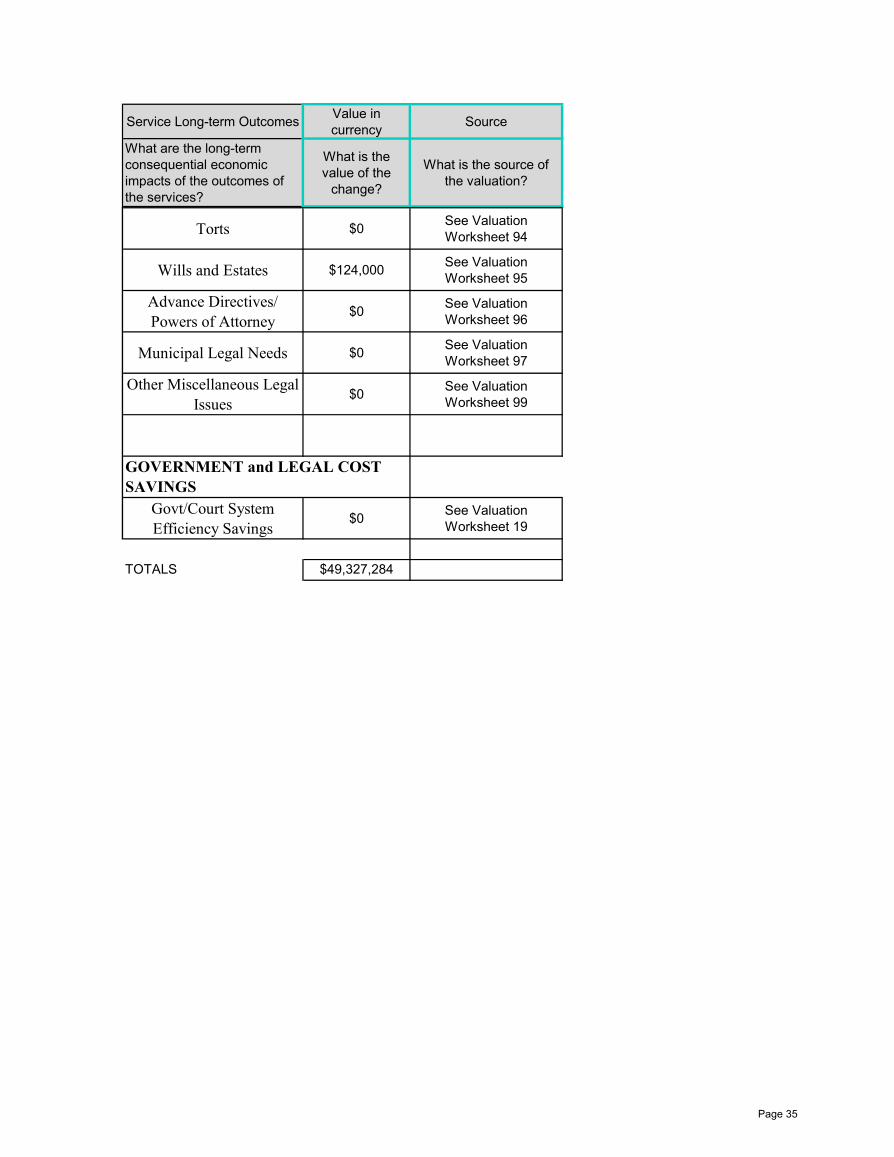
Stage 3 - Outcome Impact Valuation
Service Long-term Outcomes Value in currency Source
What are the long-term consequential economic impacts of the outcomes of the services?
What is the value of the
change?
What is the source of the valuation?
Bankruptcy & Debtor Relief
$5,220,000 See Valuation Worksheet 01
Collections/Repossessions/ Garnishments
$51,600 See Valuation Worksheet 02
Contracts & Warranties $800 See Valuation Worksheet 03
Collection Practices/Credit $2,400 See Valuation Worksheet 04
Predatory Lending Practices
$0 See Valuation Worksheet 05
Loans & Installment Purchases
$3,200 See Valuation Worksheet 06
Public Utilities $8,800 See Valuation Worksheet 07
Unfair Sales Practices $9,600 See Valuation Worksheet 08
Other Consumer Finance Issues
$19,836 See Valuation Worksheet 09
EDUCATION ISSUES
Student Discipline $0 See Valuation Worksheet 12
Special Education and Learning Disabilities $0 See Valuation
Worksheet 13
The Outcomes (what changes)
CONSUMER PROTECTION ISSUES
Page 30

Service Long-term Outcomes Value in currency Source
What are the long-term consequential economic impacts of the outcomes of the services?
What is the value of the
change?
What is the source of the valuation?
Student Financial Aid $2,232 See Valuation Worksheet 16
Other Education Issues $0 See Valuation Worksheet 19
EMPLOYMENT ISSUES
Employment Discrimination
$0 See Valuation Worksheet 21
Wage Claims and Fair Labor Standards
$18,464 See Valuation Worksheet 22
Earned Income Tax Credit $4,800 See Valuation Worksheet 23
Tax Issues $44,160 See Valuation Worksheet 24
Employment Rights $10,880 See Valuation Worksheet 25
Agricultural Worker Issues $45,320 See Valuation Worksheet 26
Other Employment Issues $6,240 See Valuation Worksheet 29
Page 31

Service Long-term Outcomes Value in currency Source
What are the long-term consequential economic impacts of the outcomes of the services?
What is the value of the
change?
What is the source of the valuation?
Adoption $205,236 See Valuation Worksheet 30
Custody and Visitation $1,546,111 See Valuation Worksheet 31
Divorce/Separation/ Annulment
$525,782 See Valuation Worksheet 32
Conservatorship $579,600 See Valuation Worksheet 33
Name Change $0 See Valuation Worksheet 34
Parental Rights Termination
$0 See Valuation Worksheet 35
Paternity $0 See Valuation Worksheet 36
Domestic Abuse $1,633,452 See Valuation Worksheet 37
Support $635,580 See Valuation Worksheet 38
Other Family Issues $0 See Valuation Worksheet 39
Delinquent $0 See Valuation Worksheet 41
Neglected & Abused Dependents
$36,480 See Valuation Worksheet 42
Minor Guardianship $72,960 See Valuation Worksheet 44
Other Juvenile $0 See Valuation Worksheet 49
Medicaid Issues $1,842,852 See Valuation Worksheet 51
DOMESTIC RELATIONS AND FAMILY ISSUES
HEALTH CARE ISSUES
Page 32

Service Long-term Outcomes Value in currency Source
What are the long-term consequential economic impacts of the outcomes of the services?
What is the value of the
change?
What is the source of the valuation?
Medicare Issues $0 See Valuation Worksheet 52
Home and Community Based Care
$2,985,840 See Valuation Worksheet 54
Private Health Insurance $0 See Valuation Worksheet 55
Long Term Health Care $6,912,000 See Valuation Worksheet 56
Other Health Issues $118,222 See Valuation Worksheet 59
HOUSING ISSUES
Federally Subsidized Housing
$8,640,972 See Valuation Worksheet 61
Homeownership and Real Property
$7,500 See Valuation Worksheet 62
Private Landlord/Tenant Issues
$1,412,240 See Valuation Worksheet 63
Public Housing $127,000 See Valuation Worksheet 64
Mobile Homes $91,440 See Valuation Worksheet 65
Housing Discrimination $252,111 See Valuation Worksheet 66
Mortgage Foreclosures $907,940 See Valuation Worksheet 67
Mortgage Predatory Lending
$0 See Valuation Worksheet 68
Other Housing Issues $52,500 See Valuation Worksheet 69
Temp. Assistance for Needy Families
$24,288 See Valuation Worksheet 71
PUBLIC BENEFITS ISSUES
Page 33

Service Long-term Outcomes Value in currency Source
What are the long-term consequential economic impacts of the outcomes of the services?
What is the value of the
change?
What is the source of the valuation?
Social Security $0 See Valuation Worksheet 72
Food Stamps (SNAP) $121,200 See Valuation Worksheet 73
Social Security Disability Insurance
$4,717,459 See Valuation Worksheet 74
Supplemental Security Income
$6,954,900 See Valuation Worksheet 75
Unemployment Compensation
$65,780 See Valuation Worksheet 76
OTHER COMMUNITY ISSUES
Veterans Benefits $44,460 See Valuation Worksheet 77
State and Local Income Maintenance
$0 See Valuation Worksheet 78
Other Income Maintenance Issues
$5,976 See Valuation Worksheet 79
Immigration and Naturalization
$612,000 See Valuation Worksheet 81
Disability Rights $0 See Valuation Worksheet 82
Civil Rights $24,000 See Valuation Worksheet 85
Human Trafficking $135,960 See Valuation Worksheet 86
Criminal Record Expungement
$2,445,110 See Valuation Worksheet 87
Other Individual Rights $0 See Valuation Worksheet 89
Legal Assistance to Non-Profits
$0 See Valuation Worksheet 91
Indian Tribal Law $0 See Valuation Worksheet 92
Licenses $18,000 See Valuation Worksheet 93
Page 34
Service Long-term Outcomes Value in currency Source
What are the long-term consequential economic impacts of the outcomes of the services?
What is the value of the
change?
What is the source of the valuation?
Torts $0 See Valuation Worksheet 94
Wills and Estates $124,000 See Valuation Worksheet 95
Advance Directives/ Powers of Attorney
$0 See Valuation Worksheet 96
Municipal Legal Needs $0 See Valuation Worksheet 97
Other Miscellaneous Legal Issues
$0 See Valuation Worksheet 99
Govt/Court System Efficiency Savings
$0 See Valuation Worksheet 19
TOTALS $49,327,284
GOVERNMENT and LEGAL COST SAVINGS
Page 35
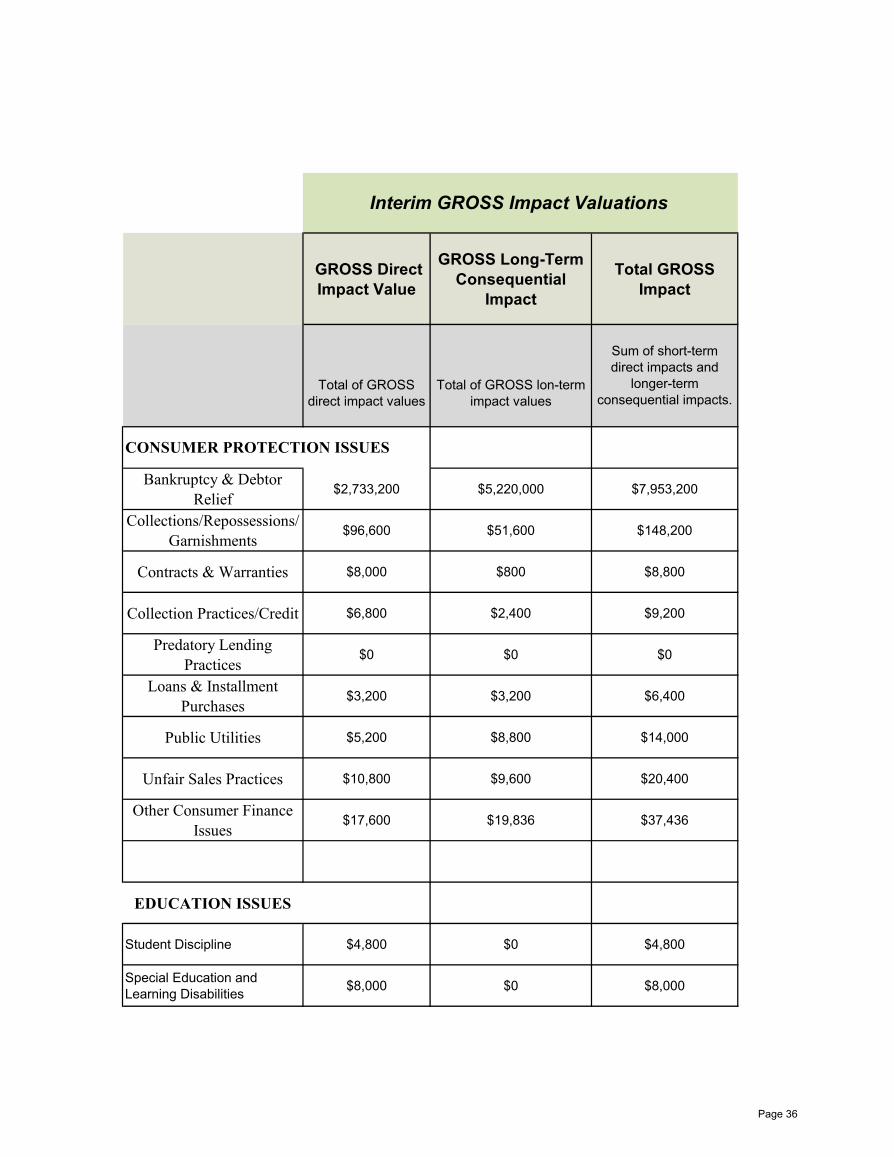
GROSS Direct Impact Value
GROSS Long-Term Consequential
Impact
Total GROSS Impact
Total of GROSS direct impact values
Total of GROSS lon-term impact values
Bankruptcy & Debtor Relief
$2,733,200 $5,220,000 $7,953,200
Collections/Repossessions/ Garnishments
$96,600 $51,600 $148,200
Contracts & Warranties $8,000 $800 $8,800
Collection Practices/Credit $6,800 $2,400 $9,200
Predatory Lending Practices
$0 $0 $0
Loans & Installment Purchases
$3,200 $3,200 $6,400
Public Utilities $5,200 $8,800 $14,000
Unfair Sales Practices $10,800 $9,600 $20,400
Other Consumer Finance Issues
$17,600 $19,836 $37,436
EDUCATION ISSUES
Student Discipline $4,800 $0 $4,800
Special Education and Learning Disabilities $8,000 $0 $8,000
Interim GROSS Impact Valuations
Sum of short-term direct impacts and
longer-term consequential impacts.
CONSUMER PROTECTION ISSUES
Page 36

Total of GROSS direct impact values
Total of GROSS lon-term impact values
Sum of short-term direct impacts and
longer-term consequential impacts.
Student Financial Aid $10,000 $2,232 $12,232
Other Education Issues $400 $0 $400
EMPLOYMENT ISSUES
Employment Discrimination
$90,800 $0 $90,800
Wage Claims and Fair Labor Standards
$77,200 $18,464 $95,664
Earned Income Tax Credit $22,800 $4,800 $27,600
Tax Issues $180,000 $44,160 $224,160
Employment Rights $24,400 $10,880 $35,280
Agricultural Worker Issues $5,600 $45,320 $50,920
Other Employment Issues $26,800 $6,240 $33,040
Page 37

Total of GROSS direct impact values
Total of GROSS lon-term impact values
Sum of short-term direct impacts and
longer-term consequential impacts.
Adoption $2,000 $205,236 $207,236
Custody and Visitation $778,400 $1,546,111 $2,324,511
Divorce/Separation/ Annulment
$611,600 $525,782 $1,137,382
Conservatorship $49,000 $579,600 $628,600
Name Change $9,200 $0 $9,200
Parental Rights Termination
$2,000 $0 $2,000
Paternity $1,200 $0 $1,200
Domestic Abuse $1,066,400 $1,633,452 $2,699,852
Support $30,800 $635,580 $666,380
Other Family Issues $34,800 $0 $34,800
Delinquent $0 $0 $0
Neglected & Abused Dependents
$7,200 $36,480 $43,680
Minor Guardianship $20,800 $72,960 $93,760
Other Juvenile $400 $0 $400
Medicaid Issues $69,200 $1,842,852 $1,912,052
DOMESTIC RELATIONS AND FAMILY ISSUES
HEALTH CARE ISSUES
Page 38
Total of GROSS direct impact values
Total of GROSS lon-term impact values
Sum of short-term direct impacts and
longer-term consequential impacts.
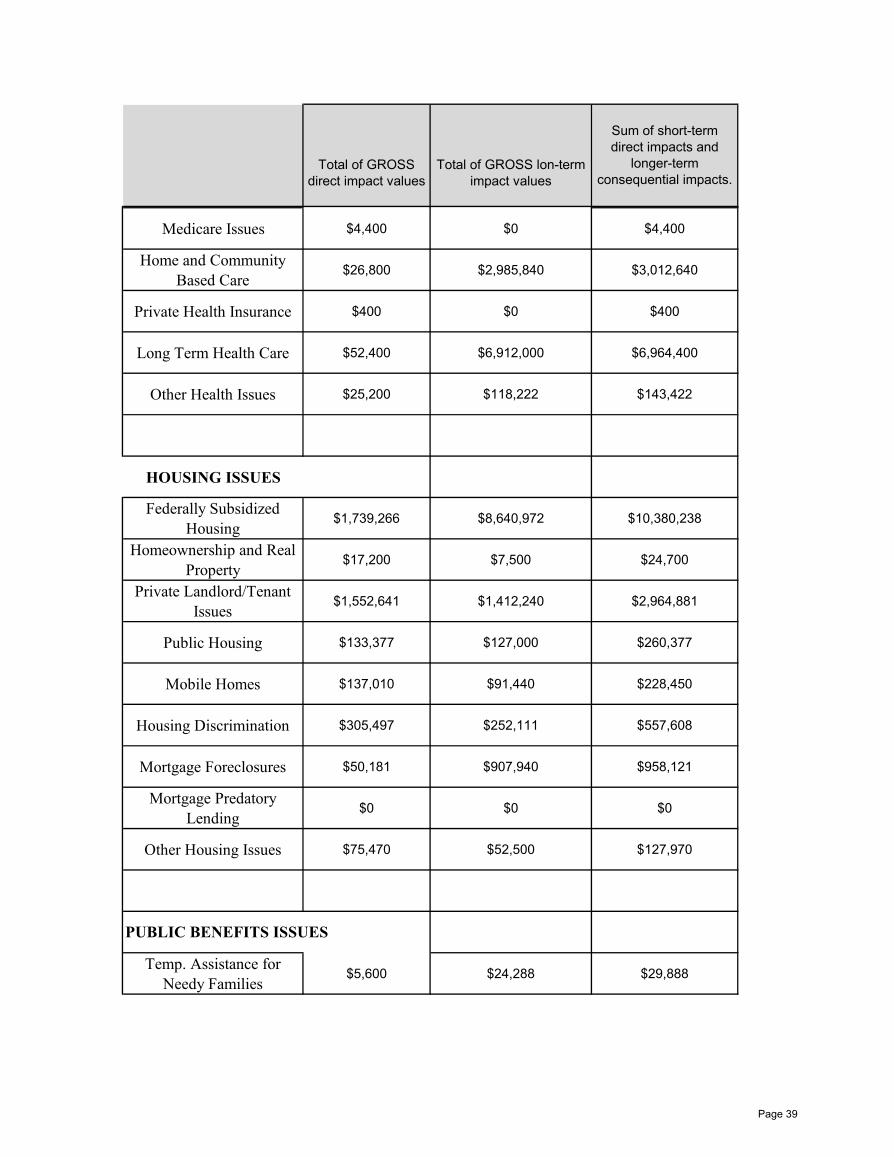
Medicare Issues $4,400 $0 $4,400
Home and Community Based Care
$26,800 $2,985,840 $3,012,640
Private Health Insurance $400 $0 $400
Long Term Health Care $52,400 $6,912,000 $6,964,400
Other Health Issues $25,200 $118,222 $143,422
HOUSING ISSUES
Federally Subsidized Housing
$1,739,266 $8,640,972 $10,380,238
Homeownership and Real Property
$17,200 $7,500 $24,700
Private Landlord/Tenant Issues
$1,552,641 $1,412,240 $2,964,881
Public Housing $133,377 $127,000 $260,377
Mobile Homes $137,010 $91,440 $228,450
Housing Discrimination $305,497 $252,111 $557,608
Mortgage Foreclosures $50,181 $907,940 $958,121
Mortgage Predatory Lending
$0 $0 $0
Other Housing Issues $75,470 $52,500 $127,970
Temp. Assistance for Needy Families
$5,600 $24,288 $29,888
PUBLIC BENEFITS ISSUES
Page 39

Total of GROSS direct impact values
Total of GROSS lon-term impact values
Sum of short-term direct impacts and
longer-term consequential impacts.
Social Security $10,400 $0 $10,400
Food Stamps (SNAP) $12,400 $121,200 $133,600
Social Security Disability Insurance
$82,400 $4,717,459 $4,799,859
Supplemental Security Income
$47,200 $6,954,900 $7,002,100
Unemployment Compensation
$34,400 $65,780 $100,180
OTHER COMMUNITY ISSUES
Veterans Benefits $3,600 $44,460 $48,060
State and Local Income Maintenance
$1,600 $0 $1,600
Other Income Maintenance Issues
$4,000 $5,976 $9,976
Immigration and Naturalization
$47,600 $612,000 $659,600
Disability Rights $18,400 $0 $18,400
Civil Rights $16,400 $24,000 $40,400
Human Trafficking $18,400 $135,960 $154,360
Criminal Record Expungement
$87,600 $2,445,110 $2,532,710
Other Individual Rights $20,800 $0 $20,800
Legal Assistance to Non-Profits
$0 $0 $0
Indian Tribal Law $107,200 $0 $107,200
Licenses $2,000 $18,000 $20,000
Page 40

Total of GROSS direct impact values
Total of GROSS lon-term impact values
Sum of short-term direct impacts and
longer-term consequential impacts.
Torts $1,600 $0 $1,600
Wills and Estates $48,000 $124,000 $172,000
Advance Directives/ Powers of Attorney
$2,800 $0 $2,800
Municipal Legal Needs $0 $0 $0
Other Miscellaneous Legal Issues
$30,800 $0 $30,800
Govt/Court System Efficiency Savings
$1,130,700 N/A $1,130,700
TOTALS $11,868,942 $49,327,284 $61,196,226
GOVERNMENT and LEGAL COST SAVINGS
Page 41

Deadweight %
Displacement %
Attribution %
Drop off %
Bankruptcy & Debtor Relief
0% 0% 0% 0%
Collections/Repossessions/ Garnishments
5% 0% 0% 5%
Contracts & Warranties 0% 0% 0% 0%
Collection Practices/Credit 0% 0% 0% 0%
Predatory Lending Practices
0% 0% 0% 0%
Loans & Installment Purchases
0% 0% 0% 0%
Public Utilities 0% 0% 0% 0%
Unfair Sales Practices 10% 0% 0% 10%
Other Consumer Finance Issues
0% 0% 0% 5%
EDUCATION ISSUES
Student Discipline 0% 0% 0% 40%
Special Education and Learning Disabilities 0% 0% 0% 0%
What would have happened without
the activity?
What activity did this displace?
Who else contributed to the change?
Does the outcome drop off in future
years?
CONSUMER PROTECTION ISSUES
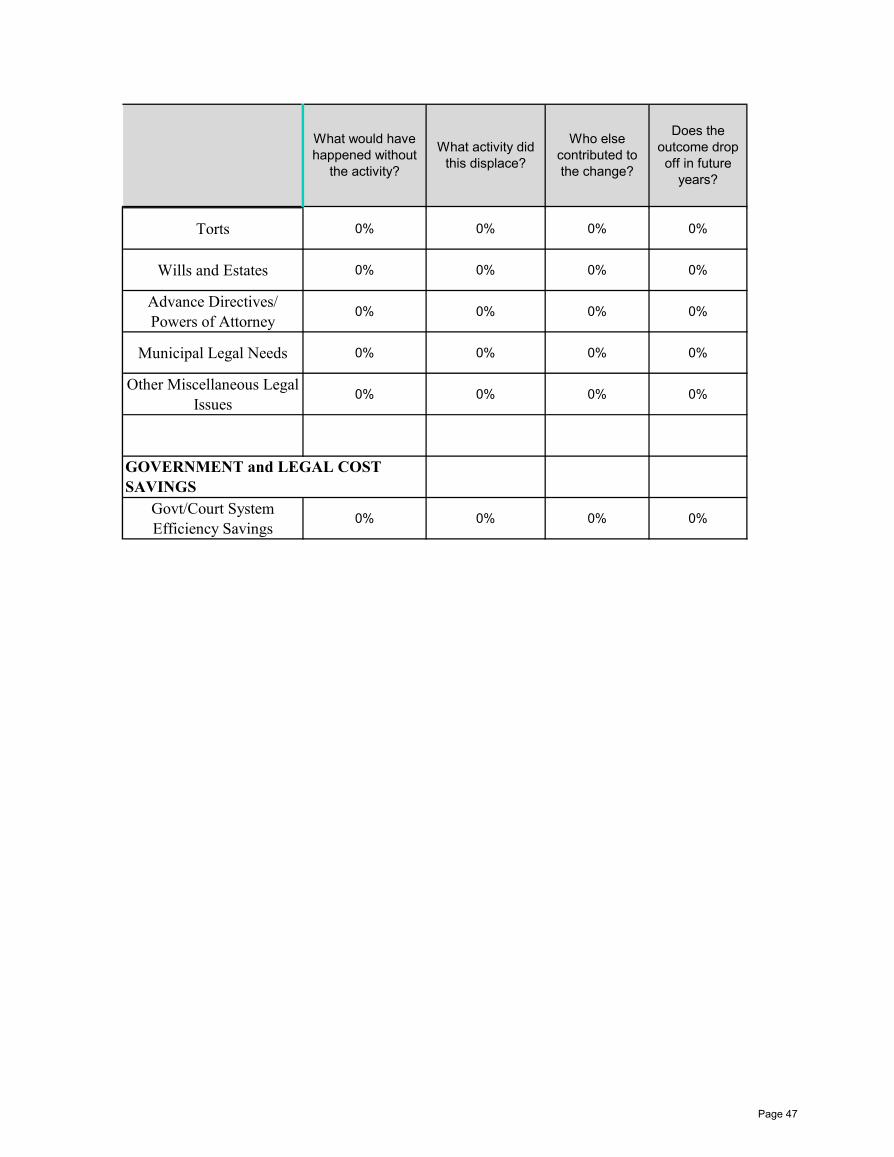
Stage 4 - Negative Impact Factors
Page 42

What would have happened without
the activity?
What activity did this displace?
Who else contributed to the change?
Does the outcome drop off in future
years?
Student Financial Aid 0% 0% 0% 5%
Other Education Issues 0% 0% 0% 0%
EMPLOYMENT ISSUES
Employment Discrimination
10% 0% 0% 10%
Wage Claims and Fair Labor Standards
0% 0% 0% 10%
Earned Income Tax Credit 0% 0% 0% 10%
Tax Issues 0% 0% 0% 0%
Employment Rights 0% 0% 0% 10%
Agricultural Worker Issues 0% 0% 0% 30%
Other Employment Issues 0% 0% 0% 0%
Page 43

What would have happened without
the activity?
What activity did this displace?
Who else contributed to the change?
Does the outcome drop off in future
years?
Adoption 0% 0% 0% 0%
Custody and Visitation 0% 0% 0% 10%
Divorce/Separation/ Annulment
5% 0% 0% 5%
Conservatorship 0% 0% 0% 0%
Name Change 0% 0% 0% 0%
Parental Rights Termination
0% 0% 0% 0%
Paternity 0% 0% 0% 40%
Domestic Abuse 5% 0% 0% 30%
Support 0% 0% 0% 40%
Other Family Issues 0% 0% 0% 0%
Delinquent 0% 0% 0% 0%
Neglected & Abused Dependents
0% 0% 0% 10%
Minor Guardianship 0% 0% 0% 5%
Other Juvenile 0% 0% 0% 0%
Medicaid Issues 0% 0% 0% 0%
DOMESTIC RELATIONS AND FAMILY ISSUES
HEALTH CARE ISSUES
Page 44

What would have happened without
the activity?
What activity did this displace?
Who else contributed to the change?
Does the outcome drop off in future
years?
Medicare Issues 0% 0% 0% 0%
Home and Community Based Care
0% 0% 0% 10%
Private Health Insurance 0% 0% 0% 0%
Long Term Health Care 0% 0% 0% 20%
Other Health Issues 0% 0% 0% 10%
HOUSING ISSUES
Federally Subsidized Housing
0% 0% 0% 0%
Homeownership and Real Property
0% 0% 5% 5%
Private Landlord/Tenant Issues
0% 0% 0% 0%
Public Housing 5% 0% 0% 5%
Mobile Homes 0% 0% 0% 0%
Housing Discrimination 0% 0% 0% 0%
Mortgage Foreclosures 0% 0% 0% 0%
Mortgage Predatory Lending
0% 0% 0% 0%
Other Housing Issues 0% 0% 0% 0%
Temp. Assistance for Needy Families
0% 0% 0% 0%
PUBLIC BENEFITS ISSUES
Page 45

What would have happened without
the activity?
What activity did this displace?
Who else contributed to the change?
Does the outcome drop off in future
years?
Social Security 0% 0% 0% 0%
Food Stamps (SNAP) 0% 0% 0% 0%
Social Security Disability Insurance
0% 0% 0% 5%
Supplemental Security Income
0% 0% 0% 0%
Unemployment Compensation
0% 0% 0% 5%
OTHER COMMUNITY ISSUES
Veterans Benefits 0% 0% 0% 0%
State and Local Income Maintenance
0% 0% 0% 0%
Other Income Maintenance Issues
0% 0% 0% 0%
Immigration and Naturalization
0% 0% 0% 0%
Disability Rights 0% 0% 0% 0%
Civil Rights 0% 0% 0% 10%
Human Trafficking 0% 0% 0% 0%
Criminal Record Expungement
0% 0% 0% 20%
Other Individual Rights 0% 0% 0% 0%
Legal Assistance to Non-Profits
0% 0% 0% 0%
Indian Tribal Law 0% 0% 0% 0%
Licenses 0% 0% 0% 0%
Page 46
What would have happened without
the activity?
What activity did this displace?
Who else contributed to the change?
Does the outcome drop off in future
years?
Torts 0% 0% 0% 0%
Wills and Estates 0% 0% 0% 0%
Advance Directives/ Powers of Attorney
0% 0% 0% 0%
Municipal Legal Needs 0% 0% 0% 0%
Other Miscellaneous Legal Issues
0% 0% 0% 0%
Govt/Court System Efficiency Savings
0% 0% 0% 0%
GOVERNMENT and LEGAL COST SAVINGS
Page 47
NET Direct Impact
NET Consequential
Impact
TOTAL NET SOCIAL VALUE
IMPACT
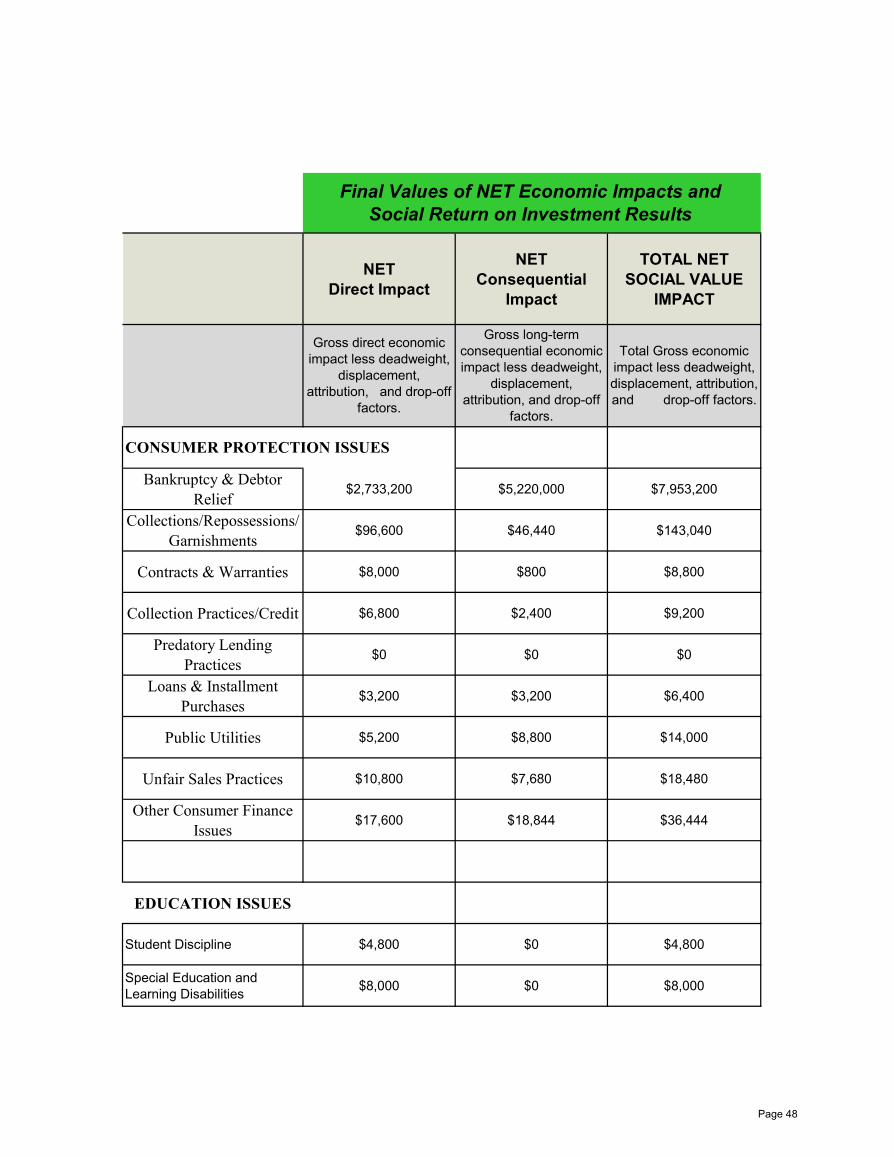
Bankruptcy & Debtor Relief
$2,733,200 $5,220,000 $7,953,200
Collections/Repossessions/ Garnishments
$96,600 $46,440 $143,040
Contracts & Warranties $8,000 $800 $8,800
Collection Practices/Credit $6,800 $2,400 $9,200
Predatory Lending Practices
$0 $0 $0
Loans & Installment Purchases
$3,200 $3,200 $6,400
Public Utilities $5,200 $8,800 $14,000
Unfair Sales Practices $10,800 $7,680 $18,480
Other Consumer Finance Issues
$17,600 $18,844 $36,444
EDUCATION ISSUES
Student Discipline $4,800 $0 $4,800
Special Education and Learning Disabilities $8,000 $0 $8,000
Final Values of NET Economic Impacts and Social Return on Investment Results
Gross direct economic impact less deadweight,
displacement, attribution, and drop-off
factors.
Gross long-term consequential economic impact less deadweight,
displacement, attribution, and drop-off
factors.
Total Gross economic impact less deadweight, displacement, attribution, and drop-off factors.
CONSUMER PROTECTION ISSUES
Page 48
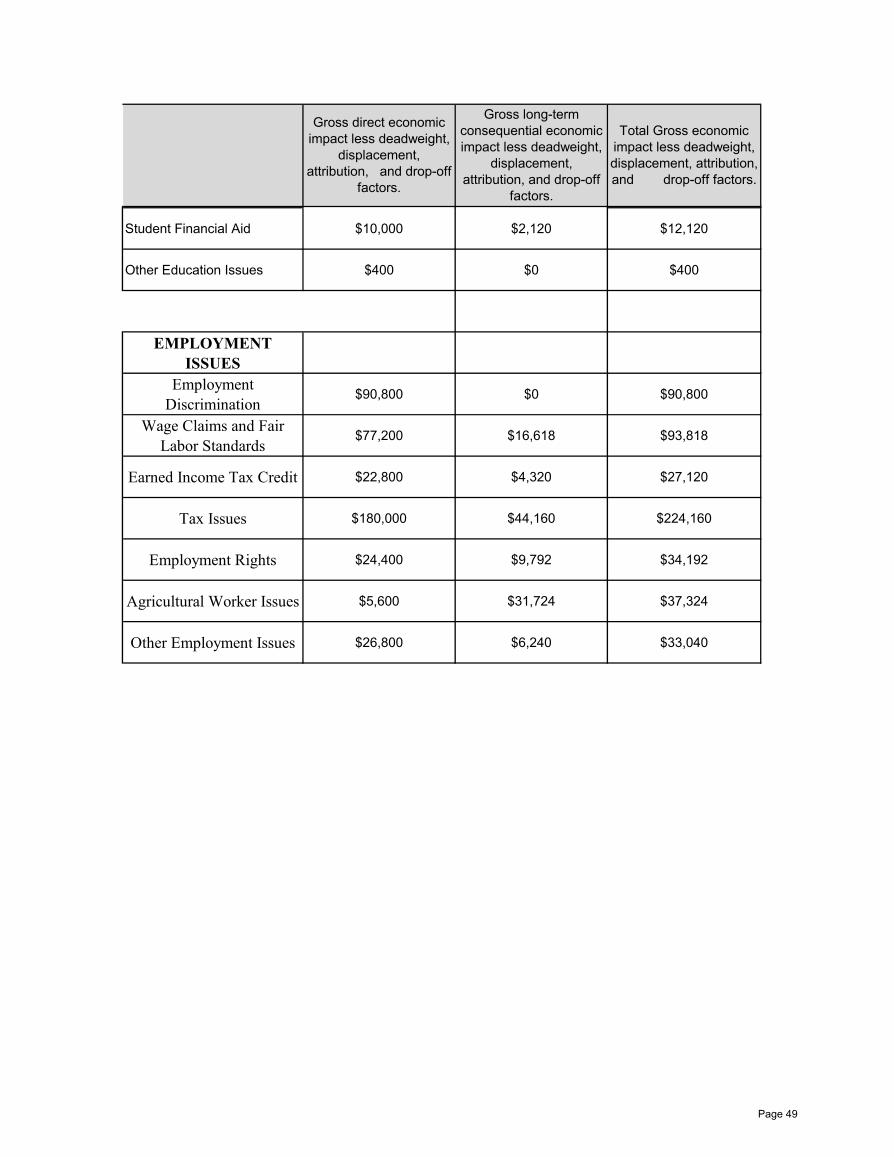
Gross direct economic impact less deadweight,
displacement, attribution, and drop-off
factors.
Gross long-term consequential economic impact less deadweight,
displacement, attribution, and drop-off
factors.
Total Gross economic impact less deadweight, displacement, attribution, and drop-off factors.
Student Financial Aid $10,000 $2,120 $12,120
Other Education Issues $400 $0 $400
EMPLOYMENT ISSUES
Employment Discrimination
$90,800 $0 $90,800
Wage Claims and Fair Labor Standards
$77,200 $16,618 $93,818
Earned Income Tax Credit $22,800 $4,320 $27,120
Tax Issues $180,000 $44,160 $224,160
Employment Rights $24,400 $9,792 $34,192
Agricultural Worker Issues $5,600 $31,724 $37,324
Other Employment Issues $26,800 $6,240 $33,040
Page 49

Gross direct economic impact less deadweight,
displacement, attribution, and drop-off
factors.
Gross long-term consequential economic impact less deadweight,
displacement, attribution, and drop-off
factors.
Total Gross economic impact less deadweight, displacement, attribution, and drop-off factors.
Adoption $2,000 $205,236 $207,236
Custody and Visitation $778,400 $1,391,500 $2,169,900
Divorce/Separation/ Annulment
$611,600 $473,204 $1,084,804
Conservatorship $49,000 $579,600 $628,600
Name Change $9,200 $0 $9,200
Parental Rights Termination
$2,000 $0 $2,000
Paternity $1,200 $0 $1,200
Domestic Abuse $1,066,400 $1,061,744 $2,128,144
Support $30,800 $381,348 $412,148
Other Family Issues $34,800 $0 $34,800
Delinquent $0 $0 $0
Neglected & Abused Dependents
$7,200 $32,832 $40,032
Minor Guardianship $20,800 $69,312 $90,112
Other Juvenile $400 $0 $400
Medicaid Issues $69,200 $1,842,852 $1,912,052
HEALTH CARE ISSUES
DOMESTIC RELATIONS AND FAMILY ISSUES
Page 50

Gross direct economic impact less deadweight,
displacement, attribution, and drop-off
factors.
Gross long-term consequential economic impact less deadweight,
displacement, attribution, and drop-off
factors.
Total Gross economic impact less deadweight, displacement, attribution, and drop-off factors.
Medicare Issues $4,400 $0 $4,400
Home and Community Based Care
$26,800 $2,687,256 $2,714,056
Private Health Insurance $400 $0 $400
Long Term Health Care $52,400 $5,529,600 $5,582,000
Other Health Issues $25,200 $106,400 $131,600
HOUSING ISSUES
Federally Subsidized Housing
$1,739,266 $8,640,972 $10,380,238
Homeownership and Real Property
$17,200 $6,750 $23,950
Private Landlord/Tenant Issues
$1,552,641 $1,412,240 $2,964,881
Public Housing $133,377 $114,300 $247,677
Mobile Homes $137,010 $91,440 $228,450
Housing Discrimination $305,497 $252,111 $557,608
Mortgage Foreclosures $50,181 $907,940 $958,121
Mortgage Predatory Lending
$0 $0 $0
Other Housing Issues $75,470 $52,500 $127,970
Temp. Assistance for Needy Families
$5,600 $24,288 $29,888
PUBLIC BENEFITS ISSUES
Page 51

Gross direct economic impact less deadweight,
displacement, attribution, and drop-off
factors.
Gross long-term consequential economic impact less deadweight,
displacement, attribution, and drop-off
factors.
Total Gross economic impact less deadweight, displacement, attribution, and drop-off factors.
Social Security $10,400 $0 $10,400
Food Stamps (SNAP) $12,400 $121,200 $133,600
Social Security Disability Insurance
$82,400 $4,481,586 $4,563,986
Supplemental Security Income
$47,200 $6,954,900 $7,002,100
Unemployment Compensation
$34,400 $62,491 $96,891
OTHER COMMUNITY ISSUES
Veterans Benefits $3,600 $44,460 $48,060
State and Local Income Maintenance
$1,600 $0 $1,600
Other Income Maintenance Issues
$4,000 $5,976 $9,976
Immigration and Naturalization
$47,600 $612,000 $659,600
Disability Rights $18,400 $0 $18,400
Civil Rights $16,400 $21,600 $38,000
Human Trafficking $18,400 $135,960 $154,360
Criminal Record Expungement
$87,600 $1,956,088 $2,043,688
Other Individual Rights $20,800 $0 $20,800
Legal Assistance to Non-Profits
$0 $0 $0
Indian Tribal Law $107,200 $0 $107,200
Licenses $2,000 $18,000 $20,000
Page 52

Gross direct economic impact less deadweight,
displacement, attribution, and drop-off
factors.
Gross long-term consequential economic impact less deadweight,
displacement, attribution, and drop-off
factors.
Total Gross economic impact less deadweight, displacement, attribution, and drop-off factors.
Torts $1,600 $0 $1,600
Wills and Estates $48,000 $124,000 $172,000
Advance Directives/ Powers of Attorney
$2,800 $0 $2,800
Municipal Legal Needs $0 $0 $0
Other Miscellaneous Legal Issues
$30,800 $0 $30,800
Govt/Court System Efficiency Savings
$1,130,700 $0 $1,130,700
TOTALS $11,868,942 $45,824,824 $57,693,766
$57,693,766
$16,831,011Total Amount of Investment
343%
TOTAL NET SOCIAL ECONOMIC
INVESTMENT PERCENTAGE FOR OREGON LEGAL FOUNDATION LEGAL AID SERVICE MEMBERS
GOVERNMENT and LEGAL COST SAVINGS
Page 53

csaco COMMUNITY SERVICES ANALYSIS LLC The Economic Impact and Social Return on Investment
from the services provided by Oregon’s Civil Legal Aid organizations.
Overview The State of Oregon and many other governmental funding sources nationwide are reviewing their “Performance Measurement” processes, including metrics such as Return on Investment, Output and Outcome Measures, and Efficiency Measures, in an effort to improve efficiency, effectiveness and the delivered value of their multiple of community services and funding requirements and options. This report provides these measurement results to funding sources, stakeholders, and members of the community.
This analysis follows the basic structure, definitions, and procedures encompassed in the Social Value International defined and international accepted valuation methodology. Additional input was taken from the New Economics Foundation study “Measuring Real Value: a DIY Guide to Social Return on Investment”, the Nonprofit Good Practice Guide, and various financial analysis tools and methods used in the private sector.
Scope of the Project The process of developing this analysis included the identification of measurable benefits provided to the community by the services provided by the Civil Legal Aid organizations as a result of their operations.
Many of the transaction statistics for these areas have historically been tracked by the staff and management of these organizations, but several areas were not. The personnel at the individual organizations are to be commended for effectively researching these areas and providing accurate transaction information.
The definitions of value to community are based on a variety of published sources where available, surveys of local cost when appropriate, surveys of State residents, and realistic formula calculations. These same methodologies have been used in multiple other social service provider engagements and have been reviewed in detail by multiple organizations and outside researchers.
Page 54

Conclusion Based on a review of the individual organization’s transaction records, internal reports, financial statements, reports submitted to various state and federal stakeholders, and the detailed analysis of values delivered to the community of the individual services provided by the organization, this report presents fairly the Social Return on Funding Investment for The Oregon Civil Legal Aid organizations for the year 2018.
March 6, 2020
John Byrnes Principal Community Service Analysis, LLC
Page 55