Embed Size (px)
Citation preview

AUSTRALIAN PRIMARY HEALTH CARE RESEARCH INSTITUTE ANU COLLEGE OF MEDICINE, BIOLOGY & ENVIRONMENT
THE AUSTRALIAN NATIONAL UNIVERSITY
ROBERT GRAHAM CENTER FOR PRIMARY CARE POLICY RESEARCH
SOCIAL DETERMINANTS OF HEALTH IN PRIMARY HEALTH CARE
PLANNING
Dr Danielle Butler APHCRI/Robert Graham Center Visiting Fellowship Report
March 2010

AUSTRALIAN PRIMARY HEALTH CARE RESEARCH INSTITUTE
2 __________________________________________________________________________________________________
ACKNOWLEDGMENT
Australian Primary Health Care Research Institute (APHCRI)
ANU College of Medicine, Biology and Environment
Building 62, Corner Mills and Eggleston Roads
The Australian National University
Canberra ACT 0200
T: +61 2 6125 0766
F: +61 2 6125 2254
W: www.anu.edu.au/aphcri
The research reported in this paper is a project of the Australian Primary Health Care Research Institute, which is supported by a grant from the Australian Government Department of Health and Ageing under the Primary Health
Care Research, Evaluation and Development Strategy. The information and opinions contained in it do not necessarily reflect the views or policies of the Australian Government Department of Health and Ageing.
This research was conducted in collaboration with the Robert Graham Center for Policy Studies, Washington DC.
The support, guidance, instruction and time invested by the staff and directors has been invaluable not only for the duration of the fellowship, but will continue to be so personally and professionally in the future. In particular I wish
to thank Dr Stephen Petterson, Dr Imam Xierali, Mark Carozza, Dr Andrew Bazemore and Dr Bob Phillips for the many hours spent in bringing this work together.

AUSTRALIAN PRIMARY HEALTH CARE RESEARCH INSTITUTE
3 __________________________________________________________________________________________________
EXECUTIVE SUMMARY Of increasing preeminence in international discourse is the social gradient of health and health care access inequity and the crucial role that primary health care has in addressing this. Further is the recognition that there is a need to include a measure of the social determinants of health in health planning and resource allocation.
The United States and Australia are currently in the midst of significant health reform. Key themes in Australia are access and equity, the role of primary health care and systems of data collection and dissemination. In the US, affordable universal health insurance is resolutely on the agenda. Reviews of US designations for resource allocation are looking to incorporate measures of social deprivation and health need to plan services more equitably. Access and equity are common research themes for the Australian Primary Health Care Research Institute (APHCRI) and the Robert Graham Center for Policy Studies in the US.
Small area measures of socioeconomic deprivation have been developed for the United Kingdom, New Zealand and Australia. In the US, there are efforts to develop small area measures of socioeconomic status, but these are limited to certain states only. Small area measures capture compositional and contextual elements of an area. Selection of variables for inclusion is conceptually driven, informed by the literature and generally limited to what is available in the relevant country’s national census. The UK and New Zealand have made extensive use of these for health inequality monitoring, research and health planning and resource allocation. There is limited experience with respect to this in Australia and the US.
Other elegant models for determining health care need and access have been developed which combine measures of workforce supply, geography, socioeconomic deprivation, and health outcomes. These have the potential to be powerful tools in targeting resources where they are most needed.
In the US, current designation systems for health resource allocation are primarily based on workforce shortages, with limited investment of resources to overcome this inequity. In Australia, targeting resources and generous incentives to address the workforce maldistribution is primarily based on remoteness areas. Both continue to experience maldistribution of workforce, and inequity in health status and health care access.
During this travelling fellowship, models of determining health need and primary health care access were developed that specifically incorporated a measure of socioeconomic deprivation. For the US context, a social deprivation measure at the level of the primary care service area (PCSA) was developed and shown to be associated with measures health care need and access. For the Australian context, a composite measure of disadvantage incorporating workforce supply, remoteness and socioeconomic disadvantage was developed and demonstrated to be predictive of mortality, risk behaviours and disease morbidity. Both measures can be mapped, to enable immediate visualisation of areas most in need.
Unique to this visiting fellowship, was the availability of spatial and health data. This enabled the creation of an Australian mapping tool within the geographical information system (GIS) software used by the Robert Graham Center, HealthLandscape™. It is increasingly recognized that GIS has the potential to be a powerful tool in primary health care policy, planning and research. Within Australia, expertise in this area is developing but hindered by a lack of coordination, duplication, costly data access systems and patchy skill sets. The development of a mapping tool for Australia within HealthLandscape™ and the associated analyses adds to the growing evidence of the value of spatial epidemiology and GIS in primary health care policy. There is a need to further develop this field through increased collaboration, data sharing and advancement in technology and expertise. The experience of the Robert Graham Center as a center of excellence in geospatial analysis, established around a web based tool that has served as a ‘data magnet’ and central focus for collaboration between decision makers, academia, clinicians and communities is a powerful model that Australia would do well to seek guidance from.

AUSTRALIAN PRIMARY HEALTH CARE RESEARCH INSTITUTE
4 __________________________________________________________________________________________________
ACKNOWLEDGMENT ................................................................................................................... 2 EXECUTIVE SUMMARY ............................................................................................................ 3 SECTION ONE: INTRODUCTION .............................................................................................. 6
1.2 HISTORICAL OVERVIEW OF THE FELLOWSHIP ........................................................................ 6 1.3 INTERNATIONAL POLICY ENVIRONMENT ................................................................................ 6 1.4 US POLICY CONTEXT ............................................................................................................ 6 1.5 AUSTRALIAN POLICY CONTEXT ............................................................................................. 7 1.6 GIS AND PRIMARY HEALTH CARE .......................................................................................... 7
SECTION TWO: SMALL AREA MEASURES OF SOCIOECONOMIC DEPRIVATION FOR HEALTH MONITORING AND INTERVENTION ....................................................................................... 10
2.1 NEW ZEALAND: .................................................................................................................. 11 2.2 ENGLAND ........................................................................................................................... 11 2.3 AUSTRALIA ........................................................................................................................ 13 2.4 THE UNITED STATES .......................................................................................................... 13 2.5 OTHER MEASURES/MODELS: ............................................................................................... 15 2.6 KEY FINDINGS: ................................................................................................................... 17
SECTION THREE: MEASURES OF SOCIAL DEPRIVATION FOR DETERMINING PRIMARY HEALTH CARE NEED AND ACCESS IN THE US ..................................................................................... 18
3.1 POLICY CONTEXT ............................................................................................................... 18 3.2 DEFINING HEALTH CARE ACCESS AND NEED ........................................................................ 18 3.3 CURRENT US CIRCUMSTANCE ............................................................................................. 18 3.4 CREATING A SOCIAL DEPRIVATION MEASURE AT THE LEVEL OF THE PCSA ............................ 19 3.5 METHODOLOGY .................................................................................................................. 19
Data Sources: ..................................................................................................................... 19 Study Design: ..................................................................................................................... 20
3.6 RESULTS ............................................................................................................................ 20 3.7 DISCUSSION ...................................................................................................................... 22 3.8 LESSONS LEARNED ............................................................................................................. 23 3.9 FUTURE DIRECTIONS .......................................................................................................... 23
SECTION FOUR: MEASURES OF SOCIOECONOMIC DEPRIVATION FOR DETERMINING PRIMARY HEALTH CARE NEED IN AUSTRALIA ...................................................................................... 24
4.1 POLICY CONTEXT AND BACKGROUND .................................................................................. 24 4.2 USING THE AUSTRALIAN MAPPING TOOL FOR WORKFORCE SPATIAL ANALYSES .................... 25 4.3 METHODOLOGY: ................................................................................................................. 26
Data Sources: ..................................................................................................................... 26 Study Design: ..................................................................................................................... 27
4.4 FINDINGS: ......................................................................................................................... 27 4.5 DISCUSSION: ..................................................................................................................... 30 4.5 KEY FINDINGS: SUMMARY: ................................................................................................. 31
SECTION FIVE: SUMMARY AND RECOMMENDATIONS ............................................................ 32 5.1 SUMMARY OF FINDINGS ..................................................................................................... 32 5.2 FUTURE DIRECTIONS: ........................................................................................................ 32
Further Research ................................................................................................................ 32 Further Collaboration .......................................................................................................... 33 GIS and Australian Primary Health Care research and policy ................................................... 33
REFERENCES: ...................................................................................................................... 35 APPENDIX A: ........................................................................................................................ 39

AUSTRALIAN PRIMARY HEALTH CARE RESEARCH INSTITUTE
5 __________________________________________________________________________________________________
APPENDIX B : ....................................................................................................................... 45
List of Tables
Table 2.1: UK social Deprivation scores and their variables ................................................................... 12 Table 2.2: Summary Table of Social Deprivation Measures by country ................................................... 15 Table 3.1 : Rotated factor analysis of population weighted variables .................................................... 20 Table 3.2 : Scoring coefficients for single composite social deprivation measures ................................... 21 Table 3.3 : Pair wise correlation analysis of Composite Social deprivation measure, three inherent factors, and measures of health care access, workforce, and rurality. ...................................................................... 22 Table 4.1 : Bivariate analysis of SLAs of remoteness areas compared with IRSD score reversed. Total number of SLA given, as well as percent in each remoteness area lies in IRSD quintile ........................................... 27 Table 4.2 : Bivariate analysis of SLAs of remoteness areas compared with IRSD score reversed. Total number of SLA given, as well as percent in each remoteness area lies in IRSD quintile, expressed as population numbers ...................................................................................................................................................... 28 Table 4.3 : Regression analysis weighted to total population, without percent indigenous ....................... 28 Table 4.4: Regression analysis weighted to total population, with percent indigenous ............................. 29 Table 4.5: Pair wise correlation matrix of composite score, health outcomes and percent indigenous All p>0.001 except *p=0.5 ................................................................................................................................. 29 Table A1: NZDep- Weights on the first principal components for 2006 and 2001 .................................... 39 Table A2: Weighting for ID 2007 ....................................................................................................... 39 Table A3: Index of Relative Disadvantage for Australia, variables and weights ....................................... 40 Table A4: In depth Summary Table of Social Deprivation scores ........................................................... 41
List of Figures
Figure 1.1 Page as seen on HealthLandscape™ website. Image of total health Workforce per 10000 population with remoteness areas. ....................................................................................................................... 9 Figure 1.2: Total Health Workers per 10,000 population with Division of GP Boundary lines (blue line and label), and point data for Medical Schools (Green diamond) ............................................................. 9
Figure 2.1: Fields’ model of relative disadvantage. ............................................................................... 16 Figure 4.1: Medical workforce per 10,000 by SLA and remoteness areas ............................................... 25 Figure 4.2: Index of Relative Disadvantage by SLA and remoteness areas ............................................. 26 Figure 4.3: Medical Workforce per 10000 (left) and Index of relative disadvantage (right) for outer metropolitan areas of Sutherland and Campbelltown. .......................................................................... 26
Figure B1: Model of access ................................................................................................................ 45

AUSTRALIAN PRIMARY HEALTH CARE RESEARCH INSTITUTE
6 __________________________________________________________________________________________________
SECTION ONE: INTRODUCTION
1.2 HISTORICAL OVERVIEW OF THE FELLOWSHIP This is the third visiting fellowship to be funded by the Primary Health Care Research Institute (APHCRI) to undertake a primary health care policy and research immersion experience with the Robert Graham Center for Policy Studies (Robert Graham Center) in Washington DC. The first visiting fellow explored the use of Geographical information systems (GIS) in primary health care policy, with specific reference to the web based tool, HealthLandscape™, developed by the Robert Graham Center. The second fellow, conducted a five country comparison of workforce shortage and need definitions and policies to address primary health care workforce distribution.
What had struck me whilst training as a general practice registrar largely in Indigenous Health in rural and remote Northern Territory, was that in addition to ‘tyranny of distance’ there was a multitude of cultural, social, financial and environmental factors that impeded access to and provision of good quality care. Further, it seemed that the structures and processes at a systemic level often exacerbated these barriers. I began to question how the ground level experience of those delivering and receiving health care could be harnessed to inform decision makers and policy development. Health equity and primary health care access are common domains of research interest to APHCRI and the Robert Graham Center. The proposed purpose of the third visiting fellowship was to examine this issue, building on the work of the previous fellows and with a focus on the social determinants of health and access.
This report will begin with outlining the current policy context and its relevance to equity and access and describe recent developments of building an Australian mapping tool within HealthLandscape™ (section one). It will then explore in greater depth the use of socio-economic deprivation measures internationally in health policy (section 2), and describe two analyses exploring the use of such measures in determining health need and health care access, in the United States (US) (section 3) and Australia (section 4). The final section will summarize lesions learned and future directions for Australia and the US based on this work.
1.3 INTERNATIONAL POLICY ENVIRONMENT The clearly documented social gradient of health and health care access between and within countries, and the role primary health care has in overcoming this has become of pressing importance in international health discourse (WHO, 2008a,b, Banks et al., 2006, Schoen et al., 2009, Radford, 2009, Harris and McDonald, 2009). In 2008, the world health organization reiterated the central role of social determinants of health, first articulated at Alma Ata in 1976, and the need to include some measure of this in allocation and planning of health resources (WHO, 2008a). Priorities are turning to how those most in need but suffering the poorest health outcomes can be identified, such that services can be targeted more equitably.
1.4 US POLICY CONTEXT It is well recognized that despite spending the most per capita on health compared with other OECD countries, the US has the poorest health outcomes and the greatest inequity in health and health care access (Schoen et al., 2009, Banks et al., 2006). The US system is heavily privatized, with availability of health insurance a key barrier to accessing health care. Like other OECD countries there is a significant maldistribution of workforce, with a lack of physicians in rural areas, and poor urban areas. Compounding this is a workforce heavily weighted to sub-specialties with a subsequent shortage of family and primary care physicians (adult general internal medicine and paediatrics also contribute to the primary care workforce).
A change of administration in the US has resulted in the return of the health reform agenda as a matter of priority. Central to this has been the proposition of affordable universal health insurance either government funded, private or a mixture. The bill for this has been passed in Congress and the Senate, and the two bills are now in the process of being consolidated for a
AUSTRALIAN PRIMARY HEALTH CARE RESEARCH INSTITUTE
7 __________________________________________________________________________________________________
final vote. How well the final bill will meet the original intention and vision is of debate. Regardless, having some form of accessible, affordable universal health insurance will result in marked change in the US health landscape.
A key theme of discussion within the US health sector has been revising designation systems for resource allocation, which currently use physician workforce shortages for identifying areas of need. Proposed revisions were intended to better account for the health needs of a population based on demographics and socioeconomic status, with the view to enabling more equitable distribution of resources (Ricketts et al., 2007). The issues and limitations of this are discussed in further detail in section 3.
Another theme of discourse, particularly in primary health care policy, is determining the geography of a rational service area on which to base policy and resource allocation decisions (Goodman and Wright-Slaughter, 2004). The concerns are that current geographies are not continuous and do not adequately capture the needs or the service use patterns of populations. A more rational service area is needed to ensure that resources can be targeted to where they are needed most.
1.5 AUSTRALIAN POLICY CONTEXT Australia is in the midst of health care reform, and central to this is the role of primary health care. Key agenda identified in the final report by the National Health and Hospital Reform (2009) commissions were to:
‘Tackle the major access and equity issues that affect people now; Redesign our health system to meet emerging challenges; and create an agile, responsive and self-improving health system for future generations.’
The five priority areas for access and equity are Aboriginal and Torres Strait Islander people, mental health, rural and remote areas and dental services (NHHRC, 2009). The inverse care law is well recognized within the Australian health system such that those most in need, for example Indigenous Australians, those living in rural and remote areas, migrants and low income adults, have the least access to health care services (Harris and McDonald, 2009, Schofield et al., 2008).
The recent National Primary Health Care Strategy’s (NPHC) identified the following priority areas for change:
• improving access and reducing inequity;
• better management of chronic conditions;
• increasing the focus on prevention; and
• improving quality, safety, performance and accountability.
The National Preventative Health Strategy (NPHS) highlights that there is a social gradient in the determinants of obesity, tobacco and alcohol. Addressing workforce maldistribution resulting in shortages in rural and remote and urban disadvantaged areas, is recognized by the PHCS as necessary to improve access and reduce inequity.
All three strategies emphasize that having systems of data collection and dissemination is crucial to measuring how Australia’s health system is progressing on tackling health inequity. Further, development of tools and resources are necessary to better understand the risk profile of our communities, target services and monitor and sustain improvements over time.
1.6 GIS AND PRIMARY HEALTH CARE Increasingly, spatial analysis and GIS is being used in primary health care to address issues of identifying need, monitoring impact and responding to the changing needs of our society (Schofield et al., 2008, Bazemore et al., 2010 a,b, Grinzi, 2007, McGrail and Humpreys, 2009, Wang and Luo, 2005). Within Australia, the Public Health Information Development Unit (PHIDU) has developed an interactive web based mapping tool, which allows display of social
AUSTRALIAN PRIMARY HEALTH CARE RESEARCH INSTITUTE
8 __________________________________________________________________________________________________
and health indicators available from their online atlases. However, data is not able to be layered in order to examine geographical relationships between data variables, nor is there a facility for individual users to upload their own data. The Adelaide Western Division of General Practice has developed a decision support tool called Practice Health Atlas™ that comprises 3 elements: epidemiology, clinical and business modelling systems and access to services (Del Fante et al., 2006). Data is retrieved from individual practices, compared with epidemiological data, and a report produced for the practice concerned. There is no facility for accessing this data online or for individual practices to upload data in order to conduct their own analyses. The Department of Health and Ageing (DoHA) also has a unit working on GIS and health, but this work is not currently publicly available (Grinzi, 2007).
HealthLandscape™ is an interactive online mapping tool, using GIS software, which allows users to display a range of health and population related data geographically in order to describe and analyse relationships geo-spatially. There are four modules allowing exploration of different areas of primary health care. Users of this tool range from policy makers and planners, medical schools, academics, individual practices and community health centres. HealthLandscape™ has the added advantage in that users are able to upload their own data in a secure environment as well as use the databases already available. Addressing issues relating to the primary health care workforce, and its relationship to medically underserved areas has been a significant component of the work conducted by the Robert Graham Center. HealthLandscape™ has been used to better understand this relationship (Bazemore et al., 2010a.b, RGC Annual Report, 2008).
Previous to the stream 15 visiting fellowship there had been no facility within HealthLandscape™ to interact with Australian data to explore spatial relationships and create maps. On this visit, much of the previously unavailable data was now accessible. This included digital boundary definitions of the Australian Bureau of Statistics (ABS) and other geographical areas, freely available base maps (Google maps etc), and health and sociodemographic data at the statistical local area (SLA) level, made available from the PHIDU.
In collaboration with a Robert Graham Center geographer and the HealthLandscape™ specialist, an Australian mapping tool was created within HealthLandscape™. A base map from Google maps was used, with policy relevant geographical layers such as the Australian Standard Geographical Classification Remoteness Areas (ASGC-RA) and Divisions of GPs (sourced from the ABS website), and point data relating to medical school locations and humanitarian immigrants’ SLA of residence. Humanitarian arrival numbers by SLA were provided by Department of Immigration and Citizenship settlement report services. Each SLA with at least one humanitarian immigrant had a point assigned. Latitude and longitude data for each medical school was sourced by a search of the internet and using Google Earth to determine coordinates.
Health, socioeconomic data and workforce data layers were sourced from the Social Health Atlas, 2008 which is compiled by PHIDU. This is at the SLA level, although due to low numbers, some areas have been aggregated to ‘SLA groups’. Specific data included:
• Health workforce data-census 2006, by SLA of residence for total health workforce, total medical workforce, nursing workforce per 10,000 population. This data is head counts only, not full time equivalents (FTE) or full time workload equivalents (FWE).
• Diabetes standardised rate, one of four risk factors (obesity, physical inactivity, smoking or harmful alcohol consumption) rate per 1000 population and standardised rate from National Health Survey 2004-2005. Note, remote areas are not included in this survey and hence rates are not available for these areas.
• Avoidable mortality standardised rate (compiled by Prometheus from 2002-2006 census data)
• Percent indigenous status and Index of Relative Disadvantage Score (census 2006)
All health and demographic data was geocoded in ArcView software and then uploaded to the HealthLandscape™ interface. This map is available at

AUSTRALIAN PRIMARY HEALTH CARE RESEARCH INSTITUTE
9 __________________________________________________________________________________________________
https://www.healthlandscape.org/hlapps/aus01/#app=c86&eb5e-selectedIndex=0
Below gives a demonstration of how it appears on the website, with policy relevant layers and point data layers.
Figure 1.1 Page as seen on HealthLandscape™ website. Image of total health Workforce per 10000 population with remoteness areas.
Legend for remoteness areas Speckled=Inner regional, horizontal lines-outer regional, diagonal lines= remote, vertical lines=very remote. Major cities unable to be seen this magnification
Figure 1.2: Total Health Workers per 10,000 population with Division of GP Boundary lines (blue line and label), and point data for Medical Schools (Green diamond)

AUSTRALIAN PRIMARY HEALTH CARE RESEARCH INSTITUTE
10 __________________________________________________________________________________________________
SECTION TWO: SMALL AREA MEASURES OF SOCIOECONOMIC DEPRIVATION FOR HEALTH MONITORING AND INTERVENTION Internationally, to encompass a measure of socioeconomic disadvantage or deprivation in health planning and policy, efforts have turned to developing small area measures of socioeconomic deprivation. Inherent to small area measures is that they capture the personal and contextual components that influence social deprivation. Townsend (1987) lay much of the foundation work of this area. He clearly defines the concept of material and social deprivation, and emphasises that deprivation and poverty are not one in the same, but rather people can be considered to be in ‘poverty if they lack the resources to escape deprivation’. Townsend asserts that not all who suffer deprivation will be in poverty, but those who experience multiple deprivations almost certainly will be.
An index of socioeconomic deprivation for small areas has been developed by New Zealand (NZDep2006), England (ID2007) and Australia (Index of Relative Disadvantage, IRSD from SEIFA 2006). None currently exists for the United States. Domains captured in the indices include income, employment, education, social capital and housing. Selection of variables for inclusion in the indices is conceptually based, informed by the literature, and generally limited to what is readily available at the small area level in national census databases. The variables are then combined through factor analysis or principle components analysis to create weights. Factor analysis assumes a common dimension (unobserved) underlying all variables, and creates a summary measure to capture this commonality. This requires variables to be correlated and it is this degree of correlation which factor analysis is trying to capture. The weighted values for an area are combined to create a single score. It is important to recognise that these measures describe relative rather than absolute deprivation (Crampton et al, 1997, Adhikari, 2008, Noble et al., 2008). The geographies derive from the smallest census unit for that country, which creates a basic building block for administratively relevant geographies. All indices from each country are adjusted to reflect the age and gender distribution of the population.
Validation has been primarily through demonstrating expected associations and gradients with health status (Crampton et al., 1997, White et al., 2008, Adhikari, 2008) and service utilization (Crampton et al,1997), and with other measures of socioeconomic status such as smoking (White et al., 2008, Adhikari, 2008). The NZDep and IRSD have been demonstrated to have clear associations with mortality and morbidity, health service (particularly primary health care) utilization, emergency presentations, self reported health status, mental health, obesity and smoking (Crampton et al, 1997, Crampton et al, 2000a,b, White et al., 2008, Adhikari, 2008, Yu et al., 2000, Glover et al., 2004, Adams et al., 2009). The Australian index (IRSD) has also been assessed for acceptance within the general community (Walker and Hiller, 2005).
The English index is unique in that includes measures relating to health status, service utilization, environmental deprivation and crime. The source of data for each of the variables (38 in total), are more complex and much research has been conducted to inform many of these measures (ID 2007 report). Similar indices have been developed by the same group for Scotland, Wales and Ireland, with adjustments to account for specific differences for each country (SIMD, 2009).
All three socioeconomic deprivation indices have been used in health monitoring and research. NZDep and ID2007 have been used for bench marking, funding formulas and incentive programs in primary health care (White et al., 2008, Noble et al., 2008). There has been discussion regarding using measures of socioeconomic status for funding and benchmarking in Australia, but this is yet to be put into practice.
Small areas measures of social deprivation are not without limitation. The potential for ecological fallacy exists, as one cannot attribute elements of an area to the individual. Research has demonstrated that the correlation between area level and individual level measures of deprivation are weak (Salmon and Crampton, 2001). A further study

AUSTRALIAN PRIMARY HEALTH CARE RESEARCH INSTITUTE
11 __________________________________________________________________________________________________
demonstrated that there was significant heterogeneity within small areas, and hence one can not assume the characteristics of individual reflect that of an area and vice versa (Salmond and Crampton, 2002). In addition, the small areas boundaries used do not necessarily define areas that are populated versus non residential areas, which can result in visual assumptions when mapped.
The following outlines in further detail each of the indices for New Zealand and the United Kingdom (as examples of the most developed and most applied to health policy), the Australian SEIFA measures, the current state of play for small areas measures of socioeconomic disadvantage in the US, and other novel small area measures for health that incorporate elements of social deprivation. An in-depth overview table of the International indices is included in appendix A
2.1 NEW ZEALAND: Name and History: NZDep, first created in 1991, most recently updated 2006, the authors are primarily Peter Crampton and Clare Salmond
Website: http://www.wnmeds.ac.nz/academic/dph/research/socialindicators.html
Construction: Principle component analysis, mean of 1000 with a standard deviation of 100, score standardized for age and gender see appendix A for weights.
Geography: Meshblock basic unit, contains 100 people per block, giving a total of 23,786 small areas
Domains and variables included: Nine variable covering eight domains (see table A1, appendix A). Selection determined conceptually and on the basis of availability in the census.
Validation: Initial studies 1991-2000, validated against mortality and hospital utilization. Subsequent validation against smoking rates (Crampton et al., 1997, White et al, 2008).
Use in primary health care policy and public health There has been extensive research using NZdep. Associations demonstrated with mortality, lung cancer, SIDS, mortality due to injury, mortality due to diabetes, chronic lung disease, ischaemic heart disease and more (Crampton et al, 1997, White et al, 2008). Also associated with; cardiovascular risk factors, primary care utilization (mainstream and third sector -White et al., 2008, Crampton et al., 2000b) and organizational aspects of primary health care (Crampton et al., 2000a). Used for funding formulas for district health boards (White et al., 2008) and capitation schemes for primary health services (White et al., 2008, Langton and Crampton, 2008).
2.2 ENGLAND Name and History: Index of multiple deprivation (ID2007), first version constructed in late 1980s (Townsend, 1987, Carstairs, 1995). See the following table comparing the early measures.

AUSTRALIAN PRIMARY HEALTH CARE RESEARCH INSTITUTE
12 __________________________________________________________________________________________________
Table 2.1: UK social Deprivation scores and their variables (Dolan et al., 1995, Carstairs,1995)
Townsend Score
Carstairs Score
Jarmen underprivileged score
Unemployed males Households not owner occupied Households without a car Household overcrowded
Unemployed males Residents in households headed by unskilled Residents without a car Residents overcrowded
Elderly living alone Age under 5 years Unskilled workers Unemployed One parent families Overcrowded Migrants Ethnic minorities
The work by Fields (2000) represents the initial expanded version of the ID, containing multiple domains, not just social deprivation. Noble and colleagues, at the Social Disadvantage Research Center, University of Oxford, have been the primary developers of the current ID2007, with the first major review and public consultation in 2004. Similar indices have been developed for Ireland, Scotland and Wales.
Website:
http://www.communities.gov.uk/communities/neighbourhoodrenewal/deprivation/deprivation07/
Construction: Within domains shrinkage estimation is used if numbers are small. Rates calculated within domains if comparable units, otherwise maximum likelihood factor analysis undertaken to assign weights and develop a single score for the domain. For combination of domains, each score was ranked then these transformed to exponential distribution. Weights were constructed (based on theoretical considerations, and confirmed by empirical research, see appendix A) (Nobel et al., 2004, 2007)
Geography: Lower layer super output areas (LSOA) Total 32482 LSOAs in England, with a minimum population of 1000, mean of 1500.
Domains and variables included: The selection of variables is primarily theoretically driven, and based on public consultation. Data is derived from a variety of sources, with significant empirical research behind the development of the indices. Domains include income; employment; health and disability; education, skills and training deprivation; living environment deprivation; and crime. The seven domain indices, the overall index of multiple deprivation, and two supplementary indices of income are produced for each area. All areas are given a rank and a score, with a higher score indicating more deprivation.
Validation: Carstairs, Townsend and the Jarmen score were initially shown to have a strong association with mortality (Carstairs, 1995). Validation has subsequently been primarily through a process of consultation, which occurs on a regular basis since the ID was first developed in 2000 (personal communications).
Use in primary health care policy and public health The Income Deprivation Affecting Children index is used for funding formulas for primary care trusts and the ID2007 is used directly for capitation funding for primary care directly payable to GPs (DH, 2008, Bakejal et al., 2001). It is also used in bench marking, with targets measured against improving mortality, morbidity, and improvement in ID 2007 (DH, 2009)
AUSTRALIAN PRIMARY HEALTH CARE RESEARCH INSTITUTE
13 __________________________________________________________________________________________________
2.3 AUSTRALIA Name and History: The socioeconomic index of Australia (SEIFA) for small areas. This has been developed through the Australian Bureau of Statistics, the first in 1990, with the most recent in 2006.
Website: http://www.abs.gov.au/websitedbs/D3310114.nsf/home/Seifa_entry_page
Construction: Using principle component analysis, weights are determined and assigned to each variable (see appendix A Table A3). Each small area is assigned a score, rank and decile. The scores have a mean of 1000, standard deviation of 100, and the lower the score the greater the disadvantage.
Geography: Census collection district (CCD) level=250 households. There are a total of 38, 704 CCD. The next level up the statistical local area (SLA) has a total of 1,389
Domains and variables included: Selection of variables for inclusion is conceptually driven. Four indices have been developed, the index of relative disadvantage (IRSD), the index of relative disadvantage/advantage (IRSAD), Index of economic resources and the index of education and occupation distribution. The IRSD is most commonly used. Variables are derived from the census.
Validation: Validation based on face (Walker and Hiller, 2005), content (academic opinion) and construct validity (Adhikari, 2008). Construct validity refers to the association of the IRSD with mortality (Yu et al., 2000), chronic illness and chronic disease risk factors (Glover et al., 2004), and using the National Health Survey all SEIFA indices have been demonstrated to be associated with self reported poor health, smoking, mental health and obesity (Adhikari, 2008).
Use in primary health care policy and public health As described above the IRSD has been used for health inequality monitoring. The IRSD has also been demonstrated to be associated with indigenous status and remoteness (Wilkinson et al., 2001). The indices, as far as the author is aware, are not currently used in policy or resource allocation. A limitation of these indices is that although valuable they can potentially hide inequalities within subgroups, if the overall score only is used. A particularly pertinent example of this is demonstrated in a study in 2004, which constructed an IRSAD for Indigenous and non indigenous populations in the same areas (Kennedy et al., 2004). The indigenous group had significantly lower scores, an effect lost when the overall score only was used
2.4 THE UNITED STATES Currently there is no national small area measure of socioeconomic deprivation in use for health inequality monitoring or resource allocation and planning. The Public Health Disparities Geocoding Project aims to identity area based socioeconomic measures (ABSMs) for monitoring of health disparities. However, this is for Massachusetts and Rhode Island only. This work and others has clearly demonstrated the relationship between socioeconomic disadvantage and poor health outcomes in the US (Krieger et al., 2005, Sorlie et al., 2005, Ross et al., 2000). Medically underserved areas (MUA) designations include a single measure of poverty as well as infant mortality and percentage of those greater than 65 years of age. The following examines the ABSMs developed by the Geocoding project.
Name and History: ABSMs, first developed in 1999
Construction: Single measures based on thresholds and policy relevant categories. Composite scores used factor analysis to select variables then combined by summing the z-scores.

AUSTRALIAN PRIMARY HEALTH CARE RESEARCH INSTITUTE
14 __________________________________________________________________________________________________
Geography: Census tract and block groups. Census tract contains approximately 4000 population.
Domains and variables included: Variable selection is conceptually driven and based on previous work. Combination of a) 11 single measures for example poverty and b) 8 Composite measures, including a Townsend measure and created socioeconomic position index (SEPI) based on the Townsend methodology, and Carstairs index. Domains reflected in the measures include occupational class, income, poverty, wealth, education and crowding. Data is derived from census data, health data from birth and death certificates, and health surveillance data from Massachusetts and Rhode Island.
Validation: Based on Rossi and Gilmartin criteria for valid and useful social indicators. That is: do the measures find gradients in the direction reported in the literature (external validity), do the measures detect the expected gradients across a wide range of outcomes (robustness) and are measures relatively unaffected by missing data. Generally all measures demonstrated expected gradients in the expected directions (Krieger et al., 2002, 2003, 2005).
Use in primary health care policy and public Health: There has been extensive documentation of health inequality in Massachusetts and Rhode Island (Krieger et al., 2002, 2003, 2005). This work has demonstrated that that measures of poverty and the Townsend index is most sensitive to expected socioeconomic gradients in health (Krieger et al., 2003). None of these measures are currently used in primary health care policy.

AUSTRALIAN PRIMARY HEALTH CARE RESEARCH INSTITUTE
15 __________________________________________________________________________________________________
Table 2.2: Summary Table of Social Deprivation Measures by country
2.5 OTHER MEASURES/MODELS: These have developed to incorporate a number of elements in defining health care access and need, including geographical, current health status and socioeconomic measures in creating their index.
Field (2000) was the forerunner for this work. He developed and conducted a survey to identify relevant socioeconomic variables relating to access, utilisation measures and personal mobility, resulting in the subsequent model.
Country Methods Validation Use in Policy Geographical Variation
New Zealand
Principle component analysis, census variables analysed for those which explained the most variation
Against smoking, mortality, number of health indicators
Funding allocations GP capitation
Rural areas more deprived, pockets within urban areas
England Selection theoretical and based on consultation, Weights assigned based on expert opinion
Public Consultation, extensive internal validation
Funding of PCT, GP payment based on practice area, bench marking
With urbanized areas, north east region
United States
ABSMs: Theoretically driven selection of variables Composite measure: factor analysis to identify variables, sum of z-scores to create index
ABSMs Demonstrated expected SES gradients within and across ethnicities in mortality, morbidity, homicide, low birth weight
ABSMs Health monitoring and research
ABSMs Within Massachusetts and Rhode Island
Australia Principle component analysis on selected variables
Against smoking, obesity, self reported poor health, mortality Questions raised regarding applicability to indigenous population Face validity-survey of population opinion
Limited-SES benchmarking referred to in National Partnership and preventative health strategy Use in research
Pockets within urban areas-worse with regional, then improves in remote, then worse in very remote. Significant association with areas of high indigenous population
AUSTRALIAN PRIMARY HEALTH CARE RESEARCH INSTITUTE
16 __________________________________________________________________________________________________
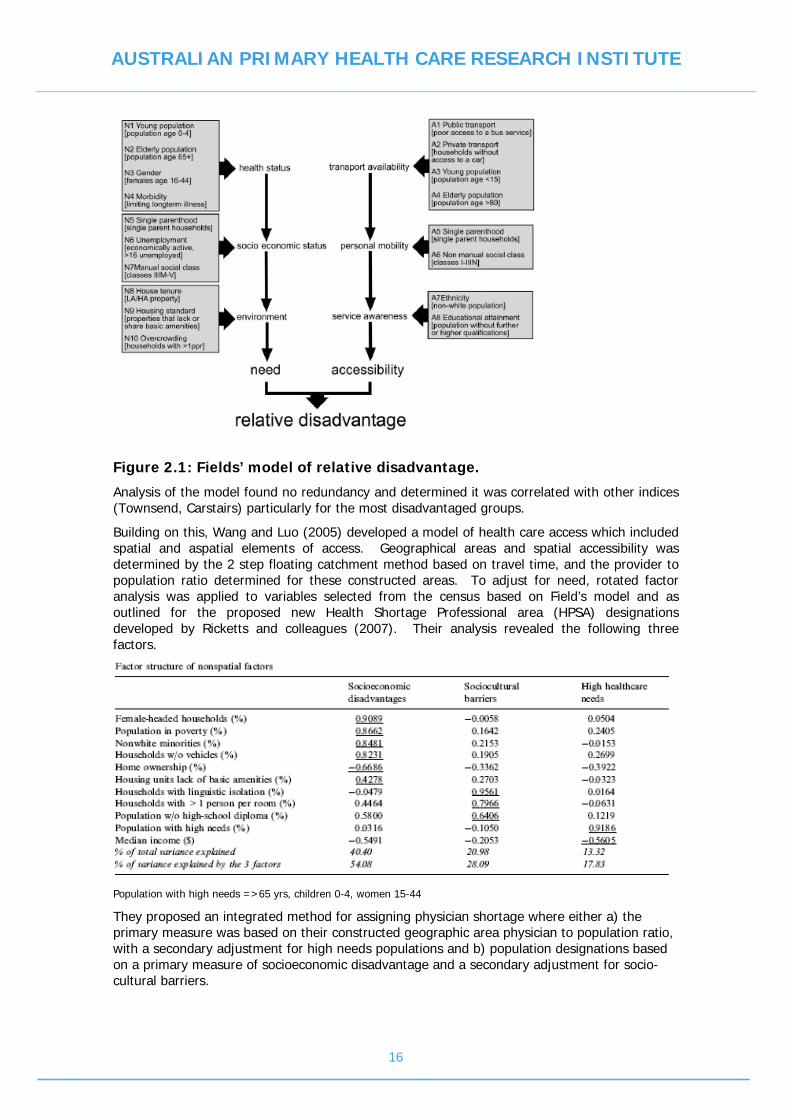
Figure 2.1: Fields’ model of relative disadvantage.
Analysis of the model found no redundancy and determined it was correlated with other indices (Townsend, Carstairs) particularly for the most disadvantaged groups.
Building on this, Wang and Luo (2005) developed a model of health care access which included spatial and aspatial elements of access. Geographical areas and spatial accessibility was determined by the 2 step floating catchment method based on travel time, and the provider to population ratio determined for these constructed areas. To adjust for need, rotated factor analysis was applied to variables selected from the census based on Field’s model and as outlined for the proposed new Health Shortage Professional area (HPSA) designations developed by Ricketts and colleagues (2007). Their analysis revealed the following three factors.
Population with high needs =>65 yrs, children 0-4, women 15-44
They proposed an integrated method for assigning physician shortage where either a) the primary measure was based on their constructed geographic area physician to population ratio, with a secondary adjustment for high needs populations and b) population designations based on a primary measure of socioeconomic disadvantage and a secondary adjustment for socio-cultural barriers.

AUSTRALIAN PRIMARY HEALTH CARE RESEARCH INSTITUTE
17 __________________________________________________________________________________________________
Recent work in Australia (McGrail and Humphreys, 2009) have taken this above model and applied it to create an index of rural access for Victoria. Spatial elements again use the 2 step floating catchment method, as well as a measure of personal mobility and access to transport. Aspatial elements included a high health needs domain, which have been selected from variables included in the IRSAD as well as additional measure such as indigenous status and literacy. These variables were regressed against disability adjusted life years (DALYs) as the dependent variable, to identify the following for inclusion in their model; %persons >15 having an advanced diploma or diploma qualification, %>15 at university or other tertiary institution, %males classified as intermediate production and transport workers, % males in labour force unemployed, % of parent families with dependent offspring only, %persons indigenous. In addition a high need group was added (0-4 male and female, 15-44 female, 65+male and female) based on previous work by Wang and Luo (2005).
Principle components analysis revealed a socioeconomic status and high needs factor, and the weights from this analysis were used for each area. Provider (General Practitioners) to populations ratios were determined based on the constructed geographical area, and an adjustment based on the socioeconomic, high health needs and mobility measures applied to assign a score of access for each area. When compared with current geographical definitions of remoteness (used for health resource allocation), significant heterogeneity was demonstrated within the remoteness areas. This index of rural access is yet to be validated.
Research has also been undertaken at the Robert Graham center to identify contextual and personal factors (relating to socioeconomic status, demographics) that contribute to access barriers. Like the work of Field, they have sought to identify these variables through an association with self reported access barriers based on the National Health Interview Survey (NHIS). Individual predictors include no health insurance, health worse than excellent, a functional limitation and being less than 65 years of age. At the census tract level, predictors include % aged less than 65 yrs, % African American, % Hispanic, % disabled, % one adult household. A number of models have been developed to create a Health Access Deprivation index (HADI) at the census tract level which can then be mapped, and hence inform policy and resource allocation decisions.
2.6 KEY FINDINGS: • Small area measures of socioeconomic deprivation capture individual (compositional)
characteristics, as well as the contextual elements of an area (eg: poor areas less likely to have resources).
• The premise is that area and individual level factors independently and jointly affect distribution of health outcomes for population
• There is a risk of ecological fallacy if area based findings are attributed to individuals and vice versa.
• Indices describe relative deprivation, not absolute. The premise is that it is the inequality or the divide of inequity that matters, rather than absolute values of social and material resources.
• New Zealand and England have well developed measure of social and multiple deprivation. These have been extensively used in primary health care research, policy and resource allocation
• Australia has a well developed index, which although used in health research has not yet been applied to policy and health planning
• A number of small area measures have been developed for 2 states in the US. Again these are yet to be applied to policy and resource allocation.
• Other research makes use of area based measures of socioeconomic deprivation and incorporates this in elegant models of health need and access. This has important implications for application to achieve equitable allocation of resources.

AUSTRALIAN PRIMARY HEALTH CARE RESEARCH INSTITUTE
18 __________________________________________________________________________________________________
SECTION THREE: MEASURES OF SOCIAL DEPRIVATION FOR DETERMINING PRIMARY HEALTH CARE NEED AND ACCESS IN THE US
3.1 POLICY CONTEXT As discussed in the introduction of this report, there is recognition internationally and in the US of the increasing health and health access inequity observed across social gradients between and within countries. Some measure of the social determinants of health needs to included in allocation and planning of health resources (Banks et al., 2006, WHO, 2008a). Health care access and equity has been a priority area of research at the Robert Graham Center. Much work has proceeded over the last few years exploring individual and ecological predictors of health care access, in an effort to bring measures of social determinants of health to the US policy table.
3.2 DEFINING HEALTH CARE ACCESS AND NEED Health care access is a complex issue and has been the subject of extensive research. Seminal work by Penchasky and Thomas (1981) define access in terms of five dimensions: affordability, availability (services and providers), accessibility (geographical), accommodation and acceptability. Other models consider access in terms of spatial (numbers of providers in an area, physical distance, rurality, and mobility of a population) and aspatial elements (socioeconomic, socio-cultural, social capital) (Hendryx et al., 2002., Wang and Luo, 2005, McGrail and Humphreys, 2009, Fields, 2000). Dixon-Woods and colleagues (2006) describe concept of candidacy, which refers to access and need as a dynamic process negotiated between individuals and health services.
Inherent to all these definitions of access and barriers to access, is that it represents a demand for a health service need that is not met. This need may be self determined, or described by morbidity, mortality or avoidable hospitalisations. A further dimension to unmet need is the observation that it is often those most marginalised and disadvantaged who suffer a greater burden of ill health and risks for ill health, yet are more likely to be unable to articulate or actualize this. Consequently, this creates a demand for more costly reactive care rather than ideal preventative care (Dixon-Woods et al., 2006).
As described in the preceding section, there has been significant attention internationally and in the US on small area measures of social deprivation for use in health research and policy to address issues of defining need and access (White et al., 2008, Noble et al., 2008, Adhikari, 2008, Krieger et al., 2002, 2003, 2005). Other work has looked at constructing measures of social deprivation and incorporating these with other measures of access and health care need to create a single index of health care access at a small area level (Wang and Luo, 2005, Field, 2000, McGrail and Humphreys, 2009). These additional measures include the number of providers for an area, the physical location and distance of services, transport availability and individual mobility, a measure of the underlying health status of the population based on morbidity data, and the gender and age structure of an area (McGrail, 2009, Wang and Luo, 2004, Fields, 2000). Geographical definitions range from complex modelling using GIS through to routinely used administrative boundaries.
3.3 CURRENT US CIRCUMSTANCE Inequity of health status and health care access is clearly documented in the US, varies along social gradients and is comparably worse than other OECD countries (Schoen et al., 2009, Banks et al., 2006). This is compounded by workforce maldistribution with a significant lack of primary care physicians, un-insurance and under-insurance, and state variation in health policy. Workforce shortages definitions are based on Health Profession Shortage Areas (HPSAs) and Medically Underserved areas (MUAs) (Lee, 2008). HPSAs are based on provider to population ratios, can be applied to areas or populations, and require the impetus of the concerned

AUSTRALIAN PRIMARY HEALTH CARE RESEARCH INSTITUTE
19 __________________________________________________________________________________________________
community or county to seek designation. MUAs include some adjustment for poverty, infant mortality rates and age distribution of the population. Currently, 30 federal programs are based on these designations ranging from funding for community health centers (CHC) and safety net clinics, incentives and allocation of National Health Service Corps positions.
Previously proposed revisions of HPSA included an adjustment for ‘health need’, based on a gender and age prediction of utilisation for a given population, and weightings based on socio-demographic, economic and health status community characteristics. These ‘characteristics’ were selected on the basis of consensus rather than empirical testing. Regressions were run against provider to population ratios and examined for effect. The intent was to create a scientifically robust measure, with face validity and acceptable performance (Ricketts et al., 2007), but was subject to political process and was largely flawed due to a failure to identify the geography to which it applied. There has also been research examining the role for small area based measures of socioeconomic disadvantage for health monitoring, but this has not yet been applied to policy (Krieger et al., 2002, 2003, 2005). There is clearly a need to incorporate a measure of social and material deprivation in health care planning in order to address health and access inequity in the United States.
Defining a rational health service area, on which to base health planning and resource allocation, has been the subject of much debate in the US. Primary Care Service Areas (PCSA) have been proposed by the Dartmouth group as a suitable rational health service geography. These areas are calculated using preference fractions based on Medicare beneficiaries resident zip code, with the plurality of care designated as the primary care service area. Areas have also been calculated based on Medicaid data, revealing larger geographical catchment areas (Goodman and Wright-Slaughter, 2004). Designations based on Ricketts proposed methodology for HPSA has also being calculated at the PCSA level. In more recent US health policy discourse is the move to affordable universal health insurance. Inequities of health and health care access faced by the most vulnerable and disadvantaged members of society will be improved, but not eliminated. Identifying those most in need and at greatest risk of poor health outcomes will be paramount and require finesse of methodology.
3.4 CREATING A SOCIAL DEPRIVATION MEASURE AT THE LEVEL OF THE PCSA Socioeconomic status, social cohesion, age and gender are associated with health outcomes. This relationship is clearly moderated by access to services. Access to services is in turn influenced by workforce supply, geography and particularly in the US setting, insurance status. Access can be measured by indirect methods such as self reported utilisation and access difficulty or by a surrogate measure such as avoidable hospitalisations. The Robert Graham center has explored this issue, unique in what it has achieved as it links predictors with national health survey reports of access barriers of delayed care and affordability. This model recognises the legitimacy of self identified access barriers and the notion that access is a process of negotiation between individuals and services (Dixon Woods et al., 2006). The following analysis intends to further this work by drawing on health care access and unmet need literature to explore the role of a social deprivation measure at the level of the PCSA and its relationship with measures of health care access and need.
3.5 METHODOLOGY Data Sources: Socio-demographic data from Dartmouth Atlas aggregated at PCSA level, derived from 2000 US Census data; Health Care Cost and Utilization project (HCUP) data for ambulatory care sensitive hospitalisations (ACSH); AMA Master file for physician data; Current Population Survey for insurance coverage and rurality measures.

AUSTRALIAN PRIMARY HEALTH CARE RESEARCH INSTITUTE
20 __________________________________________________________________________________________________
Study Design: Variables for social deprivation measure selected on basis of review of the literature and international experience, and modelled from the work of Field, 2000 and Wang and Luo, 2005. The variables included in the analysis were as follows: percent single mother households, percent population below poverty, percent Black, percent Hispanic, percent with home ownership, percent linguistically isolated, percent high school diploma not obtained, foreign born, single person households (a measure of social isolation), no car ownership, overcrowding, unemployment and a high needs measure (comprised of percent greater than 65, under 5 years, and females aged 15-44).
Factor analysis of population weighted data was used to identify factors. Factor analysis assumes a common dimension (unobserved) underlying all variables, and creates a summary measure to capture this commonality. This requires variables to be correlated and it is this degree of correlation which factor analysis is trying to capture. Factors retained as relevant based on an Eigen value greater than 1 (Wang and Luo, 2005)..
Varimax rotation was applied. This maximizes the loading of a variable on one factor and minimizes loading on all others, thereby dispersing the variables such that they commit to a one factor. Variables were then grouped according to which explained the most variation for each unobserved factor. A single composite measure for each PCSA was created by forcing analysis to a factor of one, and the weightings from the varimax rotation used for each variable in the composite score. To validate this measure, a pair wise correlation analysis was conducted between the composite social deprivation measure, and measures of health care access (insurance coverage and ACSH), workforce and rurality.
3.6 RESULTS Initial factor analysis identified three factors with an Eigen value greater than one (Factor 1=5.8, factor 2=2.23, factor 3 =1.39). The loadings of each variable on each factor is demonstrated in the varimax rotation analysis below:
Table 3.1 : Rotated factor analysis of population weighted variables
Variable Factor1 Factor2 Factor3 Single Mother Households 0.1155 0.8598 0.1495
Percent below poverty 0.2912 0.8450 0.1028
Percent Black -0.1625 0.6968 0.3173
Percent Hispanic 0.8527 0.2256 -0.1191
Home Ownership -0.5046 -0.3574 -0.7214
Percent Linguistically Isolated 0.9588 0.1455 0.1229
Less than high school Diploma 0.4158 0.6661 -0.1922
Foreign Born 0.9074 -0.0022 0.2242
High Needs Group -0.0644 0.1320 0.1854
Single person Household -0.0805 0.0019 0.8317
No Car ownership 0.2908 0.5271 0.5315
overcrowding 0.8835 0.3182 -0.0100
unemployment 0.3025 0.8201 0.0987
These three factors we believe describe the following domains:
• Sociocultural/linguistic (40% of the variance explained)- Hispanic, linguistically isolated, foreign born, overcrowding
• Socioeconomic status (36.8% of the variance explained)-single mother households, percent in poverty, percent black, no highschool diploma, unemployment
AUSTRALIAN PRIMARY HEALTH CARE RESEARCH INSTITUTE
21 __________________________________________________________________________________________________
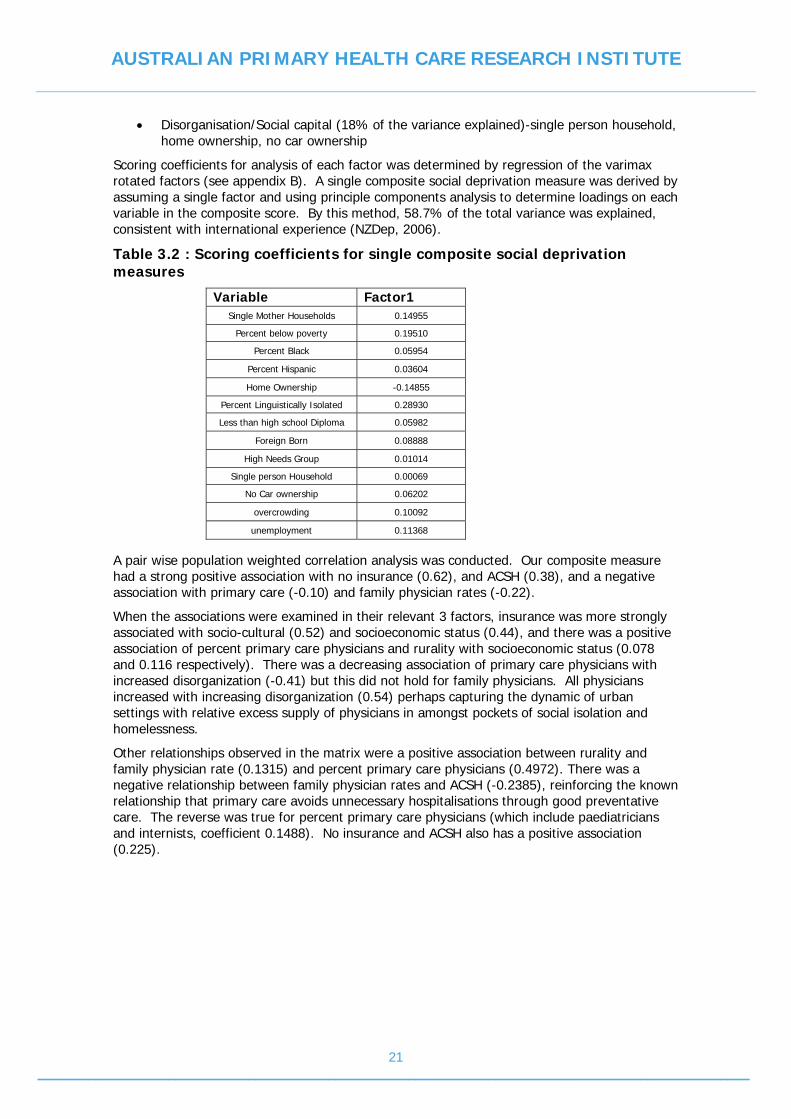
• Disorganisation/Social capital (18% of the variance explained)-single person household, home ownership, no car ownership
Scoring coefficients for analysis of each factor was determined by regression of the varimax rotated factors (see appendix B). A single composite social deprivation measure was derived by assuming a single factor and using principle components analysis to determine loadings on each variable in the composite score. By this method, 58.7% of the total variance was explained, consistent with international experience (NZDep, 2006).
Table 3.2 : Scoring coefficients for single composite social deprivation measures
Variable Factor1 Single Mother Households 0.14955
Percent below poverty 0.19510
Percent Black 0.05954
Percent Hispanic 0.03604
Home Ownership -0.14855
Percent Linguistically Isolated 0.28930
Less than high school Diploma 0.05982
Foreign Born 0.08888
High Needs Group 0.01014
Single person Household 0.00069
No Car ownership 0.06202
overcrowding 0.10092
unemployment 0.11368
A pair wise population weighted correlation analysis was conducted. Our composite measure had a strong positive association with no insurance (0.62), and ACSH (0.38), and a negative association with primary care (-0.10) and family physician rates (-0.22).
When the associations were examined in their relevant 3 factors, insurance was more strongly associated with socio-cultural (0.52) and socioeconomic status (0.44), and there was a positive association of percent primary care physicians and rurality with socioeconomic status (0.078 and 0.116 respectively). There was a decreasing association of primary care physicians with increased disorganization (-0.41) but this did not hold for family physicians. All physicians increased with increasing disorganization (0.54) perhaps capturing the dynamic of urban settings with relative excess supply of physicians in amongst pockets of social isolation and homelessness.
Other relationships observed in the matrix were a positive association between rurality and family physician rate (0.1315) and percent primary care physicians (0.4972). There was a negative relationship between family physician rates and ACSH (-0.2385), reinforcing the known relationship that primary care avoids unnecessary hospitalisations through good preventative care. The reverse was true for percent primary care physicians (which include paediatricians and internists, coefficient 0.1488). No insurance and ACSH also has a positive association (0.225).
AUSTRALIAN PRIMARY HEALTH CARE RESEARCH INSTITUTE
22 __________________________________________________________________________________________________
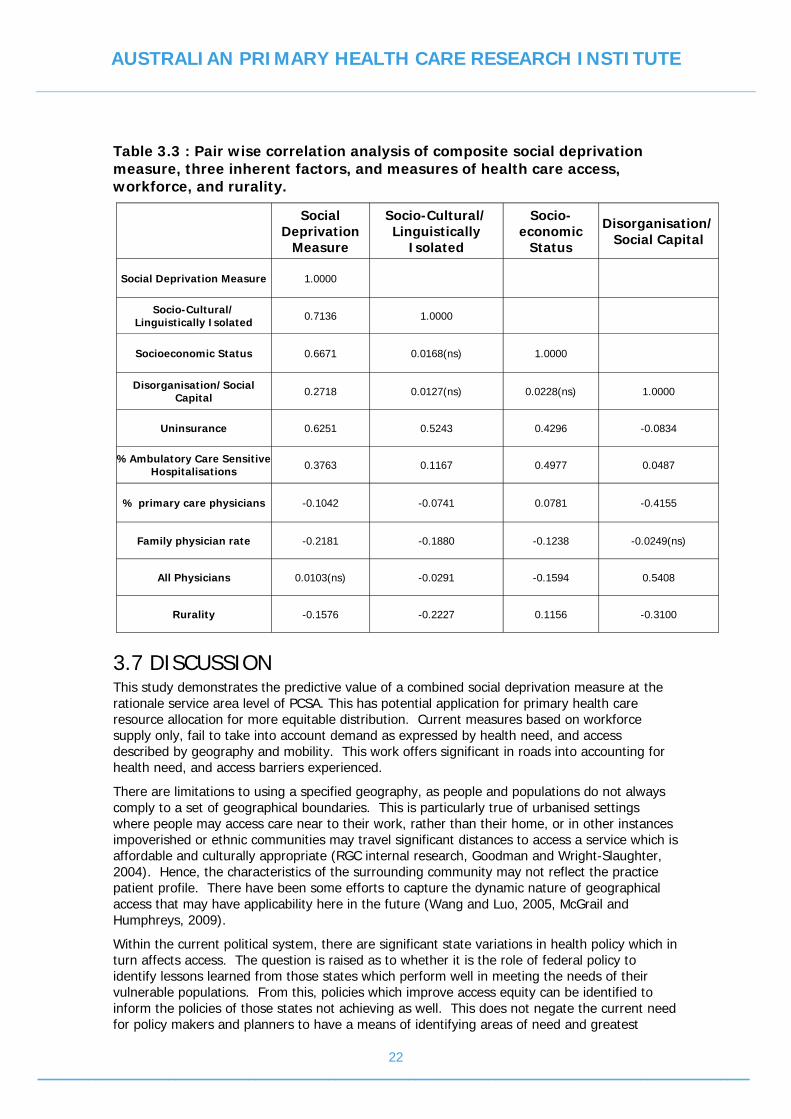
Table 3.3 : Pair wise correlation analysis of composite social deprivation measure, three inherent factors, and measures of health care access, workforce, and rurality.
Social
Deprivation Measure
Socio-Cultural/ Linguistically
Isolated
Socio-economic
Status
Disorganisation/Social Capital
Social Deprivation Measure 1.0000
Socio-Cultural/ Linguistically Isolated 0.7136 1.0000
Socioeconomic Status
0.6671 0.0168(ns) 1.0000
Disorganisation/Social Capital 0.2718 0.0127(ns) 0.0228(ns) 1.0000
Uninsurance 0.6251 0.5243 0.4296 -0.0834
%Ambulatory Care Sensitive Hospitalisations 0.3763 0.1167 0.4977 0.0487
% primary care physicians -0.1042 -0.0741 0.0781 -0.4155
Family physician rate -0.2181 -0.1880 -0.1238 -0.0249(ns)
All Physicians 0.0103(ns) -0.0291 -0.1594 0.5408
Rurality -0.1576 -0.2227 0.1156 -0.3100
3.7 DISCUSSION This study demonstrates the predictive value of a combined social deprivation measure at the rationale service area level of PCSA. This has potential application for primary health care resource allocation for more equitable distribution. Current measures based on workforce supply only, fail to take into account demand as expressed by health need, and access described by geography and mobility. This work offers significant in roads into accounting for health need, and access barriers experienced.
There are limitations to using a specified geography, as people and populations do not always comply to a set of geographical boundaries. This is particularly true of urbanised settings where people may access care near to their work, rather than their home, or in other instances impoverished or ethnic communities may travel significant distances to access a service which is affordable and culturally appropriate (RGC internal research, Goodman and Wright-Slaughter, 2004). Hence, the characteristics of the surrounding community may not reflect the practice patient profile. There have been some efforts to capture the dynamic nature of geographical access that may have applicability here in the future (Wang and Luo, 2005, McGrail and Humphreys, 2009).
Within the current political system, there are significant state variations in health policy which in turn affects access. The question is raised as to whether it is the role of federal policy to identify lessons learned from those states which perform well in meeting the needs of their vulnerable populations. From this, policies which improve access equity can be identified to inform the policies of those states not achieving as well. This does not negate the current need for policy makers and planners to have a means of identifying areas of need and greatest

AUSTRALIAN PRIMARY HEALTH CARE RESEARCH INSTITUTE
23 __________________________________________________________________________________________________
inequity within their own areas of administration-whether that is within states, within counties or smaller communities. This work has identified a comprehensive set of socioeconomic and demographic measures that can predict health and health care access deprivation at a small area level. This has the potential to facilitate policy and decision makers in weighting resource allocation equitably and enables ubiquitous designation-not just those that choose to stand up and be counted.
3.8 LESSONS LEARNED • For Australia:
o Within the current policy agenda there is the need to address equity and access, and the role of primary health care services in achieving this.
o Current incentive programs targeting workforce maldistribution are primarily based on geographical definitions. Significant willingness to align resource allocation with need has been demonstrated, but a better tool to do this is required.
• The US has a need of a better tool , but could learn from Australia’s experience in taking the steps to commit the necessary resources
• This current analysis offers a potential way forward for both countries in aligning resources with need
3.9 FUTURE DIRECTIONS • For the US model there is a potential to further validate the score by examining its
relationship with mortality and morbidity data
o Further analysis incorporating structural equations could be used to explore the relationship between social deprivation, health need, access and health outcomes (see model appendix B).
o In addition, a comparison of designations based on this model compared with HPSA designations would be of value to quantify how these compare.
• For Australia, there would be significant benefit to take this model and apply it to the Australian context, enabling a cross country comparison. The following analysis in section 4 begins an exploration of this issue

AUSTRALIAN PRIMARY HEALTH CARE RESEARCH INSTITUTE
24 __________________________________________________________________________________________________
SECTION FOUR: MEASURES OF SOCIOECONOMIC DEPRIVATION FOR DETERMINING PRIMARY HEALTH CARE NEED IN AUSTRALIA
4.1 POLICY CONTEXT AND BACKGROUND As discussed in the introduction, Australia is in the midst of significant health reform, of which equity and access, and primary health care are priority areas. The use of data and research to drive innovation, responsiveness and quality care is paramount. The issues of equity and access, and the relationship to workforce are at the core of the purpose of APHCRI and the Robert Graham Center.
Workforces shortage and maldistribution has been of significant concern within Australian health policy, as well as internationally. The previous visiting fellow examined workforce definitions and policies to address this, as a five country comparison between Australia, the US, the UK, New Zealand and Canada (Lee, 2008). Australia has the most complex and generous approach to workforce incentives (GPRIPS-DoHA, 2010, Carver, 2008). But these are almost exclusively based on geographical definitions, with no accounting for supply, socioeconomic disadvantage, health need or outcome data or natural appeal of an area (Carver, 2008, Lee, 2008). The geographical definitions are broad categories and were never intended to be used to determine workforce needs, and reliance on these fails to recognise the diversity of need and inequity of access within areas. The rural incentive program (GPRIPS) is moving to include General Practitioners (GPs) as well as registrars, and will be based on the Australian Standard Geographical Classification-Remoteness areas (ASGC-RA, 2009) as of July 2010.
Use of international medical graduates (IMGs) as for short term solution to workforce shortages was introduced in 2000, particularly in areas of geographic and specialty need (Carver, 2008). IMGs are required to work in ‘areas of workforce shortage’ which are designated by the department of health and ageing (DoHA) based on Medicare billings to calculate full time equivalent doctor to population ratios (personal communications). The designations are updated quarterly and are not available publicly. GP registrars are also required to undertake a period of training in outer metropolitan areas that have doctor shortages. Designation is also determined by DoHA and does not take into account other characteristics of the area which influence need and supply.
A study using National health survey and Medicare data from 2001, used 2 models to explore access and equity with respect to GPs, based on self reported and measured utilisation of GP services (Schofield, 2008). Both included measures of age, sex, family income, remoteness, index of relative disadvantage and either self reported health status or crude mortality rate. Overall they found that those with who are in the poorest health, are the oldest, have the lowest family income or live in the most disadvantaged communities have the highest average number of GP visits per fortnight. However, a major inequality was the observation that those living in regional and remote areas had lower rate of use of GP services than their city counterparts, yet paid more for their services (except in the most remote areas). The authors then modelled how many additional services the different regional and socioeconomically disadvantaged groups would benefit from were they to have the same profile as those in major cities. Overall, they estimated that if persons in regional areas had the same access to GP services as those in major cities, they would benefit from 8.6 million additional GP visit per year. There would also be a rise in service to Australians living in the most disadvantaged areas by 9%. Indigenous Australian were also found to experience significant inequality with 46% less expenditure per capita compared with other Australians reflecting lower GP utilisation. This study clearly demonstrates that utilisation and demand is not just a reflection of rurality, but relates to age, social deprivation, Indigenous status and health outcomes, and inequity exists along social and remoteness gradients.

AUSTRALIAN PRIMARY HEALTH CARE RESEARCH INSTITUTE
25 __________________________________________________________________________________________________
There have been some efforts to develop a means of determining need and access based in measures which include rurality, workforce, socioeconomic status and health need. A study conducted in Victoria, described previously, developed a rural access index which included measure of GP supply, geographical distance, mobility and health needs (including measures of socioeconomic status) in their calculations (McGrail and Humphreys, 2009). Again, they demonstrated significant heterogeneity within the remoteness areas based on ARIA (Accessibility remoteness index of Australia, GISCA™).
The use of remoteness areas solely in determining incentives and allocation of workforce goes some way to addressing inequity in health need and access along remoteness gradients. However, it fails to take into account other important determinants such as socioeconomic disadvantage and workforce supply. This study sought to examine at a national level the relationship between workforce supply, remoteness, social deprivation and health outcomes.
4.2 USING THE AUSTRALIAN MAPPING TOOL FOR WORKFORCE SPATIAL ANALYSES As described in the introduction, during this visiting fellowship an Australian mapping tool was developed within health landscape. The use of spatial relationships and maps is a powerful tool for understanding health and health care services issues, which enables visualization of solutions. The use of GIS in primary health care in research and directing policy has been gaining momentum in Australian (Grinzi, 2007, Del Fante et al, 2006, McGrail and Humphreys, 2009) and to a greater degree in the US (Bazemore et al, 2010a,b, Wang and Luo, 2005).
Using the Australian health mapping tooltip, initial exploration was undertaken to examine the relationship between remoteness, the index of relative disadvantage (as a measure of social deprivation) and workforce supply. If we are to take the example of an inner regional area in New South Wales as demonstrated in the map below showing rates of medical workers per 10,000 (the darker the colour pink the greater the numbers), Lithgow has fewer medical workers compared with Orange, yet fall in the same remoteness area (inner regional).
Figure 4.1: Medical workforce per 10,000 by SLA and remoteness areas
Legend: pale pink-least numbers of workforce, darkest pink-most numbers of workforce; diagonal line-major cities, speckled-inner regional, horizontal line-outer regional
When looking at the IRSD score, again Lithgow scores more poorly compared to Orange. Given that Lithgow is more disadvantaged and with lower medical workers it can be argued that resources should be targeted there, rather than having equal incentives as Orange. As mentioned in the discussion of section three, the limitation of using geographical areas with set boundaries is that populations do not always behave as through contained by these boundaries, and will cross borders to access services for a variety of reasons not just limited to geographical closeness.
Orange Lithgow Bathurst

AUSTRALIAN PRIMARY HEALTH CARE RESEARCH INSTITUTE
26 __________________________________________________________________________________________________
Figure 4.2: Index of Relative Disadvantage by SLA and remoteness areas
Legend: pale pink-most disadvantaged quintile, darkest pink-least disadvantaged quintile; diagonal line-major cities, speckled-inner regional, horizontal line-outer regional
Another example is looking at the outer metropolitan areas of Sydney. Campbelltown again experiences greater social deprivation and a lack of medical workers, yet has the same incentives and training location requirement status as Sutherland. Yet as a location to reside, Sutherland has greater appeal.
Figure 4.3: Medical Workforce per 10000 (left) and Index of relative disadvantage (right) for outer metropolitan areas of Sutherland and Campbelltown.
Legend: as per figure 4.1 and 4.2
To explore the issues demonstrated by the maps and as raised in the literature, an analysis was undertaken to examine whether measures of remoteness areas adequately capture high need populations as measured by socioeconomic disadvantage and/or physician to population ratios.
4.3 METHODOLOGY: Data Sources: The primary source of data was the Social Health Atlas of Australia, 2008. The original data sources for the variables used were as follows: Census data from 2006 for demographic, workforce data (total medical workforce); National Health survey (2004-2005), for diabetes rate per 1000 and one of four risk factors (obesity, physical inactivity, smoking or harmful alcohol consumption) rate per 1000; avoidable mortality rate compiled by Prometheus from 2002-2006 census data. The Index of Relative disadvantage (IRSD) was sourced directed from ABS, SEIFA for small areas. For this analysis the IRSD score was used, which has a mean of 1000 and a standard deviation of 100. The lower the score the more disadvantaged an area is. All measures were accessible at the small area level of the Statistical Local area (SLA). ASGC-Remoteness areas were used to designate each SLA using the centroid rule in Arcview GIS software. Remoteness areas are divided into 5 categories: Major Cities, inner regional, outer regional, remote, very remote.
Orange Bathurst Lithgow
Campbelltown Sutherland
Sutherland Campbelltown
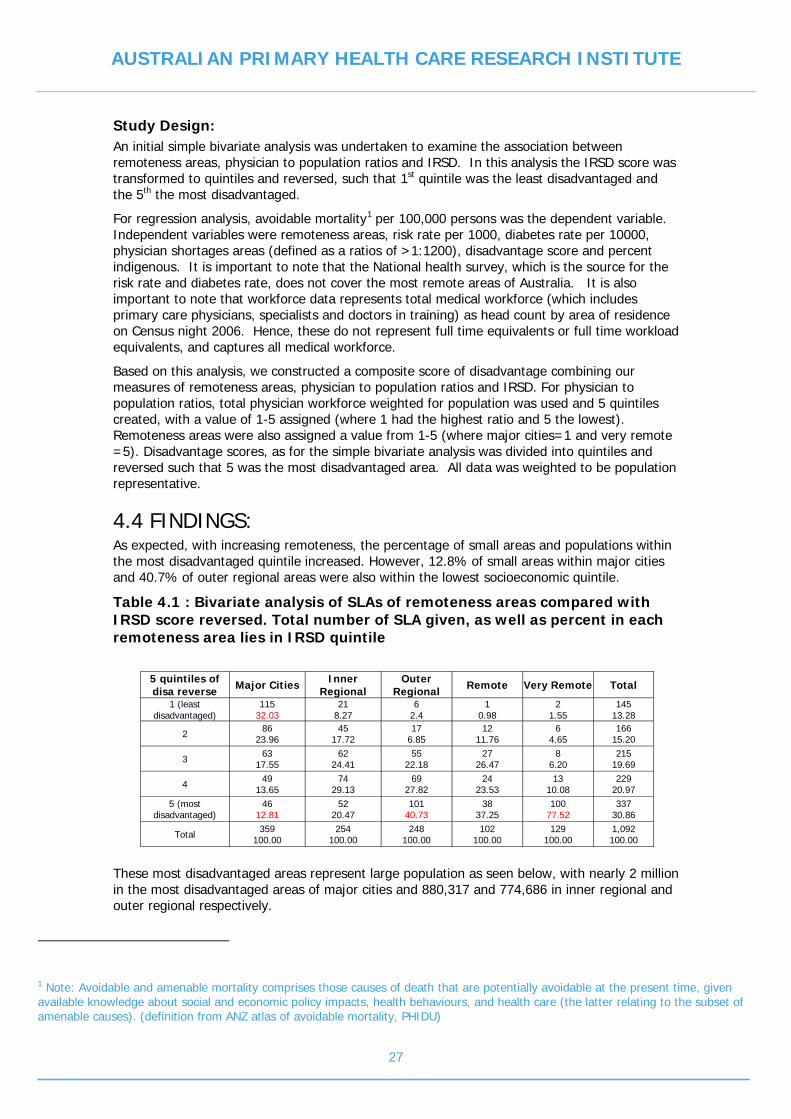
AUSTRALIAN PRIMARY HEALTH CARE RESEARCH INSTITUTE
27 __________________________________________________________________________________________________
Study Design: An initial simple bivariate analysis was undertaken to examine the association between remoteness areas, physician to population ratios and IRSD. In this analysis the IRSD score was transformed to quintiles and reversed, such that 1st quintile was the least disadvantaged and the 5th the most disadvantaged.
For regression analysis, avoidable mortality1 per 100,000 persons was the dependent variable. Independent variables were remoteness areas, risk rate per 1000, diabetes rate per 10000, physician shortages areas (defined as a ratios of >1:1200), disadvantage score and percent indigenous. It is important to note that the National health survey, which is the source for the risk rate and diabetes rate, does not cover the most remote areas of Australia. It is also important to note that workforce data represents total medical workforce (which includes primary care physicians, specialists and doctors in training) as head count by area of residence on Census night 2006. Hence, these do not represent full time equivalents or full time workload equivalents, and captures all medical workforce.
Based on this analysis, we constructed a composite score of disadvantage combining our measures of remoteness areas, physician to population ratios and IRSD. For physician to population ratios, total physician workforce weighted for population was used and 5 quintiles created, with a value of 1-5 assigned (where 1 had the highest ratio and 5 the lowest). Remoteness areas were also assigned a value from 1-5 (where major cities=1 and very remote =5). Disadvantage scores, as for the simple bivariate analysis was divided into quintiles and reversed such that 5 was the most disadvantaged area. All data was weighted to be population representative.
4.4 FINDINGS: As expected, with increasing remoteness, the percentage of small areas and populations within the most disadvantaged quintile increased. However, 12.8% of small areas within major cities and 40.7% of outer regional areas were also within the lowest socioeconomic quintile.
Table 4.1 : Bivariate analysis of SLAs of remoteness areas compared with IRSD score reversed. Total number of SLA given, as well as percent in each remoteness area lies in IRSD quintile
5 quintiles of disa reverse Major Cities Inner
Regional Outer
Regional Remote Very Remote Total
1 (least disadvantaged)
115 32.03
218.27
62.4
10.98
2 1.55
145 13.28
2 86 23.96
45 17.72
17 6.85
12 11.76
6 4.65
166 15.20
3 63 17.55
62 24.41
55 22.18
27 26.47
8 6.20
215 19.69
4 49 13.65
74 29.13
69 27.82
24 23.53
13 10.08
229 20.97
5 (most disadvantaged)
46 12.81
52 20.47
101 40.73
38 37.25
100 77.52
337 30.86
Total 359 100.00
254 100.00
248 100.00
102 100.00
129 100.00
1,092 100.00
These most disadvantaged areas represent large population as seen below, with nearly 2 million in the most disadvantaged areas of major cities and 880,317 and 774,686 in inner regional and outer regional respectively.
1 Note: Avoidable and amenable mortality comprises those causes of death that are potentially avoidable at the present time, given available knowledge about social and economic policy impacts, health behaviours, and health care (the latter relating to the subset of amenable causes). (definition from ANZ atlas of avoidable mortality, PHIDU)
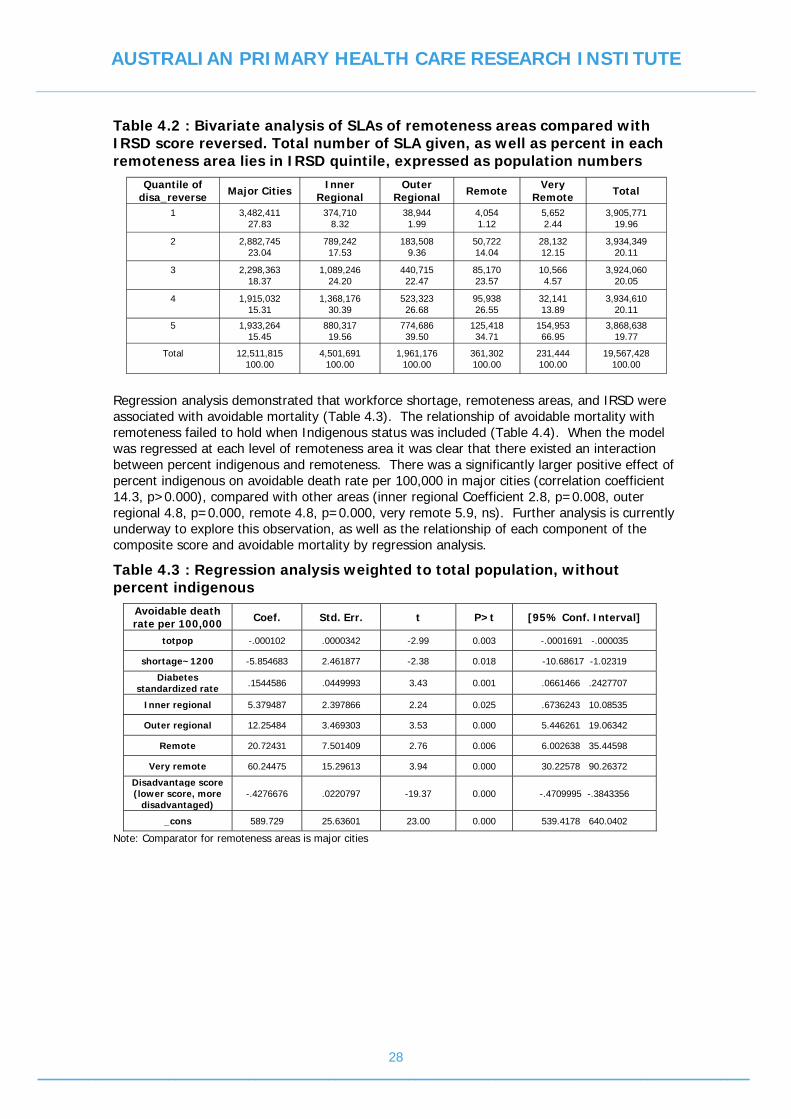
AUSTRALIAN PRIMARY HEALTH CARE RESEARCH INSTITUTE
28 __________________________________________________________________________________________________
Table 4.2 : Bivariate analysis of SLAs of remoteness areas compared with IRSD score reversed. Total number of SLA given, as well as percent in each remoteness area lies in IRSD quintile, expressed as population numbers
Quantile of disa_reverse Major Cities Inner
Regional Outer
Regional Remote Very Remote Total
1
3,482,411 27.83
374,710 8.32
38,944 1.99
4,054 1.12
5,652 2.44
3,905,771 19.96
2
2,882,745 23.04
789,242 17.53
183,508 9.36
50,722 14.04
28,132 12.15
3,934,349 20.11
3
2,298,363 18.37
1,089,246 24.20
440,715 22.47
85,170 23.57
10,566 4.57
3,924,060 20.05
4
1,915,032 15.31
1,368,176 30.39
523,323 26.68
95,938 26.55
32,141 13.89
3,934,610 20.11
5
1,933,264 15.45
880,317 19.56
774,686 39.50
125,418 34.71
154,953 66.95
3,868,638 19.77
Total
12,511,815 100.00
4,501,691 100.00
1,961,176 100.00
361,302 100.00
231,444 100.00
19,567,428 100.00
Regression analysis demonstrated that workforce shortage, remoteness areas, and IRSD were associated with avoidable mortality (Table 4.3). The relationship of avoidable mortality with remoteness failed to hold when Indigenous status was included (Table 4.4). When the model was regressed at each level of remoteness area it was clear that there existed an interaction between percent indigenous and remoteness. There was a significantly larger positive effect of percent indigenous on avoidable death rate per 100,000 in major cities (correlation coefficient 14.3, p>0.000), compared with other areas (inner regional Coefficient 2.8, p=0.008, outer regional 4.8, p=0.000, remote 4.8, p=0.000, very remote 5.9, ns). Further analysis is currently underway to explore this observation, as well as the relationship of each component of the composite score and avoidable mortality by regression analysis.
Table 4.3 : Regression analysis weighted to total population, without percent indigenous
Avoidable death rate per 100,000 Coef. Std. Err. t P>t [95% Conf. Interval]
totpop -.000102 .0000342 -2.99 0.003 -.0001691 -.000035
shortage~1200 -5.854683 2.461877 -2.38 0.018 -10.68617 -1.02319
Diabetes standardized rate .1544586 .0449993 3.43 0.001 .0661466 .2427707
Inner regional 5.379487 2.397866 2.24 0.025 .6736243 10.08535
Outer regional 12.25484 3.469303 3.53 0.000 5.446261 19.06342
Remote 20.72431 7.501409 2.76 0.006 6.002638 35.44598
Very remote 60.24475 15.29613 3.94 0.000 30.22578 90.26372
Disadvantage score (lower score, more
disadvantaged) -.4276676 .0220797 -19.37 0.000 -.4709995 -.3843356
_cons 589.729 25.63601 23.00 0.000 539.4178 640.0402
Note: Comparator for remoteness areas is major cities

AUSTRALIAN PRIMARY HEALTH CARE RESEARCH INSTITUTE
29 __________________________________________________________________________________________________
Table 4.4: Regression analysis weighted to total population, with percent indigenous
Avoidable death rate per 100,0000 Coef. Std. Err. t P>t [95% Conf. Interval]
totpop -.0000836 .0000311 -2.69 0.007 -.0001446 -.0000227
shortage~1200 -4.577979 2.237298 -2.05 0.041 -8.968729 -.1872285
Percent Indigenous 5.156543 .3658024 14.10 0.000 4.438648 5.874439
Diabetes standardized rate .0406053 .0416514 0.97 0.330 -.0411366 .1223472
Inner regional -.3011749 2.214319 -0.14 0.892 -4.646828 4.044478
Outer regional -3.915423 3.352592 -1.17 0.243 -10.49496 2.664118
Remote -8.22953 7.114467 -1.16 0.248 -22.19184 5.732779
Very remote -6.061307 14.66424 -0.41 0.679 -34.84022 22.71761
Disadvantage score(lower score, more
disadvantaged) -.3803539 .0203281 -18.71 0.000 -.4202483 -.3404595
cons 546.243 23.48184 23.26 0.000 500.1594 592.3267
Note: Comparator for remoteness areas major cities.
To create our composite score 5 quintiles were created from total physician workforce weighted for population giving the following categories: Score 1=1:33-1:232, score 2 =1:232-1:500, score 3 =1:500-1:769, score 4 =1:769-1:1282, score 5 >1:1282. The physician supply score, remoteness score and IRSD score were combined with an assumption of equal weighting. Factor analysis of these three scores as variables yielded a single factor with a eigenvalue greater than one (See section 3 methods for further details of factor analysis), confirming our assumption. The pair wise correlation matrix (table 4.5) revealed that there was a strong relationship between the combined score of deprivation and avoidable mortality, risk rate, diabetes rate and percent indigenous. As described in the methods section risk rate is the rate per 1000 population of one of four risk factors (obesity, physical inactivity, smoking or harmful alcohol consumption).
Table 4.5: Pair wise correlation matrix of composite score, health outcomes and percent indigenous All p>0.001 except *p=0.5
Composite Deprivation
score phy_sc~e disad_~e rural_~e avdr100k riskrp1k diabrp1k pctindig
Composite Deprivation score
1.0000 1091
physician_score 0.8219 1091
1.0000 111
disadvantage_score 0.8538 1091
0.5282 1106
1.0000 1107
rural_score 0.5554 1091
0.2053 1097
0.3167 1092
1.0000 1114
Avoidable death rate per 100,000
0.5275 1037
0.2706 1056
0.5397 1052
0.4257 1043
1.0000 1057
Risk rate per 1000 0.7784 955
0.5191 967
0.8168 967
0.3728 957
0.6576 940
1.0000 969
Diabetes rate per 1000
0.4240 952
0.2710 964
0.5311 964
0.0833 952
0.4888 938
0.5100 964
1.0000 965
Percent Indigenous 0.3505 1091
0.1490 1112
0.2568 1107
0.5042 1098
0.7687 1057
0.4047 967
0.3767 964
1.0000 1113
totpop -0.1885 1091
-0.0201* 1112
-0.0937 1107
-0.4539 1098
-0.1902 1057
-0.0964 967
0.0767 964
-0.1989 113

AUSTRALIAN PRIMARY HEALTH CARE RESEARCH INSTITUTE
30 __________________________________________________________________________________________________
To calculate loadings for our composite score to determine values for mapping, varimax rotation as described in Wang and Luo (2004), was used to determine weights. Rotated loading were 0.33 for the physician score, 0.37 for the disadvantage score and 0.30 for the remoteness score. These weightings were used to create a composite score for each SLA that could then be mapped. Initial regression analysis exploring the relationship between each element of the composite score with health outcomes was undertaken. For example, when risk rate per 1000 was regressed against physician score, rural score and disadvantage score the regression coefficients were 7.3, 15.1 and 44.8 respectively (all p=0.000). This warrants further exploration of using regression analysis as an alternative to determining weightings for the composite score and whether there are advantages compared to factor analysis. Currently, further exploration is underway.
4.5 DISCUSSION: As expected, with increasing remoteness, the percentage of small areas and populations within the most socioeconomically disadvantaged quintile increased, and is consistent with previous reports in the literature (Adihkari, 2008). However, there are large groups in regional areas and major cities that experience socioeconomic disadvantage and hence arguably have greater need than their counterparts in otherwise similar areas. Like the work of McGrail and Humphreys (2009), there is marked heterogeneity within remoteness areas that translates to health need.
This analysis demonstrates that workforce shortage, remoteness areas, and IRSD are associated with avoidable mortality. This is consistent with what has been reported in the literature (Yu et al., 2000, AIHW, 2007). However, the relationship of avoidable mortality with remoteness failed to hold when Indigenous status was included. This is in contrast to that reported in the AIHW mortality report in 2007, which demonstrated a gradient of increased risk with increasing remoteness. However, it did acknowledge the strong association of Indigenous status and mortality (who overall all have a mortality rate three times that of other Australians), and heterogeneity observed within remoteness areas (with inland communities with higher mortality rates, whilst costal communities have rates similar to that of their counter parts in major cities). Our study confirms this interaction between indigenous status and rurality.
There was a strong relationship between the combined measure of deprivation (remoteness, physician supply and IRSD) and avoidable mortality, risk rate, diabetes rate and percent indigenous. There would be value in further validating this against outcomes such as utilisation, self reported health status, and self reported access difficulty to strengthen the case for use in predicting need and access difficulty. Although this lacks the refinement of the rural index developed by McGrail and Humphreys, it does further the case for the need of a measure that encompasses health need, social deprivation and supply in addition to geographical measures. The result of this study would suggest that the measure of socioeconomic disadvantage may be better predictor of mortality than our composite measure. However, conceptually and previous research indicates the value of incorporating a number of measures of deprivation in order to identify those in greatest need.
An important limitation of the study is the use of total medical workforce by headcount only, thereby not accurately capturing full time equivalent primary care physicians. The reason for this was the availability of data, as access to medical survey data or Medicare data, is restrictive (data is suppressed if numbers are small enough for an area to allow potential individual identification), time consuming and expensive, and hence was beyond the scope of the current fellowship. There is great value in pursuing this specific data, as the score has potential to be an important tool in enabling more equitable distribution of resources, such as workforce.
Another limitation is that the National Health Survey does not extend to remote area, and hence data for risk behaviours (smoking, obesity, inactivity, alcohol excess) and diabetes is not available. These areas have a greater percentage of Indigenous populations, and it is known that diabetes at least, is much higher in this group. Hence relationships with these health outcomes in the model need to be considered with caution.

AUSTRALIAN PRIMARY HEALTH CARE RESEARCH INSTITUTE
31 __________________________________________________________________________________________________
4.5 KEY FINDINGS: SUMMARY: • Use of remoteness areas only in workforce incentive programs and training
requirements are inadequate and fail to include other determinants of primary health care need and access inequity experienced in Australia. Including measures of socioeconomic disadvantage and workforce supply has the potential to address health and health care access inequity in Australia, and target resources to where needed most.
• This work has demonstrated a model of a national composite deprivation measure that is predictive of mortality, risk behaviours and disease morbidity. This score can be mapped and visually display areas of greatest need and enable prioritisation of action.
• Further refinement is necessary which requires more accurate workforce data and further analysis to determine appropriate weightings for each element of the composite score.
• This and additional distributional analysis could be conducted in order for example to identify those areas whose score lies in the lowest 20%, and are therefore a priority for policy
• This is further evidence of the value of the growing field of spatial epidemiology and GIS in primary health care policy

AUSTRALIAN PRIMARY HEALTH CARE RESEARCH INSTITUTE
32 __________________________________________________________________________________________________
SECTION FIVE: SUMMARY AND RECOMMENDATIONS
5.1 SUMMARY OF FINDINGS Of increasing pre-eminence in international discourse is the social gradient of health and health care access inequity and the crucial role that primary health care addressing this. Both in the US and Australia, access and equity are key themes of current health reform. In order to address inequity some measure of the social determinants of health need to be included in health planning and resource allocation. This report has examined international use of socioeconomic deprivation measures, and began analyses exploring use of such measures in determining health care need in the US and Australia. The following summarizes the key findings.
• Small area measures of socioeconomic deprivation are understood to capture individual the contextual elements of an area
• New Zealand and England have well developed measures of social and multiple deprivation, which have been extensively used in primary health care research, policy and resource allocation
• Australia has a well developed index, whilst there no equivalent index in the US. Use of socio-economic measures in policy and health planning is limited in both countries.
• Australia relies on measures of remoteness for primary health care resource allocation, whilst the US primarily uses measures of workforce shortage. Reliance purely on these definitions alone, although going some way to addressing workforce maldistribution, does not take into account other determinants of health and health care access inequity that exists within and between areas.
• Models exist which capture geographical, health status, and socioeconomic determinants of health need and access in a measures that can then be applied to small areas
• Collaborative work from the current fellowship developed a US model of social deprivation as the PCSA level which is predictive of health care access and need
• An Australian mapping tool was developed to begin exploration of the relationship between workforces, health outcome, socioeconomic disadvantage and rurality.
• From this, a composite measure was developed incorporating workforce supply, socioeconomic disadvantage and rurality which is predictive of health outcomes. This can be mapped to demonstrate visually priority areas.
5.2 FUTURE DIRECTIONS: Further Research This work has begun to explore use of models which incorporate measures of socio-economic disadvantage for use in determining primary health care need and access. These models have the potential to be further developed and applied to achieve more equitable allocation of resources. Specific further research opportunities include:
• With respect to the US model of social deprivation at the PCSA level
o Validation against mortality and morbidity data
o Extend the model through structural equation analysis to explore the relationship between social deprivation, health need, access and health outcomes.
o Undertake a comparison of designations based on this model compared with HPSA designations.

AUSTRALIAN PRIMARY HEALTH CARE RESEARCH INSTITUTE
33 __________________________________________________________________________________________________
o Develop a similar model with Australian data, allowing a cross country comparison
• With respect to the Australian model of a composite disadvantage measure
o Workforce data of greater detail and analysis to determine appropriate weightings for each element of the composite score would enhance the predictive value of the measure.
o Distributional analysis could be conducted in order to identify priorities for resources, for example those areas whose score lies in the lowest 20%.
o The relationship between the composite measure, its component parts (workforce, socioeconomic disadvantage and remoteness) and specific groups such as refugees could be further explored, to inform health service delivery to ensure the needs of those most marginalised and vulnerable are met.
There are number of other areas which would be of value to APHCRI and with which the Robert Graham Center has expertise. These include spatial analysis of the predictors of primary care service utilization (using medicare or BEACH data) and the impact on health outcomes, primary care workforce analysis and relationship with health outcomes, and further workforce analysis through medical student/GP registrar/rural scholarship tracking footprint analyses.
Further Collaboration The collaborative relationship between APHCRI and the Robert Graham Center has offered much in the development of further transpacific scholarly relationships, understanding of the use of research in primary health care policy, and systems of data collection, collation and use in health service planning and resource allocation. Ongoing collaboration will continue to be mutually beneficial. A strength of the Robert Graham Center is the range of visiting scholars, from medical students at the beginning of their careers in family medicine, through to senior academics expert in their field. A process of senior academic and professional exchange fellowships in addition to emerging GP researchers would enhance scholarly collaboration and links.
GIS and Australian primary health care research and policy Three years of collaboration between APHCRI and the Robert Graham Center, through the travelling fellowship, has clearly demonstrated the valuable role in primary health care policy of a dedicated centre of primary health care policy research with in house expertise, built around a web based interactive mapping tool. HealthLandscape™ has served as a ‘data magnet’ that has facilitated collaboration between decision makers, academia, clinicians and communities. Within Australia, experience and expertise in using GIS in primary health care has been building, alongside technological advancements in digital geography, data extraction and data linkage tools. However, these efforts have been impeded by lack of coordination and duplication, costly and time consuming data access processes, and a lack of comprehensive expertise.
Australia has many advantages over the US, with respect to the extent and richness of health and socio-demographic data we collect nationally on a regular basis. This includes data such as Medicare (capturing all general practice activity) and the BEACH program. This is in addition to census, national health survey, and hospital data, which is collected more frequently than the US. Public access to these datasets is extremely limited and in many cases non-existent. Specific data requests are cumbersome, costly and on a project by project basis. As demonstrated with the experience of the Robert Graham Center, freeing up access to such datasets leads a greater breadth and depth of research that is agile and responsive to the needs of communities and has the potential to deliver significant cost savings.
Within the primary health care sector involved in GIS there is increasing recognition of the need for a central focus of technology, data and personnel expertise. This would enable the sector to capitalise on the wealth of data Australia has and have a powerful impact on improving equity of health and primary health care access within Australian society. The Australian mapping tool developed during this fellowship and the associated analyses serves as a

AUSTRALIAN PRIMARY HEALTH CARE RESEARCH INSTITUTE
34 __________________________________________________________________________________________________
demonstration of how GIS can inform Australian primary health care policy. This tool in addition to other GIS efforts will act as a galvanising focus to drive forward further development and collaboration in this arena. APHCRI is well positioned to take a lead role in this process, and the expertise and structure of the Robert Graham Center will serve as an invaluable guiding model.

AUSTRALIAN PRIMARY HEALTH CARE RESEARCH INSTITUTE
35 __________________________________________________________________________________________________
REFERENCES: Adam R, Howard N, Tucker G, Appleton S, Taylor A, Chittleborough C, Gill T, Ruffin R, Wilson D,
(2009) Effects of area deprivation on health risks and outcomes: a multilevel cross-sectional Australian population study. Int J Public Health 54: 183-192
Adhikari P (2008) Research paper-Socio-economic indexes for areas: Introduction, use and future directions. Australian Bureau of Statistics (ABS) catalogue number 1351.0.55.015 September 2008
Australian Institute of Health and Welfare (2007). Rural, regional and remote health: a study on mortality (2nd edition). Rural health series no. 8. Cat. no. PHE 95. Canberra: AIHW
Bajekal M, Alves B, Jarman B, Hurwitz, (2001) Rationale for the new GP deprivation payment scheme in England: effects of moving from electoral ward to enumeration district underprivileged area scores. British Journal of General Practice 51:451-455
Banks J, Marmot M, Oldfield Z, Smith J (2006) Disease and Disadvantage in the United States and in England. JAMA 295:2037-2045
Bazemore A, Phillips R, Miyoshi T. (2010)a Harnessing geographic information systems to enable community-oriented primary care. Journal of American Board of Family Physicians 23:1 22-31
Bazemore A, Diller, P, Carrozza, M T. (2010)b The impact of a clinic move on vulnerable patients with chronic disease: A geographic information systems analysis (GIS) Journal of American Board of Family Physicians 23:128-130
Carver, 2008, Self Sufficienct and International medical graduates-Australia. National Health Workforce, Taskforce.
Carstairs V, (1995) Deprivation indices: their interpretation and use in relation to health. Journal of Epidemiology and Community Health 49:S3-8
Crampton P, Salmond C, Sutton F. (1997). NZDep91 Index of Deprivation. Research Report 5. Wellington: Health Services Research Centre.
Crampton P, Dowell A, Bowers S. (2000)a. Third sector primary health care in New Zealand. New Zealand Medical Journal 113: 92–6.
Crampton, P, Dowell, A, Woodward, A., Salmond, C., (2000)b Utilisation rates in capitated primary care centres serving low income populations New Zealand Medical Journal 113: 436-8
Del Fante P, Allan, D, Babidge E. Getting the most out of your practice: The practice health atlas and business modelling opportunities. Australian Family Physician 35:1 34-38, 2006
Department of Health and Ageing (2009)Building a 21st Century Primary Health Care System: A Draft of Australia’s First. National Primary Health Care Strategy (NPHCS)
Dixon-Woods, M., Cavers, D., Agarwal, S., Annandale E, Arthur A, Harvey J, Katbamna S, Olsen R, Smith L, Riley R, Sutton A. (2006) Conducting a critical interpretive synthesis of the literature on access to healthcare by vulnerable groups. BMC Medical Research Methodology 6:36
Dolan, S.A., Jarman, B., Bajekal, M., Davies, P.M., Hart D., (1995) Measuring disadvantage: changes in the underprivileged area, Townsend, and Carstairs score 1981-91. J Epidemiol Commmunity Health 49: S30-S33
Field, K, (2000) Measuring the need for primary health care: an index of relative disadvantage. Applied Geography 20: 305–332
Glover J, Hetzel D, Tennant S, (2004) The socioeconomic gradient and chronic illness and associated risk factors in Australia. Aust and NZ Health Policy 1:8

AUSTRALIAN PRIMARY HEALTH CARE RESEARCH INSTITUTE
36 __________________________________________________________________________________________________
Goodman D, Wright-Slaughter, P, (2004). The Generalizability of Primary Care Service Areas to Non-Medicare Populations: A Technical Report prepared for the Health Resources and Services Administration under contract number accessed from Dartmouth Atlas Website http://pcsa.dartmouth.edu/index.html
GPRIPS Incentive Program, Department of health and Ageing available at http://www.health.gov.au/internet/otd/publishing.nsf/Content/program-gprip
Grinzi, P (2008) GIS and general practice: where are we going and when will be get there? Stream 8 report, Australian Primary Health Care Research Institute, January 2008.
Harris, M., McDonald, J., (2009) Health care reform: Facing inequities. Australian Family Physician 38(11) 911-912
Hendryx M., Ahern., M., Lovrich, N., McCurdy, A., (2002) Access to health care and community social capital. Health Services Research 37:1 pp85-101
Kennedy B, Firman D (2004) Indigenous SEIFA-revealing the ecological fallacy. Australian Population Association 12th Biennial Conference-Population and society: issues, research, policy, September 2004, Canberra, Australia
Krieger N, Chen J, Waterman P, Soobader M, Subramanian S, Carson R (2002) Geocoding and monitoring of US socioeconomic inequalities in mortality and cancer incidence: does the choice of area based measure and geographical level matter? The public health disparities geocoding project. American Journal of Epidemiology 156: 471-82
Krieger N, Chen J, Waterman P, Renkopf D, Subramanian S, (2003) Race/ethnicity, gender, and monitoring socioeconomic gradients in health: a comparison of area based socioeconomic measures-The public health disparities geocoding project. American Journal of Public Health 93:1655-1671
Krieger N, Chen J, Waterman P, Renkopf D, Subramanian S, (2005) Painting a truer picture of US socioeconomic and racial/ethnic health inequalities: The public health disparities geocoding project. American Journal of Public Health 95:312-323
Langton, J., Crampton, P., (2008) Capitation funding of primary health organisations in New Zealand: are enrolled populations being funded according to need? New Zealand Medical Journal Vol 121 No 1272;
Lee, R (2008) Defining and targeting areas of primary care workforce need: A five country comparison. Stream 9 Report, Australian Primary Health Care Research Institute.
Michael, M (2007) Achieving health equity: from root causes to fair outcomes. Lancet, 370: 1153-63
McGrail M, Humphreys J. (2009) The index of rural access: an innovative integrated approach to measuring primary care access. BMC Health Services Research 9:124
McLaughlin CG, Wyszewianski L: Access to Care: Remembering Old Lessons. Health Services Research 2002, 37: 1441-1443
National Health and Hospital reform (NHHR) commission: A Healthier Future For All Australians-Final Report June 2009
National Preventative Health Strategy (NPHS), 2009, an Overview accessed at http://www.health.gov.au/internet/preventativehealth/publishing.nsf/Content/national-preventative-health-strategy-1lp 11th March 2010
Noble M, McLennan D, Wilkinson K, Whitworth A, Barnes H, The English indices of multiple deprivation 2007 (2008) Social Disadvantage Research Centre, University of Oxford
Noble M, Wright G, Dibben C, Smith GAN, McLennan D, Anttila C, Barnes H,Mokhtar C, Noble S, Avenell D, Gardner J, Covizzi I, Lloyd M.(2004) Indices of Deprivation 2004. Report to the Office of the Deputy Prime Minister. London: Neighbourhood Renewal Unit.
AUSTRALIAN PRIMARY HEALTH CARE RESEARCH INSTITUTE
37 __________________________________________________________________________________________________
Penchansky R, Thomas J: The concept of access: definition and relationship to consumer satisfaction. Med Care 1981, 19: 127-140.
Pink B., (2008) Information paper-an introduction to socio-economic indexes for areas (SEIFA). Australian Bureau of Statistics Catalogue 2039.0 March 2008
Radford, J., (2009) General practice and the NHHRC report. Australian Family Physician 38(11) 855-856
Ricketts, T., C., Goldsmith, L., J., Holmes, G., M., Randolph, R., Lee, R., Taylor, D., H., Ostermann, J., (2007) Designating Places and Populations as medically underserved: A proposal for a new approach. Journal of Health Care for the Poor and Underserved 18(2007): 567-589
Robert J. Adams, Natasha Howard, Graeme Tucker, Sarah Appleton, Anne W. Taylor, Catherine Chittleborough, Tiffany Gill, Richard E Ruffin, David H. Wilson Effects of area deprivation on health risks and outcomes: a multilevel, cross-sectional, Australian population study. Int J Public Health 54 (2009) 183–192
Ross N, Wolfson M, Dunn J, Berthelot J, Kaplan G, Lynch J (2000) Relation between income inequality and mortality in Canada and in the United States: cross sectional assessment using census data and vital statistics. British Medical Journal. 320: 898-902
Salmond C, Crampton P, (2001) NZDEP96-what does it measure? Social Policy Journal of New Zealand 17: 82-100
Salmond C, Crampton P, (2002) Heterogeneity of deprivation within very small areas. J Epidemiology and Community Health 56:669-670
Schoen, C., Osborn, R., Doty, M., Squires, D., Peugh, J., Applebaum., S., (2009) A survey of primary care physicians in 11 countries, 2009: Perspectives on care, costs, and experiences, Commonwealth Fund Health Affairs Web Exclusive w1171-1183
Schofield, D., McRae, I., Shrestha, R (2008) Equity, poverty and access to GP services in Australia. International Medical Workforce Conference, September 2008
Scottish Index of Multiple Deprivation (SIMD): General report 2009. Officer of the Chief Statistician, Scottish Government, October 2009.
Sorlie P, Backlund E, Keller J (1995) US mortality by economic, demographic, and social characteristics: The national longitudinal mortality study. American Journal of Public Health 85: 949-956
Townsend P, (1987) Deprivation. Journal of Social Policy. 16:125-146
Walker R, Hiller J. (2005) The index of relative socio-economic disadvantage: general population views on indicators used to determine area-based disadvantage. ANZ Journal of Public Health 29(5) 442-7
Wang F, Luo W, (2005) Assessing spatial and nonspatial factors for healthcare access: towards an integrated approach to defining health professional shortage areas. Health and Place 131-146
White P, Gunston J, Salmond C, Atkinson J, Crampton P. 2008. Atlas of Socioeconomic Deprivation in New Zealand NZDep2006. Wellington: Ministry of Health.
WHO (2008)a Closing the gap in a generation: Health equity through action on the social determinants of health. Commission of the Social Determinants of Health, Final Report. World Health Organisation, Geneva, Switzerland.
WHO (2008)b. The World Health Report: Primary health care now more than ever. The World Health Organisation, Geneva, Switzerland.
Wilkinson D, Ryan P, Hiller J (2001) Variation in mortality rates in Australia: correlation with Indigenous status, remoteness and socio-economic deprivation. Journal of Public Health Medicine 23(1) 74-7

AUSTRALIAN PRIMARY HEALTH CARE RESEARCH INSTITUTE
38 __________________________________________________________________________________________________
Yu X, Robertson C, Brett I., (2000) Socioeconomic correlates of mortality differentials by local government area in rural northern New South Wales, 1981-1995. ANZ Journal of Public Health 24(4) 365-369
Websites:
ABS Catalogue 1216.0 (2009) Australian Standard of Geographical Classification, July 2009 available at www.abs.gov.au
Remoteness areas digital definitions: http://www.abs.gov.au/AUSSTATS/[email protected]/DetailsPage/1259.0.30.0042006?OpenDocument
Statistical Local area and census collection district digital definitions
http://www.abs.gov.au/AUSSTATS/[email protected]/DetailsPage/1259.0.30.0022006?OpenDocument
Division of GP digital definitions:
http://www.health.gov.au/internet/main/publishing.nsf/Content/health-pcd-programs-divisions-boundarymaps
The Geocoding Project: http://www.hsph.harvard.edu/thegeocodingproject/index.htm
UK Department of Health (DH) 2009-Mortality monitoring
http://www.dh.gov.uk/en/Publicationsandstatistics/Publications/PublicationsStatistics/DH_107609
UK Department of Health (DH) 2008-Resource Allocation/Funding Formulas:
http://www.dh.gov.uk/en/Publicationsandstatistics/Publications/PublicationsPolicyAndGuidance/DH_091849
www.dh.gov.uk/allocations

AUSTRALIAN PRIMARY HEALTH CARE RESEARCH INSTITUTE
39 __________________________________________________________________________________________________
APPENDIX A: Table A1: NZDep- Weights on the first principal components for 2006 and 2001
Proportion of persons (with a lack of something) Weight 2001
a 2006
b 2006
c
People aged 18-59a b
or 18-64c receiving a means
tested benefit
0.361 0.369 0.371
People aged 18-59a b
or 18-64c unemployed 0.353 0.331 0.332
People living in households with equivalised income
below an income threshold a bc
0.350 0.356 0.356
People with no access to a telephone (land-line or mobile)
0.336 0.314 0.314
People with no access to a car 0.332 0.310 0.311
People aged < 60a b
or < 65c living in a single parent
family
0.325 0.333 0.333
People aged 18-59a b
or 18-64c without any
qualifications
0.319 0.329 0.326
People not living in own home 0.312 0.334 0.334 People living in households below an equivalised
bedroom occupancy threshold a b c
0.309 0.317 0.318
Proportion of variance explained 57.7% 55.3% 55.4% a, b These have an upper working-age limit of 59.
c This has an upper working-age limit of 64 and is used for the NZDep2006 index
* Equivalisation: methods used to control for household composition. –see research paper 2007 for methods
Table A2: Weighting for ID 2007
Income deprivation 22.5 % Employment deprivation 22.5% Health deprivation and disability 13.5% Education, skills and training deprivation 13.5% Barriers to housing and services 9.3% Crime 9.3% Living Environment deprivation 9.3%

AUSTRALIAN PRIMARY HEALTH CARE RESEARCH INSTITUTE
40 __________________________________________________________________________________________________
Table A3: Index of Relative Disadvantage for Australia, variables and weights
% Persons aged 15 years and over with no qualifications –0.3052 % Families with offspring having parental income less than $15,600 –0.2927
% Females in labour force unemployed –0.2750 % Males in labour force unemployed –0.2702 % Employed females classified as ‘Labourers and Related Workers’ –0.2689
% Employed males as classified as ‘Labourers and Related Workers’ –0.2685
% One-parent families with dependent offspring only –0.2536 % Persons aged 15 years and over who left school at Year 10 or lower –0.2505
% Employed males classified as ‘Intermediate Production and Transport Workers’ –0.2370
% Families with income less than $15,600 –0.2296 % Households renting from Government Authority –0.2196 % Persons aged 15 years and over separated or divorced –0.1949 % Dwellings with no motor car at dwelling –0.1912 % Employed females classified as ‘Intermediate Production and Transport Workers’ –0.1853
% Persons aged 15 years and over who did not go to school –0.1848
% Indigenous –0.1796 % Lacking fluency in English –0.1468 % Employed females classified as ‘Elementary Clerical, Sales and Service Workers’ –0.1342
% Occupied private dwellings with two or more families –0.1279

AUSTRALIAN PRIMARY HEALTH CARE RESEARCH INSTITUTE
41 __________________________________________________________________________________________________
Table A4: In depth Summary Table of Social Deprivation scores
Country income employment Social Capital
Health deprivation
and disability
New Zealand
-People aged 18-64 receiving a means tested benefit -People living in equivalised* households with income below an income threshold
-People aged 18-64 unemployed
-People aged <65 living in a single parent family
England -Adults and children in Income Support Households • Adults and children in Income-Based JSA Households • Adults and children in Pension Credit (Guarantee) Households • Adults and children in those Working Tax Credit households where there are children in receipt of Child Tax Credit whose equivalised income (excluding housing benefits) is below 60 per cent of the median before housing costs • Adults and children in Child Tax Credit Households (who are not eligible for IS, Income-Based JSA, Pension Credit or Working Tax Credit) whose equivalised income (excluding housing benefits) is below 60 per cent of the median before housing costs • National Asylum Support Service (NASS) supported asylum seekers in England in receipt of subsistence support, accommodation support, or both
-Recipients of Jobseekers Allowance (both contribution-based and incomebased): men aged 18-64 and women aged 18-59 • Recipients of Incapacity Benefit: men aged 18-64 and women aged 18-59 • Recipients of Severe Disablement Allowance: men aged 18-64 and women aged 18-59 • Participants in the New Deal for the 18-24s who are not in receipt of JSA • Participants in the New Deal for 25+ who are not in receipt of JSA • Participants in the New Deal for Lone Parents (after initial interview)
-Years of Potential Life Lost (YPLL) • Comparative Illness and Disability Ratio • Measures of acute morbidity, derived from Hospital Episode Statistics • The proportion of adults under 60 suffering from mood or anxiety disorders based on prescribing
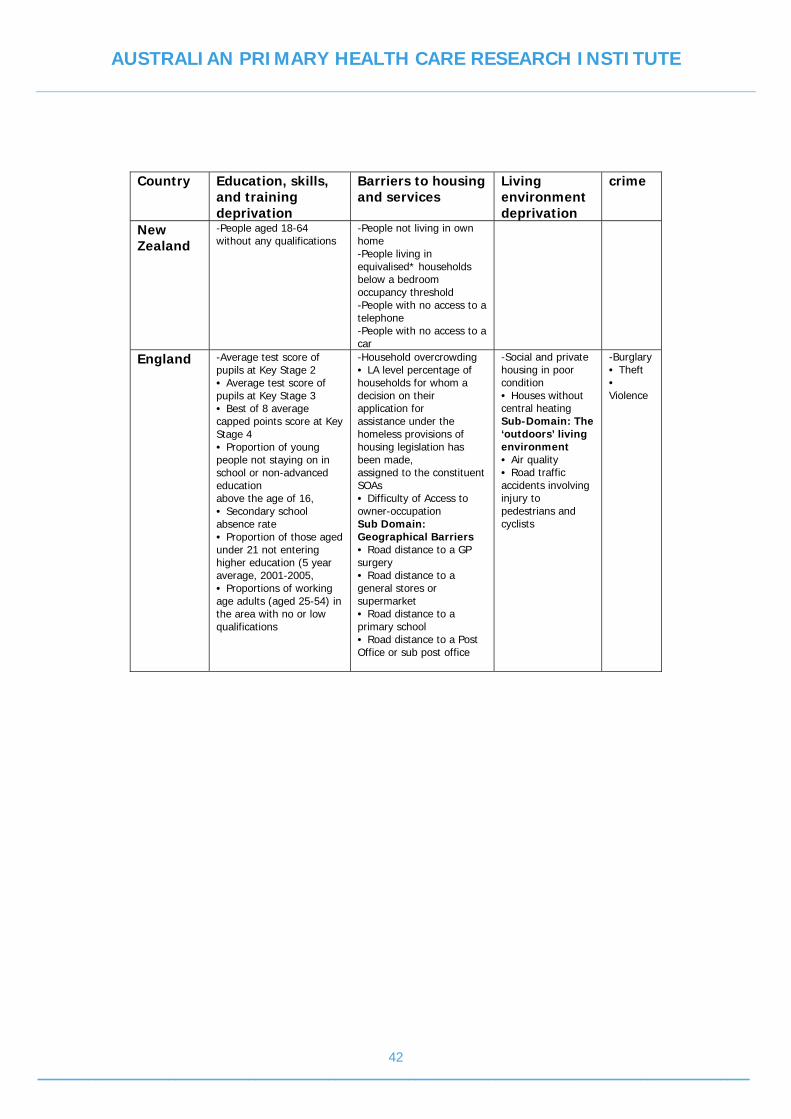
AUSTRALIAN PRIMARY HEALTH CARE RESEARCH INSTITUTE
42 __________________________________________________________________________________________________
Country Education, skills, and training deprivation
Barriers to housing and services
Living environment deprivation
crime
New Zealand
-People aged 18-64 without any qualifications
-People not living in own home -People living in equivalised* households below a bedroom occupancy threshold -People with no access to a telephone -People with no access to a car
England -Average test score of pupils at Key Stage 2 • Average test score of pupils at Key Stage 3 • Best of 8 average capped points score at Key Stage 4 • Proportion of young people not staying on in school or non-advanced education above the age of 16, • Secondary school absence rate • Proportion of those aged under 21 not entering higher education (5 year average, 2001-2005, • Proportions of working age adults (aged 25-54) in the area with no or low qualifications
-Household overcrowding • LA level percentage of households for whom a decision on their application for assistance under the homeless provisions of housing legislation has been made, assigned to the constituent SOAs • Difficulty of Access to owner-occupation Sub Domain: Geographical Barriers • Road distance to a GP surgery • Road distance to a general stores or supermarket • Road distance to a primary school • Road distance to a Post Office or sub post office
-Social and private housing in poor condition • Houses without central heating Sub-Domain: The ‘outdoors’ living environment • Air quality • Road traffic accidents involving injury to pedestrians and cyclists
-Burglary • Theft • Violence

AUSTRALIAN PRIMARY HEALTH CARE RESEARCH INSTITUTE
43 __________________________________________________________________________________________________
Country income employment Social Capital
Health deprivation
and disability United States Single Measures: Composite Measures: Townsend: Carstairs: SEP Index:
-Median household income -Gini coefficient -Low/high income (<50% median income/>400% median income) -Percent poverty (equivalised income <12,674 USD for family of 4 -Wealth-home ownership of home>=300000 USD in 1989 -wealth-%expensive homes -% below poverty -median household income
-% of person >16yrs unemployed and actively seeking work % unemployment % male unemployment %unemployed
Country Education, skills,
and training deprivation
Barriers to housing and services
Living environment deprivation
crime
United States Single Measures: Composite Measures: Townsend: Carstairs: SEP Index:
-Working class: % in working class occupation of population >16yrs -%persons >=25 with less than a 12th grade education -%persons >=25 with at least 4 years of college % low social class (based on occupation) %working class %persons >=25 with less than a 12th grade education
-Crowding: %households >=1 person per room % crowding %no car %renters %crowding %no car

AUSTRALIAN PRIMARY HEALTH CARE RESEARCH INSTITUTE
44 __________________________________________________________________________________________________
Country income employment Social Capital
Health deprivation
and disability
Australia -% Families with offspring having parental income less than $15,600 -% Families with income less than $15,600
-% Females in labour force unemployed -% Males in labour force unemployed
-% One-parent families with dependent offspring only -% Persons aged 15 years and over separated or divorced *% Indigenous-stand alone measure of ethnicity
Country Education, skills, and training deprivation
Barriers to housing and services
Living environment deprivation
crime
Australia -% Persons aged 15 years and over with no qualifications -% Employed females classified as ‘Labourers and Related Workers’ -% Employed males as classified as ‘Labourers and Related Workers’ -% Persons aged 15 years and over who left school at Year 10 or lower -% Employed males classified as ‘Intermediate Production and Transport Workers’ -% Employed females classified as ‘Intermediate Production and Transport Workers’ -% Persons aged 15 years and over who did not go to school -% Employed females classified as ‘Elementary Clerical, Sales and Service Workers’ -% Lacking fluency in English
-% Households renting from Government Authority -% Dwellings with no motor car at dwelling -% Occupied private dwellings with two or more families

AUSTRALIAN PRIMARY HEALTH CARE RESEARCH INSTITUTE
45 __________________________________________________________________________________________________
APPENDIX B : Scoring coefficients for three factors from PCSA factor analysis (method = regression; based on varimax rotated factors, used as weightings in correlational matrix analysis
Figure B1: Model of access
Variable Factor1 Factor2 Factor3
smh -0.05696 0.34170 -0.14343 pblvpovp -0.01088 0.33100 -0.06506 pblack_p -0.11572 0.15213 0.15354 phisp_p 0.11294 -0.02007 -0.11536
owner_occ -0.01133 0.08639 -0.76329 pli_p 0.55070 -0.12697 -0.04996
dropout_p -0.01254 0.14687 -0.11114 foreign_born 0.17658 -0.12267 0.17871 highneed -0.00557 0.01782 0.00856
shh -0.03824 -0.05957 0.25861 nocarowner~p -0.02198 0.09123 0.06524 overcrowding 0.20057 0.06235 -0.31322
unemployment 0.00294 0.17268 -0.01139
Health Outcomes
Access-Unobserved
Workforce
Insurance
Community Characteristics Socioeconomic factors Instability High needs groups
ACSH
Subjective Access

AUSTRALIAN PRIMARY HEALTH CARE RESEARCH INSTITUTE
46 __________________________________________________________________________________________________


![Understanding the Quintile Portfolio · ZHOU AND PALOMAR: UNDERSTANDING THE QUINTILE PORTFOLIO 4031 e.g.,the1/N (a.k.a.equallyweightedoruniform)portfolio[20] andquintileportfolio[21],[22].Motivatedbythe‘naive’diversi-ficationforreducingtherisk,the1/N](https://img.dokumen.tips/doc/110x75/5ffa1d0b86e35479e24f62e9/understanding-the-quintile-portfolio-zhou-and-palomar-understanding-the-quintile.jpg)