Embed Size (px)
Citation preview

1
SOCIAL CAPITAL, POLITICAL PARTICIPATION, AND THE QUALITY OF DEMOCRACY IN INDIA
Hans BlomkvistDepartment of Government, Uppsala University
Box 514, 751 20 Uppsala, Swedentel: +46 - 18 4713332; fax: +46 - 18 4713308;
Email: [email protected]
Paper prepared for the annual meeting of the American Political Science Association,28-31 August, 2003, in Philadephia
2
Is the responsiveness to citizens’ demands by governments on the state level affected by different kinds of political participation? Is it affected by everyday social interaction in villages and towns? And does political participation and social interaction have different impacts have different impacts depending on historically evolved political structures? The paper builds on a unique data set of personal interviews with 3,200 respondents in five different states in India, covering 31 different rural and urban localities.
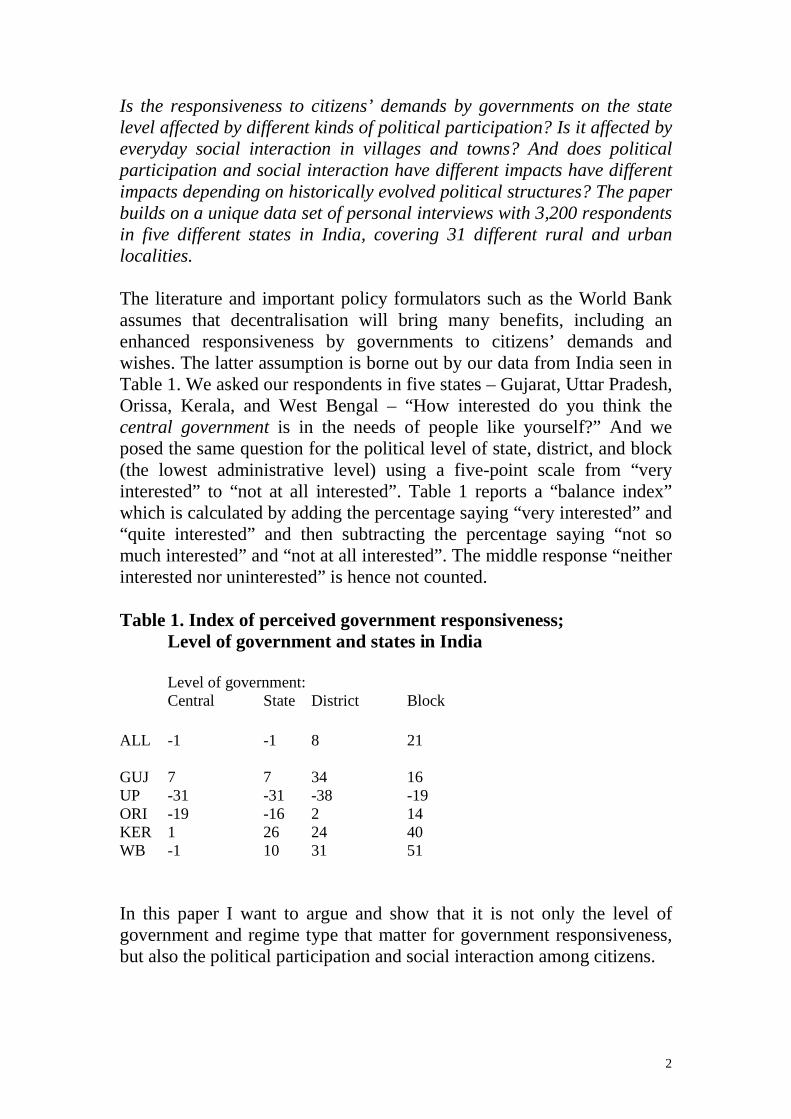
The literature and important policy formulators such as the World Bank assumes that decentralisation will bring many benefits, including an enhanced responsiveness by governments to citizens’ demands and wishes. The latter assumption is borne out by our data from India seen in Table 1. We asked our respondents in five states – Gujarat, Uttar Pradesh, Orissa, Kerala, and West Bengal – “How interested do you think the central government is in the needs of people like yourself?” And we posed the same question for the political level of state, district, and block (the lowest administrative level) using a five-point scale from “very interested” to “not at all interested”. Table 1 reports a “balance index” which is calculated by adding the percentage saying “very interested” and “quite interested” and then subtracting the percentage saying “not so much interested” and “not at all interested”. The middle response “neither interested nor uninterested” is hence not counted.
Table 1. Index of perceived government responsiveness;Level of government and states in India
Level of government:Central State District Block
ALL -1 -1 8 21
GUJ 7 7 34 16UP -31 -31 -38 -19ORI -19 -16 2 14KER 1 26 24 40WB -1 10 31 51
In this paper I want to argue and show that it is not only the level of government and regime type that matter for government responsiveness, but also the political participation and social interaction among citizens.
3
India is interesting and of paramount importance for discussions and analyses of quality of democracy for several reasons. First, it is a very large country; a fact which is known but still often overlooked in debates about development. We should try to keep in mind that India has about the same number of people as the continents of Africa and Latin America taken together. Second, it is the only poor country in the world (except Costa Rica) which has had competitive multi-party democracy since independence from the colonial power (disregarding 18 months of Emergency in the mid-70s). Third, it is a country, a sub-continent, with immense diversities; economically, culturally, politically. A part of this diversity is found and expressed in India’s federal political system. Although often being criticised for being overly centralised, the federal system functions in several important ways. It is legitimate in the sense that people vote in the state assembly elections to the same extent as in the national elections; they also approve of the actions of the state governments to the same extent as those of the central government in New Delhi.1 Especially after the re-organisation of state boundaries in the 1960s they can be said to represent somewhat homogenous linguistic and cultural units in India (Lijphart 1996). Several of the states – of which two has a larger population than the largest European country, Germany, and seven have a population exceeding 50 million people – also have very distinct political patterns. Therefore, from an intellectual perspective, India provides us with a rare opportunity to investigate different hypotheses on the macro-level using Indian states as the level of analysis.2
I will use ‘incidence of poverty’ as an indicator of government responsiveness, which seems as a reasonable indicator in a very poor country3 (in Blomkvist 2002 I have used our question on perceived government responsiveness; the two measurements interestingly yield very similar results). First, I want to establish that there is a variation in what I aim to explain, my dependent variable – level of poverty on the state level in India. That the proportion of people living below the
1 Data from the Agora survey (more below).2 This has been pointed out by Atul Kohli (1987, 1990) and Amartya Sen and Jean Drèze (1995).3 Percent below poverty line in some countries, early 1990s:India 35Sri Lanka 25Botswana 33Venezuela 33Thailand 13Chile 15Peru 54Uganda 69Varshney 2000:719 (on countries)
4
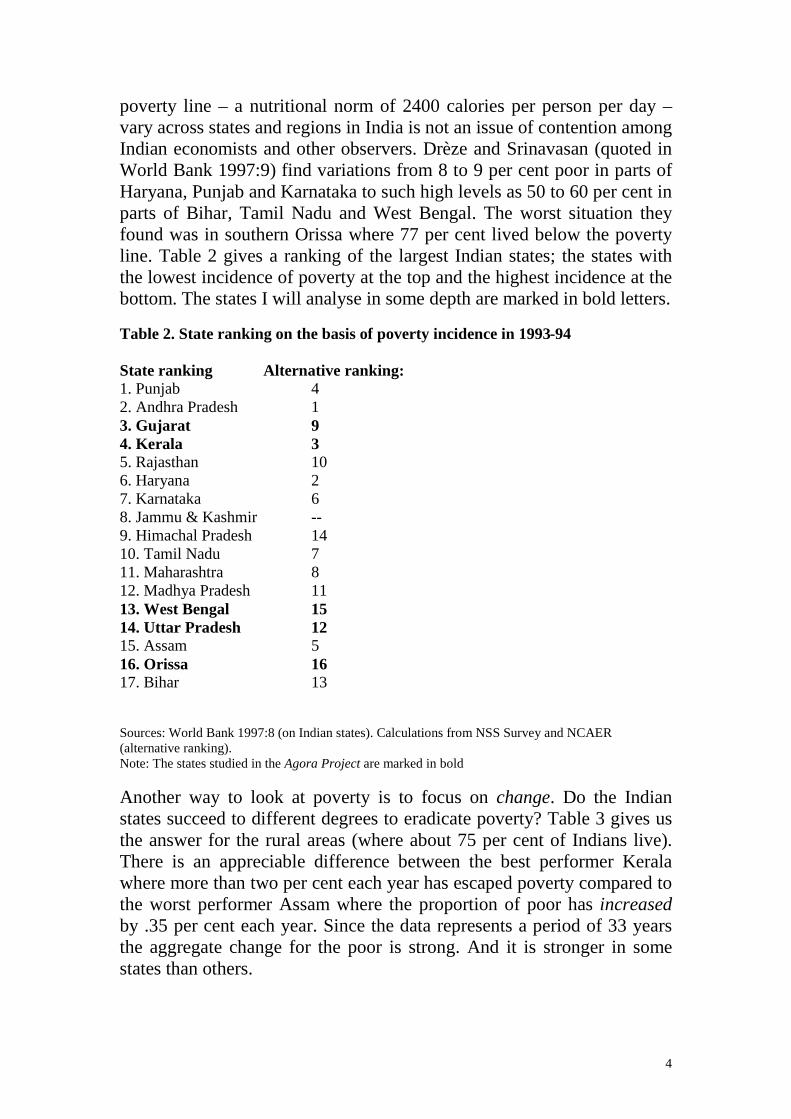
poverty line – a nutritional norm of 2400 calories per person per day –vary across states and regions in India is not an issue of contention among Indian economists and other observers. Drèze and Srinavasan (quoted in World Bank 1997:9) find variations from 8 to 9 per cent poor in parts of Haryana, Punjab and Karnataka to such high levels as 50 to 60 per cent in parts of Bihar, Tamil Nadu and West Bengal. The worst situation they found was in southern Orissa where 77 per cent lived below the poverty line. Table 2 gives a ranking of the largest Indian states; the states with the lowest incidence of poverty at the top and the highest incidence at the bottom. The states I will analyse in some depth are marked in bold letters.
Table 2. State ranking on the basis of poverty incidence in 1993-94
State ranking Alternative ranking:1. Punjab 42. Andhra Pradesh 13. Gujarat 94. Kerala 35. Rajasthan 106. Haryana 27. Karnataka 68. Jammu & Kashmir --9. Himachal Pradesh 1410. Tamil Nadu 711. Maharashtra 812. Madhya Pradesh 1113. West Bengal 1514. Uttar Pradesh 1215. Assam 516. Orissa 1617. Bihar 13
Sources: World Bank 1997:8 (on Indian states). Calculations from NSS Survey and NCAER (alternative ranking).Note: The states studied in the Agora Project are marked in bold
Another way to look at poverty is to focus on change. Do the Indian states succeed to different degrees to eradicate poverty? Table 3 gives us the answer for the rural areas (where about 75 per cent of Indians live). There is an appreciable difference between the best performer Kerala where more than two per cent each year has escaped poverty compared to the worst performer Assam where the proportion of poor has increasedby .35 per cent each year. Since the data represents a period of 33 years the aggregate change for the poor is strong. And it is stronger in some states than others.

5
Table 3. State ranking on the basis of percent of annual change in rural poverty
State ranking Change in rural poverty:1. Kerala -2.262. Andhra Pradesh -2.233. Punjab -2.173. Haryana -2.175. Rajasthan -1.806. Gujarat -1.697. Orissa -1.578. West Bengal -1.499. Tamil Nadu -1.4410. Maharashtra -1.2111. Uttar Pradesh -1.1812. Karnataka -0.6713. Jammu & Kashmir -0.6414. Madhya Pradesh -0.46 15. Bihar -0.1416. Assam 0.35Himachal Pradesh NA
Source: Datt and Ravallion 1998:22 (on change in rural poverty). The figures are the annual change 1957/58 – 1991 in Headcount index, i.e. the proportion of the population living below the poverty line.Note: The states studied in the Agora Project are marked in bold
It is important at this juncture to remind the reader that we should try to keep two truths in our minds at the same time. In terms of absolute numbers and proportion India is a very poor country. Very few people starve to death but close to 400 million people can not afford to eat what is regarded as a minimum for a human being. At the same time significant improvements have been accomplished. The allegation that “nothing has happened” is simply not true. It goes without saying that these changes, here represented in dry statistical figures, have meant important changesto millions of Indians. How have these changes come about? If such differences in level of poverty and changes in poverty levels can be explained we are probably also in a better position to induce further changes and to affect public policy.
Of the factors investigated by Datt and Ravallion (1998) they found that rural economic growth, low inflation, and initial endowments of physical infrastructure and human resources explain why some states have been better at reducing poverty. Two other important results from their study are that they find no evidence that growth in non-agricultural incomes had any independent effect on poverty reduction. Neither do they find any statistically significant effect from per capita state development expenditure. Especially the latter is, I think, quite startling.
6
But other factors may influence poverty alleviation. Politics, for instance. In an influential book Atul Kohli (1987) argued and gave evidence why what he called ‘regime type’ is of considerable importance for the effectiveness of state-initiated redistribution and therefore level of poverty. He compared the governments and policy outcomes of the Congress government in Karnataka, the Janata government in Uttar Pradesh, and the Communist government in West Bengal. His conclusion is that leadership, ideology, organization, and class basis of the party (regime) is what makes the redistributive policy “tick”.
There is no denying that “authority structures and regime types” (Kohli 1987:1) matter for the formulation of public policies and their execution. But in this paper I will focus on another aspect of the political, viz. the people who vote for the parties’ candidates and their social circumstances. Does it matter for a particular type of regime who their voters are and what they do? Do the relationships between these voters have an impact? If our criteria is poverty reduction, do their individual capacities and their collective capacities matter, apart from the party and the Chief Minister they have elected?
I believe such a conjecture will be put to hard test in India, usually considered a “top-down” democracy. India is, in other words, a “least likely case” in Harry Ecksteins (1975) informative terminology. But how would one test such a proposition empirically? We would need, at a minimum, two states where the outcome (the dependent variable) ‘poverty reduction’ varies, the hypothetical explanation ‘regime type’ can be “held constant” and (our “runner-up” explanation) the citizens, the voters, would “vary”. Ideally several other potentially important explanations would also be “constant” between the two states. As the reader will understand such conditions are almost never there in real life. But, as it happens, this close-to-experimental-situation exist in India: For long periods of time the states of Kerala and West Bengal has been ruled by CPM, the Communist Party of India (Marxist). Kohli (1987:227) describes the West Bengal party as “A well organized parliamentary-Communist regime” and there is no evidence to my knowledge that its Kerala branch is not as organized and coherent. John Harriss (199x:20) puts it this way: “The outstandingly successful political parties of the last quarter-century have been the CPI(M) in West Bengal and Kerala”.4 And that may be true when one compares with other states in India. But that factor, regime type, cannot explain why in spite of these similarities the two states have succeeded very differently in doing away with poverty (cf
4 Other successful parties he mentions are BJP, Shiv Sena and DMK/ADMK.

7
tables 2 and 3 above). And the per capita income is in fact higher in West Bengal than Kerala.5 So it seems that ‘regime type’ can not help us explain the rather strong difference of poverty alleviation between the two states. The same conclusion is reached by Harriss (199x:6) when he writes “if we take the actual performance in reducing poverty as one indicator of ‘pro-poor’ policy stance then it does not appear that the left-of-centre regime in West Bengal celebrated by Kohli has necessarily been outstanding”.
Two caveats are in order before I continue. The first is that, after all, this is a study of just two cases. And it is a lame defence to say that many other political scientists base their conclusions on just one or even no case (i.e. informed guesses). The second is the vagueness of the concept of ‘regime type’. I believe I represent Kohli’s position correctly (cf Kohli 1987:227). But I also understand that some would stretch the concept of ‘regime type’ to include the kind of social and political variables that I will analyse below. For instance, John Harriss (199x:12) explicitly writes about regime differences expressing themselves as ‘party-dominated government’ and “the nature and extent of political mobilisation and of organisation in both civil and political society”.6 Luckily, for our purpose here, Harriss (also) finds that Kerala and West Bengal represent the same kind of regime type, as represented in figure 1.
5 And as Datt and Ravallion show, the growth rate of per capita state development expenditure (1960-90) is, again, higher in West Bengal (5.28%) than Kerala (4.32%). Neither does this difference between Kerala and West Bengal seem to be explained by difference in agricultural output, which is higher for West Bengal (Harriss 19xx:10) nor by difference in proportion of landless, which is higher in Kerala (Srinavasan & Bardhan 19xx:131).6 Everyone is of course at liberty to define his/her own words, but a problem with Harriss’ way of defining regime is that it rules out making causal arguments and analyses between ‘party-dominated government’ on the one hand and political mobilisation, on the other, since they are defined as one and the same.

8
Figure 1. A typology of political regimes in India
Did Congress have an initiative in recruiting lower castes?
Yes No
Did the lower castes assert themselves? Yes
Gujarat KarnatakaMaharashtraAndhra Pradesh
KeralaWest BengalTamil Nadu
No Uttar PradeshOrissaBiharMadhya PradeshRajasthan
Source: Harriss 199x:17 (built on the analysis in Church 1984).Note: The states studied in the Agora Project are marked in bold
How can the difference in poverty alleviation between Kerala and West Bengal be explained in spite of the similarity in their regimes or party7 in power? In the rest of the paper I will discuss and give evidence for a possible explanation. The data comes from a large study the Agora Project8 did in 1998 and 1999 where we made personal interviews with 3,200 people in 31 rural and urban areas in five states in India9 (the five states are marked in bold in figure 1). (See the Appendix for the areas and the selection procedure).
The explanation is, I will argue, strong differences between the two states in terms of political mobilisation, civil society and social capital. I will also discuss how these factors are affected by differences in education among those who participate in politics and local society. In other words, I will strongly question the conventional picture of both Kerala and West Bengal being states where the population is highly mobilised, politically conscious and aware. This picture is true of Kerala but not of West Bengal.
7 CPM has had power uninterruptedly in West Bengal since 1977 whereas CPM in Kerala has been in and out of the government several times since as early as 1957, a difference which I will come back to.8 A collaborative research project between the Department of Political Studies, University of the Witwatersrand, Johannesburg, South Africa; Centre for Political Studies at Jawaharlal Nehru University, New Delhi; the Department of Political Science, Utkal University, Bhubaneswar; the departments of Government and Peace and Conflict Research at Uppsala University in Sweden. I wish to thank the Swedish agency Sida/SAREC for generous financial support of the research.9 We also interviewed 1,000 people in South Africa (cf Strand 2001).
9
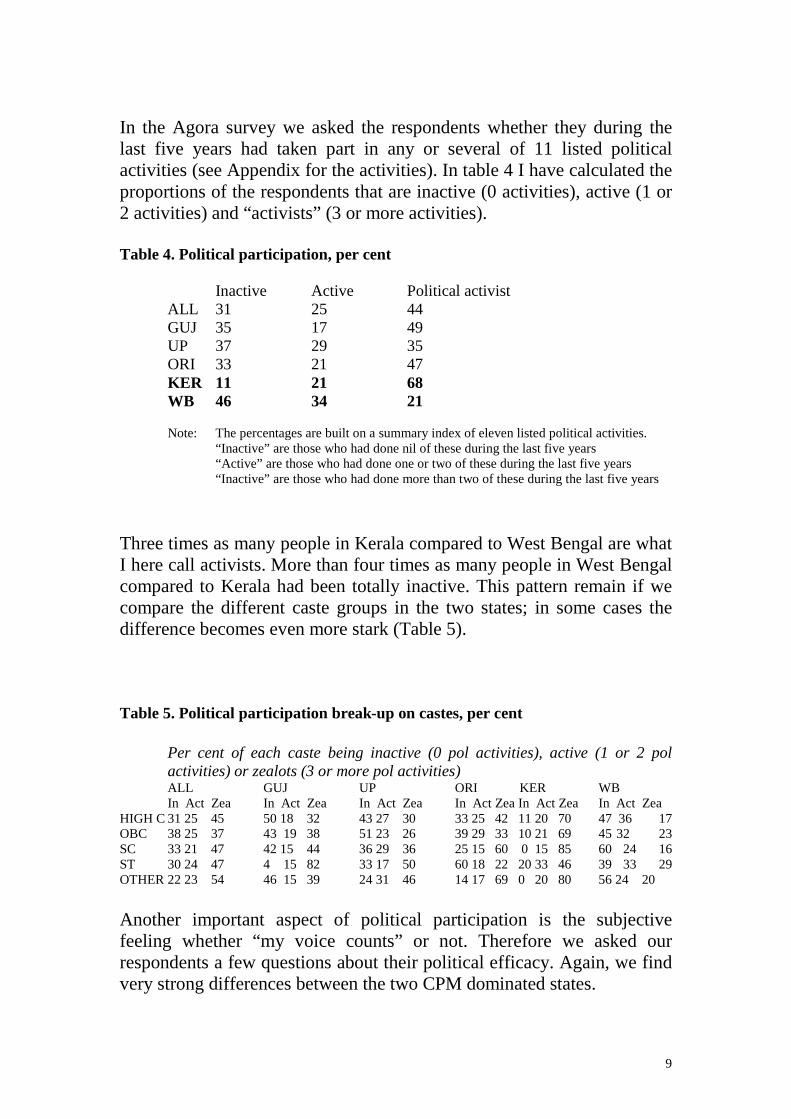
In the Agora survey we asked the respondents whether they during the last five years had taken part in any or several of 11 listed political activities (see Appendix for the activities). In table 4 I have calculated the proportions of the respondents that are inactive (0 activities), active (1 or 2 activities) and “activists” (3 or more activities).
Table 4. Political participation, per cent
Inactive Active Political activistALL 31 25 44GUJ 35 17 49UP 37 29 35ORI 33 21 47KER 11 21 68WB 46 34 21
Note: The percentages are built on a summary index of eleven listed political activities.“Inactive” are those who had done nil of these during the last five years“Active” are those who had done one or two of these during the last five years“Inactive” are those who had done more than two of these during the last five years
Three times as many people in Kerala compared to West Bengal are what I here call activists. More than four times as many people in West Bengal compared to Kerala had been totally inactive. This pattern remain if we compare the different caste groups in the two states; in some cases the difference becomes even more stark (Table 5).
Table 5. Political participation break-up on castes, per cent
Per cent of each caste being inactive (0 pol activities), active (1 or 2 pol activities) or zealots (3 or more pol activities)ALL GUJ UP ORI KER WBIn Act Zea In Act Zea In Act Zea In Act Zea In Act Zea In Act Zea
HIGH C 31 25 45 50 18 32 43 27 30 33 25 42 11 20 70 47 36 17 OBC 38 25 37 43 19 38 51 23 26 39 29 33 10 21 69 45 32 23SC 33 21 47 42 15 44 36 29 36 25 15 60 0 15 85 60 24 16ST 30 24 47 4 15 82 33 17 50 60 18 22 20 33 46 39 33 29OTHER 22 23 54 46 15 39 24 31 46 14 17 69 0 20 80 56 24 20
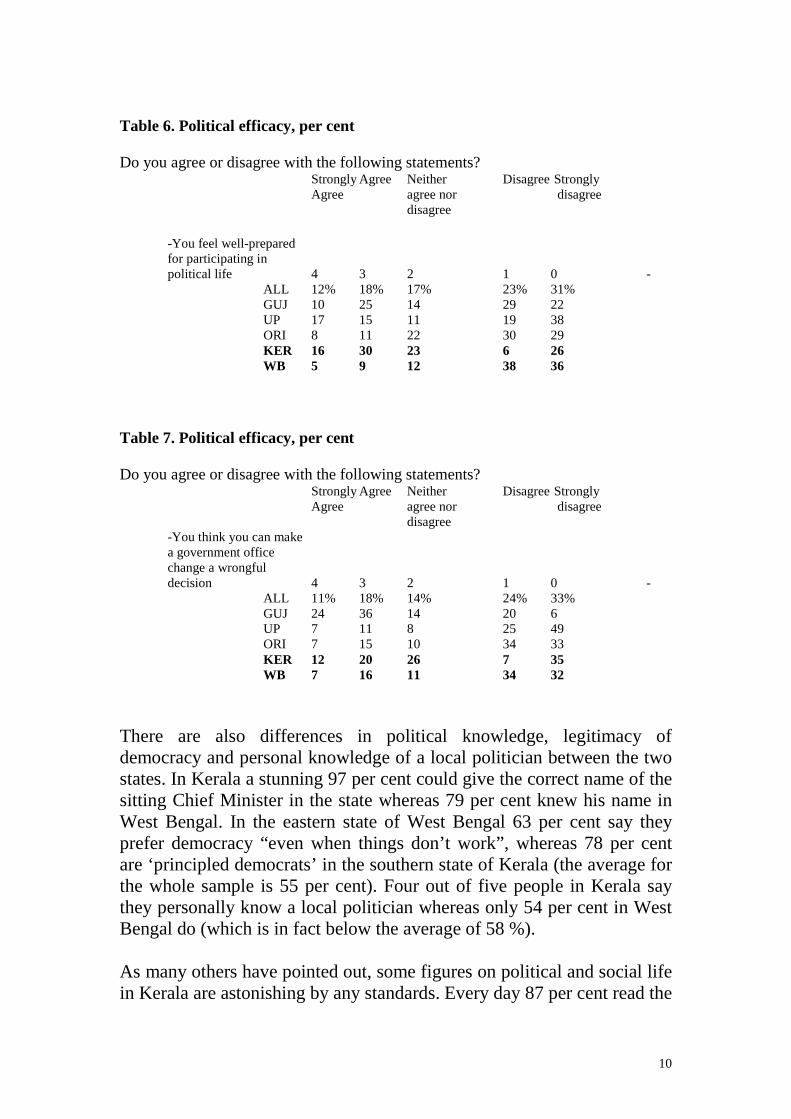
Another important aspect of political participation is the subjective feeling whether “my voice counts” or not. Therefore we asked our respondents a few questions about their political efficacy. Again, we find very strong differences between the two CPM dominated states.
10
Table 6. Political efficacy, per cent
Do you agree or disagree with the following statements? Strongly Agree Neither Disagree StronglyAgree agree nor disagree
disagree
-You feel well-prepared for participating in political life 4 3 2 1 0 -
ALL 12% 18% 17% 23% 31%GUJ 10 25 14 29 22UP 17 15 11 19 38ORI 8 11 22 30 29KER 16 30 23 6 26WB 5 9 12 38 36
Table 7. Political efficacy, per cent
Do you agree or disagree with the following statements? Strongly Agree Neither Disagree StronglyAgree agree nor disagree
disagree-You think you can make a government office change a wrongful decision 4 3 2 1 0 -
ALL 11% 18% 14% 24% 33%GUJ 24 36 14 20 6UP 7 11 8 25 49ORI 7 15 10 34 33KER 12 20 26 7 35WB 7 16 11 34 32
There are also differences in political knowledge, legitimacy of democracy and personal knowledge of a local politician between the two states. In Kerala a stunning 97 per cent could give the correct name of the sitting Chief Minister in the state whereas 79 per cent knew his name in West Bengal. In the eastern state of West Bengal 63 per cent say they prefer democracy “even when things don’t work”, whereas 78 per cent are ‘principled democrats’ in the southern state of Kerala (the average for the whole sample is 55 per cent). Four out of five people in Kerala say they personally know a local politician whereas only 54 per cent in West Bengal do (which is in fact below the average of 58 %).
As many others have pointed out, some figures on political and social life in Kerala are astonishing by any standards. Every day 87 per cent read the
11
news in a paper and 79 per cent listen to the news in radio (the corresponding figures in West Bengal is 36 and 24 per cent). Almost every second person in Kerala discusses “public issues” outside the household “almost every day” (20% in West Bengal, WB); another third has such discussions “once or a few times every week” (25% in WB).
The Agora study brings to light what seems to be rather strong differences in levels of political participation, efficacy, knowledge and interest between the two “CPM states” of Kerala and West Bengal. In both the states the level of political participation affects democratic responsiveness (measured as the respondents own perception whether the state government is interested in people like her/himself). This is also true for Gujarat but, interestingly, not for Uttar Pradesh and Orissa.10
We want to continue and ask why this difference in ‘politicisation’ exists. A conventional explanation is that differences in political activity are due to the kind of party in power (cf Verba, Nie, Kim 1978). But here we have a case of left-of-centre reformist parties in both states. Below I will probe whether or to what extent three other factors can help us understand this unexpected difference: social capital, education, and initial conditions.
Social capital refers to connectedness between people. It is therefore, by definition, a resource one has together with one or many others. Social capital is an informal resource usually defined by common norms, a joint network and shared trust (Coleman 1988, Putnam 1993, 2000, Blomkvist & Swain 2001). With such a theoretical definition it should be clear that social capital can be used for many different purposes, as is the case with financial or human capital. A trade union builds and utilises social capital; but so did the terrorists who bombed the Oklahoma building in 1995. The most important theoretical point with social capital is that it can help people, actors, overcome so-called ‘dilemmas of collective action’ (cf Olson 1965). Social capital can appear informally –neighbours chatting or friends playing cards – or more formally –neighbours or workers forming an association to meet and protect their interests. Social capital is not spread evenly nor found everywhere in societies. Mondak and Gearing (1998) make the strong point that very few people in the Romanian city of Cluj-Napoca even spoke with people outside of their own household; without the most rudimentary form of communication it is close to impossible to have social capital. Apart from being utilised for different purposes, social capital can also be structured
10 OLS regression, significant on .001 level (at .01 level for West Bengal), controlling for respondent’s economic standard and education. For the whole sample the effect remains.

12
very differently in different countries or regions or villages. Two of the more interesting distinctions made in the literature are ‘the social basis of social capital’ and the difference between inter- and intra-group social capital. The first refers to the fact that there are big variations in terms of “whose” social capital we may find. It certainly makes a political difference whether it is agricultural workers or landlords who have strong networks and trust in each other. The latter distinction has been labelled elegantly by Robert Putnam (2000) as ‘bridging’ vs ‘bonding’ social capital. Does the network and the trust stretch across or remain insidegroup boundaries?11
A prime interest in the Agora project is to find out whether social capital has an impact on democratic performance in post-colonial and economically poor circumstances.12 Therefore we included quite a few questions on networks, interpersonal trust, norms, and associational memberships in our interviews. We therefore have a fairly unique data set on social capital indicators for South Africa and India, data that several authors (Serra 2001, Mayer 2001, Morris 1998) have looked for.13
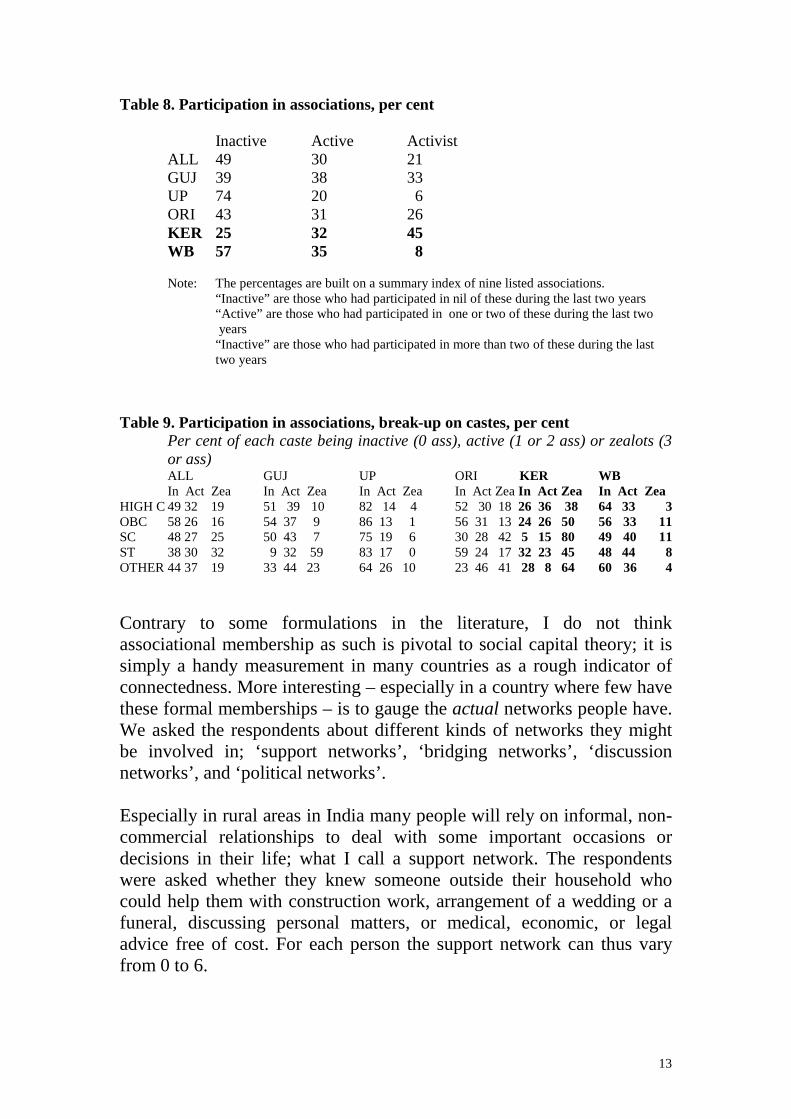
Since memberships in formal associations have been almost a household word in the literature on social capital, I will start by reporting our findings on that. We asked the respondents whether they knew of, had participated in, or had a position in any or several of nine different kinds of associations (the list is found in the Appendix). Our data tell us two striking things. The first is the generally low level of participation in formal associations, which has also been observed by others (Chhibber 1999, Mitra 1999:219). Controlling for the population size of “our” five states our data has a striking consistency with the studies done by Chhibber and Mitra: between 13 to 15 per cent of the Indian population seem to be a member of any formal association. The second conclusion we can draw is that there are big variations between different states, as can be seen in Table 8.
11 This is in fact a theoretically and conceptually very difficult issue. Which group(s) are we talking about when we refer to bonding and bridging? A tie or a network that is bonding in reference to class may be bridging in reference to ethnic group or gender. Etc.12 Most studies on social capital has been done in OECD countries.13 Facing the dearth of data these authors have used available information where some of their indicators do not reflect social capital particularly well.
13
Table 8. Participation in associations, per cent
Inactive Active ActivistALL 49 30 21GUJ 39 38 33UP 74 20 6ORI 43 31 26KER 25 32 45WB 57 35 8
Note: The percentages are built on a summary index of nine listed associations.“Inactive” are those who had participated in nil of these during the last two years“Active” are those who had participated in one or two of these during the last two years“Inactive” are those who had participated in more than two of these during the last two years
Table 9. Participation in associations, break-up on castes, per centPer cent of each caste being inactive (0 ass), active (1 or 2 ass) or zealots (3 or ass)ALL GUJ UP ORI KER WBIn Act Zea In Act Zea In Act Zea In Act Zea In Act Zea In Act Zea
HIGH C 49 32 19 51 39 10 82 14 4 52 30 18 26 36 38 64 33 3 OBC 58 26 16 54 37 9 86 13 1 56 31 13 24 26 50 56 33 11SC 48 27 25 50 43 7 75 19 6 30 28 42 5 15 80 49 40 11ST 38 30 32 9 32 59 83 17 0 59 24 17 32 23 45 48 44 8OTHER 44 37 19 33 44 23 64 26 10 23 46 41 28 8 64 60 36 4
Contrary to some formulations in the literature, I do not think associational membership as such is pivotal to social capital theory; it is simply a handy measurement in many countries as a rough indicator of connectedness. More interesting – especially in a country where few have these formal memberships – is to gauge the actual networks people have. We asked the respondents about different kinds of networks they might be involved in; ‘support networks’, ‘bridging networks’, ‘discussion networks’, and ‘political networks’.
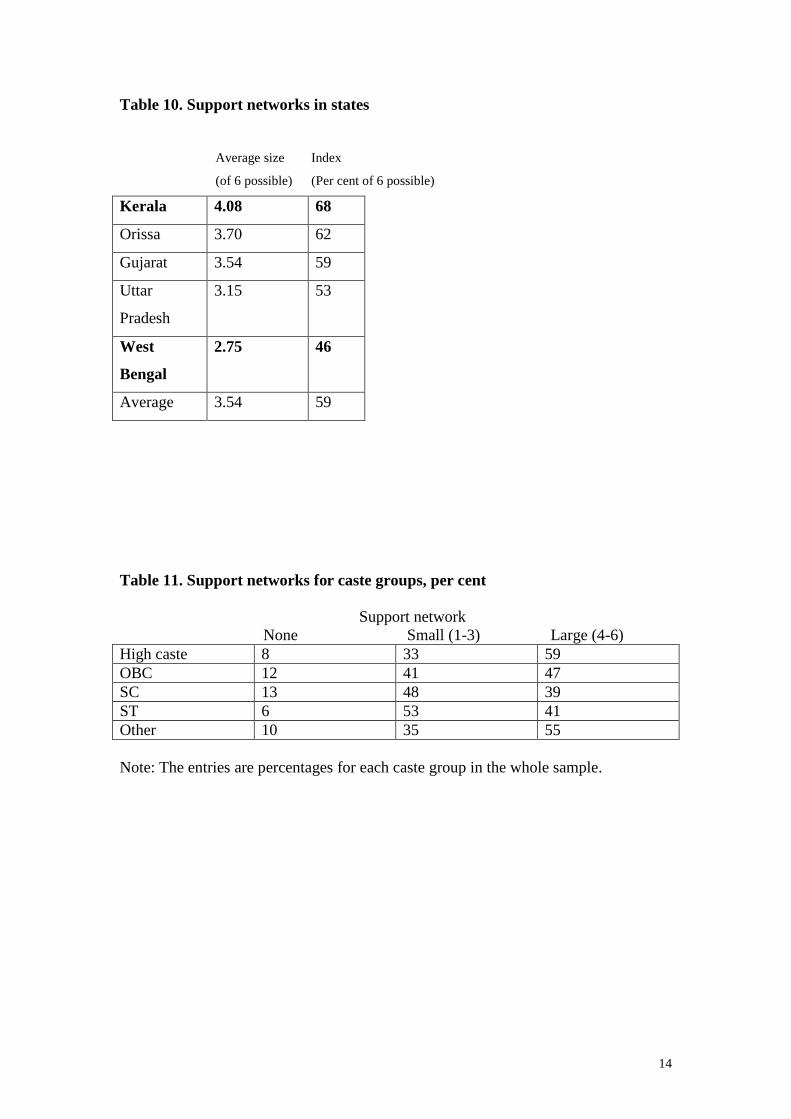
Especially in rural areas in India many people will rely on informal, non-commercial relationships to deal with some important occasions or decisions in their life; what I call a support network. The respondents were asked whether they knew someone outside their household who could help them with construction work, arrangement of a wedding or a funeral, discussing personal matters, or medical, economic, or legal advice free of cost. For each person the support network can thus vary from 0 to 6.
14
Table 10. Support networks in states
Average size Index
(of 6 possible) (Per cent of 6 possible)
Kerala 4.08 68
Orissa 3.70 62
Gujarat 3.54 59
Uttar
Pradesh
3.15 53
West
Bengal
2.75 46
Average 3.54 59
Table 11. Support networks for caste groups, per cent
Support networkNone Small (1-3) Large (4-6)
High caste 8 33 59OBC 12 41 47SC 13 48 39ST 6 53 41Other 10 35 55
Note: The entries are percentages for each caste group in the whole sample.

15
Table 12. Bridging networks.
Per cent spending time every day or every week with people:
They don’t Who have a Of a different Of a different
know well different way caste religion
of life Average
Kerala 34 60 89 87 68
Gujarat 34 29 54 54 43
West
Bengal
19 35 61 47 41
Orissa 14 22 63 45 36
Uttar
Pradesh
60 60 0 0 30
Average 32 42 57 50 47
Table 13. Discussion networks in states
Per cent in each state who talk with people outside of the household about public
issues every day or every week
Kerala 72
Orissa 54
Uttar
Pradesh
54
Gujarat 43
West
Bengal
40
Average 54
As can be seen from the three tables above, on average people in Kerala have much more extensive “everyday” networks than people in West Bengal. The theoretical idea behind bringing in data reflecting such ordinary activities such as arranging for a wedding or chatting with your
16
neighbour from another caste is that we surmise that these networks can facilitate or cause political participation. The core idea in social capital theory is that connections between persons (actors) lowers the thresholds or transaction costs for more or other kinds of communication: they enable people to cooperate. If you know a neighbour from chatting or getting advice, it is then also more easy to convince her/him to join in a demonstration against a grievance you share.
This is also borne out by our data. The size and the intensity of networks affect people’s propensity to take part in politics and in protest mobilisation14 (Blomkvist 2001, Blomkvist & Vernby 2001).
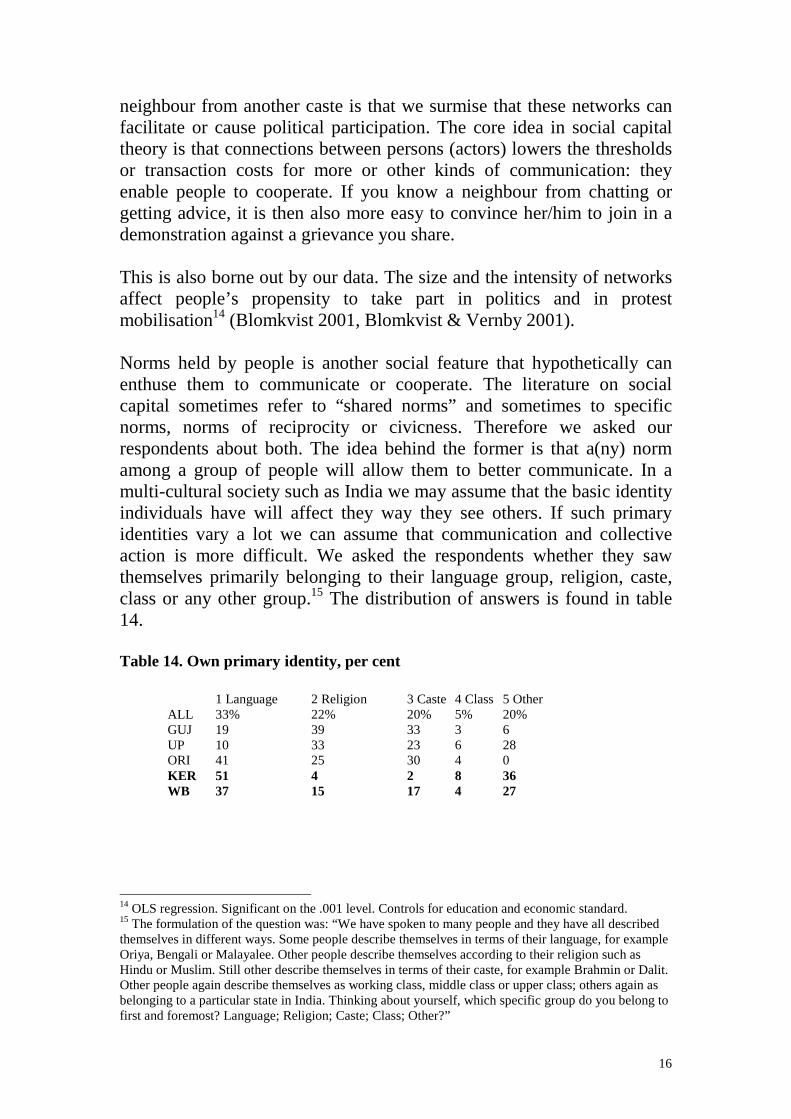
Norms held by people is another social feature that hypothetically can enthuse them to communicate or cooperate. The literature on social capital sometimes refer to “shared norms” and sometimes to specific norms, norms of reciprocity or civicness. Therefore we asked our respondents about both. The idea behind the former is that a(ny) norm among a group of people will allow them to better communicate. In a multi-cultural society such as India we may assume that the basic identity individuals have will affect they way they see others. If such primary identities vary a lot we can assume that communication and collective action is more difficult. We asked the respondents whether they saw themselves primarily belonging to their language group, religion, caste, class or any other group.15 The distribution of answers is found in table 14.
Table 14. Own primary identity, per cent
1 Language 2 Religion 3 Caste 4 Class 5 Other ALL 33% 22% 20% 5% 20%GUJ 19 39 33 3 6UP 10 33 23 6 28ORI 41 25 30 4 0KER 51 4 2 8 36WB 37 15 17 4 27
14 OLS regression. Significant on the .001 level. Controls for education and economic standard.15 The formulation of the question was: “We have spoken to many people and they have all described themselves in different ways. Some people describe themselves in terms of their language, for example Oriya, Bengali or Malayalee. Other people describe themselves according to their religion such as Hindu or Muslim. Still other describe themselves in terms of their caste, for example Brahmin or Dalit. Other people again describe themselves as working class, middle class or upper class; others again as belonging to a particular state in India. Thinking about yourself, which specific group do you belong to first and foremost? Language; Religion; Caste; Class; Other?”
17
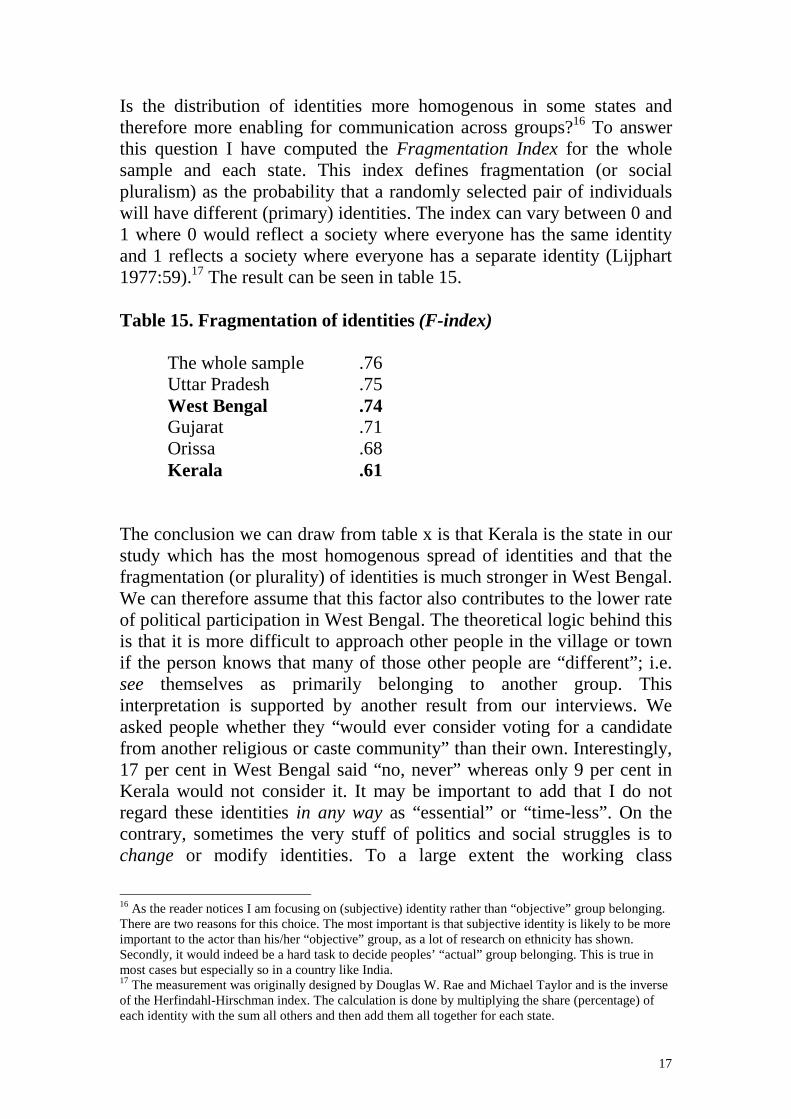
Is the distribution of identities more homogenous in some states and therefore more enabling for communication across groups?16 To answer this question I have computed the Fragmentation Index for the whole sample and each state. This index defines fragmentation (or social pluralism) as the probability that a randomly selected pair of individuals will have different (primary) identities. The index can vary between 0 and 1 where 0 would reflect a society where everyone has the same identity and 1 reflects a society where everyone has a separate identity (Lijphart 1977:59).17 The result can be seen in table 15.
Table 15. Fragmentation of identities (F-index)
The whole sample .76Uttar Pradesh .75West Bengal .74Gujarat .71Orissa .68Kerala .61
The conclusion we can draw from table x is that Kerala is the state in our study which has the most homogenous spread of identities and that the fragmentation (or plurality) of identities is much stronger in West Bengal. We can therefore assume that this factor also contributes to the lower rate of political participation in West Bengal. The theoretical logic behind this is that it is more difficult to approach other people in the village or town if the person knows that many of those other people are “different”; i.e. see themselves as primarily belonging to another group. This interpretation is supported by another result from our interviews. We asked people whether they “would ever consider voting for a candidate from another religious or caste community” than their own. Interestingly, 17 per cent in West Bengal said “no, never” whereas only 9 per cent in Kerala would not consider it. It may be important to add that I do not regard these identities in any way as “essential” or “time-less”. On the contrary, sometimes the very stuff of politics and social struggles is to change or modify identities. To a large extent the working class
16 As the reader notices I am focusing on (subjective) identity rather than “objective” group belonging. There are two reasons for this choice. The most important is that subjective identity is likely to be more important to the actor than his/her “objective” group, as a lot of research on ethnicity has shown. Secondly, it would indeed be a hard task to decide peoples’ “actual” group belonging. This is true in most cases but especially so in a country like India. 17 The measurement was originally designed by Douglas W. Rae and Michael Taylor and is the inverse of the Herfindahl-Hirschman index. The calculation is done by multiplying the share (percentage) of each identity with the sum all others and then add them all together for each state.

18
movements in Western Europe in the 19th and 20th centuries could be described in such terms. (Marxists talk about the difference between class-in-itself and class-for-itself). The “struggle” over identities is also very much part of the Dalit movement in India (cf Inkinen’s study of BSP in Uttar Pradesh, 2003).18
As I pointed out above, norms can also in a substantive sense have a content which reflects or enables cooperative behaviour. In the literature such norms are often called ‘norms of reciprocity’ or ‘civic norms’. We asked the respondents seven different questions aimed to gauge either their own ‘civicness’ or their judgement whether they thought other people in general are ‘civicminded’. Information based on three of these19
questions is found in table x.
Table 16. Norms of reciprocity, per cent
ALL UP GUJ ORI KER WB
-People are always interested only in their own welfarePer cent disagreeing 9 6 8 7 8 19
-Sometimes we have to make important sacrifices since another town or village needs the support of the government more than we doPer cent agreeing 20 14 24 31 10 13
-In this society one has to be alert or someone is likely to take advantage of youPer cent disagreeing 7 6 4 6 7 11
Average for the three items 12 9 12 15 8 14
Two interesting conclusions can be dawn from table 16. The first is the general and low proportion in all the five states who have civic values and also that Kerala has the lowest average of the five states. The second is the very small variations between the states. Based on this information we can not make an argument that the extent of ‘norms of reciprocity’ in Kerala and West Bengal can help us understand the difference in political participation and poverty rates.
18 It may of course be interesting to muse over the very low proportions – also in Marxist strong-holds Kerala and West Bengal – who see themselves primarily as “class”.19 These three items, together with two others, correlate (significant on the 0.01 level).
19
The last part of our social capital index to consider is the amount of interpersonal trust our interviews revealed. It is important to point out the distinction between interpersonal or social trust, on the one hand, and trust in institutions or political trust, on the other. Sometimes the two are confused conceptually, but having trust in your fellow citizens does not necessarily mean you have trust in the political institutions; or vice versa.
Several studies in OECD countries have shown that there often are strong correlations between trust in people and trust in government or political institutions.20 There are heated debates whether the first causes the second (e.g. Putnam 2000) or the second causes the first (e.g. Rothstein & Kumlin 2001). But our data indicate that the connection between interpersonal trust and government performance (in India) may not be particularly strong at all. I have shown elsewhere (Blomkvist 2001) that OLS regression show there is a negative relation between people’s trust and (their evaluation of) government performance.
What role does education play in this? Looking at the whole sample of 3,200 respondents there is a statistically significant effect of level of education on political participation.21 But if we look at this relationship for each state another and very interesting picture emerges. The effect of the individual’s education on his/her political participation disappears in Kerala and West Bengal and even becomes a negative factor in Gujarat. Given the conventional wisdom that education always and everywhere affects political engagement and attitudes, and the central role (primary) education often is given in aid and discussions about development this result is astonishing. Are we simply wrong? Or can these data be interpreted in a light that make them more comprehensible?
If we sharpen our lens and make the picture more nuanced by looking at the separate caste groups for the whole sample and the respective states we find what is reported in tables 17 and 18.
20 In our data the picture is much more varied, depending on what kind of interpersonal trust we talk about. 21 OLS regression, controlling for the individual’s economic standard, trust in Indians, participation in associations, support network, bridging network, and discussion network.

20
Table 17. Correlation between education and political participation, Pearson’s r
1 Higher caste 2 OBC 3 SC 4 ST 5 OtherALL .300*** .247*** .281*** .192** .357***GUJ .273*UP .247*** .311*** .498***ORI .393*** .182** .488***KER -.331*WB
Note: The blank spaces denote that the correlation is not statistically significant.
Table 18. Correlation between education and political efficacy, Pearson’s r
1 Higher caste 2 OBC 3 SC 4 ST 5 OtherALL GUJ .183* -.144*UP .166*ORI .118* .287*** .KER .289*WB .160*
Note: The blank spaces denote that the correlation is not statistically significant.
The seemingly paradoxical picture that emerges from the last two tables is that education matter most to poor people where they are politically most disadvanteged. The perhaps most repressed group in India, the Dalits (or Scheduled Castes), only benefit politically from education in the two states where they as a collective force has not asserted themselves (cf figure 1). On the other hand, in the three states where lower castes historically have asserted themselves more political participation and efficacy does not follow from (more) education.
But is all this not just simply confusing and wrong? I must admit I was surprised to see the results myself. But I think we can interpret the pattern meaningfully. In the 1970s Sidney Verba, Norman H. Nie and Jae-On Kim did a path-breaking study of political participation in seven countries: Austria, India, Japan, the Netherlands, Nigeria, and the United States. The main conclusion from their study, which has influenced political research since then, was that the effect of social class or background was moderated in some countries because the poor or the working class in those countries had institutional resources that offset some of the ‘class-effect’ on political participation. In other words, in countries where people with less socio-economic resources had managed to establish organisations (primarily trade unions) and voted leftist parties into parliaments and governments these same groups of people were less
21
hindered by their education or income in their wish to take part in politics.
If we “reverse” the result from Verba, Nie, Kim (1978) I think we can explain, or give meaning to, the pattern we have found. In Gujarat, Kerala, and West Bengal the lower castes have asserted themselves and thus play a more prominent political role than in Orissa and Uttar Pradesh. Precisely for this reason the individual resource of the Scheduled castes in terms of their education play less of a role for their political participation.
* * *
Before closing the paper I will present two conjectures that might explain these surprising differences we have found between the two states of Kerala and West Bengal, often regarded as “leftist” by scholars as well as journalists. As I point out above, Datt and Ravallion (1998) found in their econometric analysis that “initial conditions” was one of the variables that explained most of poverty reduction in their model. In other words, the level of e.g. electrification, rural roads, literacy, infant mortality, irrigation in 1960 mattered a lot for the states’ achievements in reducing poverty three decades hence. From an unusual source this is an exemplary indication of path dependency – history matters (cf North 1990).
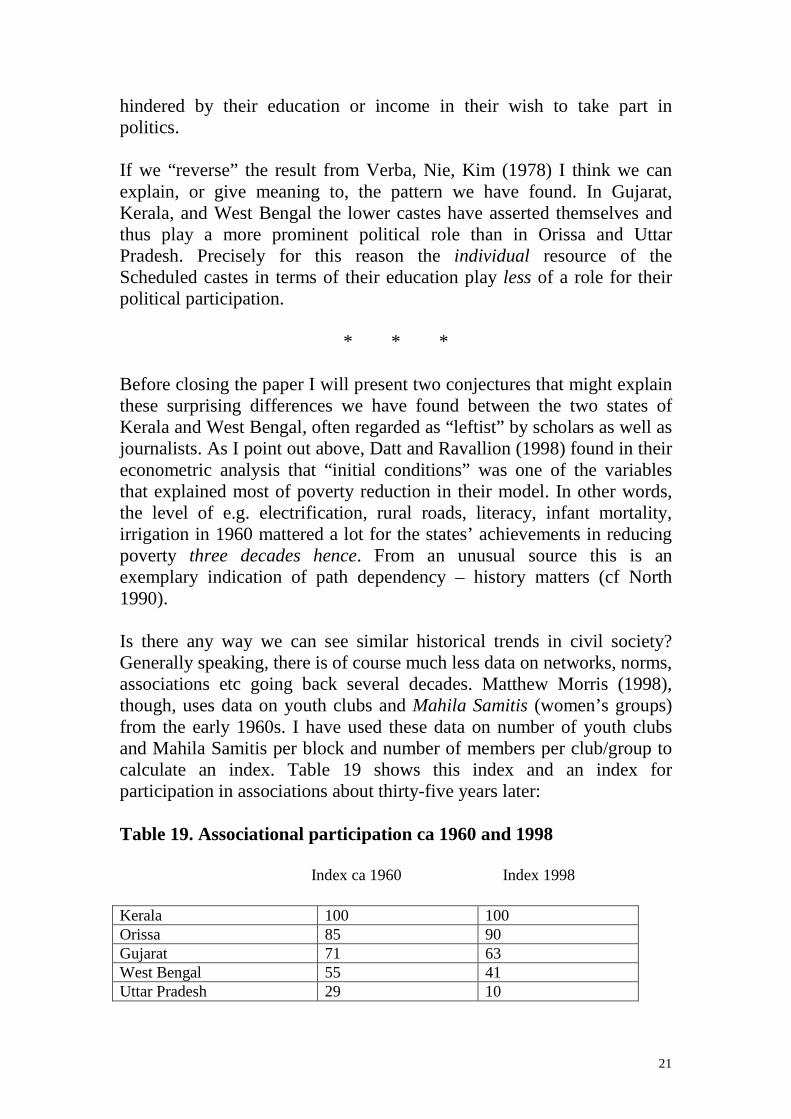
Is there any way we can see similar historical trends in civil society? Generally speaking, there is of course much less data on networks, norms, associations etc going back several decades. Matthew Morris (1998), though, uses data on youth clubs and Mahila Samitis (women’s groups) from the early 1960s. I have used these data on number of youth clubs and Mahila Samitis per block and number of members per club/group to calculate an index. Table 19 shows this index and an index for participation in associations about thirty-five years later:
Table 19. Associational participation ca 1960 and 1998
Index ca 1960 Index 1998
Kerala 100 100Orissa 85 90Gujarat 71 63West Bengal 55 41Uttar Pradesh 29 10
22
Especially since the data builds on entirely different sources the similarity is indeed striking. The rank order between the five states is untouched by the passage of close to 40 years. Orissa has “caught up” a bit, and the other three have “dropped behind” but otherwise we see no news. I do not wish to convey a conservative message by presenting these figures – “if you didn’t have in back in the 60s, there’s no way”.22 What I would like to emphasise, instead, is how strong historical patterns, inherited institutions and socialisation of new generations often are. In his study of workers and social movements in Kerala Patrick Heller (1999) traces the history of these movements and what I have called ‘vibrancy of civil society’ back to mobilisation of rural labour already in the 1920s and 30s. The same point is made by Ouseph Varkey (1984).
Apart from this unusual history of early mobilisation of lower classes and castes23 I would like to direct attention to another difference between Kerala and West Bengal: the length of power in the state government by CPM. In Kolkata (earlier Calcutta) CPM came to power in the aftermath of Indira Gandhi’s Emergency in 1977 and have remained there ever since. The consecutive numbers of victories at the polls have been celebrated by many sympathetic to CPM and have been taken as a token of CPM support. But maybe this is a “tragedy in disguise” for CPM? An observer remarks that “A long, uninterrupted rule has made many [CPM] grassroots workers complacent” (Sen Gupta 1997:912). The Kolkata newspaper Statesman remarked in 1995 that “local administrations have been made ineffective by showing undue favours to hardcore party cadres who flout every rule in the book for personal gain. The police, politicised beyond belief, are now seen as possessing an infinite capacity to misbehave and oppress. ... Education in state schools is a huge farce.” (quoted in Sen Gupta 1997:911).
My analysis has shown the formal democratic liberties and the opportunities provided by decentralised government in India are filled and fulfilled to very different degrees. Although it is difficult to give conclusive evidence about causal relationships from a cross-sectional analysis I think the paper has shown we have very good reasons to believe that political participation, social capital, and a vibrant civil society affects the responsiveness of a democratically elected
22 By pointing at possible path dependencies since the 13th century in explaining civic patterns in Italy Putnam (1993) has been accused of trying to push a conservative ideology. But being aware of historical continuities is not the same thing as privileging history politically. History can be “wrong” in a normative sense and people can change the course of history. 23 Church (1984) point out something which is highly interesting from a social capital perspective: the low caste Ezhava lived geographically concentrated. Such geographical concentration should make communication much easier (especially in days before radio, TV and even buses).
23
government. And by comparing two states, Kerala and West Bengal, that have had very similar political regimes I have shown that the relationships between and the activities of ordinary citizens makes a difference for the quality of democracy.

24
APPENDIX
State Per-capita net State domestic product at currentprices 1991-92 (Rs/year)
1. Punjab 9 643 182. Haryana 8 690 183. Maharashtra 8 180 484. Gujarat 6 425 40
5. Andhra Pradesh 5 570 326. Karnataka 5 555 467. West Bengal 5 383 338. Himachal Pradesh 5 355 NA
9. Tamil Nadu 5 078 4210. Kerala 4 618 3211. Rajasthan 4 361 4212. Assam 4 230 42
13. Madhya Pradesh 4 077 4614. Orissa 4 068 3815. Jammu & Kashmir 4 051 3116. Uttar Pradesh 4 012 38
Bihar 2 904 58
Table x. Development expenditure on education in Kerala and West Bengal
Per cent of development Per capita expenditure Expenditure (Rs, current prices)1980/81-84/851990/91-94/95 1980/81 1990/91
Kerala 44 43 88 264
West Bengal 33 39 45 200
Source: Harriss 199x: Tables 3 and 4 (his figures are calculated from data in RBI Bulletins)
Note that these figures are consistent with the finding in the Agora Project that 27 per cent in West Bengal see primary education as “the most important need in their own area” whereas only 12 per cent do so in Kerala.

25
Survey areas and selection procedure for the Agora study
Since we did not have resources to cover the whole of India, five states were chosen. The criteria was partly our interest and earlier work in some of the states, and partly an aim to cover a varied set of social and political circumstances in the sub-continent. Within each of those five states we chose seven areas (except Gujarat where we chose four areas), half urban and half rural, again with an ambition to cover the states’ variations. Within the area we chose a polling both from which voters’ list we drew a random sample.
1= Gujarat:1= Vadodora2= Anand3= Bhavngar4= Chhota
2= Uttar Pradesh:5= Lucknow Rural6= Lucknow Urban7= Azamgarh Rural8= Kanpur Urban9= Meerut Urban10= Meerut Rural11= Garhwal Urban+Rural
3= Orissa:12= Bahvgaon, Puri13= Puri City14= Sakhigopal, Puri15= Cuttack City16= Koraput City17= Jeypore, Koraput18= Tentulikhurtia, Koraput
4= Kerala:19= Calicut City20= Irikkur-Cannur21= Iritty-Cannur22= Murattupuzha23= Trivandrum Rural24= Trivandrum City25= Nemom-Trivandrum
5= West Bengal:26= Bartala (Calcutta North)27= Jadavapur (Calcutta South)28= Jhavgram (Midnapur)29= Tamluk (Midnapur)30= Asansol (Burdwan)31= Memari (Burdwan)
26
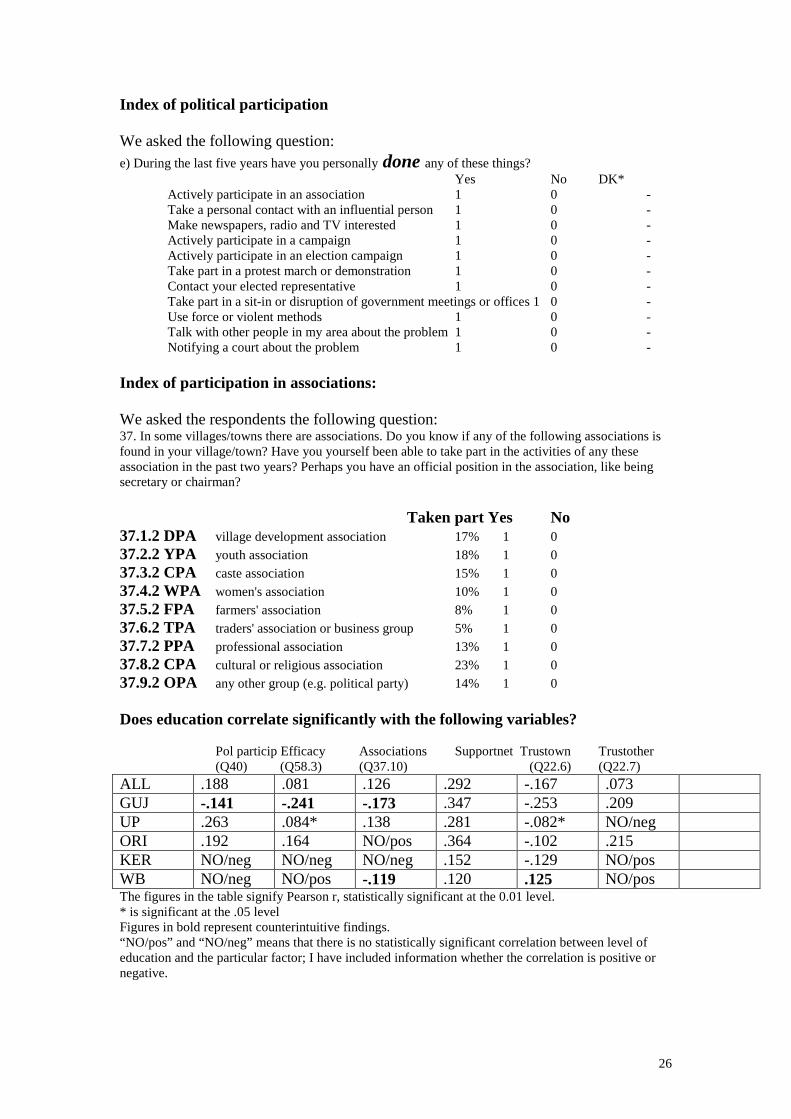
Index of political participation
We asked the following question:e) During the last five years have you personally done any of these things?
Yes No DK*Actively participate in an association 1 0 -Take a personal contact with an influential person 1 0 -Make newspapers, radio and TV interested 1 0 -Actively participate in a campaign 1 0 -Actively participate in an election campaign 1 0 -Take part in a protest march or demonstration 1 0 -Contact your elected representative 1 0 -Take part in a sit-in or disruption of government meetings or offices 1 0 -Use force or violent methods 1 0 -Talk with other people in my area about the problem 1 0 -Notifying a court about the problem 1 0 -
Index of participation in associations:
We asked the respondents the following question:37. In some villages/towns there are associations. Do you know if any of the following associations is found in your village/town? Have you yourself been able to take part in the activities of any these association in the past two years? Perhaps you have an official position in the association, like being secretary or chairman?
Taken part Yes No37.1.2 DPA village development association 17% 1 037.2.2 YPA youth association 18% 1 037.3.2 CPA caste association 15% 1 037.4.2 WPA women's association 10% 1 037.5.2 FPA farmers' association 8% 1 037.6.2 TPA traders' association or business group 5% 1 037.7.2 PPA professional association 13% 1 037.8.2 CPA cultural or religious association 23% 1 037.9.2 OPA any other group (e.g. political party) 14% 1 0
Does education correlate significantly with the following variables?
Pol particip Efficacy Associations Supportnet Trustown Trustother(Q40) (Q58.3) (Q37.10) (Q22.6) (Q22.7)
ALL .188 .081 .126 .292 -.167 .073GUJ -.141 -.241 -.173 .347 -.253 .209UP .263 .084* .138 .281 -.082* NO/negORI .192 .164 NO/pos .364 -.102 .215KER NO/neg NO/neg NO/neg .152 -.129 NO/posWB NO/neg NO/pos -.119 .120 .125 NO/posThe figures in the table signify Pearson r, statistically significant at the 0.01 level.* is significant at the .05 levelFigures in bold represent counterintuitive findings.“NO/pos” and “NO/neg” means that there is no statistically significant correlation between level of education and the particular factor; I have included information whether the correlation is positive or negative.

27
Correlations trust –networks:
TRUSTOTH SUPPORT DISCNET NETSTRANG NETCASTE NETRELIGTRUSTINDIAN -081** -.017 .144** -.178** -.088**TRUSTOWN .115** -.051** -.017 .098** -.195** -.147**TRUSTOTH .032 .081** .155** .004 .179**SUPPORTNET .202** .079** .210** .213**DISCNET .202** .177** .243**NETSTRANGER -.048* .168**NETCASTE .600**NETRELIGION
Correlations trust people – institutions:
IND OWN OTHER ARMY REPR COURT PRESS RADIO POLICE TEMP VIDH ADMINI PART LOK TRUSTINDTRUSTOWNTRUSTOTH .115ARMY .131 .145 .052REPRESENT .088 .109 .105COURT .091 .071 .041* .244 .213 PRESS .112 .112 .204 .189 .299RADIOTV .124 .130 .273 .164 .304 .632POLICE .039 .209 .128 .186 .107TEMPLE .169 .263 -.076 .175 .067 .164 .197VIDHAN .073 .123 .179 .338 .273 .244 .280 .130ADMINI .070 .112.056 .146 .298 .248 .220 .240 .199 .050 .564PARTIES .080 .152 .046* .327 .175 .209 .155 .254 .068 .440 .451LOKSABHA .109 .147 .230 .278 .296 .244 .285 .282 .129 .658 .525 .485PANCHAY .082 .121 -.077 .094 .312 .192 .192 .218 .218 .102 .391 .378 .388 .445
Note: Blank means no significant correlation; * means correlation significant at o.o5 level; all others significant at 0.01 level
References:
Blomkvist, Hans, 2001. Traditional Communities, Caste, and Democracy: The Indian Mystery, in
Dekker & Uslaner eds. Social Capital and Politics in Everyday Life. London: Routledge.
Blomkvist, Hans & Swain, Ashok, 2001. Investigating Democracy and Social Capital in India. Economic & Political Weekly, 24 February.
Blomkvist, Hans, 2002. Social capital, Civil society, and Degrees of democracy in India. Forthcoming in Elliot, ed., Civil Society and Democracy, Delhi: Oxford University Press.
Blomkvist, Hans & Vernby, Kåre, 2001. India’s Fourth Democratic Upsurge: A macro-level Study of Networks and Collective Protest in Five Indian States. Article submitted for review.
Chhibber, Pradeep, 1999. Democracy Without Associations: Transformation of the Party System and Social Cleavages in India. Ann Arbor: The University of Michigan Press.
28
Church, Roderick, 1984. Conclusion: The Pattern of State Politics in Indira Gandhi’s India, in Wood (ed), State Politics in Contemporary India. Boulder: Westview Press.
Coleman, James, 1988. Social Capital in the Creation of Human Capital, American Journal of
Sociology, 94 Supplement:95-120.
Datt, Gaurav & Ravallion, Martin, 1998. Why Have Some Indian States Done Better than Others in
Reducing Rural Poverty?, Economica, 65:17-38.
Drèze, Jean & Sen, Amartya 1995. India: Economic Development and Social Opportunity. Delhi:
Oxford Univeristy Press.
Eckstein, Harry, 1975. Case Study and Theory in Political Science, in Greenstein & Polsby (eds),
Handbook of Political Science, vol. 7, Reading: Mass.
Harriss, John, 199x. How Much Difference does Politics Make? Regime Differences Across Indian
States and Rural Poverty Reduction. www.worldbank.org/poverty/wdrpoverty/dfid/index.htm.
Heller, Patrick, 1999. The Labor of Development: Workers and the Transformation of Capitalism in
Kerala, India. Ithaca: Cornell University Press.
Inkinen, Magdalena, 2001. Mobilising the Lower Castes: The rise of the Bahujan Samaj Party in India.
PhD diss. Department of Government, Uppsala University.
Kohli, Atul, 1987. The State and Poverty in India. Cambridge University Press.
Kohli, Atul, 1990. Democracy and Discontent. Cambridge University Press.
Lijphart, Arend, 1977. Democracy in Plural Societies. New Haven: Yale University Press.
Lijphart, Arend, 1996. The Puzzle of Indian Democracy: A Consociational Interpretation. American
Political Science Review, 90:258-268.
Mayer, Peter, Human Development aqnd Civic Community in India. Economic & Political Weekly, 24
February.
Mitra, Subrata & Singh, V.B., 1999. Democracy and Social Change in India. New Delhi: Sage.
Mondak, Jeffery & Gearing, Adam, 1998. Civic Engagement in a Post-Communist State, Political
Psychology, 19:615-637.

29
Morris, Matthew, 1998. Social Capital and Poverty in India. IDS Working Paper 61. University of
Sussex.
North, Douglass, 1990. Institutions, Institutional Change, and Economic Performance. Cambridge
University Press.
Olson, Mancur, 1965. The Logic of Collective Action. Cambridge: Harvard University Press.
Putnam, Robert, 1993. Making Democracy Work: Civic Traditions in Modern Italy. Princeton
University Press.
Putnam, Robert, 2000. Bowling Alone: The collapse and revival of American community. New York:
Simon & Schuster.
Rothstein, Bo & Kumlin, Staffan, 2001. Demokrati, socialt kapital och förtroende (Democracy, social
capital, and trust), forthcoming in Holmberg & Weibull (eds), Land du välsignade. SOM-rapport 26.
University of Göteborg.
Sanyal, S.K., 1988. Trends in Landholding and Poverty in Rural India, in Srinavasan & Bardhan (eds),
Rural Poverty in South Asia. New York: Columbia University Press.
Sen Gupta, Prasanta, 1997. The 1995 Municipal Election in West Bengal, Asian Survey, 37:905-917.
Serra, Renata, 2001. Social Capital: Meaningful and Measurable at the State Level?, Economic &
Political Weekly, 24 February.
Strand, Per, 2001. Social Capital and Racial Segregation: Implications for Democratic Consolidation in
South Africa. Paper for the Swedish Association of Political Science meeting in Göteborg.
Varkey, Ouseph, 1984. The Rise and Decline of The Left and the Democratic Front in Kerala, in Wood (ed), State Politics in Contemporary India. Boulder: Westview Press.
Varshney, Ashutosh 2000. Why Have Poor Democracies not Eliminated Poverty?, Asian Survey,
45:718-736.
Verba, Sidney & Norman Nie & Jae-On Kim, 1978. Participation and Political Equality: A seven-
nation comparison. Cambridge University Press.
World Bank, 1997. India: Achievements and Challenges in Reducing Poverty. A World Bank Country Study.