Embed Size (px)
Citation preview

SOCIALBRANDS 100The Social Brand Agency
2012

3
FOREW0RD
In the frenetic world of social media, where it can seem that a ‘game changing’ platform or technology is announced daily, it can be easy to lose sight of what’s at the centre of it all: the people.
That’s all the people in social spaces, including those who are working hard to represent brands there – if you’re reading this report you may well be in that second category?
Whatever the size or complexity of the brand, whatever the business objective, the core challenge is the same; as a brand, how do I become part of the ‘people’s media’ in a transparent, authentic and compelling way?
Our aim in creating Social Brands 100 is to help all brand owners by providing a robust benchmark of social performance that spans sectors, and different types of company. It is our contribution to the important ongoing work to seek better analytics and measurement of social media’s effectiveness.
The 100 brands ranked here have found some of the best ways so far, and we are delighted to be able to recognise them. These brands are the innovators, the pioneers, and where they go others follow.
We hope you find inspiration within, and enjoy, 2012’s Social Brands 100.
Steve Sponder
Head of Agency,Headstream
C o p y r i g h t © 2 0 1 2 L a w t o n C o m m u n i C a t i o n s g r o u p L t d • 4 & 5 g r o s v e n o r s q u a r e , s o u t h a m p t o n s o 1 5 2 B e
45
CONTENTS
6 About Social Brands 1008 What is a Social Brand?10 Methodology 12 Judging Panel14 The Ranking18 Insights 18 What we've learned 22 By platform 24 By marker 26 Historical trends 27 Social's growth 28 The big issues30 Case Studies 30 Innocent: A personal approach 32 ARkive: Conservation through conversation 33 Manchester City FC: Top of the social league 34 AVG: Using advocacy to build a better a brand 35 Schuh: Maintaining the human touch36 What next?38 Appendix48 Acknowledgements50 About Headstream52 Glossary
67
ABOUT SOCIAL BRANDS 100
The idea for Social Brands 100 was born in 2011 as an initiative to identify and acknowledge those brands leading the way in the social age. Now in its second year, Social Brands 100 has established a position as one of the leading rankings of social media performance.
Brands cannot apply or pay to be considered in the ranking. The only way to participate is through a crowdsourced nomination process on Twitter. The brands nominated @SocialBrands100 are then put through a rigorous and independent judging process.
Working with analysts at social media monitoring company Brandwatch, and a team of researchers, Social Brands 100 assesses hundreds of thousands of interactions in social spaces between the nominated brands and individuals. An expert panel of judges adds its collective opinion to determine the final ranking.
The result isn’t intended to be a definitive list of ‘the best’. Rather, it’s a collection of brands that strive to be ‘better’ every day, through every interaction.
Social Brands 100 is created and led by social brand agency Headstream.
Social Brands 100 can also help brands benchmark social performance against bespoke competitor sets.
For more information, contact [email protected]
@Film4@SocialBrands100 Thanks very much. Can’t wait to see whether we make the list. It’s like the Oscars of brands on twitter! #suspense #sb100
89
WHAT IS A SOCIAL BRAND?
A social brand is one that has adopted three important underlying principles.
With the increase in transparency brought on by social media comes a requirement for brands to focus on equitable and fair value exchange with all stakeholders. Brands cannot simply communicate a better brand, they must strive to be one. This can result in brands prioritising the needs of their stakeholders ahead of their own immediate requirements.
This is the act of monitoring the social web to uncover relevant conversations, and then having the capability and resources to act on what is found in a timely manner. This can extend from community management, to business planning, and everything in between.
This is a commitment to provide a consistent brand presence in social spaces that is compelling, true, authentic and transparent, and that acknowledges the etiquette of each particular community.
A brand that has adopted these principles, and delivers them consistently and well, creates powerful effects amongst communities in social spaces. It is these effects, identifiable through a series of ‘observable markers’ that our methodology is designed to identify, and measure.
This methodology ensures that the community is the most important judge of how good a brand is at creating win-win through the value it offers and the way it behaves in social.
This is crucial because the result of win-win, listening, and appropriateness, is to build a community (not in one place but a diaspora distributed across networks and platforms) with a mutual interest in the brand.
This community spirit is the foundation stone of social success. The greater the sense of solidarity and identification with the brand, the more likely that those most powerful of feelings will follow – advocacy, loyalty and love.
1 WIN-WIN RELATIONSHIPS 2 aCtive Listening 3 APPROPRIATE soCiaL Behaviour
1011
METHODOLOGY
Creating a methodology that provides a level playing field for analysis across the many different sectors, types, and size of companies that are nominated for Social Brands 100 is our prime concern.
This principle is ‘baked-in’ to the two separate elements of the scoring, the Data Score and the Panel Score, which combine to create the overall Social Brand Score that ranks the shortlisted 100.
This is arrived at by measuring ‘observable markers’ in social spaces that indicate strong social performance. These markers are the external evidence that a brand is adopting the social principles of win-win relationships, active listening and appropriate social behaviour.
We are not in the game of scoring brands for the volume of mentions (buzz) around their name or associated terms. Similarly, the size of community e.g. followers on Twitter, Facebook Fans, is used to normalise the scores, to allow large and small organisations to be compared fairly with large ones.
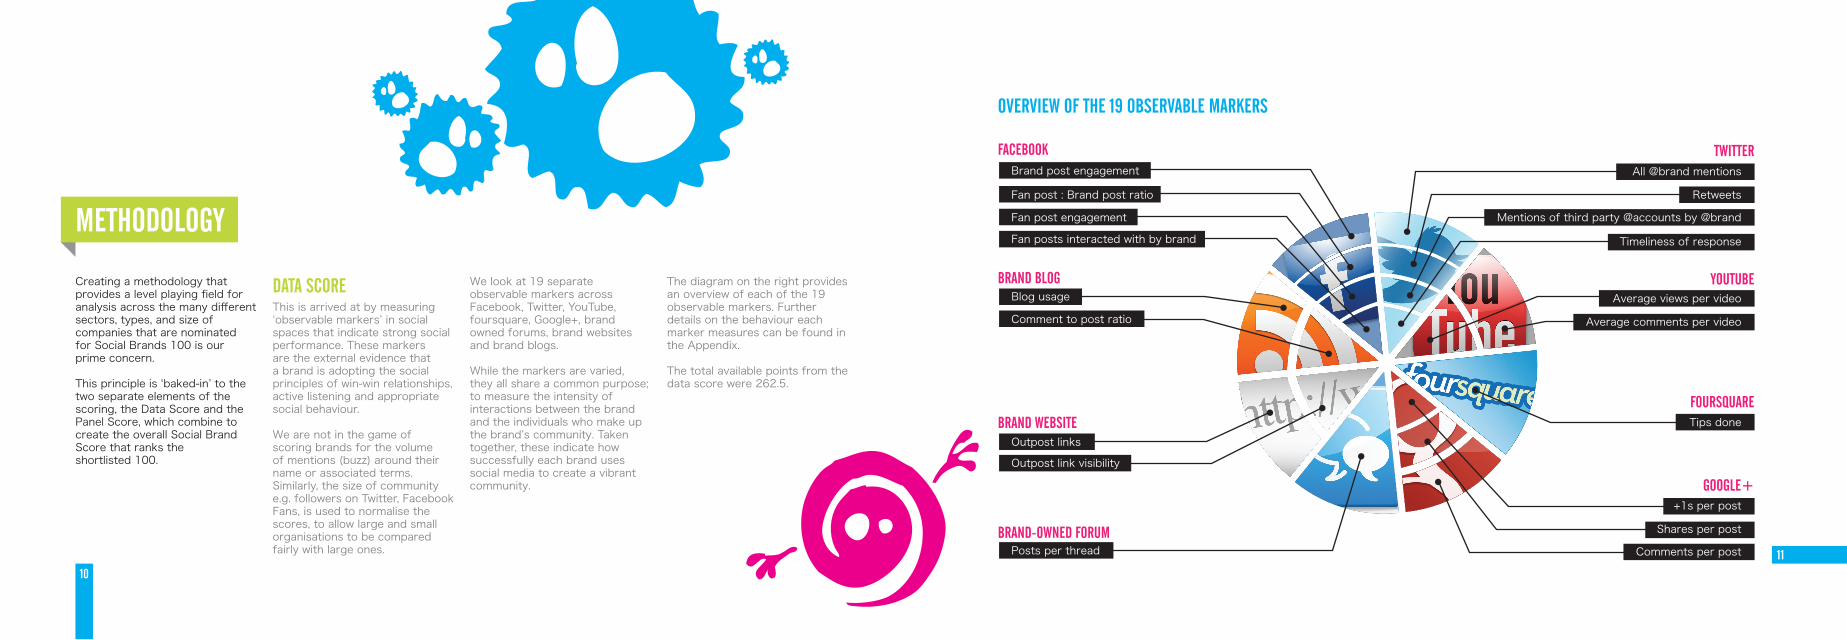
We look at 19 separate observable markers across Facebook, Twitter, YouTube, foursquare, Google+, brand owned forums, brand websites and brand blogs.
While the markers are varied, they all share a common purpose; to measure the intensity of interactions between the brand and the individuals who make up the brand’s community. Taken together, these indicate how successfully each brand uses social media to create a vibrant community.
The diagram on the right provides an overview of each of the 19 observable markers. Further details on the behaviour each marker measures can be found in the Appendix.
The total available points from the data score were 262.5.
DATA SCORE
overview oF the 19 oBservaBLe markers
FaCeBook TWITTER
YOUTUBE
Foursquare
GOOGLE+
BRAND BLOG
BRAND WEBSITE
BRAND-OWNED FORUM
Brand post engagement
Fan post : Brand post ratio
Fan post engagement
Fan posts interacted with by brand
Blog usage
Comment to post ratio
Outpost links
Outpost link visibility
Posts per thread
All @brand mentions
Retweets
Timeliness of response
Mentions of third party @accounts by @brand
Average views per video
Average comments per video
Tips done
+1s per post
Shares per post
Comments per post

1213
JUDGING PANEL
To augment the data driven analysis, we invite a panel of independent industry experts to evaluate the 100 shortlisted brands. Each judge assesses the brands against criteria that chime with the behaviours uncovered by the observable markers.
Judges are asked to agree or disagree with the following statements:
“For the main part, the brand provides value based content in its social spaces, rather than focusing on pushing traditional marketing ‘messages’.”
“The brand provides a consistent presence on its social platforms, demonstrating an ‘always-on’ approach to community engagement.”
“The brand prioritises the community over its own agenda, valuing and responding to the community’s contributions, needs and ideas.”
“Overall, there is the sense that the brand has established a powerful community spirit across social spaces – a certain ‘Social Brand Factor’ that’s hard to define, but undeniably present.”
This subjective assessment stage provides a human ‘check and balance’ to the data driven part of the methodology. It also represents a significant task, and we are hugely grateful to our judges.
The total available points fromthe panel score was 120.
PANEL SCORE
Giles is the founder and CEO of international Social Media Monitoring provider Brandwatch. He serves on the Industrial Advisory Board for Sussex University and the Social Media Committee for the Chartered Institute of Public Relations.
GILES PALMERCEOBRANDWATCH
Prior to joining Google, Paul was the MD of a digital creative agency, and previous to that a media strategist at MediaCom and Ogilvy. He's worked on award-winning social media campaigns for a range of clients.
PAUL COFFEYindustry Leader,AGENCIESGOOGLE
Nigel runs IPA Digital and represents the digital community within IPA membership. He is currently championing Uk agency attendance and participation at SXSW Interactive, the world’s preeminent emerging technology festival.
NIGEL GWILLIAMCONSULTANT HEADOF DIGITALIPA
Dr Alan Rae conducts research and consultancy projects examining how organisations use IT and the Internet. He has authored workbooks and training programmes including 1 Man Brand and Social Media for Real Businesses.
DR ALAN RAEFOUNDERHOWTODOBUSINESS.COM
Sean is a Director with PwC's Advisory business, leading the firm's Digital Change practice. He is the co-author of The Digital Tipping Point, Engaging Customers Through Social Media, and Uncovering B2B Social Media.
SEAN MAHDIDIRECTORPwC
Gordon was the founding editor of Brand Republic. He is currently the Group Social Media Editor at the Brand Republic Group, and Editor of the digital and social media blog ‘The Wall’. He is @gordonmacmillan on Twitter.
GORDON MACMILLANGROUP SOCIAL MEDIA EDITORBRAND REPUBLIC GROUP
Steve Sponder is Head of Agency for Headstream, responsible for developing and growing the specialist social media agency. Previously, Steve started Five by Five in 1994, growing it into a leading Uk digital agency.
steve sponderHEAD OF AGENCY HEADSTREAM
Sophia looks after communications and membership at the IAB and chairs the IAB’s Social Media Council that educates and innovates the industry. Before this, Sophia headed up client accounts at award-winning digital creative agency, Dare.
SOPHIA AMINdireCtor oF marketingAND COMMUNICATIONSinternet advertising Bureau
Bruce joined Twitter in 2012. He previously ran sales for Google's Uk display business, growing it from 30th to 2nd largest in the market, and was a Digital Sales Director at Bauer Advertising, formerly Emap.
BRUCE DAISLEYuk saLes direCtorTWITTER
Anaïs is a video and social media specialist who helps brands get the most out of digital. She has worked on award-winning projects for brands across the globe including First Direct and T-Mobile.
ANAÏS HAYESindustry manager,MEDIA SOLUTIONSYOUTUBE
1415
the ranking
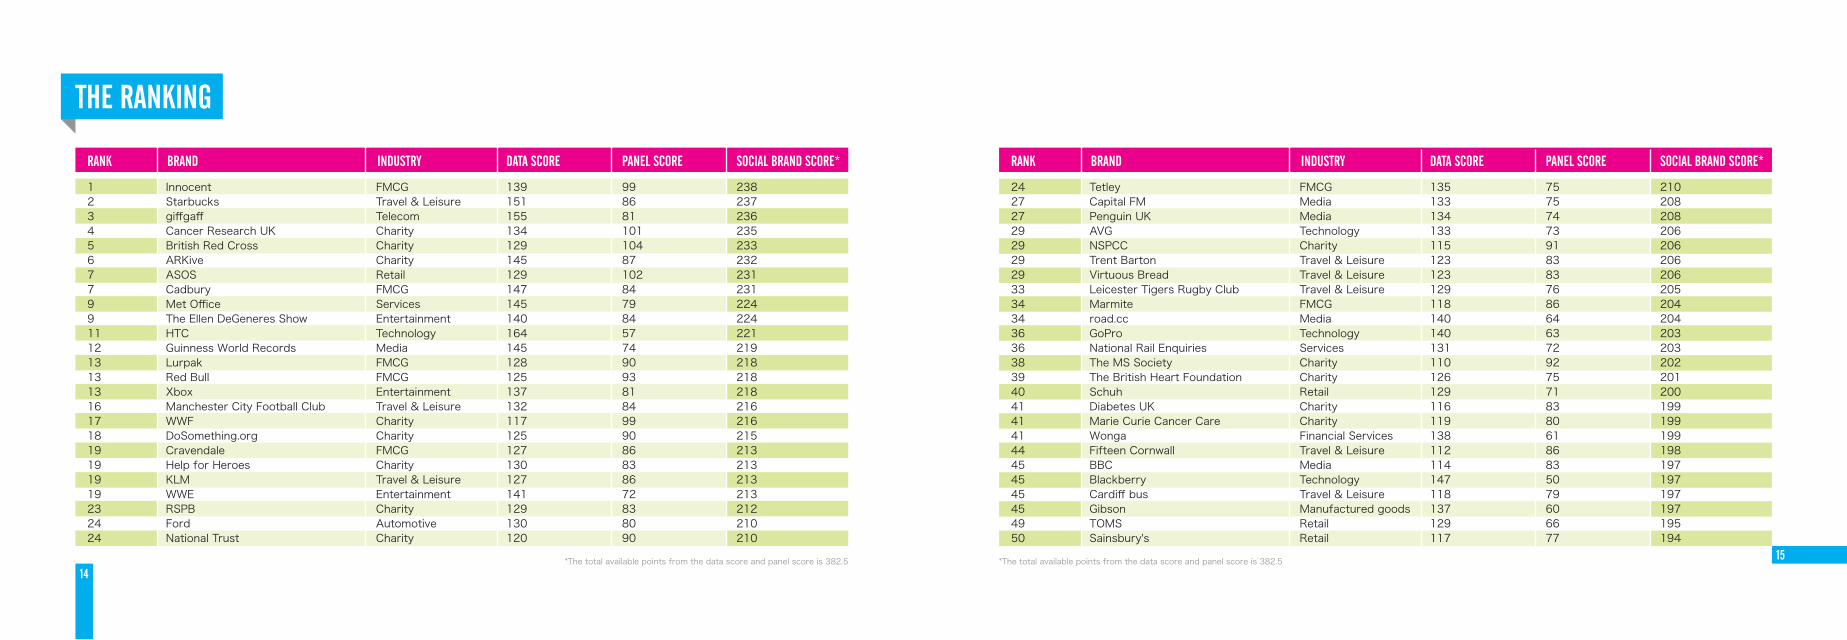
1 Innocent FMCG 139 99 2382 Starbucks Travel & Leisure 151 86 2373 giffgaff Telecom 155 81 2364 Cancer Research Uk Charity 134 101 2355 British Red Cross Charity 129 104 2336 ARkive Charity 145 87 2327 ASOS Retail 129 102 2317 Cadbury FMCG 147 84 2319 Met Office Services 145 79 2249 The Ellen DeGeneres Show Entertainment 140 84 22411 HTC Technology 164 57 22112 Guinness World Records Media 145 74 21913 Lurpak FMCG 128 90 21813 Red Bull FMCG 125 93 21813 Xbox Entertainment 137 81 21816 Manchester City Football Club Travel & Leisure 132 84 21617 WWF Charity 117 99 21618 DoSomething.org Charity 125 90 21519 Cravendale FMCG 127 86 21319 Help for Heroes Charity 130 83 21319 kLM Travel & Leisure 127 86 21319 WWE Entertainment 141 72 21323 RSPB Charity 129 83 21224 Ford Automotive 130 80 21024 National Trust Charity 120 90 210
rank Brand industry data sCore paneL sCore soCiaL Brand sCore*
24 Tetley FMCG 135 75 21027 Capital FM Media 133 75 20827 Penguin Uk Media 134 74 20829 AVG Technology 133 73 20629 NSPCC Charity 115 91 20629 Trent Barton Travel & Leisure 123 83 20629 Virtuous Bread Travel & Leisure 123 83 20633 Leicester Tigers Rugby Club Travel & Leisure 129 76 20534 Marmite FMCG 118 86 20434 road.cc Media 140 64 20436 GoPro Technology 140 63 20336 National Rail Enquiries Services 131 72 20338 The MS Society Charity 110 92 20239 The British Heart Foundation Charity 126 75 20140 Schuh Retail 129 71 20041 Diabetes Uk Charity 116 83 19941 Marie Curie Cancer Care Charity 119 80 19941 Wonga Financial Services 138 61 19944 Fifteen Cornwall Travel & Leisure 112 86 19845 BBC Media 114 83 19745 Blackberry Technology 147 50 19745 Cardiff bus Travel & Leisure 118 79 19745 Gibson Manufactured goods 137 60 19749 TOMS Retail 129 66 19550 Sainsbury's Retail 117 77 194
rank Brand industry data sCore paneL sCore soCiaL Brand sCore*
*The total available points from the data score and panel score is 382.5 *The total available points from the data score and panel score is 382.5

1617
51 Domino's Pizza Travel & Leisure 115 78 19351 Tate Travel & Leisure 115 78 19353 B&Q Retail 116 76 19253 Muddy Boots Real Foods FMCG 113 79 19255 Motorola Technology 128 62 19055 WestJet Travel & Leisure 133 57 19057 The Collective NZ FMCG 110 79 18958 O2 Telecom 113 75 18859 Dell Technology 112 75 18760 Lush Fashion and Beauty 114 70 18460 Mobile Vikings Telecom 127 57 18462 Chiltern Railways Travel & Leisure 122 60 18262 Mr & Mrs Smith Travel & Leisure 118 64 18262 Southwest Airlines Travel & Leisure 116 66 18265 Groupon Services 117 64 18165 Intel Uk Technology 128 53 18165 Virgin Money Financial Services 127 54 18168 MaxiRAW FMCG 142 38 18068 Mongoose Cricket Manufactured goods 127 53 18070 MTV Geordie Shore Media 129 50 17971 Orange Telecom 112 66 17871 RAF Benevolent Fund Charity 117 61 17871 Virgin Atlantic Travel & Leisure 111 67 17871 VisitWoods Charity 112 66 17875 HMV Retail 114 61 175
rank Brand industry data sCore paneL sCore soCiaL Brand sCore*
76 Bing Uk Technology 130 44 17476 e.l.f. Cosmetics Fashion and Beauty 127 47 17478 Sony Ericsson (Xperia) Technology 137 36 17378 Very.co.uk Retail 117 56 17380 Delta Travel & Leisure 126 46 17281 Google Technology 125 46 17181 Virgin Trains Travel & Leisure 118 53 17183 studentbeans.com Services 110 60 17084 Comcast Telecom 126 42 16884 Samsung Mobile Technology 128 40 16886 Just Giving Charity 118 49 16786 MTV Uk Media 118 49 16788 Simplyhealth Financial Services 123 42 16589 The National Lottery Charity 110 53 16389 Walkers Crisps FMCG 125 38 16391 Frugi Retail 112 50 16292 Estee Lauder Fashion and Beauty 111 49 16092 Oral B FMCG 119 41 16094 CenturyLink Telecom 121 38 15995 Acura Automotive 131 26 15796 Ribena FMCG 117 38 15597 PayPal Financial Services 113 41 15498 Tropicana FMCG 110 34 14499 AT&T Telecom 110 33 143100 BullGuard Technology 113 20 133
rank Brand industry data sCore paneL sCore soCiaL Brand sCore*
*The total available points from the data score and panel score is 382.5 *The total available points from the data score and panel score is 382.5
1819
INSIGHTS INSIGHTS
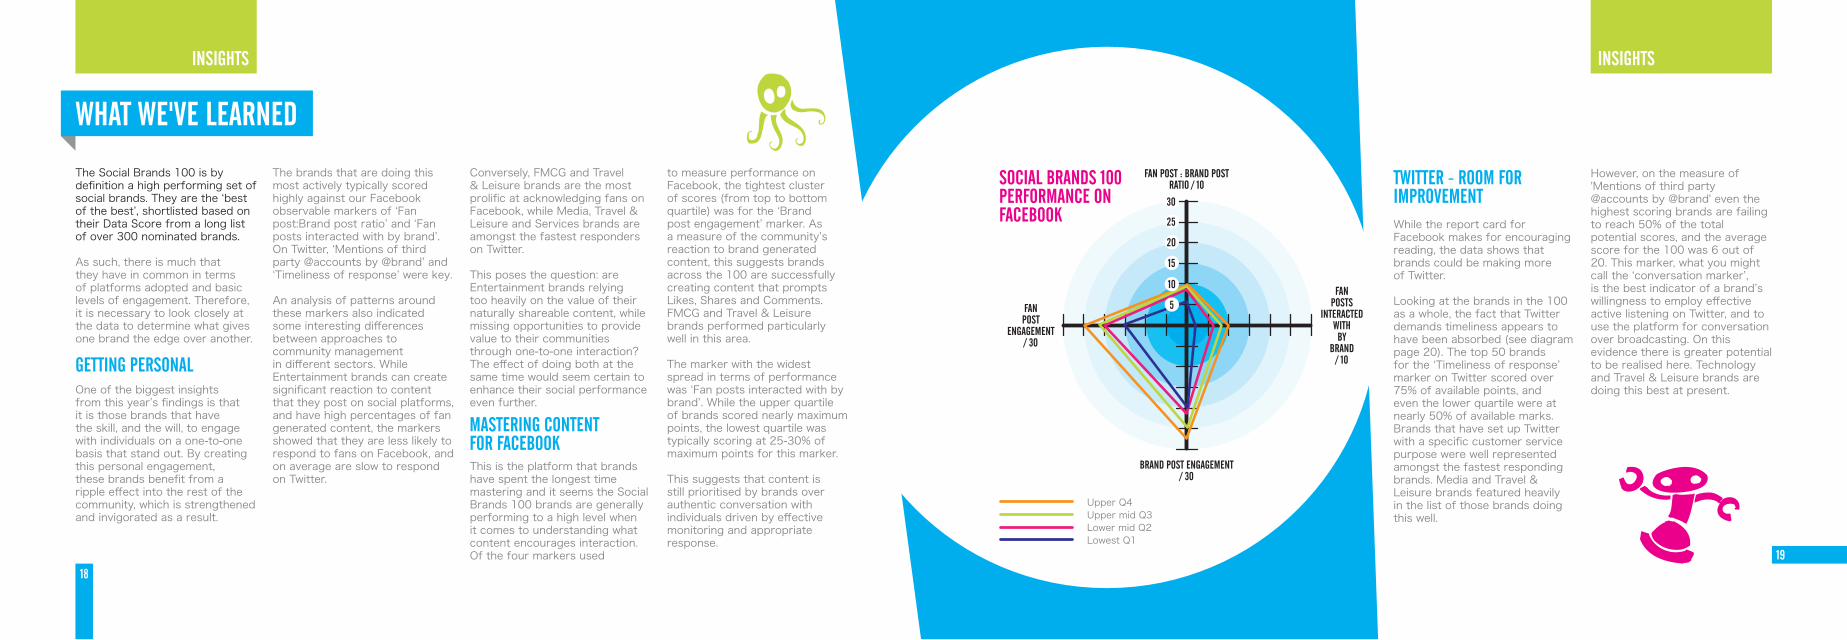
The Social Brands 100 is by definition a high performing set of social brands. They are the ‘best of the best’, shortlisted based on their Data Score from a long list of over 300 nominated brands.
As such, there is much that they have in common in terms of platforms adopted and basic levels of engagement. Therefore, it is necessary to look closely at the data to determine what gives one brand the edge over another.
One of the biggest insights from this year’s findings is that it is those brands that have the skill, and the will, to engage with individuals on a one-to-one basis that stand out. By creating this personal engagement, these brands benefit from a ripple effect into the rest of the community, which is strengthened and invigorated as a result.
The brands that are doing this most actively typically scored highly against our Facebook observable markers of ‘Fan post:Brand post ratio’ and ‘Fan posts interacted with by brand’. On Twitter, ‘Mentions of third party @accounts by @brand’ and ‘Timeliness of response’ were key.
An analysis of patterns around these markers also indicated some interesting differences between approaches to community management in different sectors. While Entertainment brands can create significant reaction to content that they post on social platforms, and have high percentages of fan generated content, the markers showed that they are less likely to respond to fans on Facebook, and on average are slow to respond on Twitter.
Conversely, FMCG and Travel & Leisure brands are the most prolific at acknowledging fans on Facebook, while Media, Travel & Leisure and Services brands are amongst the fastest responders on Twitter.
This poses the question: are Entertainment brands relying too heavily on the value of their naturally shareable content, while missing opportunities to provide value to their communities through one-to-one interaction? The effect of doing both at the same time would seem certain to enhance their social performance even further.
This is the platform that brands have spent the longest time mastering and it seems the Social Brands 100 brands are generally performing to a high level when it comes to understanding what content encourages interaction.Of the four markers used
While the report card for Facebook makes for encouraging reading, the data shows that brands could be making more of Twitter.
Looking at the brands in the 100 as a whole, the fact that Twitter demands timeliness appears to have been absorbed (see diagram page 20). The top 50 brands for the ‘Timeliness of response’ marker on Twitter scored over 75% of available points, and even the lower quartile were at nearly 50% of available marks. Brands that have set up Twitter with a specific customer service purpose were well represented amongst the fastest responding brands. Media and Travel & Leisure brands featured heavily in the list of those brands doing this well.
However, on the measure of 'Mentions of third party @accounts by @brand' even the highest scoring brands are failing to reach 50% of the total potential scores, and the average score for the 100 was 6 out of 20. This marker, what you might call the ‘conversation marker’, is the best indicator of a brand’s willingness to employ effective active listening on Twitter, and to use the platform for conversation over broadcasting. On this evidence there is greater potential to be realised here. Technology and Travel & Leisure brands are doing this best at present.
what we've Learned
to measure performance on Facebook, the tightest cluster of scores (from top to bottom quartile) was for the ‘Brand post engagement’ marker. As a measure of the community’s reaction to brand generated content, this suggests brands across the 100 are successfully creating content that prompts Likes, Shares and Comments. FMCG and Travel & Leisure brands performed particularly well in this area.
The marker with the widest spread in terms of performance was ‘Fan posts interacted with by brand’. While the upper quartile of brands scored nearly maximum points, the lowest quartile was typically scoring at 25-30% of maximum points for this marker.
This suggests that content is still prioritised by brands over authentic conversation with individuals driven by effective monitoring and appropriate response.
GETTING PERSONAL
MASTERING CONTENTFor FaCeBook
TWITTER - ROOM FORimprovement
SOCIAL BRANDS 100PERFORMANCE ON FaCeBook
Upper Q4Upper mid Q3Lower mid Q2Lowest Q1

2021
As with Twitter, there is great upside potential for brands when it comes to Google+, YouTube, Foursquare and brand owned forums. On each of these platforms the mean scores are well below the total possible, and there were large differences between the best and worst performers.
On YouTube, the Technology sector proved the most consistent performer with the regular use of the platform for user guides and application ideas. Selected Travel & Leisure and FMCG brands also used the platform effectively to share stories about their products and services. For the top ten brands on this platform, this provided a significant uplift in points scored, giving an average of 29 points, compared to a 16-point average for YouTube across the 100.
Google+ wasn’t in existence for last year’s Social Brands 100, but in ten months it has moved rapidly to get on the radar of brands operating in social spaces.
Unsurprisingly it is some of the archetypal early adopters of social media that have risen to the top of the Google+ rankings, and Technology companies are prevalent here. The observable markers used for Google+ are all about engagement, so these brands are offering the most compelling content, and effective community management on the platform.
Amongst brand owned forums the Entertainment brands were the most highly rated, with forums that provide comprehensive brand and peer support, or that provide a platform for like-minded communities to gather. The community and interaction provided by these forums offers a counter to the observed lack of intensive conversation between Entertainment brands and individuals on Twitter.
The chart on the right shows the gap between current mean scores amongst the Social Brands 100 on the major platforms, and the highest possible scores.
OTHER PLATFORMSSOCIAL BRANDS 100 PERFORMANCE ON TWITTER soCiaL Brands 100 mean perFormanCe By pLatForm vs. totaL possiBLe sCore
Upper Q4Upper mid Q3Lower mid Q2Lowest Q1
90.00
80.00
70.00
60.00
50.00
40.00
30.00
20.00
10.00
FaCeBook TWITTER YOUTUBE GOOGLE+ Foursquare OWN FORUMS
Overall mean Total possible score
INSIGHTS INSIGHTS
2223
BY PLATFORM
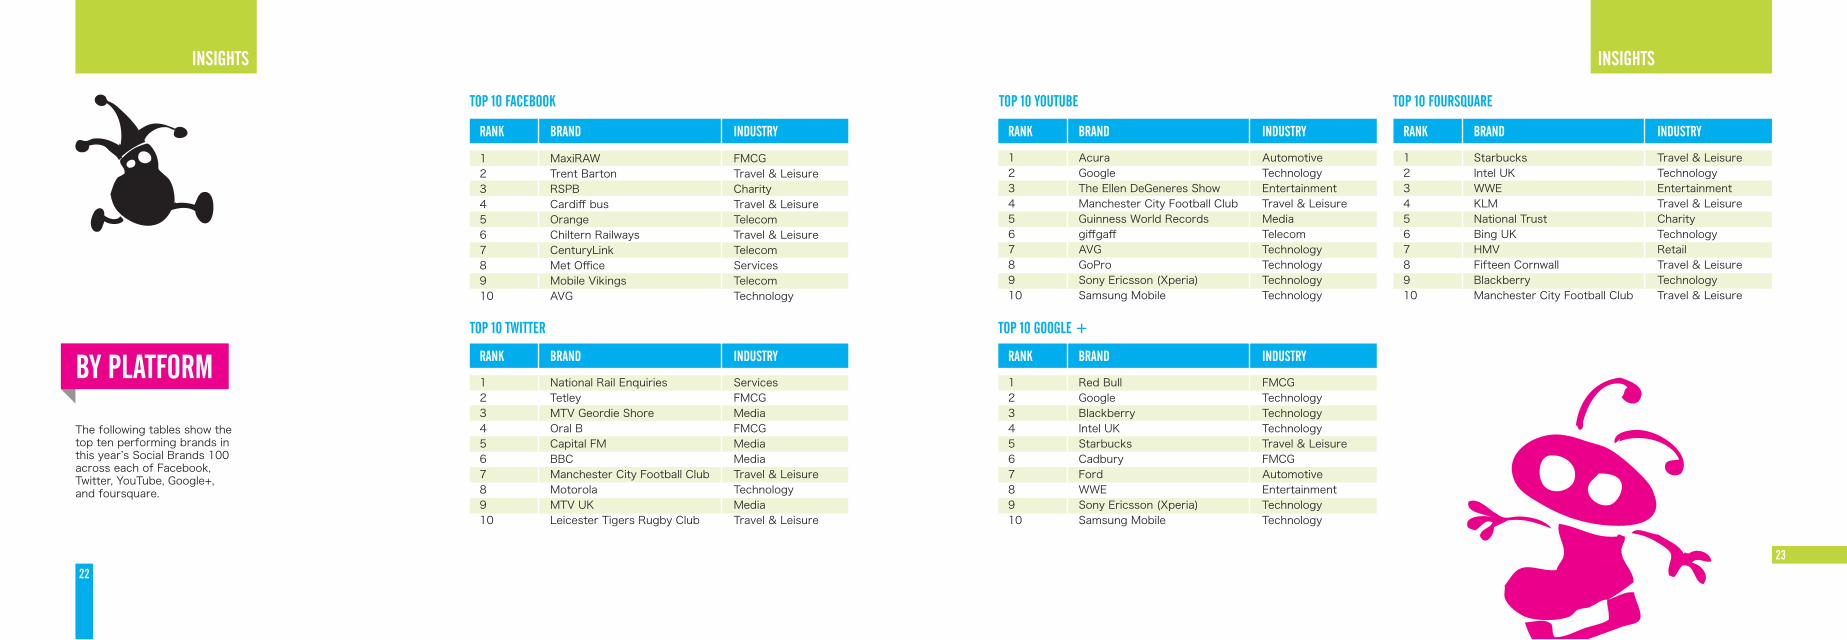
The following tables show the top ten performing brands in this year’s Social Brands 100 across each of Facebook, Twitter, YouTube, Google+, and foursquare.
rank Brand industry
1 MaxiRAW FMCG2 Trent Barton Travel & Leisure3 RSPB Charity4 Cardiff bus Travel & Leisure5 Orange Telecom6 Chiltern Railways Travel & Leisure7 CenturyLink Telecom8 Met Office Services9 Mobile Vikings Telecom10 AVG Technology
rank Brand industry
1 Acura Automotive2 Google Technology3 The Ellen DeGeneres Show Entertainment4 Manchester City Football Club Travel & Leisure5 Guinness World Records Media6 giffgaff Telecom7 AVG Technology8 GoPro Technology9 Sony Ericsson (Xperia) Technology10 Samsung Mobile Technology
rank Brand industry
1 Starbucks Travel & Leisure2 Intel Uk Technology3 WWE Entertainment4 kLM Travel & Leisure5 National Trust Charity6 Bing Uk Technology7 HMV Retail8 Fifteen Cornwall Travel & Leisure9 Blackberry Technology10 Manchester City Football Club Travel & Leisure
top 10 FaCeBook TOP 10 YOUTUBE top 10 Foursquare
rank Brand industry
1 National Rail Enquiries Services2 Tetley FMCG3 MTV Geordie Shore Media4 Oral B FMCG5 Capital FM Media6 BBC Media7 Manchester City Football Club Travel & Leisure8 Motorola Technology9 MTV Uk Media10 Leicester Tigers Rugby Club Travel & Leisure
TOP 10 TWITTER
rank Brand industry
1 Red Bull FMCG2 Google Technology3 Blackberry Technology4 Intel Uk Technology5 Starbucks Travel & Leisure6 Cadbury FMCG7 Ford Automotive8 WWE Entertainment9 Sony Ericsson (Xperia) Technology10 Samsung Mobile Technology
TOP 10 GOOGLE +
INSIGHTS INSIGHTS
2425
INSIGHTS INSIGHTS
rank Brand industry
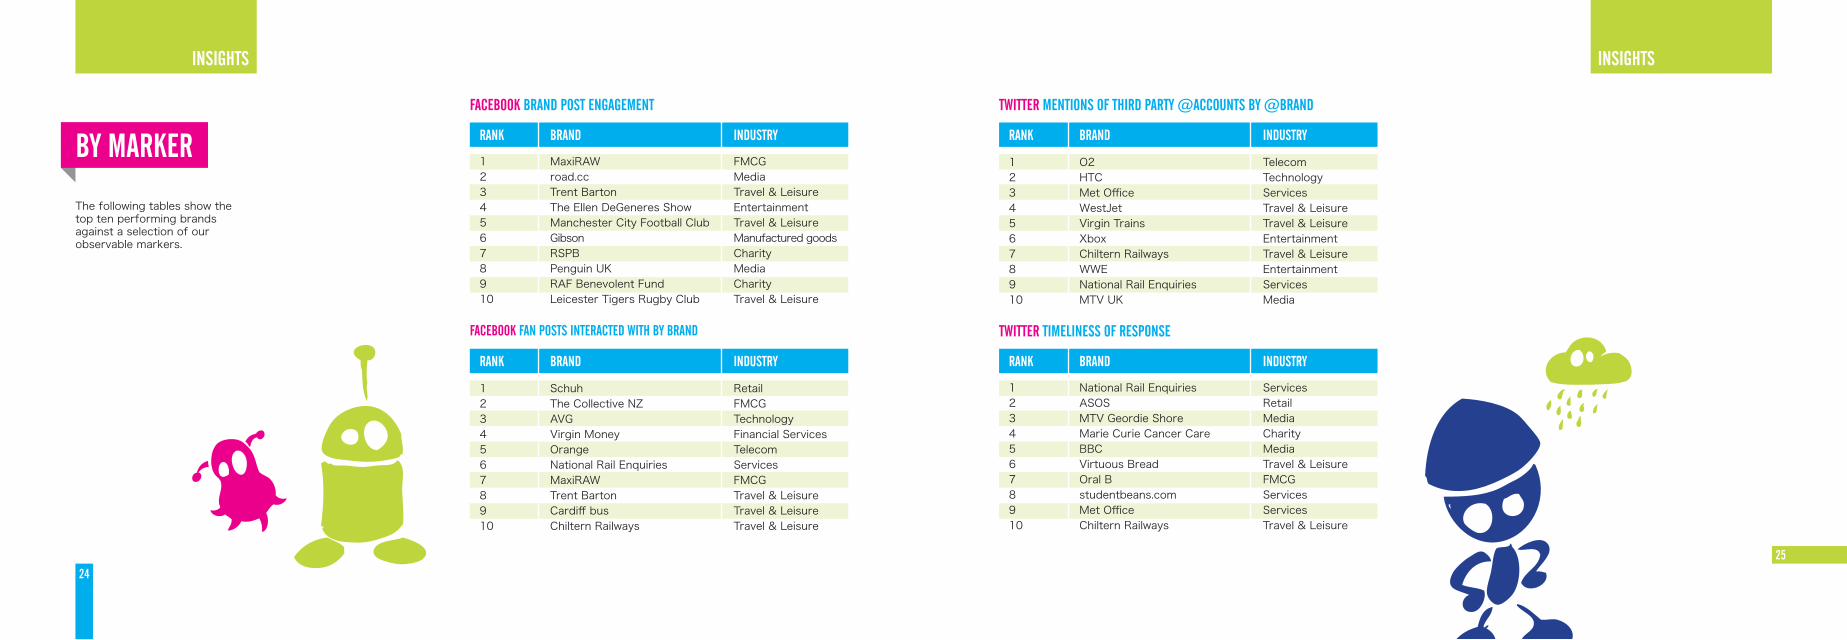
1 MaxiRAW FMCG2 road.cc Media3 Trent Barton Travel & Leisure4 The Ellen DeGeneres Show Entertainment5 Manchester City Football Club Travel & Leisure6 Gibson Manufactured goods7 RSPB Charity8 Penguin Uk Media9 RAF Benevolent Fund Charity10 Leicester Tigers Rugby Club Travel & Leisure
rank Brand industry
1 O2 Telecom2 HTC Technology3 Met Office Services4 WestJet Travel & Leisure5 Virgin Trains Travel & Leisure6 Xbox Entertainment7 Chiltern Railways Travel & Leisure8 WWE Entertainment9 National Rail Enquiries Services10 MTV Uk Media
rank Brand industry
1 Schuh Retail2 The Collective NZ FMCG3 AVG Technology4 Virgin Money Financial Services5 Orange Telecom6 National Rail Enquiries Services7 MaxiRAW FMCG8 Trent Barton Travel & Leisure9 Cardiff bus Travel & Leisure10 Chiltern Railways Travel & Leisure
rank Brand industry
1 National Rail Enquiries Services2 ASOS Retail3 MTV Geordie Shore Media4 Marie Curie Cancer Care Charity5 BBC Media6 Virtuous Bread Travel & Leisure7 Oral B FMCG8 studentbeans.com Services9 Met Office Services10 Chiltern Railways Travel & Leisure
FaCeBook BRAND POST ENGAGEMENT TWITTER MENTIONS OF THIRD PARTY @ACCOUNTS BY @BRAND
FaCeBook FAN POSTS INTERACTED WITH BY BRAND TWITTER TIMELINESS OF RESPONSE
By marker
The following tables show the top ten performing brands against a selection of our observable markers.
2627
SOCIAL'S GROWTH
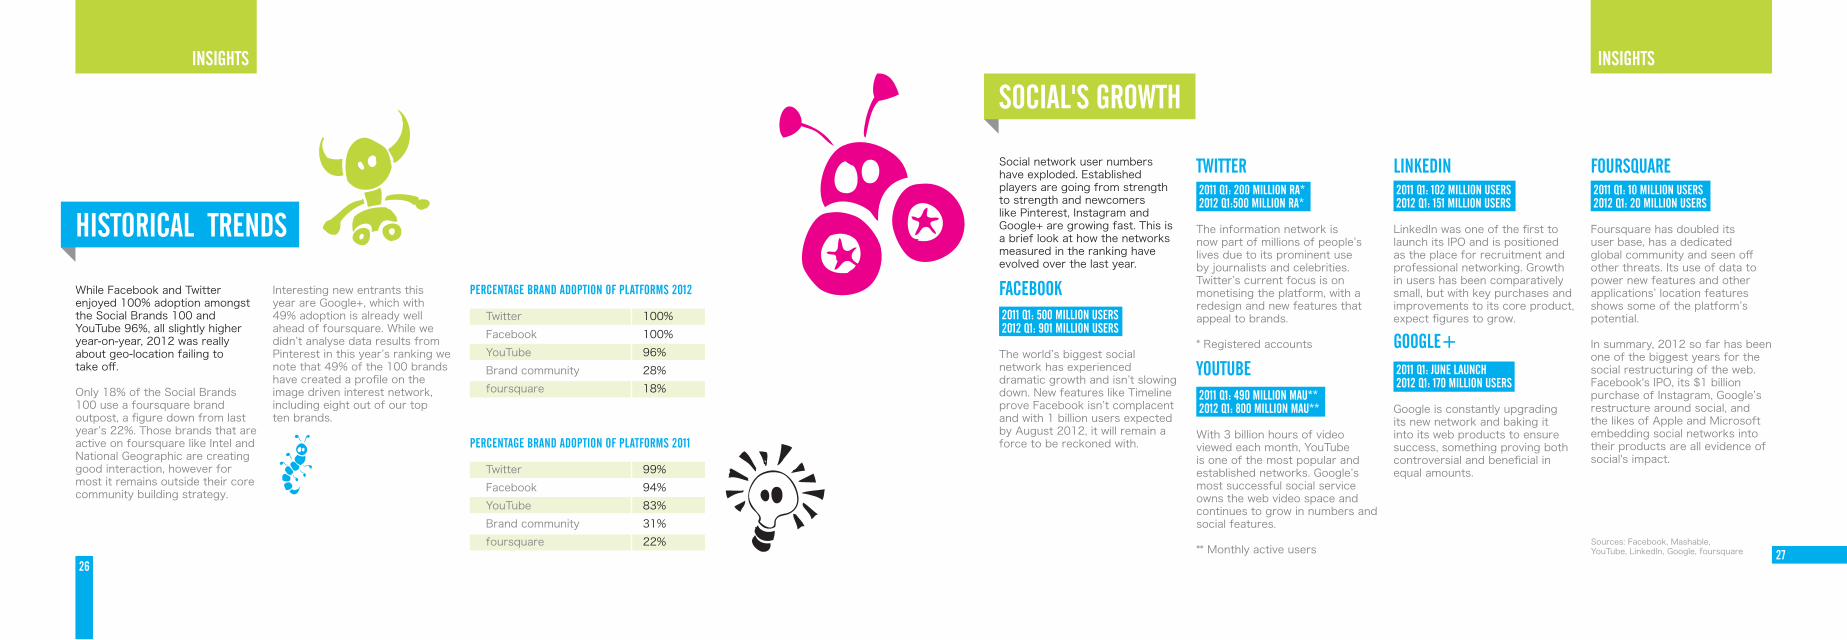
Social network user numbers have exploded. Established players are going from strength to strength and newcomers like Pinterest, Instagram and Google+ are growing fast. This is a brief look at how the networks measured in the ranking have evolved over the last year.
2011 q1: 500 miLLion users 2012 q1: 901 miLLion users
The world’s biggest social network has experienced dramatic growth and isn’t slowing down. New features like Timeline prove Facebook isn’t complacent and with 1 billion users expected by August 2012, it will remain a force to be reckoned with.
2011 q1: 200 miLLion ra* 2012 q1:500 miLLion ra*
The information network is now part of millions of people’s lives due to its prominent use by journalists and celebrities. Twitter’s current focus is on monetising the platform, with a redesign and new features that appeal to brands.
* Registered accounts
2011 q1: 490 miLLion mau** 2012 q1: 800 miLLion mau**
With 3 billion hours of video viewed each month, YouTube is one of the most popular and established networks. Google’s most successful social service owns the web video space and continues to grow in numbers and social features.
** Monthly active users
2011 q1: 102 miLLion users 2012 q1: 151 miLLion users
LinkedIn was one of the first to launch its IPO and is positioned as the place for recruitment and professional networking. Growth in users has been comparatively small, but with key purchases and improvements to its core product, expect figures to grow.
2011 q1: June LaunCh 2012 q1: 170 miLLion users
Google is constantly upgrading its new network and baking it into its web products to ensure success, something proving both controversial and beneficial in equal amounts.
2011 q1: 10 miLLion users 2012 q1: 20 miLLion users
Foursquare has doubled its user base, has a dedicated global community and seen off other threats. Its use of data to power new features and other applications’ location features shows some of the platform’s potential.
In summary, 2012 so far has been one of the biggest years for the social restructuring of the web. Facebook's IPO, its $1 billion purchase of Instagram, Google’s restructure around social, and the likes of Apple and Microsoft embedding social networks into their products are all evidence of social's impact.
HISTORICAL TRENDS
While Facebook and Twitter enjoyed 100% adoption amongst the Social Brands 100 and YouTube 96%, all slightly higher year-on-year, 2012 was really about geo-location failing to take off.
Only 18% of the Social Brands 100 use a foursquare brand outpost, a figure down from last year’s 22%. Those brands that are active on foursquare like Intel and National Geographic are creating good interaction, however for most it remains outside their core community building strategy.
Interesting new entrants this year are Google+, which with 49% adoption is already well ahead of foursquare. While we didn’t analyse data results from Pinterest in this year’s ranking we note that 49% of the 100 brands have created a profile on the image driven interest network, including eight out of our top ten brands.
Twitter 99%Facebook 94%YouTube 83%Brand community 31%foursquare 22%
PERCENTAGE BRAND ADOPTION OF PLATFORMS 2012
PERCENTAGE BRAND ADOPTION OF PLATFORMS 2011
Twitter 100%Facebook 100%YouTube 96%Brand community 28%foursquare 18%
TWITTER Linkedin Foursquare
GOOGLE+
INSIGHTS INSIGHTS
YOUTUBE
Sources: Facebook, Mashable, YouTube, LinkedIn, Google, foursquare

2829
Putting this number of brands under the social performance microscope provides an opportunity to reflect on what is working for them, and what the challenges ahead might be.
In terms of the behaviours that create success in social, they remain consistent, because people and how they like to be treated remain consistent. In summary those behaviours are:
Focus on creating value for people and communities, not sending messages Be happy to exchange rigid brand control for greater involvement with people Manage the brand in a more human context, focus on the spirit of the brand, its character, values, purpose and causes, rather than the letter of the brand guidelines
Listen actively and be timely, agile and responsive to make the most of emerging conversations Act appropriately, reflecting the etiquette of each social environment Put the needs of the community, and individuals within it, ahead of your own Be true, compelling, authentic and transparent Place win-win relationships at the heart of your business.
keeping these behaviours in mind during every interaction, strategy planning session and objectives setting exercise, will direct any brand towards better social media performance.
This appears to be the greatest challenge for brands in social.
Expressing the brand with a truly ‘human’ voice, on a consistent basis and within large communities is a big challenge that only a handful of brands are meeting. This poses the question: are brands simply wrestling with the challenge of scaling-up in this area, or is there a lack of genuine appetite to engage at this personal level?
Our observation is that brands embracing this human approach are willing to invest emotionally in their communities, and create strong one-to-one relationships. This is in contrast to brands that may have regular conversation and response but where the interactions are standard and suggest a scripted, brand guidelines focused approach.
To meet the challenge of delivering personal value at scale, brands will have to invest in larger teams of socially savvy employees. These individuals will be clear on the purpose or spirit of the brand and will be empowered to represent the brand with a human voice.
At its heart a commitment is required from brands to spend more time being interested, rather than trying to be interesting.
Here are a few questions to ask yourself if you are involved in representing a brand in social spaces:
Are you joining conversations consistently and positively, or do you only step in when a negative emerges? When you place a new thread into the conversation how do you frame it? Do you ask open questions to invite response, or do you ‘announce’ content in a traditional broadcast way? Are you spending at least as much time listening and responding as you are running your own content plan? Are you open-minded and agile enough to capitalise on a strong emerging meme in the community, rather than stick to a content schedule?
In what remain challenging global economic times, one big question remains at the top of every Marketing Director’s agenda around social – “How do I show that social spend is effective, and provides return on investment?”
Social Brands 100 is committed to helping answer that question by developing its research in future years to cover brand objectives and outcomes from social activity, as well as the outputs that are covered currently.
In the meantime, we will leave you with an observation.
Good active listening, asking open questions, and trying to uncover and then respond to genuine customer need uses many of the accepted fundamentals of good selling techniques. The difference is that we now have the ability to listen and learn not just in face-to-face interactions with customers or prospects, but persistently across all social platforms.
The aggregated intelligence gathered from this listening is extremely powerful. It can help brands get ahead of what the market wants in terms of product and service, and provide insight into what proposition will resonate with the community.
Used smartly this data is a goldmine that can transform business performance. That’s a story every boardroom is keen to hear.
THE BIG ISSUES
deLivering personaL vaLue - at sCaLe
INSIGHTS INSIGHTS
the no.1 question

3031
innoCent: a personaL approaCh
CASE STUDY
Since its launch a little over a decade ago, Innocent has stood out for its innovative and entertaining approach to communications. Although we are now used to having our packaging ‘talk’ to us, back when Innocent’s bottles first appeared on supermarket shelves covered in distinctive illustrations and irreverent copy – a by-product of having no budget for a traditional advertising campaign at the time – it was radical.
Innocent is a food and drinks company whose products are available across Europe.
Significantly, the bananaphone number, Innocent's customer help-line, has always been included on labels, with an open invitation to get in touch with ‘Fruit Towers’. “We’ve always wanted to build actual relationships with our drinkers,” says Innocent’s Joe McEwan. “It started with talking to people on our packaging, inviting them to call the bananaphone, meeting them at events we put on, and so on. It naturally extended into digital and then social media as those channels evolved.”
So from the beginning Innocent’s values have been rooted in what is now recognised as good social behaviour, taking a human approach to managing the brand, creating value for, and listening and responding to people. Maintaining this approach in the face of significant growth, inevitable changes to the team line-up, and a rapidly evolving communications landscape however, is no mean task. According to McEwan, key to Innocent’s success has been a consistent tone of voice – one that's natural, honest, and engaging – making social activity feel like a natural extension of the company’s personality.
The Innocent approach to social has historically been quite organic, changing as the team experiments with new ideas and types of content. Over the last year in particular, there’s been recognition internally that social should be integrated across the business more formally, “striking a balance between a healthy degree of spontaneity and a more strategic approach,” says McEwan. One result has been closer collaboration with the in-house creative department. Following a session ahead of St George’s Day, the team created and shared ‘An Innocent Guide to Slaying a Dragon’. Success hinges on having a Brazil nut to hand, in case you’re wondering.
As they continue to experiment with the potential of emerging platforms, the Community Team is keeping an eye on how to best develop each one’s own look and feel while maintaining that all-important consistency. For McEwan, a dedicated in-house team is essential to Innocent’s future success to ensure the business keeps learning and develops the deepest possible relationship with its communities.
In an ever-changing social landscape, Innocent maintains a flexible and creative approach underpinned by a clear understanding of the spirit of the brand, passion for the product, and a desire to engage with people on a one-to-one level.
ranking: 1
data sCore: 139
paneL sCore: 99
soCiaL Brand sCore: 238
We’ve always wanted to build actual relationships with our drinkers.

3233
CASE STUDY CASE STUDY
Facebook may have brands thinking about fans like never before, but they have always been the lifeblood of football clubs. With devotees around the globe, engaging through social media has been an opportunity for some quick wins for clubs in the Premier League.
The nature of professional sports is such that there’s an obvious link between new fan uptake and success on the pitch, so Manchester City Football Club has seen numbers grow as it has risen through the league table this year, becoming Premier League champions for the first time in 44 years.
Manchester City Football Club won the Premier League championship in May 2012.
Within top ten brands overall on Twitter, YouTube and foursquare. Top Five for brand post engagement on Facebook.
The social media team’s objective is to engage with new fans and give them even more reasons to stay loyal, while deepening relationships with life-long supporters. “Because it’s football, it’s tribal and passionate,” says Manchester City’s Chris Nield. “We need to be like a mate to our fans – there to listen and help.”
The Club relaunched its website in July 2010 with social media fully integrated into the site. It has continued to improve functionality since then and developed a variety of content, hosting live chats on Twitter with the players, livestreaming training sessions, creating videos for its YouTube channel, and displaying moderated tweets on the big screen before and after games. “We’ve also got profiles up and running on Instagram and Pinterest,” says Nield. “We do different things on these niche platforms and won’t expect big numbers but it’s good to be there getting to know a really interested and educated fanbase.”
This summer Manchester City will be getting involved with the festival circuit, releasing an app that celebrates the city’s musical heritage. Users can download tracks by local bands, remix them, and share with friends. “This will give fans something to engage with while they wait for the new football season to start,” says Nield.
Further afield, Nield will be working with micro-blogging site Weibo for the first time, as the team starts a pre-season tour in China – a good reminder about the distinctive nature of social media in some countries.
Its approach to social media has enabled Manchester City to deepen its relationship with die-hard supporters, connect with a diverse base of new fans, and most importantly, to lay the groundwork to retain them for the future.
manChester City FC: top oF the soCiaL League
ranking: 16
data sCore: 132
paneL sCore: 84
soCiaL Brand sCore: 216
ARkive, the vast and free audio-visual wildlife archive, aims to inspire a global community with its ‘virtual’ conservation effort.
Content is at the top of many a brand’s agenda and ARkive certainly has no shortage, with more than 3,500 of the world’s leading filmmakers and photographers actively contributing material. However, as is often the case, it’s not what you’ve got but what you do with it that counts.
According to ARkive’s Ellie Dart, social is fundamentally about conversation for the brand. “One of the coolest things for us is that we can have a natter with people around the world as individuals, not just a mass of ‘likes’ or tweeps,” she says.
ARkive is a digital library of the world's species run by charity Wildscreen.
No. 1 charity brand for overall performance on platforms.
By engaging in discussion and debate on a variety of platforms, the team gains insights into what people want, whether that’s news about the world’s rarest wildcat or a short film of sleepy meerkats dozing off at the post.
In February, ARkive asked people to tweet the name of their favourite species along with #lovespecies and several well-known Uk wildlife personalities got involved including Mark Carwardine and Liz Bonnin. ARkive complemented this Twitter activity with a ‘Love Species Valentine’s Quiz’ on Facebook, which tested players’ knowledge of different species’ more unusual mating habits.
The challenge ahead lies in keeping up with the launch of new social platforms. Along with Pinterest and the rise of social TV, Dart is keeping an eye on two new platforms in particular; Chime, which is organised around common interests and aims to
share advertising revenue with its users, and SceneChat.com, which enables social interactions on video.
The growing number of platforms has made analysis more important than ever, and as social media’s influence on SEO has increased, platforms have been better integrated into the ARkive website.
By engaging with people in the right places and listening to what they want, social media is enabling ARkive to engage creatively with different groups and raise the profile of the many thousands of endangered species to ultimately ensure their conservation.
One thing will definitely remain a priority in the year ahead; “Last year social media was about conversation; this year social media is about conversation,” says Dart.
arkive: Conservation through Conversation
ranking: 6
data sCore: 145
paneL sCore: 87
soCiaL Brand sCore: 232

3435
CASE STUDY CASE STUDY
We know it’s important and we know we need to have it, but anti-virus software doesn’t automatically feel like the most engaging of subjects, making AVG’s Toothpicks versus Tigers campaign all the more interesting.
Late last year, the software company wanted to demonstrate how its technology works in an engaging way, so placed two people in a cage made of 3.5 million glued together toothpicks. They spent the night in a Thai jungle to see how the cage would hold up against curious and territorial tigers. The good news is that they survived, and AVG vividly demonstrated how its ‘strength in numbers’ approach works; users are the toothpicks, the threat to online security is the tiger, and the glue is AVG, providing protection and the means for the community to share information.
AVG provides software solutions to computer security threats for personal and business customers.
No. 2 Tech brand for second year. Within top ten brands on YouTube and Facebook.
With almost 5 million views on YouTube and a lively thread of comments, the film certainly seems to have hit the mark, but it’s just one of a series of videos the company has made with the aim of educating its community through tutorials and insights into topical security issues.
For AVG’s Jas Dhaliwal, participating in discussion and being open to opinion is key to being a social brand. “We take our messaging and content right to the heart of our community,” he says. “It allows the wider public to have an ongoing conversation with us. Feedback helps us to build better products. Advocacy brings us closer to those who are life-long supporters of the brand and our products.”
Social also plays an important role in customer support on Facebook. “It’s great to see how people have not only joined the Page, but made it their daily destination for security news and updates,” says Dhaliwal. With over 1 million fans, AVG thanks its most active and helpful members through its monthly Community Awards, which bestow free licences and increasing perks on repeat winners.
The challenge lies in staying relevant and one step ahead as thousands of brands get better at social media. AVG’s growing global team and well-established community of advocates puts them in a good position now, but they don’t feel complacent because, as Dhaliwal points out, “Social never sleeps!”
avg: using advoCaCy to BuiLd a Better Brand
ranking: 29
data sCore: 133
paneL sCore: 73
soCiaL Brand sCore: 206
Chatting about holiday plans and crushes; all in a day’s work for the team at Schuh. Their aim is to give people something to laugh about and ‘a good chinwag’ according to Schuh’s Jen Rankine. “Last time we checked, we are human and we don’t try to be anything but that; our customers would see right through it,” she says.
Over the last year, Schuh has established a dedicated in-house social team. As well as showcasing the brand’s personality, the team is there to make sure that questions don’t go unanswered and to keep up with new developments on platforms.
Schuh is a fashion footwear retailer with stores across theUk and Ireland.
No. 2 Retail brand. No. 1 for fan posts interacted with on Facebook.
Social plays a role in all communications, from competitions and in-store events to jobs and relevant service information, with the aim of building a community of like-minded shoe lovers. “We check every feed under the sun to ensure that nothing is missed,” says Rankine. “Customers now know they can come to our social pages to get answers to any niggling questions or help with an order.” Handling complaints are part of the job and the team don’t remove negative comments, believing it’s important to demonstrate how they handle problems that arise, adding to the human feel because ‘everyone makes mistakes’.
Competitions have been a valuable way for the team to engage with their communities and reward customer loyalty. Having experimented with creating Facebook apps in-house, Schuh started working with an agency last year. One result was iWin, which gave entrants the chance to win one of two iPads and a pair of shoes. “We only promoted the competition through social and to our email database but our engagement levels went through the roof and our audience grew by 8%,” says Rankine.
The coming year will involve integrating social into other aspects of the business and engaging with new and regular customers who may not be aware of Shuh’s social presence. Although Schuh may see social as a great business tool, they aim to not lose sight of the fact that people invite brands into their social streams, “It's a privilege, not a right,” says Rankine.
sChuh: maintaining the human touCh
ranking: 40
data sCore: 129
paneL sCore: 71
soCiaL Brand sCore: 200

3637
The next generation of social media is already being defined. Amongst the key trends explored below it is apparent that there are two main drivers: technology and sophisticated data.
Brands will need to keep pace by evolving flexible strategies,up-skilling teams, and experimenting with communications designed to put the customer first.
We are rapidly moving away from the push of a button or a swipe of a touch screen, to natural interactions, for example voice, gesture, touch, facial recognition and smell. Social content in the future will need to communicate with the consumer as if they were there in person at that moment in time, providing personality and content that is contextuallyrelevant to that individual.
Physical objects connected to the Internet will interact with us as ifthey have a personality too. Devices already exist that can tweet us when the plants need watering. Brands should look to move away from augmenting one-size-fits-all digital content, to the product itself actually communicating personalised content.
For example, bottled sports drinks might access a user’s social profiles to remind them when they next need to hydrate and provide health advice tailored specifically to that person. Take it a step further, and if we allow multiple products that we consume on a regular basis access to our social profiles, they will communicate with one another and manage ourdaily lives.
Influencers across all sectors will reign supreme. They will filter andcurate the content we consume. We will be able to follow every move people choose to show us in the digital world. Brands will need to be more sophisticated in managing relationships with influencers, creating and measuring content with both the social and interest graphs in mind.
With virtual and physical products linked to the web, brands will need to become even more sophisticated with the measurement of content andvalue delivered to customers.Every touchpoint in the purchase cycle can be linked directly to acustomer’s social profile allowing us to track and measure interactions in the physical world with the same depth as in the digital world. Data will be interpreted correctly and responded to in real-time, makingcreative content fluid and agile to capitalise on emerging trends.
For all the developments in technology and data sharing, social brands of the future will need to have the individual needs of their customers sitting at the heart of their communications strategy. Communication isfundamentally personal, and with social media complementing the rapid developments in technology, communications in the future will become hyper-personalised to the point where relationships with brands will be tangible.
NATURAL INTERFACES Content & FiLtering Bigger & Better data
WHAT NEXT?
By Tom Chapman, Head of Innovation for Lawton Communications Group
INTERNET OF THINGS
38
APPENDIX
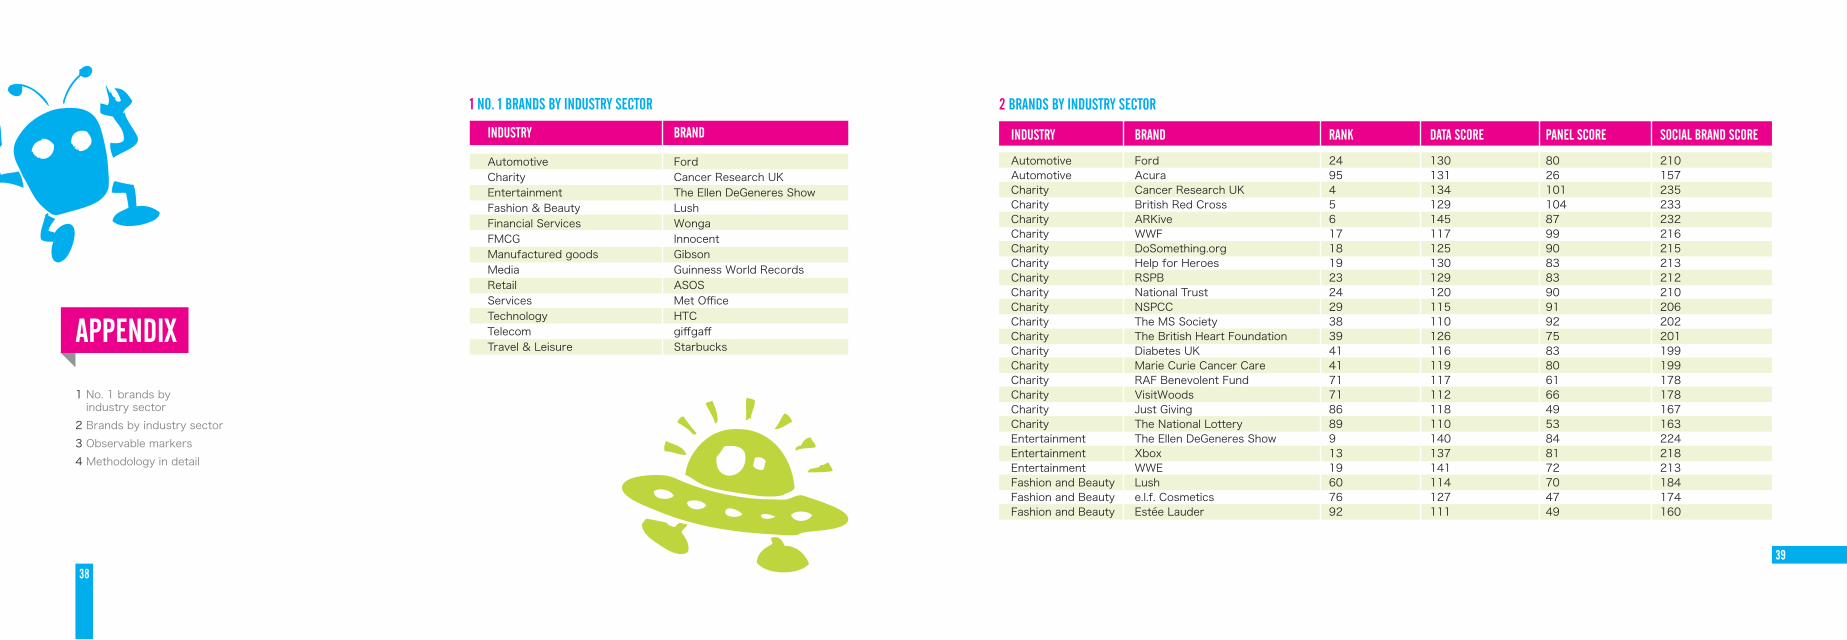
Automotive Ford 24 130 80 210Automotive Acura 95 131 26 157Charity Cancer Research Uk 4 134 101 235Charity British Red Cross 5 129 104 233Charity ARkive 6 145 87 232Charity WWF 17 117 99 216Charity DoSomething.org 18 125 90 215Charity Help for Heroes 19 130 83 213Charity RSPB 23 129 83 212Charity National Trust 24 120 90 210Charity NSPCC 29 115 91 206Charity The MS Society 38 110 92 202Charity The British Heart Foundation 39 126 75 201Charity Diabetes Uk 41 116 83 199Charity Marie Curie Cancer Care 41 119 80 199Charity RAF Benevolent Fund 71 117 61 178Charity VisitWoods 71 112 66 178Charity Just Giving 86 118 49 167Charity The National Lottery 89 110 53 163Entertainment The Ellen DeGeneres Show 9 140 84 224Entertainment Xbox 13 137 81 218Entertainment WWE 19 141 72 213Fashion and Beauty Lush 60 114 70 184Fashion and Beauty e.l.f. Cosmetics 76 127 47 174Fashion and Beauty Estee Lauder 92 111 49 160
industry Brand rank data sCore paneL sCore soCiaL Brand sCore
1 No. 1 brands by industry sector2 Brands by industry sector3 Observable markers4 Methodology in detail
39
1 NO. 1 BRANDS BY INDUSTRY SECTOR 2 BRANDS BY INDUSTRY SECTOR
INDUSTRY BRAND
Automotive Ford Charity Cancer Research Uk Entertainment The Ellen DeGeneres Show Fashion & Beauty Lush Financial Services Wonga FMCG InnocentManufactured goods GibsonMedia Guinness World RecordsRetail ASOS Services Met Office Technology HTCTelecom giffgaff Travel & Leisure Starbucks

4041
Financial Services Wonga 41 138 61 199Financial Services Virgin Money 65 127 54 181Financial Services Simplyhealth 88 123 42 165Financial Services PayPal 97 113 41 154FMCG Innocent 1 139 99 238FMCG Cadbury 7 147 84 231FMCG Lurpak 13 128 90 218FMCG Red Bull 13 125 93 218FMCG Cravendale 19 127 86 213FMCG Tetley 24 135 75 210FMCG Marmite 34 118 86 204FMCG Muddy Boots Real Foods 53 113 79 192FMCG The Collective NZ 57 110 79 189FMCG MaxiRAW 68 142 38 180FMCG Walkers Crisps 89 125 38 163FMCG Oral B 92 119 41 160FMCG Ribena 96 117 38 155FMCG Tropicana 98 110 34 144Manufactured goods Gibson 45 137 60 197Manufactured goods Mongoose Cricket 68 127 53 180Media Guinness World Records 12 145 74 219Media Capital FM 27 133 75 208Media Penguin Uk 27 134 74 208Media road.cc 34 140 64 204Media BBC 45 114 83 197
industry Brand rank data sCore paneL sCore soCiaL Brand sCore
Media MTV Geordie Shore 70 129 50 179Media MTV Uk 86 118 49 167Retail ASOS 7 129 102 231Retail Schuh 40 129 71 200Retail TOMS 49 129 66 195Retail Sainsbury's 50 117 77 194Retail B&Q 53 116 76 192Retail HMV 75 114 61 175Retail Very.co.uk 78 117 56 173Retail Frugi 91 112 50 162Services Met Office 9 145 79 224Services National Rail Enquiries 36 131 72 203Services Groupon 65 117 64 181Services studentbeans.com 83 110 60 170Technology HTC 11 164 57 221Technology AVG 29 133 73 206Technology GoPro 36 140 63 203Technology Blackberry 45 147 50 197Technology Motorola 55 128 62 190Technology Dell 59 112 75 187Technology Intel Uk 65 128 53 181Technology Bing Uk 76 130 44 174Technology Sony Ericsson (Xperia) 78 137 36 173Technology Google 81 125 46 171Technology Samsung Mobile 84 128 40 168
industry Brand rank data sCore paneL sCore soCiaL Brand sCore
2 BRANDS BY INDUSTRY SECTOR (CONT) 2 BRANDS BY INDUSTRY SECTOR (CONT)

4243
Technology BullGuard 100 113 20 133Telecom giffgaff 3 155 81 236Telecom O2 58 113 75 188Telecom Mobile Vikings 60 127 57 184Telecom Orange 71 112 66 178Telecom Comcast 84 126 42 168Telecom CenturyLink 94 121 38 159Telecom AT&T 99 110 33 143Travel & Leisure Virtuous Bread 29 123 83 206Travel & Leisure Starbucks 2 151 86 237Travel & Leisure Manchester City Football Club 16 132 84 216Travel & Leisure kLM 19 127 86 213Travel & Leisure Trent Barton 29 123 83 206Travel & Leisure Leicester Tigers Rugby Club 33 129 76 205Travel & Leisure Fifteen Cornwall 44 112 86 198Travel & Leisure Cardiff bus 45 118 79 197Travel & Leisure Domino's Pizza 51 115 78 193Travel & Leisure Tate 51 115 78 193Travel & Leisure WestJet 55 133 57 190Travel & Leisure Chiltern Railways 62 122 60 182Travel & Leisure Mr & Mrs Smith 62 118 64 182Travel & Leisure Southwest Airlines 62 116 66 182Travel & Leisure Virgin Atlantic 71 111 67 178Travel & Leisure Delta 80 126 46 172Travel & Leisure Virgin Trains 81 118 53 171
industry Brand rank data sCore paneL sCore soCiaL Brand sCore
2 BRANDS BY INDUSTRY SECTOR (CONT)
The scoring across each of the platforms is based on a series of observable markers. Each one indicates a different aspect of social behaviour by the brands. In effect, we are measuring a basket of outputs which together show social performance levels.
On the next three pages there are further descriptions of the markers and what each one measures.
oBservaBLe markers
Brand post engagement
Fan post: Brand post ratio
Fan postengagement
Fan posts interacted with by brand
Number of ‘likes’, ‘comments’ and ‘shares’ generated by brand posts (normalised for community size)
Ratio of fan posts to brand posts
Number of ‘likes’, ‘comments’ and ‘shares’ generated by fan posts (normalised for community size)
Percentage of fan posts responded to by brand administrator/ community manager
Intensity of interaction with brand posted content. Provides a measure of the brand’s success in creating content and behaviour that is valuable in the eyes of the community Vibrancy of community and brand’s willingness/ability to foster community participation
Intensity of interaction with fan posted content, providing a measure of the health of the peer-to-peer spirit in the community
Quality of active listening, and willingness to undertake genuine conversation vs. broadcast messages
marker name marker desCription MEASURING

4445
All @brand mentions
Retweets
Mentions of third party @accounts by @brand
Timeliness of response
Number of @brand mentions (normalised for number of followers)
Retweets of @brand tweets (normalised for number of followers)
Mentions of third party @accounts by @brand
Average time taken when responding to third party @accounts
Success in creating content and conversations that are shared through networks
Ability to create content that has so much value in the eyes of the community that they are willing to share it with their own social graph
Quality of active listening and willingness to undertake genuine conversation vs. pushing messages Having the resource and will to deliver ‘always-on’ community management
marker name marker desCription MEASURING
GOOGLE+
+1s per post
Shares per post
Comments per post
Average +1s per post
Average shares per post
Average comments per post
Ability to create content that has so much value in the eyes of the community that they are willing to share it with their own social graph
Ability to create content that has so much value in the eyes of the community that they are willing to share it with their own social graph
Intensity of interaction with brand posted content. Provides a measure of the brand’s success in creating content, and conversation that is valuable in the eyes of the community
marker name marker desCription MEASURING
YOUTUBE
Average viewsper video
Average comments per video
Average number of views per video posted by brand
Average number of comments per video posted by brand
Value of video content in the eyes of the community
Intensity of interaction with video content
marker name marker desCription MEASURING
BRAND OWNED FORUM
Posts per thread Posts per forum thread
Success in creating a vibrant community with high levels of interaction
marker name marker desCription MEASURING
BRAND OWNED BLOG
Blog usage
Comment : post ratio
Brand blog used
Comment to post ratio
Willingness to create long-form content, and engage with community
Success in creating valuable and appropriate content that prompts interaction
marker name marker desCription MEASURING
OWN WEBSITE
Outpost links
Outpost link visibility
Links to social outposts
Visibility of links to social outposts
Proactive promotion of brand’s wider social footprint
High priority given to social outposts as part of overall digital brand experience
marker name marker desCription MEASURING
Foursquare
Tips done Average number of people who completed tips left by the brand
Creation of valuable and appropriate content that prompts interaction
marker name marker desCription MEASURING

46
METHODOLOGY IN DETAIL
YouTube
Google +
foursquare
Brand owned forum
Brand owned blog
Own website
Brand post engagementFan post:Brand post ratioFan post engagementFan posts interacted with by brand
All @brand mentionsRetweetsMentions of third part @accounts by @brandTimeliness of response
Average views per videoAverage comments per video
+1s per postShares per postComments per post
Tips done
Posts per thread
Blog usageComment to post ratio
Outpost linksOutpost link visibility
6 week period from mid-Jan to end of Feb
6 week period from mid-Feb to end of March
Most recent 10 videos (as at 2/3 April)
Last 6 weeks worth of data (as at 2/3 April)
First and last 10 tips (as at 2/3 April)
10 most recent threads (as at 2/3 April)
Last 6 weeks worth of data (as at 2/3 April)
As at 2/3 April
Likes + Comments x1.5 + Shares x2 divided by FansNo. of Fan posts as percentage of total postsLikes + Comments + Shares divided by FansPercentage of Fan posts that brand interacted with
No. of mentions of @brand account divided by FollowersCount of retweetsCount of tweets that included 3rd party @account name (excl Retweets)Average time taken to respond to 10 randomly selected tweets
Average number of video viewsAverage number of comments
+1s + Comments x1.5 + Shares x2
Average number of tips done
Average number of posts per thread
Simple Yes/NoAverage number of comments per post
Simple Yes/NoRating scale of 0-3 (0=No icons or links, 1=Below the fold, 2=Small icons, 3=Big clear icons)
80
70
40
22.5
10
15
15
10
pLatForm metriC date/time period/voLume assessed CaLCuLation pLatForm overaLL sCore
4849
aCknowLedgements
We would like to express our thanks to the following individuals and organisations that have made significant contributions to the Social Brands 100.
To Brandwatch, our social media monitoring partner for the second time round. They power a large part of the analytics behind the ranking, and this year developed bespoke algorithms to allow even greater levels of detailed assessment. To our exclusive media partner, Brand Republic, for their enthusiasm for and support of the research. To our judging panel, who contributed their time and considerable expertise.
To Nexus Globalnet, our wifi partner, for ensuring reliable connectivity at our events.
Finally, thank you for your interest. Please contact any of us with thoughts or questions at [email protected] or @socialbrands100.
Steve SponderHead of Agency, HeadstreamJulius DuncanMarketing Director Maeve O’SullivanContent Director Nick OwenHead of Data AnalyticsAndrea CattConnections DirectorDarren VernallArt DirectorSam HilarySocial Media Manager Steve MatthewsDesignerRich SmithProject Manager (Publications)Jeremy BourtonMarketing Executive
SOCIAL BRANDS 100TEAM
SOCIAL BRANDS 100PARTNERS

5051
ABOUT HEADSTREAM
Headstream is a specialist social agency and part of the Lawton Communications Group.
For the past six years we’ve been helping brands like the BBC, Activision and McLaren become more successful by embedding social into their marketing communications.
Social is making marketing exciting again Social brings brands closer to customers Social should be simple When we have fun with our clients, we do better work.
For more information on Headstream’s work contact:
Andrea [email protected] @andreacatt
+44 (0)23 8082 8520
For media enquiries contact:
Julius [email protected]@juliusduncan
+44 (0)23 8082 8585
www.headstream.com @headstream
we BeLieve
The Social Brand Agency

GLOSSARY
5253
Brand GuidelinesA written document outlining the main statements and values that a company has in place, enabling others to understand what the brand is about.
CrowdsourcedThe act of putting out an information request to a large group of people, often open to the general public, and collecting together the ideas to influence or create a project.
DiasporaA community of people that has spread to diverse locations.
Influencerskey people in communities who are either well read by, or looked up to by the community that they inhabit.
Interest GraphA network of relationships between individuals and online content that centres on a particular topic, or interest. MemeA piece of content, or behavioural act, which is passed on rapidly between people, attracting widespread attention across digital and social platforms.
NormaliseTo make information conform to a set standard.
Observable MarkerAn indicator of interactions between people in social and digital spaces.
Social AgeThe period of time since Web 2.0 emerged in the early part of this millennium, enabling individuals to network, share information, collaborate and create content easily. Social GraphThe global relationships between users on social networks.
Social NetworkAn online service, platform or site that facilitates the building of social relations among people.
Social SpacesThe types of websites and online platforms that act as social networks.
Value Based ContentContent that focuses on providing a value to people e.g. utility, entertainment, rather than pushing marketing messages.