Embed Size (px)
Citation preview

Report
Social and Economic Impact Assessment on the Potential Impacts of Implementation of the Draft Forest Management Plan 2014 - 2023
14 AUGUST 2012
Prepared for
Conservation Commission of Western Australia and Department of Environment and Conservation
Australia II Drive Crawley WA 6009
42908086
The views expressed in this report do not necessarily represent the views of, and should not be attributed to, the Conservation Commission of Western Australia or the WA Department of Environment and Conservation.


SEIA Draft Forest Management Plan 2014-2023
42908086/1/03
Statement of Limitations
URS Australia Pty Ltd (URS) has prepared this Social and Economic Impact Assessment (SEIA) in
accordance with the usual care and thoroughness of the consulting profession for the use of the
Department of Environment and Conservation (DEC) and the Conservation Commission of Western
Australia (CCWA) and only those third parties who have been authorised in writing by URS to rely on
this SEIA.
It is based on generally accepted practices and standards at the time it was prepared. No other
warranty, expressed or implied, is made as to the professional advice included in this SEIA.
It is prepared in accordance with the scope of work and for the purpose outlined in the contract dated
20 March 2012.
Where this SEIA indicates that information has been provided to URS by third parties, URS has made
no independent verification of this information except as expressly stated in the SEIA. URS assumes
no liability for any inaccuracies in or omissions to that information.
This SEIA was prepared between 1 May 2012 and 7 August 2012 and is based on the conditions
encountered and information reviewed at the time of preparation. URS disclaims responsibility for any
changes that may have occurred after this time.
This SEIA should be read in full. No responsibility is accepted for use of any part of this report in any
other context or for any other purpose or by third parties. This SEIA does not purport to give legal
advice. Legal advice can only be given by qualified legal practitioners.
Except as required by law no third party may use or rely on this SEIA unless otherwise agreed by URS
in writing. Where such agreement is provided, URS will provide a letter of reliance to the agreed third
party in the form required by URS.
To the extent permitted by law, URS expressly disclaims and excludes liability for any loss, damage,
cost or expenses suffered by any third party relating to or resulting from the use of, or reliance on, any
information contained in this SEIA. URS does not admit that any action, liability or claim may exist or
be available to any third party.
Except as specifically stated in this section, URS does not authorise the use of this SEIA by any third
party.
It is the responsibility of third parties to independently make inquiries or seek advice in relation to their
particular requirements and proposed use of the site.
Any estimates of potential costs which have been provided are presented as estimates only as at the
date of the SEIA. Any cost estimates that have been provided may therefore vary from actual costs at
the time of expenditure.
SEIA Draft Forest Management Plan 2014-2023
42908086/1/03 i
Table of Contents
Executive Summary ................................................................................................. ix
1 Introduction ............................................................................................................. 1
1.1 Background ...................................................................................................... 1
1.1.1 Forest Management Planning ......................................................................................... 1
1.1.2 Statutory requirements ................................................................................................... 2
1.1.3 Social and Economic Impact Assessment .................................................................... 2
1.2 Project scope (Terms of Reference) ............................................................... 3
1.3 Structure of this report .................................................................................... 5
2 Approach ................................................................................................................. 7
2.1 RIS requirements and context applied to this study ...................................... 7
2.2 Defining the study area, communities and industries ................................... 9
2.2.1 Study limitation ................................................................................................................ 9
2.2.2 Study area .......................................................................................................................10
2.3 Community profiles ........................................................................................ 12
2.4 Industries considered .................................................................................... 13
2.5 Stakeholder consultation ............................................................................... 13
2.6 Data sources ................................................................................................... 14
3 Background: Forest Management Plan 2004 - 2013 .......................................... 15
3.1 Government policy in the forests .................................................................. 15
3.2 Forest Management Plan 2004-2013 ............................................................. 15
3.3 Impacts of past land use decisions .............................................................. 18
3.3.1 Declining resource availability .....................................................................................18
3.3.2 Shifting supply and decreasing log size .....................................................................20
3.3.3 Forest products industry restructuring and adaptation ............................................21
3.3.4 Social and economic impacts of previous land use decisions.................................22
4 Next Forest Management Plan 2014 - 2023 ........................................................ 25
4.1 Indication of Draft 2014-2023 FMP ................................................................ 25
4.1.1 Forest Products .............................................................................................................25
4.1.2 Craftwood .......................................................................................................................26
4.1.3 Mineral resources ..........................................................................................................26
4.1.4 Water resources .............................................................................................................26

SEIA Draft Forest Management Plan 2014-2023
Table of Contents
42908086/1/03
4.1.5 Tourism and recreation .................................................................................................27
4.1.6 Basic raw materials .......................................................................................................28
4.1.7 Apiculture, floriculture and seed industries ...............................................................28
4.1.8 Biotechnology ................................................................................................................28
4.1.9 Public firewood ..............................................................................................................28
5 Current socio-economic status in the study area (baseline) ............................ 31
5.1 Profile of communities associated with native forest industries ................ 31
5.1.1 Population ......................................................................................................................31
5.1.2 Shire of Bridgetown-Greenbushes ..............................................................................33
5.1.3 City of Busselton ...........................................................................................................36
5.1.4 Shire of Collie .................................................................................................................41
5.1.5 Shire of Donnybrook-Balingup .....................................................................................44
5.1.6 Shire of Harvey ...............................................................................................................46
5.1.7 Shire of Manjimup ..........................................................................................................49
5.1.8 Shire of Murray ...............................................................................................................55
5.1.9 Shire of Nannup .............................................................................................................57
5.1.10 Shire of Serpentine-Jarrahdale ....................................................................................60
5.2 Regional economic base ............................................................................... 63
5.2.1 The south west economy ..............................................................................................64
5.2.2 Mineral extraction ..........................................................................................................65
5.2.3 Agriculture and food production ..................................................................................66
5.2.4 Tourism ...........................................................................................................................68
5.2.5 Other economic activity ................................................................................................73
5.2.6 Forest products industry ..............................................................................................76
6 Potential economic impact of implementation of FMP 2014-2023 ................... 85
6.1 FMP indicative volumes and drivers of change ........................................... 85
6.1.1 Drivers of industry change beyond the FMP ..............................................................85
6.1.1 Mitigating the impacts ...................................................................................................88
6.1.2 Impacts as a result of government policy or from external factors .........................91
6.2 Impact assessment – forest products industry ............................................ 91
6.2.1 Indicative upper wood volume .....................................................................................92
6.2.2 Indicative lower wood volume ......................................................................................92
SEIA Draft Forest Management Plan 2014-2023
Table of Contents
42908086/1/03 iii
6.2.3 Impact of harvest location and thinning operations ..................................................99
6.2.4 Impact on secondary processors ..............................................................................100
6.3 Impact assessment – other associated industries .................................... 100
6.3.1 Impact on forest based economic activity ................................................................101
6.3.2 Impact on key communities ........................................................................................105
7 Findings ............................................................................................................... 111
8 Limitations .......................................................................................................... 115
9 References .......................................................................................................... 117
Appendices
Appendix A Stakeholder consultation summary outcomes
Appendix B Interview Schedule
Appendix C Shire of Manjimup analysis of commitments made
Appendix D Forest products industry market overview
Appendix E Indicative harvest plans
Tables
Table 1-1 Report structure ................................................................................................................ 5
Table 2-1 Defining the project study area ....................................................................................... 12
Table 3-1 Sustained yield volumes (cubic metres) of first and second grade sawlogs for principal timber species (current FMP).......................................................................................... 17
Table 3-2 Average annual yield of native forest timber available under current FMP 2004-2013 (m
3/annum) – Current FMP ............................................................................................. 18
Table 3-3 Current distribution of jarrah sawlog supply versus modelled projections by supply zone ........................................................................................................................................ 20
Table 4-1 Indicative volume of wood potentially available during FMP 2014-2023 ........................ 25
Table 5-1 Shire of Bridgetown-Greenbushes - selected population data ....................................... 34
Table 5-2 Schools in the Shire of Bridgetown-Greenbushes .......................................................... 34
Table 5-3 City of Busselton - Selected Population Data ................................................................. 37
Table 5-4 Student enrolments – City of Busselton schools ............................................................ 37
Table 5-5 City of Busselton visitor summary ................................................................................... 39
Table 5-6 Shire of Collie – selected population data ...................................................................... 41
Table 5-7 Schools in the Shire of Collie .......................................................................................... 42

SEIA Draft Forest Management Plan 2014-2023
Table of Contents
42908086/1/03
Table 5-8 Shire of Donnybrook - selected population data ............................................................. 45
Table 5-9 Shire of Harvey – selected population data .................................................................... 47
Table 5-10 Schools in the Shire of Harvey ....................................................................................... 47
Table 5-11 Shire of Manjimup – selected population data ................................................................ 50
Table 5-12 Schools in the Shire of Manjimup ................................................................................... 50
Table 5-13 Selected population data for the Shire of Murray ........................................................... 55
Table 5-14 Enrolment in schools in the Shire of Murray ................................................................... 56
Table 5-15 Shire of Nannup – selected population data ................................................................... 58
Table 5-16 Shire of Serpentine-Jarrahdale - selected population data ............................................ 61
Table 5-17 Enrolment in schools in the Shire of Serpentine-Jarrahdale .......................................... 61
Table 5-18 Industry gross value added - WA ($b) ............................................................................ 64
Table 5-19 Mining values by commodity in the study area ($ million) .............................................. 65
Table 5-20 Trends in the value of agricultural production in the South West ($ million at farm gate) ........................................................................................................................................ 66
Table 5-21 Numbers of people employed in agriculture and fishing in the South West ................... 68
Table 5-22 Significance of the tourism industry ................................................................................ 68
Table 5-23 Tourism expenditure in the South West ($m per year) ................................................... 71
Table 5-24 Visitor nights in the South West in 2010 and 2011 ......................................................... 71
Table 5-25 Number of tourism commercial license holders by DEC district ..................................... 73
Table 5-26 Firewood removal under contract ................................................................................... 76
Table 5-27 Details of 2012 projected sawlog supply to sawmills .......................................................... 78
Table 5-28 Estimate of number of people directly employed by sawmills by local government area ........................................................................................................................................ 79
Table 5-29 Estimations of employment in Western Australia native forest industries in 2011 ......... 81
Table 5-30 URS estimates of employees by native forest sector (2012) .......................................... 81
Table 6-1 Draft FMP 2014-2023 indicative wood volumes ............................................................. 85
Table 6-2 Summary of current sawlog supply and current FMP 2004-2013 .................................. 92
Table 6-3 First and second equivalent grade jarrah sawlog supply – current at July 2012 ............ 94
Table 6-6 Summary of major employment impacts ........................................................................ 97
Table 6-7 Adjusted estimated job losses by sector ......................................................................... 98
Table 6-8 Job losses as a proportion of local labour force ............................................................. 98
Table 6-9 Current distribution of jarrah sawlog supply versus current FMP scenario projections .. 99
Table 7-1 Stakeholder issues associated with the Draft FMP ...................................................... 111

SEIA Draft Forest Management Plan 2014-2023
Table of Contents
42908086/1/03 v
Figures
Figure 2-1 Supply zones within State forest and timber reserves .................................................... 11
Figure 3-1 Changes in jarrah log diameters between 1995-2001 and 2002-2005 .......................... 20
Figure 3-2 FPC jarrah sawlog harvest volumes ............................................................................... 21
Figure 5-1 Percentage change in population between 2001 and 2011 by LGA .............................. 32
Figure 5-2 Industry of employment (Shire of Bridgetown-Greenbushes) ......................................... 36
Figure 5-3 Industry of employment (City of Busselton) .................................................................... 40
Figure 5-4 Industries of employment (Shire of Collie) ...................................................................... 44
Figure 5-5 Industries of employment (Shire of Harvey) ................................................................... 49
Figure 5-6 Industries of employment (Shire of Manjimup) ............................................................... 54
Figure 5-7 Industries of employment (Shire of Murray) .................................................................... 56
Figure 5-8 Industries of employment (Shire of Nannup) .................................................................. 60
Figure 5-9 Industries of employment (Shire of Serpentine-Jarrahdale) ........................................... 63
Figure 5-10 Trends in intrastate overnight visitor nights in the South West ....................................... 69
Figure 5-11 Trends in interstate overnight visitor nights in the South West ....................................... 70
Figure 5-12 Trends in international overnight visitor nights in the South West .................................. 70
Figure 5-13 Value of logs harvested in Western Australia ................................................................. 77
Figure 6-1 Imported hardwood sawn timber and exchange rate (1995 – 2011) .............................. 86
Figure 6-2 Apparent consumption of timber and housing commencements in Australia ................. 87

SEIA Draft Forest Management Plan 2014-2023
42908086/1/03
THIS PAGE INTENTIONALLY LEFT BLANK

SEIA Draft Forest Management Plan 2014-2023
42908086/1/03 vii
Abbreviations
Abbreviation Description
ABS Australian Bureau of Statistics
bdmt Bone dry metric tonne
CALM Conservation and Land Management
CALM Act Conservation and Land management Act 1984
CIF Cost Insurance Freight
CMPA cubic metres per annum
DEC Department of Environment and Conservation
DMP Department of Mines and Petroleum
DOW Department of Water
DRDL Department of Regional Development and Lands
DSR Department of Sport and Recreation
ENGO Environmental Non-Government Organisation
ESFM Ecologically Sustainable Forest Management
FIFO Fly In-Fly Out
FMP Forest Management Plan
FOB Free On Board
FPC Forest Products Commission
GDP Gross Domestic Product
GSP Gross State Product
GTIS Global Trade Information Service
IGVA Industry Gross Value Added
ISG Investment Security Guarantee
LEDUB Large End Diameter Under Bark
LGA Local Government Authority
LSL Laminated Strand Lumber
LVL Laminated Veneer Lumber
MPC Minor Production Contract
OSL Oriented Strand Lumber
PVS Parks and Visitors Service
RFA Regional Forest Agreement
RIS Regulatory Impact Statement
SEIA Social and Economic Impact Assessment
SWALSC South West Aboriginal Land and Sea Council
SWDC South West Development Commission
TCA Timber Communities Australia
WA Western Australia

SEIA Draft Forest Management Plan 2014-2023
42908086/1/03
THIS PAGE INTENTIONALLY LEFT BLANK

SEIA Draft Forest Management Plan 2014-2023
42908086/1/03 ix
Executive Summary
Introduction
Western Australia's public native forests are managed for diverse values, including nature
conservation, tourism and recreation, water catchment protection, timber production and mining.
The Conservation Commission of Western Australia (Conservation Commission), as the vesting body,
is responsible for the preparation of a forest management plan through the agency of the Department
of Environment and Conservation (DEC). The Conservation Commission has the responsibility under
section 54 of the Conservation and Land Management Act 1984 (the CALM Act) to prepare
management plans and to review expiring plans for all land vested in it. The CALM Act requires a new
forest management plan be developed every ten years.
This report details the social and economic impact assessment (SEIA) of the Draft Forest
Management Plan (FMP) 2014 - 2023. The Draft FMP has been developed to provide the basis for the
implementation of policies and objectives for the management of lands vested in the Conservation
Commission for a range of environmental, social and economic uses and, once gazetted, will replace
the current FMP introduced in 2004.
The focus of this SEIA is to identify and quantify the social and economic impacts resulting from a
range of scenarios and management practices which could be implemented under the Draft FMP. This
social and economic impact assessment adopts a methodology that allows an analysis of potential
consequences brought about by the implementation of the Draft FMP in both social (nonmonetary)
and economic (monetary) terms.
This study involved a desktop review of available data, an industry and stakeholder consultation
process, and an analysis of findings. The desktop review used historical and current production data,
employment data, and regional statistics and documentation specific to implementation of the FMP.
The stakeholder consultation was undertaken in the primary wood production regions and in the Perth
metropolitan area. In line with the Regulatory Impact Statement guidelines, which this SEIA has
followed, the study has focused on the areas of most significant impact being those with a forest
products industry presence and broadly corresponding to the two main wood supply zones.
Draft Forest Management Plan 2014-2023
At the time of undertaking this study the Draft FMP was not finalised and URS had not been provided
with the Draft FMP for review. In May 2012, URS was provided with a range of indicative wood
volumes across timber species, wood source location scenarios, and an overview of the management
options that were being considered for the Draft FMP. At that time modelling of sustained timber yields
was still in progress and proposed volumes had not been determined.
In the absence of proposed wood volumes, two indicative wood volumes were analysed for this
project: an ‘upper indicative wood volume’ and a ‘lower indicative wood volume’. The upper indicative
wood volume represents a small increase in volumes for jarrah and karri first and second grade
sawlogs and marri other bole logs compared to the current FMP. The lower indicative wood volume
represents a 20 per cent reduction in jarrah sawlog volume and a 7 per cent reduction in karri sawlog
volume. This also results in a reduction in the volume of jarrah other bole log of around 50 per cent.
The reduction in the other bole log resource is the result of a number of factors, including a lack of
markets for the lower quality resource, giving rise to expected substantial delays in undertaking early /
scheduled thinning in regrowth and mining rehabilitation stands.

SEIA Draft Forest Management Plan 2014-2023
Executive Summary
x 42908086/1/03
The indicative range of wood volumes guided consultations with stakeholders. While it has been
possible to make a judgement about potential social and economic impacts over the considered range
of indicated wood volumes, not all potential impacts or their location have been identified or
comprehensively assessed, as the details of the Draft FMP were not available.
The geographic boundary for the SEIA has focused on areas where impacts of any change are more
likely to occur, and where they are expected to have the most effect. These are the areas proximate to
timber harvest activity and communities where forest products industries predominantly take place
and/or persons engaged in related activities live.
Key local government areas
The local government areas (LGA) in the study area with the highest percentage of the total workforce
involved in the forest products industry are: Bridgetown-Greenbushes, Manjimup, and Nannup. At the
time of completing this report, industry of employment data was not available from the 2011 census.
Data from the 2006 census indicates that the ‘urban centre locality’ of Nannup had 18.8% of employed
persons aged 15 years and over employed in ‘log sawmilling and timber dressing’; Greenbushes
recorded 14.2% and Manjimup 5.9% employed in the same industry. While the LGAs of Bunbury and
Perth have the highest number of people employed in the forest products industry, the industry
workforce in these areas is a small proportion of the total (Schirmer 2008).
The Shire of Bridgetown-Greenbushes is located in the centre of the south west close to State forests
and national parks, wineries, and heritage walks and trails. The town of Bridgetown was recognised as
a Heritage Town in 2000 due to its historic buildings. The area also hosts a number of festivals, and
has a large number of accommodation options for visitors. The population in the Shire has grown in
recent years after a period of stagnation. However, much of the growth has been in the upper age
categories, which, as the population ages, is likely to have an impact upon social services such as
medical and allied health services. The economy of the Shire is reasonably diverse with an important
tourism sector. In addition, the forest products industry and the mineral resources sector are major
employers in the Shire.
Approximately 80 per cent of the land area of the Shire of Manjimup is national park, State forest,
nature reserve or other reserve land. Of the LGAs reviewed for this study, Manjimup is the only shire
to experience a decrease in its population over the past 30 years. Since 2001 the population has
decreased by almost nine per cent.
Anecdotal and other evidence gathered through the consultation process indicates that Manjimup
suffered significant disruption following the implementation of the current FMP and, after ten years,
has not fully recovered from the forest products industry restructure in 2003. The implementation of
the current FMP resulted in considerable uncertainty, a loss of population and a subsequent loss of
potential investment. The Shire has also experienced considerable decline in visitor numbers brought
about by multiple factors including the global financial crisis and a strong Australian dollar, such that
the tourism sector is only now beginning to recover.
Investment into the Shire of Manjimup has commenced through the State Government’s SuperTowns
initiative, but the impacts of this investment are yet to be felt. The Shire is also pursuing options for a
more diversified economic future to reduce its reliance on the forest products industry. Individuals
within the Shire are also investing in their own future and looking at employment options that allow
them to reside in Manjimup and work elsewhere (i.e. FIFO).

SEIA Draft Forest Management Plan 2014-2023
Executive Summary
42908086/1/03 xi
Eighty-five per cent of the Shire of Nannup is forested but it also provides for a wide range of
agricultural activities, including dairying, beef cattle, horticulture, aquaculture, agroforestry, viticulture
and hobby farming. The town of Nannup hosts a range of festivals and events attracting high numbers
of visitors to the area. However, its location away from the major tourist route of the South West
Highway means that Nannup does not benefit from passing traffic to the same extent as other small
country towns in the south west region.
Employment in the Nannup Shire centres on agriculture and the forest products industry, although
tourism is becoming a more significant contributor to the local economy.
In 2003, Nannup was considered a vulnerable community in the social impact assessment undertaken
for the current FMP. At the time there was only marginal growth, high unemployment and very limited
employment opportunities. While the unemployment rate is now comparable with other LGAs in the
south west, there are few opportunities for business development and employment today.
The townships of Manjimup and Nannup are facing many challenges that their councils and
administrations are attempting to address. There has been a concerted effort to look to a future that
can realise economic benefits from their location in the forests, not only through tourism and other
recreational activities, but also by balancing these forest uses with a sustainable forest products
sector.
Identified impacts
Interviews with key stakeholder groups identified a range of issues and perceived impacts related to
the implementation of the Draft FMP. These are summarised in the Table below.
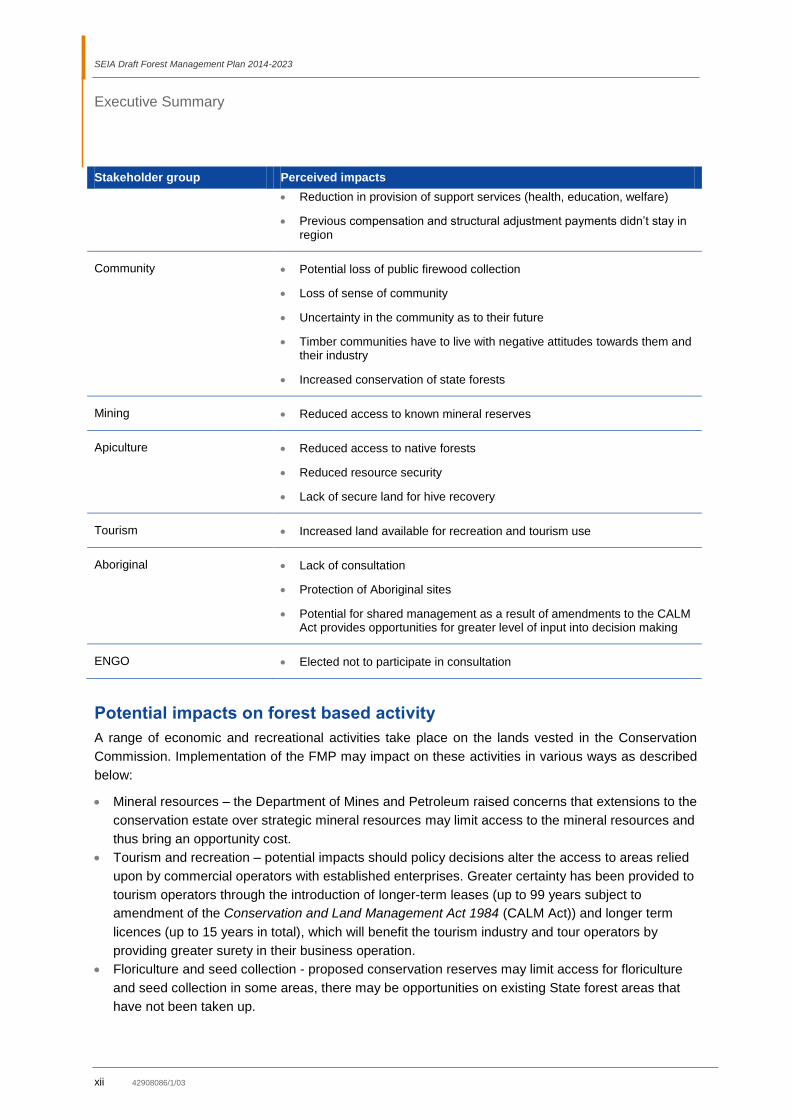
Table 1 Perceived impacts of Draft FMP
Stakeholder group Perceived impacts
Forest Products Industry Reduced access to resource (particularly larger and higher quality timbers)
Businesses unlikely to be able to tolerate reduction in volume (or increase in costs)
Lack of confidence in resource security, log quality and costs is hindering new investment
Likely mill closures under the lower indicative volume (at least one large mill)
Loss of direct jobs (between 129 and 158 under lower indicative volume)
Closure of businesses reliant on forest products industry
Difficulty in raising capital for investment
Inability to compete with imports (timber and furniture
Local Government Loss of population if local mills close and the flow on effects of this
Reduction in rate base
Potential closure of schools
Attraction and retention of business investment
SEIA Draft Forest Management Plan 2014-2023
Executive Summary
xii 42908086/1/03
Stakeholder group Perceived impacts
Reduction in provision of support services (health, education, welfare)
Previous compensation and structural adjustment payments didn’t stay in region
Community Potential loss of public firewood collection
Loss of sense of community
Uncertainty in the community as to their future
Timber communities have to live with negative attitudes towards them and their industry
Increased conservation of state forests
Mining Reduced access to known mineral reserves
Apiculture Reduced access to native forests
Reduced resource security
Lack of secure land for hive recovery
Tourism Increased land available for recreation and tourism use
Aboriginal Lack of consultation
Protection of Aboriginal sites
Potential for shared management as a result of amendments to the CALM Act provides opportunities for greater level of input into decision making
ENGO Elected not to participate in consultation
Potential impacts on forest based activity
A range of economic and recreational activities take place on the lands vested in the Conservation
Commission. Implementation of the FMP may impact on these activities in various ways as described
below:
Mineral resources – the Department of Mines and Petroleum raised concerns that extensions to the
conservation estate over strategic mineral resources may limit access to the mineral resources and
thus bring an opportunity cost.
Tourism and recreation – potential impacts should policy decisions alter the access to areas relied
upon by commercial operators with established enterprises. Greater certainty has been provided to
tourism operators through the introduction of longer-term leases (up to 99 years subject to
amendment of the Conservation and Land Management Act 1984 (CALM Act)) and longer term
licences (up to 15 years in total), which will benefit the tourism industry and tour operators by
providing greater surety in their business operation.
Floriculture and seed collection - proposed conservation reserves may limit access for floriculture
and seed collection in some areas, there may be opportunities on existing State forest areas that
have not been taken up.

SEIA Draft Forest Management Plan 2014-2023
Executive Summary
42908086/1/03 xiii
Firewood collection - some changes canvassed in the Draft FMP with respect to public firewood
collection could result in reduced public access for firewood collection in some areas, if option for
greater reliance on commercial suppliers is implemented.
Potential impacts in the forest products sector
The analysis summarises the potential impacts associated with a change in the volume of native forest
wood available for harvesting and discusses how this may affect some sawmills. This has been
completed by a proportional analysis and doesn’t account for structural adjustment or adaptation by
mills that may occur and could see some mills operate using different volumes and/or mixes of timber
species. This would require direct knowledge of how and where any reductions in wood volumes might
be applied, and a specific analysis of those changes on a mill by mill basis.
The WA sawmilling sector has faced ongoing decline as a result of reductions in available wood
volumes, declining log size and average log quality and increased unit costs of production. Under the
indicative upper wood volume of the Draft FMP, the viability of the sawmilling sector may be
marginally improved as any increase in available volume would reduce unit production costs, other
factors held constant. The sector will remain finely balanced and the existing issues of decreasing log
size and average log quality, increasing delivered log costs and sawmill costs of production impacting
on sawmill viability will remain. However, additional sawlog resources would provide stability to the
industry and would reduce the likelihood of further business closures and job losses. The extent of
positive benefits associated with a small increase to sawlog volumes would be dependent on the size,
quality and cost of the logs supplied.
The current FMP permitted volume of first and second grade jarrah sawlogs is fully utilised by the
sawmills in south west WA. The indicative lower wood volume of the Draft FMP represents a reduction
in the volume of first and second grade jarrah sawlogs of 26,000 m3 per annum (approximately 20 per
cent) compared to the level allowed in the current FMP. It is the opinion of the consultant that a
reduction in the volume of this magnitude is highly likely to result in the closure of at least one of the
larger sawmills, either in the locality of Manjimup, Greenbushes or Nannup.
URS considers that the closure of one of the larger sawmills is a more likely outcome than the closure
of several small sawmills. The larger sawmills are geared towards processing larger volumes, and unit
costs of production will increase as input volumes decrease, potentially making the larger sawmills
less viable. On the other hand, the smaller mills have suggested that they are better able to tolerate
log size and quality variability and are more able to quickly adapt to find and develop niche markets for
their products.
Under the indicative lower wood yield, the volume of karri sawlogs would reduce by 4,000 m3 per
annum from current levels (i.e. a reduction of approximately 7%). This would have an impact on the
two mills that process the larger volumes of karri sawlogs. During the consultations representatives
from these two sawmills noted that a reduction in supply of karri sawlogs from FPC would impact on
the viability of the sawmill unless it could secure timber from other sources to maintain a minimum
input.
As the Forest Products Commission (FPC) currently sells around 12,000 m3 per annum of better
quality marri logs, under the lower indicative wood volume, the lower marri volume available would not
be expected to have a marked impact on the forest products industry. The marri-based industry is
constrained by the ability to identify good quality logs, not markets. If FPC were able to identify larger
SEIA Draft Forest Management Plan 2014-2023
Executive Summary
xiv 42908086/1/03
volumes of good quality marri logs, this additional supply would have positive economic benefits,
particularly in the furniture manufacturing industry which is currently experiencing a high demand for
marri products. Conversely, if the volume of marri harvested decreased under the lower indicative
wood volume as a result of changes to forest areas harvested or available for harvest, this is likely to
have a negative impact on the furniture industry.
Under the lower indicative wood volume, URS has estimated potential job losses as a result of the
implementation of the Draft FMP. Direct job losses for those involved in the forest products industry
range from 129 to 158, depending on the closure of one or more sawmills, with those losses not all
located in the LGA in which the sawmill is situated. Indirect job losses, that is additional job losses
elsewhere in the economy, could range from 175 to 215 depending on the location of the mill closure.
Based upon the labour force in each of the Shires in which the larger mills are located, it is the Shire of
Nannup that will feel the greatest impact if the sawmill there was to close. Should there be direct
employment losses of 129 workers in the Shire of Nannup, this would represent some 16.2 per cent of
the total labour force of the Shire. However, it is likely that some of the 129 workers may reside in
other LGAs (e.g. secondary processors, harvest and haulage contractors and forest management
officers) so the entire job loss impact will be spread across LGAs. Nevertheless, there is potential for a
significant impact on the town of Nannup.
Mitigating the impacts – the options
A preferred approach to mitigating the negative effects of the implementation of the FMP will be to
provide to new options for utilising available forest products which will provide opportunities to existing
and possibly, new businesses. These are summarised below.
Potential for investment in new wood markets - FPC has been investigating where there may be
potential new markets and products, including:
o Marri utilisation - the available marri resource is currently underutilised, primarily due
to difficulties in determining log quality in standing trees. URS understands that if FPC
could more accurately predict log quality and identify better quality marri logs, the
economics of log harvesting would be improved and FPC could sell more of the
available volume.
o Veneer/plywood - an opportunity exists for veneer/plywood processing of native
timber in south west WA. Around 20-30% of the supply for a veneer/plywood mill may
be able to be delivered as shorter lengths than typical sawlogs which may enable
increased recovery from the other bole (non-sawlog) component of the resource.
o Engineered wood products - considered by URS to represent one of the best options
for utilisation of the other bole log resource. There could be an opportunity to use the
lower quality native forest logs, which still have high inherent strength properties, to be
processed using reconstituted or stranding technologies. A product similar to
laminated strand lumber or oriented strand lumber could potentially be produced.
o Bioenergy - opportunities exist for bioenergy and biofuel production based on woody
biomass feedstocks. The growing maturity of these technologies due to strong
industry development in Europe means that production costs have lowered
significantly and biomass energy has become increasingly viable in localised areas,
where either production costs can be lowered significantly or demand for on-site
energy is high.

SEIA Draft Forest Management Plan 2014-2023
Executive Summary
42908086/1/03 xv
Developing new markets for forest products
Development of new markets for the products described above would have positive socio-economic
outcomes through employment generation, capital investment and industry turnover. There are a
number of challenges to the development of new processing facilities and markets. Some of the major
challenges include costs of production, such as extraction and haulage of logs to a centralised facility,
the need for more detailed resource information, competition from highly competitive global product
markets, and the need for further technology developments for some products (particularly veneer and
bioenergy). There is also some risk that development of new industries, particularly a veneer industry,
may draw on resources currently supplied to sawmills and would have a negative impact on these
existing industries. In addition, an important factor is resource security – not just in terms of volume,
but the duration of the supply contract. As with a commercial venture of a fixed and technically specific
nature, sufficient security of resource access is required to underpin the investment.
Conclusion
This SEIA has highlighted potential social and economic impacts that may occur as a result of the
implementation of the Draft FMP. However, due to a number of factors, including lack of data and
unavailability of the Draft FMP, a more detailed analysis of the impacts has not been possible. It is
anticipated that further social and economic impacts may be raised through the statutory consultation
processes associated with the release of Draft FMP for public comment. It is understood that DEC and
the Conservation Commission will review submissions to revise the FMP for assessment by the
Environmental Protection Authority in 2013.

SEIA Draft Forest Management Plan 2014-2023
42908086/1/03
THIS PAGE INTENTIONALLY LEFT BLANK
SEIA Draft Forest Management Plan 2014-2023
42908086/1/03 1
1
1Introduction
The Department of Environment and Conservation (DEC) commissioned URS Australia Pty Ltd (URS)
to undertake a “Social and Economic Impact Assessment on the Potential Impacts of
Implementation of the Draft Forest Management Plan 2014-2023”. This report presents the findings
from the assessment.
1.1 Background
1.1.1 Forest Management Planning
In 1999 the Commonwealth and State Government of WA signed the Regional Forest Agreement
(RFA) for the South West Region of WA. The RFA outlined a number of changes to the way forests in
WA would be managed into the future. Subsequently, in February 2001, the then State Government
introduced the ‘Protecting our old-growth forests’ policy. This policy effectively ceased logging in old-
growth forests and created 29 new National Parks.
The Conservation Commission of Western Australia (Conservation Commission), as the vesting body,
is responsible for the preparation of a forest management plan through the agency of the Department
of Environment and Conservation (DEC). The values guiding forest management planning in Western
Australia's public native forests include nature conservation, tourism and recreation, water catchment
protection and timber production. The Forest Management Plan 2004-2013 (‘current FMP’) came into
effect on 1 January 2004 and covers management of the lands vested in the Conservation
Commission in the south-west of WA within DEC’s Swan, South West and Warren regions.
The Conservation Commission has the responsibility under section 54 of the Conservation and Land
Management Act 1984 (the CALM Act) to prepare management plans and to review expiring plans for
all land vested in it. The CALM Act requires a new forest management plan be developed every ten
years. The 10 year period follows international practice in forest management. The current FMP was
reviewed at the mid-term and end-of-term periods as a requirement under Ministerial Condition 2-2
(Ministerial Statement No. 000641, 2003), and it is expected that this arrangement will continue for the
Draft Forest Management Plan 2014-23 (‘Draft FMP’).
The FMP outlines the framework for the management of the state forest and timber reserves for the
protection of forest values and the production of timber in accordance with part V of the CALM Act and
in accordance with ecologically sustainable forest management (ESFM) principles (section 19(1)(h) of
the CALM Act. It also covers national parks, conservation parks, nature reserves,; and the
management of other lands vested in the Conservation Commission, where no current area
management plan exists.
Accordingly, FMPs provide the basis for the implementation of policies and objectives for the
management of lands vested in the Conservation Commission for a range of environmental, social
and economic uses. The Draft FMP is being developed in consultation with the community,
government agencies with an interest in the management of natural areas.
The WA Government proposes to implement the Draft FMP covering the period 1 January 2014 to 31
December 2023, thus replacing the current 10 year FMP which expires on 31 December 2013.

SEIA Draft Forest Management Plan 2014-2023
1 Introduction
2 42908086/1/03
1.1.2 Statutory requirements
Preparation of Management Plans
The Conservation Commission is required under Part V of the CALM Act as a controlling body to be
responsible for the preparation of proposed management plans for all land vested in it, whether solely
or jointly with an associated body.
Under Section 19(1)(f) and Section 60(1) of the CALM Act, the Conservation Commission is required
to submit these proposed plans to the Minister.
Public Notification
Section 57 of the CALM Act requires public notification that a proposed management plan has been
prepared, be published:
a) in the Gazette.
b) in 2 issues of a daily newspaper circulating throughout the State.
c) in 2 issues of a local newspaper circulating within the area in which the land is situated.
d) on such signs as the controlling body for that land may direct to be placed on or near the
boundaries of the land.
Public Submission
Section 58 of the CALM Act states that written submissions on the proposed management plan may
be made by any person:
a) within a period determined by the Director General [of DEC], which period shall be not less than 2
months after the day on which the notice is published in the Gazette.
b) by delivering or posting them, so that they are received within that period at an address designated
by the Director General [of DEC].
To ensure every opportunity is provided for submissions, consultation techniques will include public
information sessions which will be widely advertised, and the gathering of formal submissions both in
hard copy and via a dedicated Conservation Commission email address. An official FMP page will
also be developed on both the Conservation Commission and DEC websites.
1.1.3 Social and Economic Impact Assessment
A Social and Economic Impact Assessment (SEIA) is a “systematic analysis in advance of impacts on
the day-to-day quality of life of persons and communities whose environment is affected by a
proposed plan, program, project or policy change” (Burdge, 2004: 2). The focus of this SEIA is to
identify and, where possible, quantify the socio-economic impacts resulting from management
practices which may be implemented under the Draft FMP.
At the time of undertaking this study, the Draft FMP was not completed and was not available to URS.
DEC provided URS with a range of indicative wood volumes across timber species for the purposes of
SEIA Draft Forest Management Plan 2014-2023
1 Introduction
42908086/1/03 3
testing the sensitivity of social and economic impacts to potential future wood availability. The wood
volume provided did not include source location. An overview of management policy that may be
included within the Draft FMP was also provided (see Section 4.1). These indicative wood volumes
and policy guidance were used as the basis for this SEIA. The allowed wood volume will be included
in the final version of the FMP 2014-2023 following the period for public comment that is scheduled to
commence in August 2012 taking account of the submissions received.
The release of this SEIA report is planned to accompany the statutory consultation process on the
Draft FMP, prior to it being finalised during 2013.
1.2 Project scope (Terms of Reference)
The overarching objective of this SEIA was to examine the potential social and economic impacts,
both positive and negative, of two indicative wood volumes and management practices that could be
implemented under the Draft FMP 2014-2023. The SEIA was structured to satisfy the requirements of
a Regulatory Impact Statement (RIS) - as per the Regulatory Impact Assessment Guidelines for WA
(Department of Treasury and Finance, 2010).
The geographic boundary for the SEIA was proposed as the total area covered by the FMP. This
includes Conservation Commission vested lands in an area extending from north of Gingin to the
south coast, east of Denmark. This study has focused on areas where impacts of any change are
more likely to occur, and where they are expected to have the most effect. These are the areas
proximate to timber harvest activity and communities where forest products industries predominantly
take place and/or persons engaged in related activities live. The area of focus is defined in Section
2.2.
The study terms of reference are outlined below and refer to Sections of this report where the Terms
of Reference are addressed.
.
Terms of Reference Refer to
a) Collate and review information on the social and economic impacts
of previous land use decisions in the study area, including for the
current FMP. This will include a review of previous social and
economic impact assessment studies and a review of mitigation
programs undertaken within the region and more broadly. The
purpose of this is to provide baseline information against which to
assess potential impacts associated with implementation of the
Draft FMP 2014-2023. The period for the assessment of the
impacts is 10 years, ie the term of the FMP.
Section 3
b) Provide a regional economic profile and document and assess the
economic value and employment associated with forest-related
activities in the study area. The primary focus will be on native
forest wood resources, with a secondary focus on:
Section 5.2

SEIA Draft Forest Management Plan 2014-2023
1 Introduction
4 42908086/1/03
Terms of Reference Refer to
Other wood resources
Craftwood
Mineral resources, including known mineral resources,
prospectivity for minerals, exploration and mining tenements,
and obligations under State Agreement Acts;
Water resources;
Tourism and recreation;
Basic raw materials;
Apiculture;
Floriculture and seed industries;
Biotechnology; and
Public firewood.
c) Provide a regional social profile. This will include a review of
information on demographics and labour force characteristics in
the industry sectors listed above; the identification of stakeholders
and analysis of stakeholder issues; and a survey of forest industry
groups, their employees and key community members to develop
a profile of these industries and communities
Section 5.1
d) Assess and analyse the potential economic impact of
implementation of the Draft FMP 2014-2023, addressing the RIS
requirements, and including the direct and indirect employment
associated with each economic activity. Identify the localities
where impacts on employment may be expected and the
magnitude of these impacts. The cumulative industry impacts
across the region should also be examined. In the context of
examining effects on the native forest wood industry, factors
affecting the viability of the industry during the term of the current
FMP should be examined.
Section 6
e) Assess and analyse the potential social impact, addressing the
RIS requirements, and including the impact on selected
communities that will be affected by the Draft FMP 2014-2023. The
consultant should also explore ways by which opportunities may
be made available through implementation of the Draft FMP 2014-
2023. The analysis should include:
Section 6
Appendix B
Potential local community impacts arising from the
implementation of the Draft FMP 2014-2023. This should
include, but not be limited to, the impact on community
demographics; on community, recreation and sporting groups;
and on the demand for public services. This may well include
qualitative analysis in addition to those impacts which can be
measured quantitatively.
Section 6.3
Economic diversity and future development opportunities,
including greater use of other bole logs; changed silvicultural
practices; and forest rehabilitation, for example;
Section 6.1

SEIA Draft Forest Management Plan 2014-2023
1 Introduction
42908086/1/03 5
Terms of Reference Refer to
Community capacity and resilience to absorb and benefit from
change (principally in terms of employment opportunities);
Section 6.3
Ways to mitigate potential impacts and optimise outcomes at
local levels in all sectors.
Section 6.1.1
f) The current FMP permits harvest of first and second grade jarrah
sawlogs of 131,000 cubic metres per annum (cmpa), and for first
and second grade karri sawlogs the figure is 54,000 cmpa. There
is also available 534,000 cmpa of other bole jarrah logs, 160,000
cmpa of other bole karri logs as well as 196,000 cmpa of marri
logs. In determining the social and economic impacts of potential
changes to these volumes in all sectors listed in 2. above, the
consultant shall include examination of the impacts of utilisation of
the other bole log volumes. To determine the range of indicative
wood volumes for first and second grade logs which are to be
examined in identifying the social and economic impacts, the
consultant shall obtain community and industry input, and shall
agree on a range of possible scenarios with the DEC and the
Conservation Commission.
Section 6.1
Appendix E
g) As part of the examination of any potential economic and social
impacts, the consultant shall, in discussion with DEC and the
Commission, determine whether those impacts are the result of
government policy initiatives or as a result of external factors such
as a drying climate.
Section 6.2
1.3 Structure of this report
The report has been structured according to the requirements of the study and is shown in Table 1-1.
Table 1-1 Report structure
Section Description
1 Provides an introduction to the background to the FMP and the project scope
2 Provides an overview of the approach taken to conducting the socio-economic impact
assessment
3 Provides an overview of the current FMP (2004-2013)
4 Provides an overview of the forthcoming Draft FMP (2014-2023)
5 Provides a baseline assessment of the communities affected by the FMP, incorporating
economic and social data
6 Provides an assessment of the socio-economic impacts of the Draft FMP scenarios
7 Provides the conclusions from this SEIA

SEIA Draft Forest Management Plan 2014-2023
42908086/1/03
THIS PAGE INTENTIONALLY LEFT BLANK

SEIA Draft Forest Management Plan 2014-2023
42908086/1/03 7
2
2Approach
This study involved a desktop review of available data, an industry and stakeholder consultation
process, and an analysis of findings. The desktop review used historical and current production data,
employment data, and regional statistics and documentation specific to implementation of the FMP.
The stakeholder consultation was undertaken in the primary wood production regions and in the Perth
metropolitan area.
2.1 RIS requirements and context applied to this study
The project scope required the assessment of the socio-economic impact of the Draft FMP to be
consistent within Regulatory Impact Statement (RIS) requirements. A RIS is required for regulatory
proposals that are identified as having a significant negative impact on business, consumers or the
economy. The RIS process aims to ensure that the costs of regulatory instruments are properly
considered and broad consultation undertaken, beyond the interest group directly affected by the
change. The FMP is such a regulatory instrument.
The RIS requirements are set out in the Regulatory Impact Assessment Guidelines (2010), and entail
that a number of elements are addressed when undertaking impact assessments and consultation in
relation to a given change to regulation. These elements are summarised in Box 2-1.
Box 2-1 RIS requirements
Source: DTF 2010
The guidelines recommend that the extent and detail of a RIS, and its associated consultation, should
be commensurate with the magnitude of the policy issue that the proposal aims to address, and the
Impact assessment:
Identify the groups in the community (i.e. individuals, Government including local government,
business and consumers) likely to be impacted and specify the impacts
Identify and discuss the economic, environmental, social justice, health, equity and other
relevant impacts
Identify and discuss, where relevant, the implications on inter-jurisdictional trade in goods and
services and mutual recognition issues
Detail both costs and benefits for each viable option, making use of quantitative information
where possible, or otherwise qualitatively through objective discussion
Analyse the extent to which each option achieves the policy objectives
Ensure the impact analysis is supported by an acceptable level of evidence
Discuss the implications for competitive neutrality, if relevant; e.g. if the project involves a
Government owned (or part owned) entity operating in competition with the private sector
Consultation:
Outline the consultation objectives and methodology
Provide details as to how and where submissions may be made, giving adequate timeframes for
responses
Identify likely target groups to be consulted
Request feedback from affected parties on the impacts of the various options, and their
identification of additional feasible options not already outlined in the Consultation RIS

SEIA Draft Forest Management Plan 2014-2023
2 Approach
8 42908086/1/03
size of the potential negative impacts of the proposal. The impacts of the FMP will have an effect on
market function in that it ‘alters or limits’ the way that commercial businesses function through
implementing actions that control the volume and location source, that is, the allocation of resources,
of native forest for timber harvesting.
Specific guidance is given for the conduct of a consultation RIS as shown in Box 2.2 below.
Box 2-2 Consultation RIS – from Regulatory Impact Assessment Guidelines
Source: DTF 2010
In undertaking this assessment of the Draft FMP, URS has developed an approach that is based on
the RIS requirements and consistent with the potential magnitude of the impacts.
Further consultation
As described in Section 1.1 the Draft FMP is being prepared by the Conservation Commission through
the agency of the Department of Environment and Conservation. The Draft FMP will be advertised
concurrently under the CALM Act and Environmental Protection Act 1986 (EP Act)1. The CALM Act
provides for the public to be notified that a proposed management plan has been prepared and for
written public submissions to be made by any person regarding proposed management plans within a
period that is not to be less than two months after the day that written notice is published in the
Government Gazette.
This SEIA will accompany the Draft FMP when it is made available for public written submissions by
the Conservation Commission.
Monitoring and Evaluation of the FMP 2014-2023
The current FMP includes protocols for 33 Key Performance Indicators (KPI). These performance
indicators were developed to assess the effectiveness of the plan in meeting its objectives and to
measure progress towards the implementation of its proposals.
1 See http://www.dec.wa.gov.au/component/option,com_docman/task,doc_download/gid,7029/Itemid,/ for further information
The Consultation RIS is the first stage of the RIS process. The Consultation RIS outlines the policy
issue to be addressed and defines it as being due to market failure, regulatory failure or
unacceptable risk. The Consultation RIS explains the objectives for resolving the issue, outlines the
current regulatory environment and its effectiveness, proposes options to address the policy issue
(including non-regulatory options where possible or explain why these are not applicable, and
consideration of other jurisdictions’ best practice approaches), and sets out the agency’s early
understanding of the impacts of the options.
The Government's commitment to the RIS process is intended to encourage ongoing, targeted and
informal consultation with stakeholders or interested parties, and the community as a whole, where
considered appropriate. All consultation undertaken by agencies as part of the policy and
regulation development should be identified in the Consultation RIS and also reflected in the
Decision RIS.

SEIA Draft Forest Management Plan 2014-2023
2 Approach
42908086/1/03 9
The Montreal Criteria for sustainability were considered a suitable framework for developing
performance indicators. They are grouped according to the following criteria:
the conservation of biodiversity;
the maintenance of productive capacity;
the maintenance of ecosystem health and vitality;
the conservation and maintenance of soil and water;
the maintenance of heritage;
the maintenance of socio-economic values; and
plan implementation.
The indicators were designed to measure any or all of the three elements of a management issue.
These elements are:
the condition of the subject under consideration;
the pressure(s) that might be affecting the subject; and
the response to those pressures by management.
Principles are necessary to select the most appropriate ‘key' performance indicators. The principles
used for the plan will relate to their capacity to:
represent community concerns;
operate at a range of scales;
satisfy other reporting requirements;
measure critical elements necessary for adaptive management; and
balance the provision of environmental and socio-economic benefits.
The Draft FMP will continue to include provision for the monitoring and evaluation of its
implementation.
2.2 Defining the study area, communities and industries
2.2.1 Study limitation
This “Social and Economic Impact Assessment on the Potential Impacts of Implementation of the Draft
Forest Management Plan 2014 – 2023” was prepared with a number of limitations. At the time of
undertaking this study, the Draft FMP was not finalised. URS was required to use a range of indicative
wood yield volumes across timber species, location scenarios, and an overview of the management
policy options to assess potential impacts of the Draft FMP. This study is concerned with native forest
timber and related industry and does not consider the hardwood or softwood plantation sectors.
Consultations with stakeholders could only be undertaken at a level offered by the indicative range of
wood yields offered for discussion. While it has been possible to make a judgement about potential
social and economic impacts over the considered range of indicated wood volumes, not all potential
impacts or their location may have been identified or comprehensively assessed, as the details of the
Draft FMP were not available.
A key issue is that the viability of sawmilling is a function of input volume, log quality and log supply
cost. These factors are strongly inter-related, and knowledge of each is required to determine the full
impact of change of either factor. The information provided, as an indication of the Draft FMP, only

SEIA Draft Forest Management Plan 2014-2023
2 Approach
10 42908086/1/03
considers input volume and therefore only part of the viability equation facing native timber sawmilling
and related industries, and consequent impacts to associated communities.
As a result of only having indicative information describing the details of Draft FMP, the consultants
have endeavoured to focus on likely impacts to key elements of the native forest products industry,
and key communities associated with native forest industry employment. Details associated with
adjustments that may be made to management that might affect log quality and cost, have had to be
inferred.
Where sufficient operational information was not available, potential impacts may have been identified
but not comprehensively assessed. It is anticipated that the period for public comment will identify
further social and economic impacts and we recommend DEC investigate these.
2.2.2 Study area
The FMP covers lands vested in the Conservation Commission in the south west region of Western
Australia that extends from the Shire of Gingin, north of Perth, to the Shire of Denmark on the south
coast. In line with the RIS Guidelines referred to above, this study has focused on the areas of most
significant impact being those with a forest products industry presence and broadly corresponding to
the wood supply zones as shown in Figure 2-1 below.
For the purposes of this study, DEC has advised that wood supply is to be considered in two broad
areas. To the north of the Preston River, which incorporates the supply zones of ‘Northern’ and
‘Mornington’, are the ‘northern forests’. To the south of the Preston River, aligning with the supply
zones of ‘Greenbushes’, ‘Sunklands’, ‘Nannup’ and ‘Southern’, are the ‘southern forests’. References
to the ‘northern’ or ‘southern’ forests in this document follow the above description.
The local government areas (LGA) in the study area with the highest percentage of the total workforce
involved in the forest products industry are: Nannup, Manjimup, Bridgetown-Greenbushes, and
Donnybrook-Balingup. At the time of completing this report, industry of employment data was not
available from the 2011 census. Data from the 2006 census indicates that the ‘urban centre locality’ of
Nannup had 18.8% of employed persons aged 15 years and over employed in ‘log sawmilling and
timber dressing’; Greenbushes recorded 14.2% and Manjimup 5.9% employed in the same industry.
While the LGAs of Bunbury and Perth have the highest number of people employed in the forest
products industry, the size of the industry workforce in these areas is a small proportion of the total
(Schirmer 2008).
In determining the study area, the SEIA's objectives were to define the area that may experience most
of the social and economic impacts and for which socio-demographic information is available. The
SEIA has defined three study areas: immediate, regional and state.
In the case of the FMP, the immediate study area comprises the LGAs of Manjimup, Nannup,
Donnybrook-Balingup and Bridgetown-Greenbushes. Australian Bureau of Statistics collects and
publishes information at this geographic level.

SEIA Draft Forest Management Plan 2014-2023
2 Approach
42908086/1/03 11
Figure 2-1 Supply zones within State forest and timber reserves

SEIA Draft Forest Management Plan 2014-2023
2 Approach
12 42908086/1/03
The regional study area was defined as the region beyond which it was unlikely that social impacts
and opportunities would be experienced. The regional area of interest is the South West – an area
defined by the Department of Regional Development and Lands (DRDL) as that ‘corner’ of the State
stretching from Yarloop in the north to Walpole on the south coast. The state study area is Western
Australia.
Further, the study was required to consider DEC log supply regions based on two zones: “north” and
“south” of the Preston River (i.e. the ‘northern forests’ and ‘southern forests’). To undertake analyses
using published statistical data, this study has aligned appropriate LGAs to these zones. The key
LGA’s which encompass the majority of the indicated supply zones, and those that encompass the
major and majority of native forest based industries, are shown in Table 2-1.
The northern and southern forests indicate the coverage of potential log supply, and the highlighted
LGAs (**) show LGAs where native forest industries are an integral part of the local economy, and
provide a significant portion of local employment and are considered as areas of immediate impact as
described further in Section 5. That is, the industries are relatively important at the local scale, but they
may be somewhat less important at a state scale.
Table 2-1 Defining the project study area
Key LGA Northern
Forests
Southern
Forests
** Bridgetown-Greenbushes
Busselton
Collie
** Donnybrook-Balingup
Harvey
** Manjimup
Murray
** Nannup
Serpentine-Jarrahdale
2.3 Community profiles
The community profile includes key demographics, health services, education and other facilities
available, and the key economic indicators. The profile provides a snapshot of a community in order to
facilitate understanding of how and to what extent it may be impacted by the implementation of the
FMP.
The information in the community profile was sourced primarily from the Australian Bureau of Statistics
Census of Population and Housing 2011. Where these data have not been available, the study has
used 2006 data. Other information was sourced from publicly available information provided by State
and Federal Government agencies, local government and other internet based resources. Information
sources are referenced in text.
Community profiles are provided in Section 5.

SEIA Draft Forest Management Plan 2014-2023
2 Approach
42908086/1/03 13
2.4 Industries considered
The primary focus of this assessment is the forest products industry, comprising primary and
secondary processors and harvest and haulage contractors. However, there are a number of other
industries that rely on, or take place in forests, but are not associated with timber harvesting. These
include:
Craftwood;
Tourism and recreation;
Basic raw materials extraction (e.g. gravel, sand, etc under the CALM Act);
Apiculture;
Floriculture and seed industries;
Biotechnology;
Commercial firewood collection;
Water resources; and
Mineral resources.
For most of these industries, quantitative data on the industry size, employment and value is difficult to
obtain. Where this has not been possible, a qualitative description of the industry is provided in this
report.
The aim of the study has been to assess the social and economic impact of the Draft FMP on these
industries, including the direct and indirect employment impacts.
The study has not considered the social and economic impact of any possible compensation
payments that might be paid as a result of any change in wood volume allowed to be harvested under
the Draft FMP.
2.5 Stakeholder consultation
Consultation was undertaken to obtain the views of stakeholders who may potentially be socially
and/or economically affected by the Draft FMP. These stakeholders were identified with the assistance
of DEC and comprised the following broad categories:
Sawmill operators;
Harvest and haulage operators;
Secondary processors;
Industry groups;
State agencies,
Local government authorities;
Community groups;
Environmental non-government organisations (ENGO);
Regional development commissions; and
Peak industry body groups.
Consultation discussions with stakeholders were guided by an interview schedule comprising a set of
semi-structured interview questions. Interviews were conducted in person and by telephone.
Consultation participants and questions are included in Appendix A and Appendix B.
Generally, stakeholders were asked to describe their circumstances under the current FMP, any
impacts experienced with the implementation of the current FMP, and potential impacts that might

SEIA Draft Forest Management Plan 2014-2023
2 Approach
14 42908086/1/03
result with the implementation of the Draft FMP. Stakeholders were asked to consider the impact
according to two broadly defined settings: a continuation of the existing situation corresponding to an
upper indicative wood volume, or alternatively, a situation where the wood production volumes were
decreased, corresponding to a lower indicative wood volume.
The responses received during the consultation were used to inform the assessment of the Draft FMP
and are contained throughout the report and also in Appendix A.
2.6 Data sources
In addition to stakeholder consultation noted above, the baseline assessment has drawn on secondary
data from the following sources:
Australian Bureau of Statistics (ABS): National regional profiles, basic community profiles, State
Accounts,
State Government publications and statistics; and
assorted industry-specific publications.

SEIA Draft Forest Management Plan 2014-2023
42908086/1/03 15
3
3Background: Forest Management Plan 2004 - 2013
Key to assessing the potential impacts of the proposed Draft FMP, is to learn from the history of the
extent of change and impacts that occurred with the implementation of the current FMP, subsequent
to the release of the then Government’s Protecting our old-growth forest policy. The changes that
have resulted in the current state of native forest-associated industries and their communities should
provide valuable information regarding the viability, and strength of these industries, and their capacity
to survive, thrive or struggle with the implementation of Draft FMP.
3.1 Government policy in the forests
Significant adjustment in the forest industry, commenced with establishment of the RFA between the
Australian and WA Governments. The three main objectives of the RFA process were to:
protect environmental values in a world class system of national parks and other reserves, based
on nationally agreed criteria;
encourage job creation and growth in forest-based industries, including wood products, tourism and
minerals; and
manage all native forests in a sustainable way.
Implementation of the RFA in WA substantially increased the conservation reserves in the WA forests,
and sought to promote industry development to help forest-based industries build on RFA certainty to
explore new opportunities in value adding and local manufacturing, as well as boost tourism
development in the region.
In February 2001, the then WA Government fulfilled an election promise and ended logging in all old-
growth forest vested with the Conservation Commission and began a process of creating the
conservation parks and national parks proposed in the Protecting our old-growth forests policy,
including new national parks promised under the WA Regional Forest Agreement.
As a result of these policy initiatives, in the current FMP, the annual contracted level of jarrah sawlog
cut and annual level of karri sawlog cut were reduced by 73 cent below pre-1994 levels.
3.2 Forest Management Plan 2004-2013
The current FMP replaced the FMP 1994-2003 and parts of the 1987 Northern Forest, Central Forest
and South Forest Regional Management Plans. At that time the current FMP integrated the then
Government’s Protecting our old-growth forest Policy and integrated, with some minor amendment,
the Montreal Criteria for Sustainability.
The current FMP, introduced in 2004, represented a shift from previous management plans in that it:
set aside old-growth forest from timber harvesting;
proposed the establishment of thirty new national parks and two new conservation parks;
significantly reduced the area of forest available for timber harvesting;
provided management objectives and strategies and set them at ‘whole of forest’, landscape and
operational scales;
considered commercial timber harvesting operations separate from forest management;
was framed in line with the principles of ecologically sustainable forest management;
provided key performance indicators and formalised ongoing monitoring of the FMP; and

SEIA Draft Forest Management Plan 2014-2023
3 Background: Forest Management Plan 2004 - 2013
16 42908086/1/03
provided greater opportunity for public involvement in the preparation and delivery of the FMP2.
The current FMP3 covers the management of the following land categories:
indigenous State forest and timber reserves, including State forest to be classified as a forest
conservation area through section 62(1) of the CALM Act, and
State forest and timber reserves planted with exotic species. The application of the FMP to these
areas is limited to specific activities labelled for plantations, and
the FMP recognises the whole of forest context and the role of the formal reserve system in the
development of the management proposals, hence also covers nature reserves, national parks,
conservation parks and other land referred to in section 5(1)(g) and (h) of the CALM Act that
(generally) has or includes a conservation purpose. The priority for the management of these areas
is the maintenance of biodiversity and they are not available for wood production but may be
available for other uses such as wildflower picking, apiculture or craftwood. Where management
plans exist for areas within the FMP area, the FMP generally defers to them.
However, freehold land held in the name of DECs Executive Director that contains indigenous
vegetation, while not vested in the Conservation Commission, is taken into account in the plan
because its productive capacity contributes to the sustained yield of native timber.
The overall objective described in the current FMP is for ‘biodiversity to be conserved, the health,
vitality and productive capacity of ecosystems to be sustained, and the social, cultural and economic
benefits valued by the community to be produced in a manner taking account of the principles of
ecologically sustainable forest management’ (Page 7). It seeks to achieve objectives according to
seven Montreal criteria: biological diversity, productive capacity, ecosystem health and vitality, soil and
water, global carbon cycles, natural and cultural heritage and socio-economic benefits4. The following
gives an indication of how the current FMP proposes certain actions in each of the criteria, in this case
‘biodiversity’.
Biological diversity
The plan proposed a number of Actions at the whole of forest scale for the purpose of:
seeking to conserve biodiversity and seeking to conserve self-sustaining populations of native species
and communities, and at the landscape scale for the purpose of seeking to allow for the recovery of
biodiversity between one timber rotation and the next.
seeking to conserve biodiversity and ecological integrity in all native forest ecosystems through the
establishment and management of a system of reserves that is comprehensive, adequate and
representative.
seeking to complement the function of the formal reserve system in the conservation of biodiversity.
The plan established informal reserves and proposed a number of Actions at the operational scale for the
purpose of seeking to conserve biodiversity outside of formal reserves and forest conservation areas.
The plan proposed Actions at the landscape scale for the purpose of seeking to conserve biodiversity
through a diverse representation and distribution of forest structures and understorey seral stages
through time.
2 The Draft FMP also allows for increased public involvement in preparation and delivery.
3 These same land categories apply to the Draft FMP.
4 Objectives are also described for Plan Implementation which is not considered here.

SEIA Draft Forest Management Plan 2014-2023
3 Background: Forest Management Plan 2004 - 2013
42908086/1/03 17
The plan proposed Actions for the purpose of seeking to promote integrated management across all land
categories at the whole of forest, landscape and operational scales.
The plan proposed Actions at the landscape scale for the purpose of seeking to prevent any species
moving to a higher category of threat or, in particular, declining to irretrievably low levels as a result of
management actions
The plan proposed Actions at the landscape scale for the purpose of seeking to protect, and assist the
recovery of, threatened and priority species of flora and fauna and ecological communities.
The plan proposed Actions at the whole of forest scale for the purpose of seeking to develop an improved
understanding of the biodiversity of forest regions and the response of forest ecosystems to natural and
human induced disturbance, with a view to improving forest management practices. (Sourced from the
FMP 2004-2013, pages 23-30)
In terms of productive capacity, the current FMP defined a number of actions to maintain the forest
area by limiting loss from development, the construction of infrastructure such as roads and other
utilities, or through mineral resource activity. Rehabilitation of certain areas was also a high priority.
The current FMP also sets out the allowed volumes for wood production from areas available for
timber harvesting. This includes the sustained yields for first and second grade jarrah and karri
sawlogs5(see Table 3-1).
Table 3-1 Sustained yield volumes (cubic metres) of first and second grade sawlogs for principal timber species (current FMP)
Species Log grade
Average annual yield
for 10 years (m3)
Approximate level of average annual woodflow
by forest region (m3)
Swan South West Warren
Jarrah First and second 131,000 39,000 73,000 19,000
Karri First and second 54,000 2,000 52,000
Source: FMP 2004-2013
The woodflow from each forest region may vary between years depending on the mix of forest made
available in annual harvest plans to identify areas of native timber forest scheduled for harvesting, in
line with the current FMP.
In the course of harvesting jarrah and karri sawlogs, lower grade logs are obtained from the boles of
trees felled to obtain the first and second grade jarrah and karri sawlogs. Lower grade logs are also
obtained from trees, including marri, that are allowed to be removed in order to facilitate regeneration,
or growth of retained crop trees. Lower grade logs are also available from some thinning of the forest,
which typically produces a low percentage of sawlogs. These lower grade logs are referred to in the
current FMP as ‘other bole logs’.
Table 3-2 shows the sustained yield of other bole logs that were available under the current FMP.
5 First and second grade sawlogs are jarrah logs of a minimum length of 2.1 m with a small end diameter of 200mm and a
minimum of 30% millable timber on the worst end face and karri logs of a minimum length of 2.1 m with a small end diameter of 200mm and a minimum of 30% millable timber on the worst end face.

SEIA Draft Forest Management Plan 2014-2023
3 Background: Forest Management Plan 2004 - 2013
18 42908086/1/03
Table 3-2 Average annual yield of native forest timber available under current FMP 2004-2013 (m
3/annum) – Current FMP
Jarrah Karri Marri Total
Other bole logs 534,000 117,000 196,000 890,000
Source: FMP 2004-2013
Furthermore, the current FMP recognised that State forest and timber reserves also supply other
forest produce such as firewood, burls, craftwood, wildflowers, seeds and honey. There was an
acknowledgement that the supply and demand for this produce was not well understood but a number
of actions were included for the purpose of seeking to ‘manage the removal of forest produce, other
than sawlogs and other bole logs, in a manner that, so far as is practicable and sustainable, satisfies
public demand for that produce’ (Page 36).
One other performance area noted in the current FMP is worth mentioning in this SEIA. In terms of
socio-economic benefits, the current FMP refers to ‘jobs, wages, profits and tax revenues from
producing and consuming forest-related goods and services; user benefits associated with the
opportunity to participate in outdoor recreation and tourism; environmental benefits such as clean air
and water; and benefits that satisfy the social and spiritual needs of society’ (Page 57).
Within the social and economic benefits section, the current FMP provides management actions for
the provision of a range of goods and services from forest areas: water; minerals and petroleum;
recreation; timber and non-log timber products (as through bee-keeping, wildflowers and seeds); basic
raw materials; visual amenity; forest leases; and genetic resources for the development of medicines,
for example. However, the key performance indicators included to track performance towards
delivering socio-economic benefits from the key economic uses of the land relate to tourism/recreation
and basic raw material supply.
3.3 Impacts of past land use decisions
3.3.1 Declining resource availability
First and second grade sawlogs
The implementation of the current FMP resulted in a decline in availability of first and second grade
sawlogs, from around 550,000 m3 p.a. in the late 1990s to current (combined jarrah and karri) levels of
185,000m3 p.a.
Figure 3-1 shows the decline in actual harvest volumes from 1998 to 2003 and the sustained yield for
first and second grade sawlogs specified in the current FMP.

SEIA Draft Forest Management Plan 2014-2023
3 Background: Forest Management Plan 2004 - 2013
42908086/1/03 19
Figure 3-1 Harvest volumes of first and second grade sawlogs (m3/
yr)
Source: FPC (provided to URS in 2008)
Figure 3-2 shows the forecast annual supply between 2004 and 2049 (average of five year period) of
jarrah sawlogs by supply zone. This supply forecast is based on modelling undertaken by DEC in
2003. Karri is entirely supplied from the southern forests.
Figure 3-2 Annual (average of five year period) forecast supply of jarrah sawlogs by supply zone – 2003 forecast
Source: DEC (2011)

SEIA Draft Forest Management Plan 2014-2023
3 Background: Forest Management Plan 2004 - 2013
20 42908086/1/03
3.3.2 Shifting supply and decreasing log size
In recent years there has been a shift in the location of jarrah sawlog supply, with an increasing
proportion of the resource being sourced from the northern forests comprising the DEC supply zones
known as ‘Northern’ and ‘Mornington’ (see Figure 2-1). In 2012, the northern forests are yielding 56%
of all jarrah sawlogs, compared to the original DEC forecast produced in 2003 for the 2009-2014
period, of 51% (Table 3-3). This has had implications for log size, log quality and the cost of delivering
to the sawmills (discussed below).
Table 3-3 Current distribution of jarrah sawlog supply versus modelled projections by supply zone
Northern Mornington Nannup/
Sunklands
Greenbushes Southern Total
North
Total
South
Total
Forecast for
2009-20141
27% 24% 16% 18% 15% 51% 49% 100%
2012 actual 28% 28% 22% 2% 19% 56% 44% 100%
Source: FPC pers. comm. (12 March 2012) 1 DEC forecast developed in 2003
The southern forests (i.e. the supply zones of ‘Greenbushes’, ‘Nannup’, ‘Sunklands’ and ‘Southern’,
located south of the Preston River) have the highest proportion of larger jarrah logs, while jarrah logs
in the northern forests are, on average, smaller in diameter. Forests in the south of WA have generally
only been cut-over once since harvesting began and still have a significant proportion of larger logs. In
contrast, northern forests have been cut-over several times and wood production is mostly based on
the harvesting of regrowth forests.
Since the implementation of the current FMP, there has been a trend of declining log size and average
log quality. Figure 3-1 provides estimates by DEC of changes in large end diameter under bark
(LEDUB) between 1995-2001 and 2002-2005 for first and second grade jarrah sawlogs. It illustrates a
clear declining trend in the volume of larger logs, particularly for 50-60 cm and 60-70 cm diameter logs
in areas south of the Preston River. There is a similar trend for logs north of the Preston River. In both
forest regions there are also significant increases in the volume of logs with smaller LEDUBs,
particularly in 20-30 cm and 30-40 cm diameter classes.
Figure 3-1 Changes in jarrah log diameters between 1995-2001 and 2002-2005
Source: DEC (2008)

SEIA Draft Forest Management Plan 2014-2023
3 Background: Forest Management Plan 2004 - 2013
42908086/1/03 21
Other bole logs
At present, a large proportion of the available jarrah and marri other bole log volume is not utilised due
to lack of markets for this resource. Over the past five years, the annual harvest of jarrah ‘other bole
logs’ has been around 120,000 m3, out of a total allowable cut of 534,000 m
3 p.a. The karri ‘other bole
log’ volume has been sold mostly as export woodchip.
3.3.3 Forest products industry restructuring and adaptation
The WA forest products industry has undergone significant change in the last decade as a result of the
declining resource availability and decreasing log size (and average log quality) described above. The
number of sawmills with contracts to process first and second grade sawlogs has declined from more
than 40 in 2001 to around 17 in 2012. This contraction of the sawmilling sector is largely due to
reductions in the volume of available sawlogs, although other factors such as market forces, increased
log costs (harvest and haul costs rose and stumpage prices increased by 25% in 2004) ,strong
competition from imports and increased supply chain costs are also likely to have played a role.
Some of the sawmills that have remained in the industry, particularly the larger sawmills, have
invested in new equipment and value adding technology to adapt to the changes in the quality and
quantity of resource available under the current FMP, and to maximise the value that can be derived
from the resource. Some sawmills now receive their contract volumes as bole sawlogs6, rather than
first and second grade sawlogs, and these sawmills have made adjustments over the last decade to
enable them to process and find markets for lower quality logs. Figure 3-2 shows the shift in harvest
and supply of bole sawlogs from first and second grade jarrah sawlogs. FPC has reported that a
higher level of log utilisation may be achieved if logs are cut as bole sawlogs7.
Figure 3-2 FPC jarrah sawlog harvest volumes
Source: FPC Annual Reports 2005 to 2011
6 Bole sawlogs are defined as a log cut from the bole of a tree that is below second grade sawlog specifications.
7 Regulation continues to be on the basis of 1
st and 2
nd grade sawlogs and the bole volume is equated by DEC to the equivalent
1st and 2
nd grade sawlog, where necessary.

SEIA Draft Forest Management Plan 2014-2023
3 Background: Forest Management Plan 2004 - 2013
22 42908086/1/03
Whilst sawmills have adapted to changes in the resource, they will require a minimum log throughput
quantity, quality and cost to remain viable. Reductions in log volumes supplied to sawmills, following
the current FMP, has resulted in many of the large mills operating below their capacity, and the fixed
costs associated with plant and equipment are being spread over a lower volume. In addition, the
trend of declining log size and average quality has resulted in lower timber recovery rates by sawmills.
Increases in end product prices for jarrah and karri and processing investments have generally not
been sufficient to compensate for the increased log costs (incorporating log stumpages plus harvest
and haulage costs) and lower timber recoveries. These factors have adversely affected the financial
viability of some sawmill businesses.
Sawmills pay for logs on a ‘cost plus’ basis. This means that they pay a set stumpage cost based on
log grade and size, plus the cost to deliver the log from the forest to the sawmill. Therefore, the
location of sawlog resources relative to the location of sawmills impacts on the cost of log transport
and hence the ultimate cost of delivered logs to customers.
The location of major sawmills is mostly in the south of the FMP area, while over the period of the
current FMP, jarrah sawlog have increasingly been sourced from northern forests and transported to
mills in the south. This has led to increases in the haulage distance of logs to sawmills and, thus, to
associated transport costs. This has contributed to increased delivered log costs. Per unit harvest and
haul costs have also increased over this period as a result of lower yields per hectare harvested and
smaller logs, increasing fuel, labour and other costs, and this has also contributed to higher delivered
log costs.
The decline in the volume, size and quality of logs harvested from native forests will continue to pose
a challenge for processors.
3.3.4 Social and economic impacts of previous land use decisions
3.3.4.1 Economic effects
In August 2005, the Auditor General provided a report to State Parliament on the Administration of
Protection of Old Growth Forest Policy Funding Programs (AGWA, 2005). These programs were
initiated by the then Gallop Government to mitigate any negative social and economic effects
associated with the introduction of the Policy and implementation of the current FMP. The program
included a $161 million industry assistance program comprising Business Exit Assistance of $74
million to compensate sawmills and associated industries leaving the industry as a result of the
reduced timber allocation; a Workers Assistance Program of $27.3 million to assist workers made
redundant as a result of the policy, with redundancy payments, training assistance, wage subsidies,
relocation assistance, mortgage and rent assistance, and job search assistance, as well as additional
mitigation strategies to enable certain mills to move into higher value adding use of timber, such as
furniture making, and attract non-timber industry to the affected areas.
The Auditor General’s report noted there were 716 displaced workers, 79 per cent of whom found
employment elsewhere (64 per cent full time, seven per cent part time, four per cent casual and 25 per
cent self-employed). Eighteen per cent of displaced workers left the workforce altogether and three
per cent remained unemployed. The Shire of Manjimup has suggested that “most of those who
received Business Exit Assistance or Workers Assistance Program money simply left the district, with
many heading towards the coast. The two programs therefore benefited individuals directly affected
but failed the local community demonstrably” (Shire of Manjimup Council Minutes, 8 December 2011).

SEIA Draft Forest Management Plan 2014-2023
3 Background: Forest Management Plan 2004 - 2013
42908086/1/03 23
The Shire of Manjimup has been critical in their analysis of the delivery of assistance offered by the
Labor Party in their 2001 election commitments and subsequent to their election. The Shire analysis
suggests that not all of the commitments made have been implemented and this has left the
administration and wider community circumspect about offers for financial or policy assistance should
the forest products industry be further negatively impacted by the next FMP (see Appendix C)
The Shire of Manjimup further notes:
WA’s native hard wood furniture manufacturers not only failed to relocate to Manjimup, many failed
altogether and no longer exist with manufacturing moving offshore. Similarly, there are few (sic) fine
wood product producers/retailers today than there were in 2001. Forest based eco-tourism never
eventuated and visitor numbers for Manjimup and Pemberton declined over the 10 years to be 12.5%
lower than they were in 2001 before forest industry restructuring (Shire of Manjimup Council Meeting
Minutes 8 December 2011).
3.3.4.2 Social effects
During the consultations for this SEIA a number of stakeholders referred to the significant impacts that
were experienced following the implementation of the current FMP and introduction of the Protecting
our old-growth forests policy. The job losses referred to above created a high level of uncertainty and
anxiety in the key communities, particularly Manjimup and Nannup. One stakeholder who was living in
Manjimup at the time referred to the difficulty she had in selling her home because there was no buyer
demand and the value of the property had reduced substantially. The same stakeholder noted that the
primary schools in Nannup saw a drop in enrolments as couples in the town deferred their decisions to
start and raise a family because of the economic uncertainty. There was some concern that if birth
rates declined again that the community may lose its school.
The impacts of the industry restructuring were felt across the communities by those directly and
indirectly affected. One member of the school community noted that mass redundancies and loss of
businesses brought upheaval to families and created tensions within the community. There was, she
said, “feelings of animosity and resentment between neighbours and there is still an ‘us’ [timber
workers] and ‘them’ [non-timber workers] mentality”. Further, this stakeholder stated that the children
of those made unemployed were badly affected by the general feelings of anxiety and disruptions in
the family home. (Community stakeholder, 2012, pers. comm.)
It is evident that the major changes that occurred in the early 2000s had a major effect at the local
community level but it is not considered that changes proposed in the Draft FMP will lead to anything
like the same level of change.

SEIA Draft Forest Management Plan 2014-2023
42908086/1/03
THIS PAGE INTENTIONALLY LEFT BLANK

SEIA Draft Forest Management Plan 2014-2023
42908086/1/03 25
4
4Next Forest Management Plan 2014 - 2023
4.1 Indication of Draft 2014-2023 FMP
At the time of undertaking this study the Draft FMP was not finalised and URS has not been provided
with the Draft FMP for review. In May 2012, URS was provided with a range of indicative wood
volumes across timber species for the purposes of testing the sensitivity of social and economic
impacts to potential future wood availability. The wood volume provided did not include source
location. An overview of management policy that may be included within the Draft FMP and views
about possible impacts was also provided by DEC for the purpose of focusing investigations into key
areas. Also, modelling of sustained timber yields was still in progress and proposed volumes had not
been determined. Guidance was provided by DEC as to the potential impacts on forest based activity
of the Draft FMP for the purpose of focusing investigations into key areas.
URS has used the following indicative wood volumes and suggested possible impacts on other forest
based activity, in preparing this impact assessment. Note that subsequent to commencing this SEIA,
URS was advised that the volumes to be presented in the Draft FMP may be somewhat different.
4.1.1 Forest products
An indicative range of wood volumes, potentially available from the northern (that is, north of the
Preston River) and southern (south of the Preston River) forests, was provided to URS by DEC. This
provided an upper volume scenario generally involving an increase in the wood volume across
species and log classes, relative to the current FMP; and a lower volume scenario involving an overall
reduction in the wood volume. Table 4-1 presents a summary of the indicative wood volumes across
timber species and the two supply regions.
Table 4-1 Indicative volume of wood potentially available during FMP 2014-2023
Geographic area1
Volume wood (‘000 m3 per annum)
Jarrah sawlog
Karri sawlog
Jarrah other bole
Karri other bole
Marri bole
log
Upper indicative wood volume
Northern 80 - 230 - 60
Southern 60 60 280 - 140
Total 140 60 510 170 200
Per cent of current FMP 2004-2013 107% 111% 96% 106% 102%
Lower indicative wood volume
Northern 58 - 145 - 50
Southern 47 50 110 120 100
Total 105 50 260 120 150
Per cent of current FMP 2004-2013 80% 93% 49% 75% 77%
Current FMP Total 131 54 534 160 196
1 The Northern area comprises the former Northern and Mornington FPC supply zones, while the Southern comprises the
former Nannup, Sunklands, Greenbushes and Southern FPC supply zones.

SEIA Draft Forest Management Plan 2014-2023
4 Next Forest Management Plan 2014 - 2023
26 42908086/1/03
Predicted changes in climate will have implications for the future of the forest products industry
(ABARES, 2011b). Increased carbon dioxide has been shown to increase growth rates and water use
efficiency of plants. However, climate change projections suggest reduced rainfall and a possible
increase in extreme events such as drought and/or the number of hot days. The changes in climate
could potentially reduce growth rates and may increase the incidence of pests, diseases and bushfires
(Maher et al, 2010).
Although wood production is a long time horizon activity, it is unlikely climate will change so
dramatically as to impact productivity in the short-term, although there may be potential impacts in the
longer-term. It is understood that climate change has been factored into the modelling used to
determine wood volumes for a sustained yield.
4.1.2 Craftwood
Craftwood is a term used to describe a piece of wood on the forest floor. It is generally small in size,
and includes certain features of grain, colour or shape that make it suitable for manufacture into craft
items. Burls, which are woody growths on the sides of some trees, are also harvested for the
manufacture of craft items, but are not classified as craftwood.
Small quantities of craftwood (e.g. less than one tonne) can be collected after obtaining a Minor
Production Contract (MPC), which is typically issued for a period of up to three months.
There are no inclusions in the Draft FMP considered likely to affect the craftwood sector, at least not in
a quantifiable manner.
4.1.3 Mineral resources
Advice from DEC indicated that the Draft FMP would not have major impacts upon access to mineral
resources. However, consultation with the Department of Mines and Petroleum indicated that
proposals for additional reserves could impact access to some known mineral deposits in these
locations, depending upon the revised tenure proposed. See Section 6.3.1.1 and Appendix A for
further discussion.
4.1.4 Water resources
Forests play an important role in regulating the quantity and quality of surface and groundwater flows
in the catchments in which they occur. The current FMP includes a number of objectives that are
intended to protect the ecological integrity and quality of streams, wetlands and their associated
vegetation, and to increase the flow of water to surface and groundwater reservoirs (Conservation
Commission 2003).
URS understands that options to thin parts of the catchments in the northern jarrah forests to achieve
environmental outcomes and increase water yields are being considered as part of the FMP process.
The main driver of the thinning proposals is recovery of environmental systems and water yield that
has been, or could be impacted by, falling groundwater levels.
Action 21.3 of the current FMP, sets out that the Department of Conservation and Land Management
(CALM) and the Forest Products Commission, in consultation with the Conservation Commission (CC)
will evaluate with the Water Corporation and the Water and Rivers Commission (now the Department

SEIA Draft Forest Management Plan 2014-2023
4 Next Forest Management Plan 2014 - 2023
42908086/1/03 27
of Environment (DoE)) any proposal seeking to employ silvicultural treatments to increase the flow of
water to surface and groundwater reservoirs.
The ‘Wungong project’, commenced in 2005, was developed by the Water Corporation as an
experimental trial to increase stream flow into the Wungong reservoir by undertaking silvicultural
treatments in selected parts of the Wungong catchment. At that time, the CCWA and DEC agreed that
the Wungong project was consistent with the FMP 2004-2013 (Water Corporation, 2006).The main
objectives of this trial are to:
1. restore soil moisture, groundwater levels and streamflow duration to that prevailing in the 1990s;
2. recover streamflow volume to more than 70 per cent of the flows for the 1990–2000 period. (In the
context of long term streamflow this represents flow volumes that are less than half those of the
pre-1975 period);
3. maintain or recover biodiversity values;
4. improve forest health and vigour; and
5. maintain the capacity for continued wood production (EPA, 2005).
The intent for the Wungong Project was to better understand the changes in the environment that
result from the thinning program. The south west region of WA has experienced below average rainfall
resulting in a two-thirds reduction in streamflow with the average from 1986–1998 being ~150mm and
from 2006–2010 the average being ~50mm. The Water Corporation is now aiming to return
streamflows in the Wungong trial area to about 70 per cent of the 1990–2000 flows (Water
Corporation, 2012).
The impact of managing northern jarrah forests to achieve environmental outcomes, and increase
water yields, might be expected to provide a mix, and a trade-off, of benefits to the WA community and
native forest products industries. Increased water yields will have a value corresponding to the cost of
alternative supply sources (such as desalinated seawater), and additional benefits in extending the life
and value of existing water catchment storage and delivery infrastructure. There are also potential
employment benefits in the more intensive management of these forests to achieve environmental
outcomes and increase water yields. Correspondingly, there may be mixed impacts on the native
forest industries. There could be structural adjustments required if average log sizes and/or quality are
reduced, but some benefits are likely if increased log volumes result. It is difficult to estimate the net
effects and net values associated with thinning of northern jarrah forests without details of any
proposal.
4.1.5 Tourism and recreation
Tourism is a significant contributor to the south west economy and, although there has been a
downturn in the past three to four years, it is expected to grow. However, it is an industry that is
subject to wide fluctuations (e.g., visitation rates typically drop when the Australian dollar is high). The
forests are a key destination for both domestic and international visitors and continuing access to the
forests will be essential to the tourism industry. There are long-standing businesses established in the
areas covered by the plan, from accommodation through to adventure trails, and their long-term
viability will depend, at least in part, on access to areas covered by the plan being maintained.
DEC has advised there are unlikely to be any changes in the existing pattern of land use proposed in
the Draft FMP that might affect this sector.

SEIA Draft Forest Management Plan 2014-2023
4 Next Forest Management Plan 2014 - 2023
28 42908086/1/03
Note that the amendments to the CALM Act introduced through the Conservation Legislation
Amendment Bill in 2010 in respect of joint management of land vested in the Conservation
Commission and the ability to develop policies to promote the value of land to the culture and heritage
of Aboriginal persons (including the ability for Aboriginal persons to carry out activities for Aboriginal
customary purposes), are beyond the scope of this SEIA and have not been assessed for their
potential impact (if any). These changes may alter access to the land vested in the Conservation
Commission and thus have a social and/or economic impact.
4.1.6 Basic raw materials
Under the CALM Act, this involves the extraction of gravel and limestone, principally from pits
scattered throughout the plan area. DEC notified that an possibility being explored was to implement
policy options that would ensure the extraction comes from a smaller number of larger pits rather than
extraction coming from a large number of small, dispersed pits. Consultation with Main Roads WA and
local government authorities, the main users of these basic raw materials, confirms that access to
supplies near to their project areas remains a priority but acknowledge the difficulty in gaining access
to sensitive areas, including conservation reserves. Options for the extraction of basic raw materials is
currently being considered by the State Gravel Supply Strategy Group. This is discussed in further
detail in Section 6.3.1.1 and Appendix A.
4.1.7 Apiculture, floriculture and seed industries
URS has been advised that there will be no net losses in areas available for apiculture as a result of
the Draft FMP. Recognising that access to land for the siting of hives is the major issue for apiarists
there is likely to be no quantifiable impacts from potential new or changed activities in the Draft FMP.
Although proposed conservation reserves may limit access for floriculture and seed collection in some
areas, there may be opportunities on existing State forest areas that have not been taken up.
4.1.8 Biotechnology
Biotechnology is currently a small prospective industry in WA and no effects have been anticipated by
DEC or Conservation Commission as a result of the Draft FMP.
4.1.9 Public firewood
Any transfers of State forest or timber reserve to other conservation reserve will have an impact upon
access for public firewood removal. If access is limited in communities that have a high reliance on
publicly available firewood for cooking and/or heating, then it will result in an economic cost – either to
investigate other fuel sources such as gas, oil or electricity, or other commercial sources for firewood.
DEC has examined options for the future access and management of public firewood collection in the
development of the Draft Forest Management Plan 2014-2023. Management options may include the
following:
DEC transporting firewood from disease risk areas and other locations to areas that are accessible
to the general public;
Thinning of selected areas or accessing non-commercial plantation areas (eg, arboreta);
Moving to a system where firewood is only available from commercial operators.

SEIA Draft Forest Management Plan 2014-2023
4 Next Forest Management Plan 2014 - 2023
42908086/1/03 29
Advice from the DEC suggested that each of these options will have cost implications for government,
FPC, commercial firewood suppliers and consumers of firewood, and could potentially reduce the
amount of firewood available for public use.

SEIA Draft Forest Management Plan 2014-2023
42908086/1/03
THIS PAGE INTENTIONALLY LEFT BLANK

SEIA Draft Forest Management Plan 2014-2023
42908086/1/03 31
5
5Current socio-economic status in the study area (baseline)
5.1 Profile of communities associated with native forest industries
The following provides community profiles for those communities within the study area. While the FMP
extends from the Shire of Gingin in the north to the Shire of Denmark in the south, this study focuses
on those Shires that correspond to areas considered to contain communities more dependent on
native forests.
This social profile takes in the LGAs of:
Shire of Bridgetown-Greenbushes;
City of Busselton;
Shire of Collie;
Shire of Donnybrook-Balingup;
Shire of Harvey;
Shire of Manjimup;
Shire of Murray;
Shire of Nannup; and
Shire of Serpentine-Jarrahdale.
Where relevant data is compared to the WA equivalent to show how these LGAs compare to the state
situation. The sections that follow provide a snapshot of the ten LGAs under investigation describing
some of the key social and economic characteristics of each LGA. This is followed, in Section 5.2, by
a general discussion of the key industries contributing to the regional economy.
5.1.1 Population
The following table shows the percentage change in the population of each of the ten LGAs under
investigation. All LGAs, with the exception of the Shire of Manjimup have increased between 2001 and
2011. The Shire of Manjimup has seen an overall decrease of around nine per cent (see Figure 5-1).
This decrease supports stakeholder statements that the population in the Manjimup Shire reduced
subsequent to the implementation of the current FMP and the industry restructuring that followed.
The Shires that have seen the greatest population growth are the Shire of Serpentine-Jarrahdale,
whose population has increased by over 55 per cent (6,176 people); the Shire of Busselton increased
38.2 per cent, with the Shire of Murray (36.6%) and the Shire of Harvey (32.3%) showing population
growth.

SEIA Draft Forest Management Plan 2014-2023
5 Current socio-economic status in the study area (baseline)
32 42908086/1/03
Figure 5-1 Percentage change in population between 2001 and 2011 by LGA
Source: ABS Census of Population and Housing
An overview of the South West Regional Development Australia labour market was prepared by the
Labour Market Research and Analysis Branch of the Department of Education, Employment and
Workplace Relations in 2011 (Neville, 2012). The South West RDA is part of the Lower Western WA
Labour Force Region (LFR) and comprises 12 following Local Government Areas (LGAs):
Augusta-Margaret River LGA
Bridgetown-Greenbushes LGA
Boyup Brook LGA
Bunbury LGA
Busselton LGA
Capel LGA
Collie LGA
Dardanup LGA
Donnybrook-Balingup LGA
Harvey LGA
Manjimup LGA
Nannup LGA
Some of the key findings from this study as they relate to employment in the region are listed below:
Long-term unemployed (LTU) are those who have been unemployed and looking for work for at
least 52 weeks. As at January 2012, the proportion of unemployed who were long-term
unemployed in the Lower Western WA LFR (21 per cent) was higher than both the state and
national average (15 per cent and 19 per cent respectively).

SEIA Draft Forest Management Plan 2014-2023
5 Current socio-economic status in the study area (baseline)
42908086/1/03 33
The average duration of unemployment in the LFR was 44 weeks, higher than both the state
average (28 weeks) and national average (37 weeks).
Overall, less than one in six (15 per cent) of families in the South West RDA did not have an
employed parent, which was lower than the rate for Australia (20 per cent) and WA (16 per cent)
Nevertheless, there are areas where a relatively high proportion of families experience
unemployment. Jobless families (with children) were more prevalent in the LGAs of Collie and
Bunbury (21 per cent and 19 per cent respectively).
As at January 2012, the teenage full-time unemployment rate for the Lower Western WA Labour
Force Region (LFR) was 17.6 per cent, increasing by 3.7 percentage points over the preceding 12
months. This was lower than rates for both WA (18.1 per cent) and Australia (23.3 per cent).
The teenage full-time unemployment to population ratio (4.7 per cent) however was slightly higher
than WA and Australia (4.3 per cent and 4.1 per cent respectively).
At the time of the 2006 Census, 16 per cent of those aged 20-24 years in the South West RDA
were neither working nor studying, a slightly larger proportion than that for Australia overall (13 per
cent). Over one fifth of females (21 per cent) aged 20-24 years were neither working nor studying
(4 per cent were unemployed and 17 per cent were not in the labour force). This was substantially
higher compared with Australia (16 per cent neither working nor studying, comprising 4 per cent
unemployed and 12 per cent not in the labour force).
The industries that have experienced the largest growth in the Lower Western WA LFR in the past
five years are Mining (4,700 persons) and Construction (4,500 persons).
The agriculture, forestry and fishing industries experienced the largest drop in employment over the
past five years in the LFR (10,100 persons).
5.1.2 Shire of Bridgetown-Greenbushes
The Shire of Bridgetown-Greenbushes covers an area of 1,340 km2 with the major towns being
Bridgetown and Greenbushes as well as several smaller localities including Yornup and Catterick.
From an analysis of the community business directory, made available by the local Bridgetown radio
station, BridgeFM, there were found to be 264 listed businesses. A sample of the total includes 17
listed accommodation establishments, five grocery outlets including two major supermarket chains,
three banks, four companies supplying fuel, ten contracting or earthmoving companies, 13 companies
providing automotive services, 14 retail outlets and seven transport companies. The business
directory also lists a dental practitioner, optometrist and pharmacist. There are also 32 businesses
who are providing building services of some description, including electrical, plumbing and building
construction.
Table 5-1 provides selected social and economic time series data for the Shire of Bridgetown-
Greenbushes. The population has been relatively stable until recently with an increase of over ten per
cent in the last five years. As with other areas across WA, there has been an increasing trend in the
proportion of the population aged 65 years and more. At the same time, there has been a decreasing
trend in the proportion of the population aged less than 15 years leading to an overall ageing of the
population. Forecast growth is expected to be minor with the Department of Planning estimating a
population of between 4,100 and 6,900 in the Shire by 2026 (Department of Planning, 2012).

SEIA Draft Forest Management Plan 2014-2023
5 Current socio-economic status in the study area (baseline)
34 42908086/1/03
Table 5-1 Shire of Bridgetown-Greenbushes - selected population data
1981 1986 1991 1996 2001 2006 2011 2011
WA
Population 3,169 3,293 3,713 3,904 3,935 3,867 4,278
% change 3.9% 12.8% 5.1% 0.8% -1.7% 10.6%
Population under 15 years (%) 28.4% 28.1% 29.5% 27.5% 23.4% 22.8% 21.8% 19.7%
% change -0.9% 5.1% -7.1% -14.9% -2.3% -4.4%
Population over 65 years (%) 9.8% 9.0% 8.9% 8.7% 11.5% 15.7% 18.3% 12.3%
% change -7.2% -2.1% -2.0% 32.0% 36.7% 16.5%
Employed Persons 1,446 1,280 1,410 1,650 2,230 1,794 n.a.
Unemployed Persons 39 125 202 131 106 73
Labour Force Participation Rate 75.7% 67.9% 70.5% 71.4% 91.1% 78.5%
Source: ABS Census Data
Education and training
There are three primary schools in the Shire – one public school in Greenbushes, and a public and
Catholic school in Bridgetown. Bridgetown High School provides education up to Year 10 with public
transport provided for students to undertake Year 11 and 12 studies in Manjimup. These schools are
located within the Manjimup network of schools in the Southwest Education Region (see Table 5-2).
Table 5-2 Schools in the Shire of Bridgetown-Greenbushes
School Comment
Bridgetown Primary School K-7, student numbers have been increasing in recent
years – 16% in past 4 years
Greenbushes Primary School K-7, student numbers have remained relatively
constant in the past four years (~56 total)
St. Brigid’s Primary School K-7, approximately 100 students
Bridgetown High School 8-10, student numbers have decreased from 151 in
2008 to 119 in 2012
Source: WA Department of Education Schools Online
Health services
The Shire’s health and medical needs are served by a District Hospital, a medical centre, pharmacy,
dental clinic and physiotherapy centre.
The 24-bed public hospital provides the following services: accident/emergency, day surgery,
diabetes, endoscopy, geriatric, geriatric assessment, aged care, health promotion, home care,
maternity, medical, medical library, mental health, anaesthetics, occupational therapy, outpatients,

SEIA Draft Forest Management Plan 2014-2023
5 Current socio-economic status in the study area (baseline)
42908086/1/03 35
paediatric, pathology, arthritis, pharmacy, physiotherapy, podiatry, psychiatric, radiology, social work,
speech pathology, speech therapy, surgical procedures.
For the period 2010–11, the hospital reported 381 same-day admission and 600 overnight admissions
with the average length of stay for acute care being 3.6 days. Additionally, the hospital treated 2,801
people as outpatients in the same period, which equates to approximately 8 patients per day.
Tourism
In 2000, Bridgetown was granted Historic Town Status by the National Trust and has become a
popular heritage tourism destination. The area also hosts a number of festivals, which attract tourists
throughout the year (e.g. Blues at Bridgetown, Blackwood Marathon, Festival of Country Gardens,
Easter Tennis Tournament, Blackwood Classic).. Given its attraction as a tourist destination the Shire
has a large number of accommodation options for visitors.
No statistical tourism data is available for the Shire of Bridgetown-Greenbushes.
Forest Products Industry
During the consultations for this SEIA, representatives of the Shire of Bridgetown-Greenbushes have
suggested that the town of Bridgetown does not have “as much of an identity association with timber
as there is in Manjimup”, however it remains a significant industry for the Shire’s economy. The
consultation indicates that approximately 140 people are involved in the forest products industry in
sawmilling and harvest and haulage. The sawmill is the second largest employer of Shire residents.
Employment
The major industry of employment for the Shire of Bridgetown-Greenbushes at the 2006 Census was
‘agriculture, forestry and fishing’. Of the total workforce of 1,790 in 2006, some 204 were employed in
the ‘agriculture, forestry and fishing’ industry (ABS, 2006). Other major industries of employment
include health care and social assistance, retail trade, manufacturing, and education and training as
shown in Figure 5-2.
In March 2012, the labour force of the Shire totalled 2,553 persons, 116 people were unemployed and
the unemployment rate was 4.5 per cent (DEEWR, 2012). While the unemployment rate is low there
are only limited employment opportunities.
The main industries in the Shire are timber, mining, agriculture (including beef cattle and dairy),
horticulture (including fruits, walnuts and wineries) and tourism.

SEIA Draft Forest Management Plan 2014-2023
5 Current socio-economic status in the study area (baseline)
36 42908086/1/03
Figure 5-2 Industry of employment (Shire of Bridgetown-Greenbushes)
Source: ABS Census of Population and Housing, 2006
Summary
The social and economic viability of the Shire of Bridgetown-Greenbushes is reliant upon the
continuation of a population base supported by the necessary soft (social) and hard infrastructure. The
population has grown in recent years after a period of stagnation. However, much of the growth has
been in the upper age categories, which, as the population ages, have an impact upon social services
such as medical and allied health services.
The economy of the Shire is reasonably diverse with an important tourism sector. In addition, the
forest products industry and the mineral resources sector are major employers in the Shire.
5.1.3 City of Busselton
The City of Busselton covers an area of 1,455 km2 and includes the major population centres of
Busselton, Dunsborough and Yallingup. The area is experiencing considerable growth and there has
been significant investment into the region, particularly in the town of Busselton.
A number of infrastructure projects are planned or have already commenced in the City of Busselton,
which will have an impact on the economy of the region, including the Busselton Regional Airport
Expansion, Busselton Foreshore Redevelopment, the building of the Community Resource Centre and
the Dunsborough Foreshore Enhancement.

SEIA Draft Forest Management Plan 2014-2023
5 Current socio-economic status in the study area (baseline)
42908086/1/03 37
Table 5-3 provides selected social and economic time series data for the Shire of Busselton. The
population has been increasing at a rapid rate since 1981, tripling by 2011. It is a relatively young
population with 32 per cent aged under 24 years. Approximately 16 per cent of the City’s population
are aged 65 years and above. The Department of Planning forecasts a population of between 48,400
and 60,200 in the City by 2026 (Department of Planning, 2012). At the upper end, this would equate to
a doubling of the population in 14 years.
The resident population is extended during the tourist season when more than 500,000 visitors travel
to the City.
Table 5-3 City of Busselton - Selected Population Data
1981 1986 1991 1996 2001 2006 2011 2011 WA
Population 9,350 12,411 13,528 17,490 22,060 25,068 29,831
% Change 32.7% 9.0% 29.3% 26.1% 13.6% 19.0%
Population under 14 years (%) 24.5% 26.1% 24.2% 24.1% 23.9% 22.1% 21.9% 19.7%
% change 6.8% -7.3% -0.7% -0.9% -7.2% -0.9%
Population over 65 years (%) 15.2% 13.9% 15.2% 14.5% 13.3% 15.5% 16.4% 12.3%
% change -8.2% 9.4% -5.0% -8.1% 16.5% 6.2%
Employed Persons 3,553 4,398 5,129 7,144 9,637 11,751 n.a.
Unemployed Persons 39 125 202 131 106 413
Labour Force Participation Rate 63.6% 60.8% 65.1% 67.7% 70.3% 77.8%
Source: ABS Census of Population and Housing
Education and training
Busselton has four pre-primary schools, eight primary schools (both public and private), five high
schools (1 public, 4 private), and a TAFE campus.
Table 5-4 Student enrolments – City of Busselton schools
2008 2009 2010 2011 2012
Busselton Primary School K-7 304 299 262 283 269
Geographe Primary School K-7 527 557 587 591 585
Vasse Primary School K-7 294 314 337 375 418
St Joseph's Primary School K-7 n.a.
West Busselton Primary School K-7 301 272 327 331 363
Cornerstone Christian College K-12 ~400
Georgiana Molloy Anglican School K-12 n.a.
Geographe Education Support Centre K-12 46 48 48 48 47
MacKillop Catholic College 8-12 ~580
Busselton Senior High School 8-12 880 806 699 585 562
Cape Naturaliste College 8-12 95 224 282 355 446
Source: Education Department of WA Schools Online

SEIA Draft Forest Management Plan 2014-2023
5 Current socio-economic status in the study area (baseline)
38 42908086/1/03
The Busselton Campus of South West Institute of Technology offers courses in the following study
areas:
access and participation.
aged care.
childcare.
office administration.
small business management.
teacher assistant.
visual arts.
youth work.
Health services
As a major regional population centre the town of Busselton has a range of health services for the
resident and tourist population However, given the rapid pace at which the population is growing in the
City there will likely be increased demand on services into the future.
Health care services within the City of Busselton include the Busselton Hospital, a range of community
based services, including population health and community mental health services; and a number of
public and private health providers.
Busselton Hospital is an Integrated District Health Service and provides support to the smaller
hospitals within the district. For more specialised care, patients are referred to the regional South West
‘hub hospital’ (Bunbury Hospital) or to the St John of God Hospital in Bunbury. Both these facilities are
collocated on the Health care services in the South West Health Campus in Bunbury. Patients may
also be referred to metropolitan tertiary hospitals.
Busselton Hospital currently provides 42 inpatient beds; eight day surgical beds; six renal chairs; a two
bed co-located hospice; theatre complex; labour delivery rooms; and a ten bay Emergency
Department. The Busselton Hospital is co-located with the Busselton Community Health Centre. The
hospital, community health centre and Busselton Community Mental Health Clinic, currently on
another site, will be redeveloped as the integrated Busselton Health Campus in 2012.
There are 40 GPs currently operating in the City of Busselton. In addition, there are a number of
private allied health practitioners working in Busselton, including dietetics, audiology, physiotherapy,
occupational therapy, podiatry, psychology, social work, speech pathology, optometry and
chiropractic.
Tourism
Tourism is major economic contributor in the City of Busselton with visitors attracted to the coastal
location, proximity to vineyards and the nature based activity that the region provides. The town of
Busselton is the principal tourist destination in WA outside Perth.
Average annual visitor numbers to the City of Busselton for the years 2009, 2010 and 2011 are
presented in Table 5-5 (Tourism WA, 2011a).
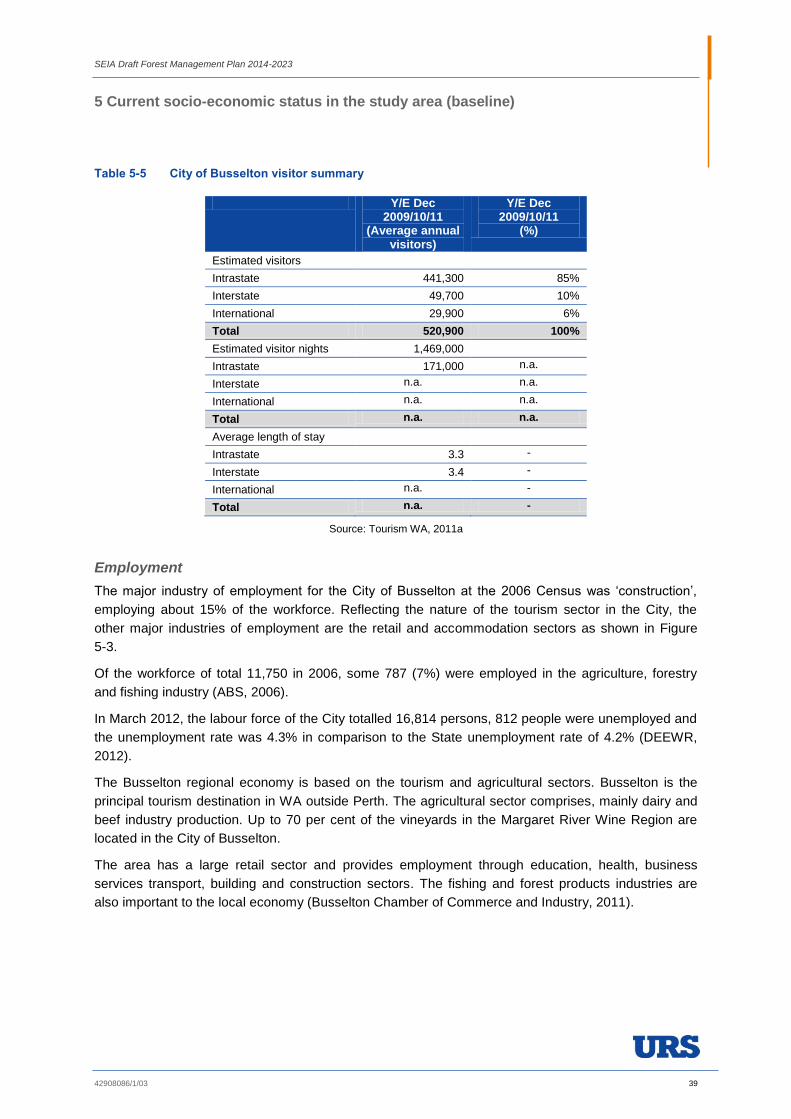
SEIA Draft Forest Management Plan 2014-2023
5 Current socio-economic status in the study area (baseline)
42908086/1/03 39
Table 5-5 City of Busselton visitor summary
Y/E Dec 2009/10/11
(Average annual visitors)
Y/E Dec 2009/10/11
(%)
Estimated visitors
Intrastate 441,300 85%
Interstate 49,700 10%
International 29,900 6%
Total 520,900 100%
Estimated visitor nights 1,469,000
Intrastate 171,000 n.a.
Interstate n.a. n.a.
International n.a. n.a.
Total n.a. n.a.
Average length of stay
Intrastate 3.3 -
Interstate 3.4 -
International n.a. -
Total n.a. -
Source: Tourism WA, 2011a
Employment
The major industry of employment for the City of Busselton at the 2006 Census was ‘construction’,
employing about 15% of the workforce. Reflecting the nature of the tourism sector in the City, the
other major industries of employment are the retail and accommodation sectors as shown in Figure
5-3.
Of the workforce of total 11,750 in 2006, some 787 (7%) were employed in the agriculture, forestry
and fishing industry (ABS, 2006).
In March 2012, the labour force of the City totalled 16,814 persons, 812 people were unemployed and
the unemployment rate was 4.3% in comparison to the State unemployment rate of 4.2% (DEEWR,
2012).
The Busselton regional economy is based on the tourism and agricultural sectors. Busselton is the
principal tourism destination in WA outside Perth. The agricultural sector comprises, mainly dairy and
beef industry production. Up to 70 per cent of the vineyards in the Margaret River Wine Region are
located in the City of Busselton.
The area has a large retail sector and provides employment through education, health, business
services transport, building and construction sectors. The fishing and forest products industries are
also important to the local economy (Busselton Chamber of Commerce and Industry, 2011).
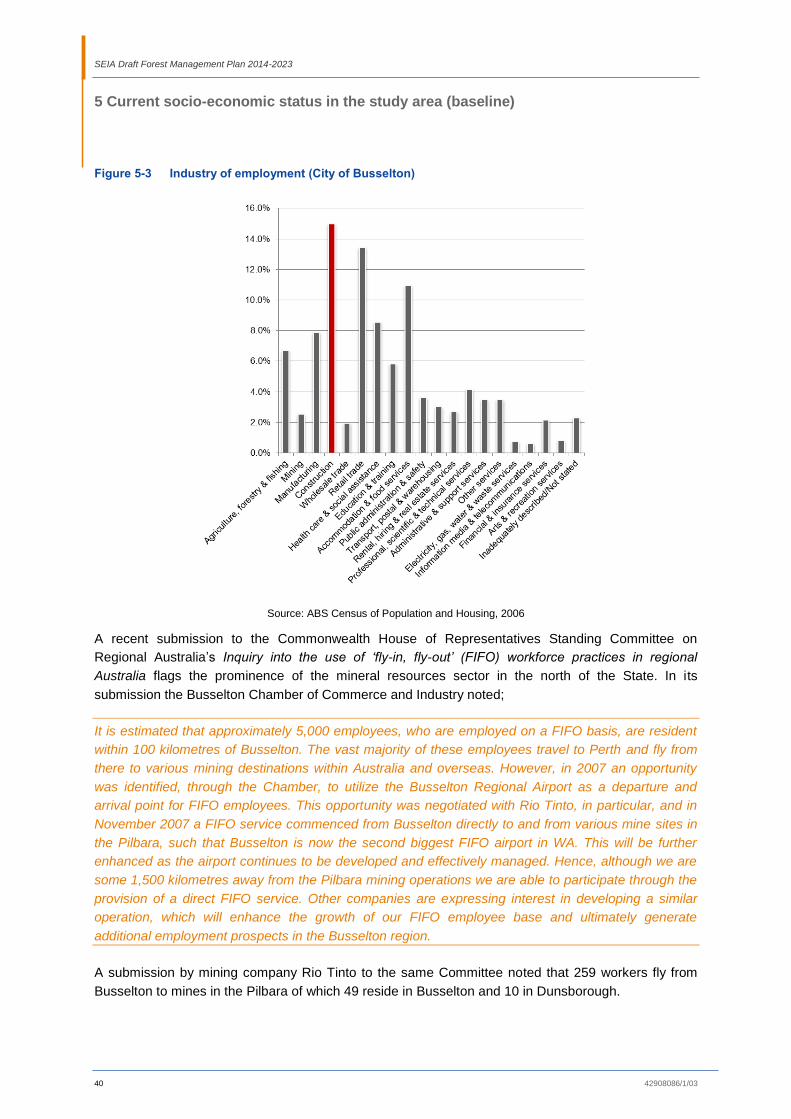
SEIA Draft Forest Management Plan 2014-2023
5 Current socio-economic status in the study area (baseline)
40 42908086/1/03
Figure 5-3 Industry of employment (City of Busselton)
Source: ABS Census of Population and Housing, 2006
A recent submission to the Commonwealth House of Representatives Standing Committee on
Regional Australia’s Inquiry into the use of ‘fly-in, fly-out’ (FIFO) workforce practices in regional
Australia flags the prominence of the mineral resources sector in the north of the State. In its
submission the Busselton Chamber of Commerce and Industry noted;
It is estimated that approximately 5,000 employees, who are employed on a FIFO basis, are resident
within 100 kilometres of Busselton. The vast majority of these employees travel to Perth and fly from
there to various mining destinations within Australia and overseas. However, in 2007 an opportunity
was identified, through the Chamber, to utilize the Busselton Regional Airport as a departure and
arrival point for FIFO employees. This opportunity was negotiated with Rio Tinto, in particular, and in
November 2007 a FIFO service commenced from Busselton directly to and from various mine sites in
the Pilbara, such that Busselton is now the second biggest FIFO airport in WA. This will be further
enhanced as the airport continues to be developed and effectively managed. Hence, although we are
some 1,500 kilometres away from the Pilbara mining operations we are able to participate through the
provision of a direct FIFO service. Other companies are expressing interest in developing a similar
operation, which will enhance the growth of our FIFO employee base and ultimately generate
additional employment prospects in the Busselton region.
A submission by mining company Rio Tinto to the same Committee noted that 259 workers fly from
Busselton to mines in the Pilbara of which 49 reside in Busselton and 10 in Dunsborough.

SEIA Draft Forest Management Plan 2014-2023
5 Current socio-economic status in the study area (baseline)
42908086/1/03 41
The local technical training college has recently introduced special training courses for employees
engaged in the resources industry. These courses have been designed to target the local workforce to
make them “job ready” for FIFO jobs while also providing opportunities for further education for the
existing FIFO workforce (Busselton Chamber of Commerce, 2011).
The desire to provide the employment opportunities flagged by the Chamber of Commerce has been
influential in the decision to upgrade the Busselton Airport. As a result, opportunities for employment
have been expanded outside of the immediate region, as well as providing income to the City of
Busselton, as the owner of the airport infrastructure.
Summary
The City of Busselton is characterised by rapid population growth and an increasingly diverse
economy that is based on tourism and the agricultural sector. The LGA is well served in health,
education, retail and community services and the town of Busselton is a hub for other smaller towns in
the LGA and in adjacent LGAs.
Plans to make Busselton a source community for workers in the Pilbara may provide additional
employment options for local residents with appropriate skills. There is some anecdotal evidence to
suggest that workers formerly employed in the forest products industry have gained employment in the
resources sector on FIFO basis.
5.1.4 Shire of Collie
The Shire of Collie covers an area of 1,685 km2 and was first settled by Europeans in 1897. About
78% of the area of the Shire is State forest. The shire is also located within a water catchment of state
significance (Wellington Dam).
The Shire has strong links to the coal industry with two major coal mining companies having
operations within the Shire’s boundary. The Shire also contains the Muja power station and the
Worsely alumina facility. Other industries include agriculture and aquaculture tourism.
Table 5-6 provides selected social and economic time series data for the Shire of Collie. In 2011 the
population of the LGA was 9,882 people. This LGA had shown a decreasing trend in the size of the
population since the 1991 Census; however a substantial population increase occurred in 2011. There
is a decreasing trend in the population aged under 15 years and, notwithstanding 2011, an increasing
trend in the proportion of the population aged over 65 years.
Table 5-6 Shire of Collie – selected population data 1981 1986 1991 1996 2001 2006 2011 2011 WA
Population 8,938 9,077 9,058 8,636 8,400 8,369 9,882
% Change 1.6% -0.2% -4.7% -2.7% -0.4% 18.1%
Population under 14 years (%) 28.3% 29.2% 27.5% 25.7% 24.1% 24.0% 17.7% 19.7%
% change 3.2% -5.8% -6.6% -6.2% -0.4% -26.2%
Population over 65 years (%) 8% 8.5% 9.2% 10.5% 12.0% 12.3% 11.9% 12.3%
% change 6.3% 8.2% 14.1% 14.3% 2.5% -3.3%
Employed Persons 3,643 3,346 3,580 3,479 4,632 3,474 n.a
Labour Force Participation Rate 59.8% 57.6% 60.8% 59.8% 79.0% 55.8% n.a.
Source: ABS Census of Population and Housing

SEIA Draft Forest Management Plan 2014-2023
5 Current socio-economic status in the study area (baseline)
42 42908086/1/03
Education and training
There are four primary schools and one high school in the Shire, as well as a TAFE College campus,
as presented in Table 5-7.
Table 5-7 Schools in the Shire of Collie
School Comment
Amaroo Primary School K-7, school has had relatively constant student numbers between 2008
and 2012, on average 372
Fairview Primary School K-7, decreasing student numbers since 2008, currently 240, down 19%
Wilson Park Primary School K-7, recent increase in numbers to 90, following a downward trend
St. Brigid’s School K- 7, enrolment numbers not publically available.
Collie Senior High School 8 – 12, enrolment numbers not publically available
South West Regional College of TAFE
(Collie Campus)
Offers courses in Access and Participation, including General Certificate
in Education for Adults, Aged Care, Childcare, Disability Work,
Information Technology, Office Administration, Rural Operations, Teacher
Assistant and Visual Arts.
Source: Education Department of WA Schools Online
Health services
The Collie hospital is located within the shire and provides emergency, geriatric, home and community
care, maternity, general medical, occupational therapy, outpatients, pathology, pharmacy,
physiotherapy, speech therapy and general surgery. It also has a medical centre that offers general
medical consultation, on-call emergency medicine, anaesthetics, obstetrics and surgical service. Collie
also has a dedicated child health centre and two dental clinics. The Valley View Residence offers
aged care services.
Tourism
The Shire of Collie has a number of tourist attractions, including natural attractions such as the State
forests, which surround the town, Wellington Dam and Wellington National Park, Collie River, Harris
Dam and Stockton Lake. These areas support many recreational activities such as bushwalking,
mountain bike riding, camping swimming and fishing. The Shire also has a number of attractions that
highlight the region’s connection with the mining industry. These attractions include the Collie
Underground Tourist Mine (Collie River Valley Visitor Centre, n.d.).
Collie received 134,000 visitors in the year ending September 2011. This represents an increase of 20
per cent from recent years and is largely attributed to an increase in business travellers in relation to
major industrial projects. There are four main accommodation establishments in the region providing
115 rooms. Occupancy rates for these establishments have fallen from around 60 per cent during the
year ending September 2007 to around 40 per cent in 2011. Despite these lower occupancy rates,
takings from accommodation have risen 39 per cent over the past year. (South West Development
Commission, 2012).

SEIA Draft Forest Management Plan 2014-2023
5 Current socio-economic status in the study area (baseline)
42908086/1/03 43
Collie: A ‘SuperTown’
Collie has been identified by the State Government as one of its ‘Super Towns’ under the
Government’s Regional Centres Development Program. A draft growth plan was developed as part of
this initiative. The growth plan includes three strategic initiatives:
1. CBD revitalisation: including improving the amenity of the Collie River as it runs through the CBD,
redevelopment of the Wallsend Ground for residential purposes and an upgrade to the Mine Workers
Memorial swimming pool;
2. Diversification of the economy: including building on existing tourism opportunities, such as the
Collie Motorplex and Lake Kepwari; and
3. Wilson Park redevelopment: including the urban renewal of this neighbourhood to raise socio-
economic outcomes and to improve community perceptions. (Source: South West Development
Commission, Collie SuperTown: Townsite Growth Plan n.d.)
Employment
The major industry of employment for the Shire of Collie at the 2006 Census was mining. The
manufacturing and retail industries were also significant employers in the region as shown in Figure
5-4. The coal mining, power generation and bauxite refining industries currently employ over 2,000
people in the Shire of Collie. A new urea manufacturing plant is expected to employ 200 people on
commencement in 2016.
Of the total workforce of 3,470 in 2006, some 108 (3%) were employed in the agriculture, forestry and
fishing industry (ABS, 2006). A high proportion of 20-24 year olds in the Shire of Collie were neither
working nor studying (20 per cent) at the time of the 2006 census. Almost a third of 20-24 year old
females in the Collie LGA were neither working nor studying (31 per cent). Of these, 6 per cent were
unemployed and 25 per cent were not in the labour force.
The unemployment rate in the Shire of Collie has trended higher than that for WA in recent years. In
March 2011 the unemployment rate across WA was 4.2 per cent (Australia reached 5.1%) and 5.9 per
cent for the Shire of Collie. A report prepared by the AEC Group Limited for the South West
Development Commission (SWDC) noted that despite a strong average annual growth rate of 6.6 per
cent since 2006- 07, which accounted for close to a third of the SWDC region’s total gross regional
product (GRP), unemployment remains high. Collie’s unemployment rate has consistently been close
to 2 per cent higher than the average for the south west region. The report concludes that “one of the
reasons for the high unemployment rate amongst Collie residents is the number of people living
outside Collie that travel in to work. Journey to work data shows that only 42 per cent of local jobs are
held by residents, or conversely, that 58 per cent of the local workforce lives outside of Collie. The
Shire of Harvey, City of Bunbury and the Shire of Dardanup are the largest contributors of workers in
Collie” (AEC Group, 2012a).
In March 2012, the labour force of the Shire totalled 5,098 persons, 303 people were unemployed and
the unemployment rate was 5.9 per cent, in comparison to the State unemployment rate of 4.2 per
cent (DEEWR, 2012).

SEIA Draft Forest Management Plan 2014-2023
5 Current socio-economic status in the study area (baseline)
44 42908086/1/03
Figure 5-4 Industries of employment (Shire of Collie)
Source: ABS Census of Population and Housing, 2006
Summary
The Shire of Collie’s economy centres on mining and manufacturing. Construction for the $2.5 billion
expansion of the Worsley Alumina operation is expected to create 4,000 jobs across the life of the
project with a peak workforce of 1,900. The bauxite mine is expected to create an additional 500 job
opportunities when completed. However, the unemployment rate of five per cent is one of the highest
in the south west region.
5.1.5 Shire of Donnybrook-Balingup
The Shire of Donnybrook-Balingup covers an area of 1,560 km2 and has a population of 5,192, which
reflects an increase of about 20 per cent since 2001. Some 30 per cent of the population in 2011 was
aged less than 25 years with 16 per cent aged 65 years and over. The Department of Planning (2012)
is forecasting a population of around 6,400 in the Shire by 2026.
There are three major towns in the Shire; the former gold rush town of Donnybrook as well as Kirup
and Balingup. Balingup, with a population of around 700, functions as the rural service centre with a
focus on tourism and ‘tree change’ lifestyle living. Kirup has a permanent population of around 300
and provides convenience services and some limited residential development (Shire of Donnybrook-
Balingup, 2008). Local industries include sandstone quarrying and farming including fruit, vegetables,

SEIA Draft Forest Management Plan 2014-2023
5 Current socio-economic status in the study area (baseline)
42908086/1/03 45
olives, sheep, cattle and viticulture production. Donnybrook is one of nine main Australian apple and
pear growing regions. Tourism is also rapidly becoming an important industry.
Table 5-8 Shire of Donnybrook - selected population data
1981 1986 1991 1996 2001 2006 2011 2011 WA
Population 3,200 3,491 3,844 4,029 4,305 4,484 5,192
% Change 9.1% 10.1% 4.8% 6.9% 4.2% 15.8%
Population under 14 years (%) 29.6% 28.4% 29.2% 27.7% 24.3% 21.4% 20.0% 19.7%
% change -4.0% 2.6% -5.0% -12.4% -11.7% -6.6%
Population over 65 years (%) 7.9% 7.8% 8.4% 8.2% 10.0% 11.9% 15.5% 12.3%
% change -0.3% 7.1% -2.2% 21.9% 19.2% 30.1%
Employed Persons 1,419 1,404 1,501 1,703 2,264 2,266 n.a.
Unemployed Persons 70 205 224 119 125 39
Labour Force Participation Rate 74.4% 72.3% 71.9% 70.6% 84.4% 77.1%
Source: ABS Census of Population and Housing, 2006
Health services
The Shire of Donnybrook-Balingup is served by a public hospital providing 14 overnight beds,
emergency services, cancer treatment services, and geriatric assessment and outpatient services. For
the year ending June 2011 the hospital recorded 52 same-day admissions and 150 overnight
admissions with the average length of stay being 3.6 days. The hospital treated 1,221 people as
outpatients in the same period.
A new medical centre, funded in part through the Royalties for Regions, was constructed in 2011. The
Centre is adjacent to the St John Ambulance Centre and within walking distance of the Hospital and
Tuia Frail Aged Lodge. The Donnybrook Medical Centre includes five consulting rooms, a nurse
treatment room, and an area for an allied pathology suite.
Employment
One-fifth of the Shire’s residents are employed in agriculture, forestry and fishing. Of the total
workforce of 2,265 in 2006, some 471 (21%) were employed in the agriculture, forestry and fishing
industry (ABS, 2006).
In March 2012, the labour force totalled 3,223 persons, which included 119 unemployed people. The
unemployment rate (3.7%) is lower than the State unemployment rate of 4.2 per cent (DEEWR, 2012).
The tourism workforce in the Shire in 2004 comprised 79 people or about eight per cent of the Shire’s
workforce (Tourism WA, 2008).
The Shire is located close to other areas of employment including Bunbury, Collie, Capel and
Greenbushes.
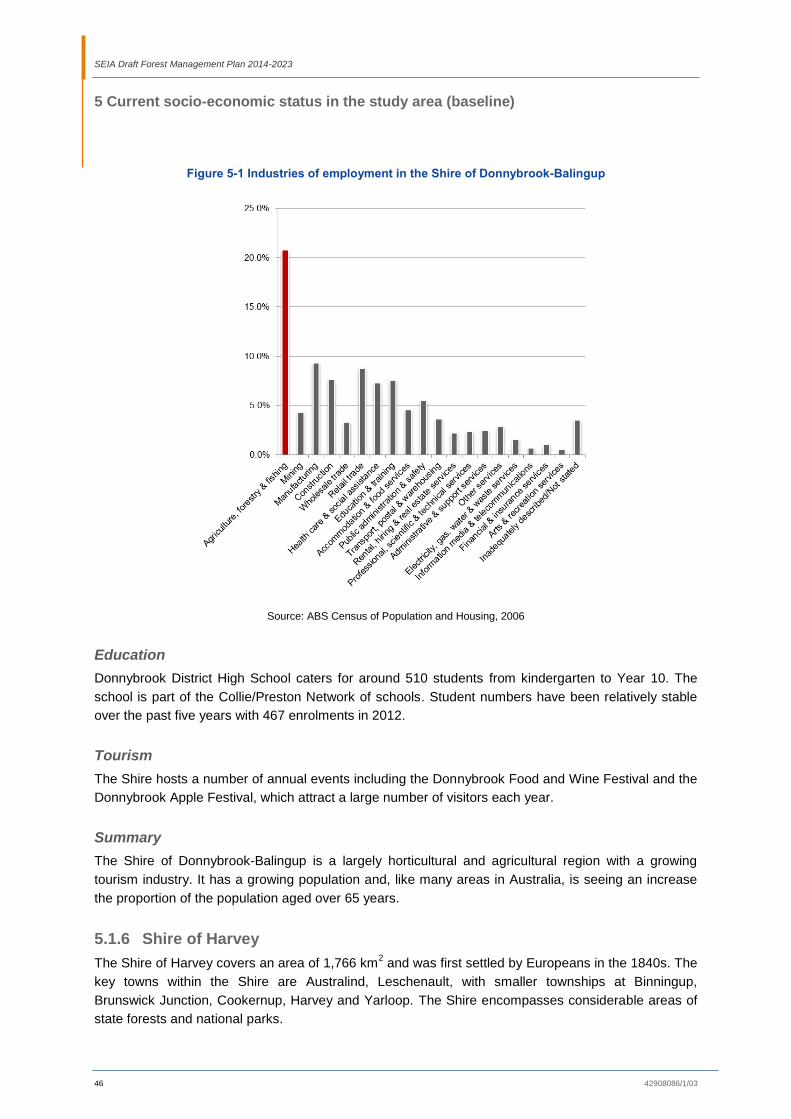
SEIA Draft Forest Management Plan 2014-2023
5 Current socio-economic status in the study area (baseline)
46 42908086/1/03
Figure 5-1 Industries of employment in the Shire of Donnybrook-Balingup
Source: ABS Census of Population and Housing, 2006
Education
Donnybrook District High School caters for around 510 students from kindergarten to Year 10. The
school is part of the Collie/Preston Network of schools. Student numbers have been relatively stable
over the past five years with 467 enrolments in 2012.
Tourism
The Shire hosts a number of annual events including the Donnybrook Food and Wine Festival and the
Donnybrook Apple Festival, which attract a large number of visitors each year.
Summary
The Shire of Donnybrook-Balingup is a largely horticultural and agricultural region with a growing
tourism industry. It has a growing population and, like many areas in Australia, is seeing an increase
the proportion of the population aged over 65 years.
5.1.6 Shire of Harvey
The Shire of Harvey covers an area of 1,766 km2 and was first settled by Europeans in the 1840s. The
key towns within the Shire are Australind, Leschenault, with smaller townships at Binningup,
Brunswick Junction, Cookernup, Harvey and Yarloop. The Shire encompasses considerable areas of
state forests and national parks.

SEIA Draft Forest Management Plan 2014-2023
5 Current socio-economic status in the study area (baseline)
42908086/1/03 47
The Shire has strong links with the forest products industry and is home to other industries including,
agriculture, viticulture, dairy, and tourism. The region also includes the Wagerup Alumina Refinery and
the Willowdale bauxite mine.
Table 5-9 provides selected social and economic time series data for the Shire of Harvey. This LGA
has shown an increasing trend in the size of the population since 1981. While this increase is not
reflected in the population aged under 15 years, which has been decreasing in recent years, it is
consistent with the population aged over 65 years. This may be supported by the region being named
the ‘top tree change town destination’ for WA (Harvey Visitor Centre, n.d.). In 2011 the population of
the LGA was 22,556 people.
Table 5-9 Shire of Harvey – selected population data
1981 1986 1991 1996 2001 2006 2011
2011 WA
Population 8,021 9,609 12,394 14,766 17,272 18,926 22,556
% Change 19.8% 29.0% 19.1% 17.0% 9.6% 19.2%
Population under 14 years (%) 29.2% 29.2% 29.3% 28.6% 26.0% 23.9% 23.5% 19.7%
% change 0.2% 0.2% -2.3% -9.3% -7.9% -1.2%
Population over 65 years (%) 8.5% 7.8% 7.8% 7.8% 8.6% 10.3% 10.9% 12.3%
% change -7.9% -0.6% 1.2% 9.4% 19.7% 6.0%
Employed Persons 3,414 3,774 4,982 6,217 8,369 9,234 n.a.
Labour Force Participation Rate 62.6% 60.7% 63.0% 63.5% 68.6% 61.6% n.a.
Source: ABS Census of Population and Housing, 2006
Education and training
Children in the Shire of Harvey are served by four primary schools catering for Kindergarten to Year 7,
one high school catering for Year 8 to 12, one Agricultural college catering for Year 10 to 12, as well
as a TAFE College, as shown Table 5-10.
Table 5-10 Schools in the Shire of Harvey
School Comment
Harvey Primary School K-7, school has had relatively constant student numbers between 2008 and 2012, on average 270)
Harvey Senior High School 8-12, decreasing student numbers since 2008, down 19%
Western Australian College of Agriculture, Harvey campus
10-12, relatively constant student numbers between 2008 and 2012, on average 109)
St Anne’s Catholic Primary School K-12, no published enrolment data. Operating since 1935
Leschenault Catholic Primary School K-7, increasing numbers of primary school students since 2003. Waiting lists for some years
St Michael’s Catholic Primary School K-7, no published enrolment data. Operating since 1954
South West Regional College of TAFE, Harvey Campus
Provides courses in the following areas of study: access and participation, aged care, childcare, disability work, office administration, teacher assistant
Source: Education Department of WA Schools Online

SEIA Draft Forest Management Plan 2014-2023
5 Current socio-economic status in the study area (baseline)
48 42908086/1/03
Health services
The Shire has one district hospital located in the town of Harvey. It has 25 beds and provides
emergency, geriatric, maternity, general medical, occupational therapy, outpatient and paediatric
services. An aged care facility also operates out of Harvey. The Shire includes child health centres in
Brunswick Junction, Harvey and Yarloop.
Horticulture and viticulture industry
The Harvey Shire is known for its fertile agricultural land, which supports beef, dairy, citrus and
viticulture enterprises. The area is also home to boutique brewery and cheese making enterprises. In
2006, the total gross value of agricultural production was approximately $100 million, which included
$47.5 million of agricultural crops.
Tourism
The Harvey Shire considers itself to be the gateway to the south west region. Its tourism attractions
are diverse and include natural features such as beaches, jarrah forests, fresh water and rolling hills
that support bushwalking, camping, fishing and other recreational activities. The region also promotes
the quality of its locally-produced food and beverages, with key tourist attractions including a brewery,
numerous wineries, the ‘Big Orange’ and local cheese manufacturing.
The township of Yarloop, was established as a timber town in the early 1900s. It is now a registered
conservation area and is deemed a historic precinct by the local council. The region’s connection with
the forest products industry is also commemorated at the Featured Wood Gallery and Museum, in
Australind.
Employment
The major industry of employment for the Shire of Harvey at the 2006 Census was manufacturing.
Retail trade and construction were also significant employers in the region as shown in Figure 5-5. Of
the workforce of 9,235, some 592 (6 per cent) were employed in the agriculture, forestry and fishing
industry (ABS, 2006).
In March 2012, the labour force of the Shire totalled 13,255 persons, 485 people were unemployed
and the unemployment rate was 3.7 per cent, in comparison to the State unemployment rate of 4.2 per
cent (DEEWR, 2012).
Until 2008, Gunns Limited operated a sawmill in the town of Yarloop. The company cited the lack of
viability of the sawmill subsequent to the industry restructuring in 2004 as the reason for the mill’s
closure in 2008 (ABC, 2008). The mill’s 29 workers were offered employment at other operations but it
is unknown how many, or if any, took up the offer. In the consultations undertaken in 2012 one harvest
and haul contractor noted the closure of the Yarloop mill had a significant impact on the business.

SEIA Draft Forest Management Plan 2014-2023
5 Current socio-economic status in the study area (baseline)
42908086/1/03 49
Figure 5-5 Industries of employment (Shire of Harvey)
Source: ABS Census of Population and Housing, 2006
Summary
Harvey has a diverse economy supported by agriculture, horticulture and mineral resources and
maintains a strong link to the forest products industry. The population in the Shire has been growing at
a rapid rate since 1981. It remains a young population despite the declining trends in recent years of
people aged less than 15 years. The Shire is well served with education and health services and
supports a thriving tourist industry.
5.1.7 Shire of Manjimup
The Shire of Manjimup covers an area of 7,027 km2 and was first settled by Europeans in 1856. The
key towns within the Shire are Manjimup, Northcliffe, Pemberton and Walpole with smaller settlements
at Deanmill, Jardee, Palgarup, Quinninup and Windy Harbour. About 85 per cent of the Shire (600,000
ha) is national park or State forest.
The Shire has strong links with the forest products industry and is home to other industries including
horticulture, agriculture, viticulture, dairying, aquaculture and tourism.
Table 5-11 provides selected social and economic time series data for the Shire of Manjimup. This
LGA has shown a decreasing trend in the size of the population since the 1996 Census. This
reduction in population size corresponds to a decreasing trend in the population aged under 15 years
and an increasing trend in the proportion of the population aged over 65 years. In 2011 the population
of the LGA was 9,155 people. The Department of Planning forecasts a population of between 9,200
and 12,700 in the Shire by 2026 (Department of Planning, 2012).

SEIA Draft Forest Management Plan 2014-2023
5 Current socio-economic status in the study area (baseline)
50 42908086/1/03
Table 5-11 Shire of Manjimup – selected population data
1981 1986 1991 1996 2001 2006 2011
2011 WA
Population 8,953 9,669 10,302 10,256
10,030
9,386 9,155
% Change 8.0% 6.5% -0.4% -2.2% -6.4% -2.5%
Population under 14 years (%) 29.0% 32.9% 31.9% 27.9% 25.4% 22.9% 21.7% 19.7%
% change 13.7% -3.2% -12.6% -8.8% -10.1% -5.0%
Population over 65 years (%) 7.2% 7.2% 7.9% 9.1% 10.9% 13.4% 15.9% 12.3%
% change -0.4% 8.9% 16.2% 19.5% 22.5% 18.8%
Employed Persons 4,076 3,868 4,261 4,652 4,732 4,132 n.a.
Labour Force Participation Rate 71.4% 66.8% 68.6% 72.0% 74.1% 69.0%
Source: ABS Census of Population and Housing, 2006
Education and training
Children in the Shire of Manjimup are served by six primary and secondary schools catering for
kindergarten to year 12, a high school that caters for years 8 to 12 and a TAFE College, as shown
below.
Table 5-12 Schools in the Shire of Manjimup
School Comment
East Manjimup Primary School K-7, school has had relatively constant student numbers between 2008
and 2012, on average 283)
Manjimup Primary School K-7, decreasing student numbers since 2008, down 24%
Walpole Primary School K-7, slight increasing trend in primary school student numbers
Kearnan Catholic College K-12, 336 enrolments in 2011 increasing from 293 in 2008
Pemberton District High School K-10, increasing numbers of primary school students between 2008 and
2012 and relatively constant, albeit low, lower secondary school students
Northcliffe District High School K-10, decreasing student number trends for lower secondary students
halving between 2008 and 2012 30 to 16, primary student numbers
remain relatively constant
Manjimup Senior High School 8-12, 24% reduction in lower school enrolments between 2008 and 2012
and 19% reduction in upper secondary enrolments over same period)
South West Institute of Technology
(Manjimup)
Offers courses in General Education, Aged Care, Childcare, Conservation
and Land Management, Horticulture, Information Technology, Office
Administration, MYOB, Visual Art, Teacher's Assistant, and Special
Needs Assistant. Also offers short courses for forklift, chainsaw and
Chemcert.
Source: Education Department of WA Schools Online
Health services
Two hospitals are located in Manjimup. Warren District Hospital is a day hospital and public day
surgery with 30 beds available. The hospital offers coronary care, accident/emergency, dietetic,

SEIA Draft Forest Management Plan 2014-2023
5 Current socio-economic status in the study area (baseline)
42908086/1/03 51
geriatric, home care, maternity, medical, mental health, anaesthetics, occupational therapy,
outpatients, paediatric, pathology, pharmacy, physiotherapy, podiatry, radiology, social work, speech
therapy, and surgical services. Baptistcare Moonya is a private nursing home with 65 beds.
Horticulture, agriculture and viticulture industry
The estimated GRP for the Shire of Manjimup has grown steadily by an average of 6.7 per cent per
annum since 2006-07 to over $527.2 million in 2010-11. The agriculture and forest products industry
generated the highest proportion of industry value-add in 2010-11, accounting for over 15 per cent of
the economy total value-add (AEC Group, 2012b). The AEC Group reported that Manjimup LGA‘s
reliance on agriculture and forestry poses a potential risk to the sustainability of the town of Manjimup.
Its heavy reliance on individual sectors was considered to expose the wealth and well-being of
residents to the volatility of those industries – and in the case of export industries, the volatility of
international markets and world prices.
Viticulture began with research by the Department of Agriculture and Food in the mid 1970’s, with
planting trials and detailed climatic investigations. Pemberton’s vineyards were established in the
1980’s, and the region is regarded as an area of influence in the State’s premium wine sector.
It is estimated that the farm gate value of wine in WA is $91 million; the highest valued sector of the
horticulture industry in the State. The contribution of the wine grape industry to the State’s economy is
$380 million dollars, representing 34 per cent of the horticulture industry.
Annual exports of 7.1 million litres of WA wine is worth an estimated $34.6 million. In 2009-10
Manjimup wineries produced 13,059 litres of bottled wine at a value of $98,711 (0.3 per cent of the
WA total value of bottled wine produced). Pemberton wineries produced 156,186 litres valued at
$1,190,830 or 3.2 per cent of total WA production (DSD, n.d.).
Tourism
The Shire Community Directory notes;
Following the restructure of the timber industry in 2001, Manjimup has emerged as a modern and
progressive town with excellent business and shopping facilities. Its profile as a tourist destination is
increasing with hotels, motels, caravan parks, farmstays, guest houses, chalets and mill house type
accommodation catering for a variety of needs.
Manjimup has numerous tourism attractions within the town and in the wider LGA. Some of those
attractions include Diamond Tree Lookout, Fonty’s Pool, King Jarrah Tree, annual Manjimup Cherry
Harmony Festival and the Manjimup Timber and Heritage Park (Manjimup Visitor Centre, n.d.). The
Shire of Manjimup is one of the top five LGAs visited in the south west. Over the period 2009 to 2011
the Shire received an annual average of 117,000 visitors representing 8% of the total number of
visitors to the south west region (Tourism WA, 2011).
In recent years tourism has experienced a downturn. Allowing for differences in the reporting of
tourism data, room occupancy rates for the Shire of Manjimup have remained relatively consistent
although low, from 36 per cent in the quarter ending December 2007 to 35 per cent in the quarter
ending March 2012. In March 2012 there were 19 accommodation establishments providing 424
rooms with the occupancy rates suggesting that this number currently represents an over-supply. The

SEIA Draft Forest Management Plan 2014-2023
5 Current socio-economic status in the study area (baseline)
52 42908086/1/03
low occupancy rates have led to a reduction in takings from accommodation from approximately $2
million in the December quarter 2007 to approximately $1.25 million in the March quarter 2012.
A study, conducted in 2004, investigated the value of national parks, marine parks and forests for
tourism and recreation in Australia (Carlsen and Wood, 2004). One of the regions investigated closely
aligns with the Shire of Manjimup, with a small portion lying in the Shire of Denmark. Researchers
concluded that the proportion of total spend by visitors that could be attributed to the national parks,
marine parks and forests was 88 per cent, that is, approximately $62 million of the total annual
expenditure of $70.5 million in 2004 was because of these environmental assets. These calculations
have not been scrutinised in this SEIA and further analysis would be required to ascertain whether
they remain valid.
The total expenditure in the broader south west region in 2004 was $607.7 million (SWDC, 2011). The
expenditure noted in the Carlsen and Wood study represents approximately 12% of the total
expenditure in the region. Two important findings emerge from this; tourism makes an important
economic contribution to the Shire of Manjimup, and there is room for growth in the tourism sector in
the Shire of Manjimup to attract a greater number of visitors to the south west.
Manjimup: A ‘SuperTown’
Manjimup has been identified by the State Government as one of its ‘Super Towns’. Royalties for
Regions funding of $85.5 million is being invested to underpin sustainable growth, help nine regional
towns, including Manjimup, accommodate and maximise the benefits of population growth and ‘kick-
start’ projects that will also attract other funds, including private sector investment.
The Shire of Manjimup in collaboration with the Community Reference Group, AEC Group and
relevant State Government agencies has identified a number of strategic projects that are designed to
prompt economic and population growth in the town. The projects have been identified as
transformational projects that will be pursued as business cases for Royalties for Regions
(SuperTown) funding. The five strategic projects are:
1. Agricultural promotion and expansion: marketing and promotion of agricultural production in the
district, food processing, research/development, new crops as well as investment opportunities in
regards to supporting food security in the future;
2. Revitalising the town centre: including main street revitalisation, timber and heritage park
development, improved access and flow as well as attraction of business accommodation;
3. Upgrade and relocation of airport: to facilitate pilot training, recreational airport industry
development and ancillary services, facilitate access for residents as well as reinforce airport’s role
in emergency services;
4. Age friendly town: including initiatives to attract older residents, retirees as well as aged care
facilities and health services;
5. Research into economic opportunities: undertake further study of other areas of economic growth
including timber innovations (e.g. veneering / lamination plant to process karri thinning / plantation
timber) and affordable housing.
The Royalties for Regions investment into the town of Manjimup is expected to facilitate the leveraging
of the region’s existing strengths in agriculture, forestry and tourism to undertake higher value-adding
activities. Initial project funding for 2012-13 has seen an investment of $6.96 million towards
agricultural expansion and $5.71 million towards revitalisation of Manjimup town centre.

SEIA Draft Forest Management Plan 2014-2023
5 Current socio-economic status in the study area (baseline)
42908086/1/03 53
A business case has been prepared to support the agricultural expansion project and states the
following:
Since the last major timber industry restructuring in 2000, agriculture has emerged as Manjimup’s
main economic driver. In response to this industry restructuring, formative work was undertaken under
the “Manjimup - New Opportunities in Agriculture and Horticulture” (NOAH) initiative to aid in the
expansion of agriculture to offset the economic loss arising from the decline in the timber industry.
Some modest positive outcomes were achieved; mainly the development of green tea and some
international trade linkages however there was insufficient funding and a lack of governance structure
to sustain this initiative (Shire of Manjimup, 2012).
Forest Products Industry
As noted previously, the Shire of Manjimup comprises about 83 per cent national park, state forest,
nature reserve or other reserve land with the remaining 17 per cent alienated private land. The forest
products industry has been an important part of the Manjimup community since the mid 1800s.
Reductions in the native timber harvest volumes from 2003, and a combination of log quality and log
cost issues led to the eventual (temporary) closure of the State’s largest saw mill, Deanmill, in 2010
with the loss of 40 positions, followed by Australian Craftwood Timber’s operation in Palgarup and the
loss of 18 employees . This resulted in an overall loss of over 100 businesses and 700 jobs. While a
Government funded industry assistance program did aid individuals in the Shire, the Council has
suggested during consultations that the packages resulted in population loss as people moved to the
coast and little new investment in the Shire (Shire of Manjimup, 2011).
The Deanmill sawmill re-opened in March 2012 with initial staffing of 31 employees and this has since
increased to 42 employees.
According to a Shire Council representative, uncertainty has pervaded the Shire since the restructure
process began and this has affected business decisions and future developments. With the reopening
of the Deanmill sawmill by new owners Auswest in 2012, the Shire president described it as a “shot in
the arm for the local economy” (ABC News, 2012).
Employment
The major industry of employment for the Shire of Manjimup at the 2006 Census was ‘agriculture,
forestry and fishing’. The manufacturing and retail industries were also significant employers in the
region, as shown in Figure 5-6 below. The long-established forest products industry remains a
significant employer in the Shire.
The number of people employed across the Shire has remained relatively stable over the past 30
years, peaking in 2001 before gradually declining to 2011. Data from the Department of Education,
Employment and Workplace Relations indicates 300 people were unemployed in the Shire in
December 2011, reflecting an unemployment rate of 5.0 per cent (DEEWR, 2012).
At the time of the 2006 Census, 24 per cent of females aged 20-24 years were neither working nor
studying (4 per cent were unemployed and 20 per cent were not in the labour force). This was
substantially higher compared with Australia (16 per cent neither working nor studying, comprising 4
per cent unemployed and 12 per cent not in the labour force). In comparison, 11 per cent of males

SEIA Draft Forest Management Plan 2014-2023
5 Current socio-economic status in the study area (baseline)
54 42908086/1/03
aged 20-24 years were neither working nor studying (6 per cent were unemployed and 5 per cent
were not in the labour force).
Four sawmills are located within the Shire of Manjimup and provide employment for approximately 157
people. The FPC also have an office in Manjimup where ten employees are based. In addition,
approximately 40 people employed in the harvest and haul sector reside in the Shire.
In 2011, Rio Tinto announced that it was considering flying workers in and out of Manjimup to service
its iron ore operations in the Pilbara. The Shire of Manjimup Shire was supportive of this and had been
investigating establishing Manjimup as a FIFO base in an attempt to retain its population after the
closure of the local timber mill.
As part of the SuperTowns initiatives the airport at Manjimup will be upgraded and this may facilitate
direct flights between Manjimup and the Pilbara thus creating employment opportunities for local
residents.
Figure 5-6 Industries of employment (Shire of Manjimup)
Source: ABS Census of Population and Housing, 2006
Summary
Approximately 80 per cent of the land area of the Shire of Manjimup is either national park, state
forest, nature reserve or other reserve land. Of the LGAs reviewed for this study, Manjimup is the only
shire to experience a decrease in its population over the past 30 years. Since 2001 the population has
decreased by almost nine per cent.

SEIA Draft Forest Management Plan 2014-2023
5 Current socio-economic status in the study area (baseline)
42908086/1/03 55
The Shire of Manjimup Council noted declining economic activity in the area evidenced by empty retail
stores accompanying a decline in the population. The State Government is seeking to address this
decline through the implementation of the SuperTowns initiative which aims to develop a more
diversified economy that is not dependent on the forest products industry.
5.1.8 Shire of Murray
The Shire of Murray, with a population of 13,591 at the 2011 Census, is located in the Peel-Harvey
coastal plain. The shire encompasses the Peel Harvey Estuary which forms part of the Peel Yalgorup
Wetlands, acknowledged internationally as a Ramsar conservation site (Shire of Murray 2008). There
are nine townships in the Shire of Murray: Pinjarra, Dwellingup, Ravenswood, South Yunderup, North
Yunderup, Barragup, Furnissdale, Coolup, and North Dandalup.
The Shire is expected to experience substantial growth over the next two decades as a result of
extensive subdivision of land to accommodate urban residential expansion (Shire of Murray 2008).
The principal industries in the Shire are bauxite mining, agriculture, forestry, mineral processing and
tourism.
Table 5-13 Selected population data for the Shire of Murray
1996 2001 2006 2011 2011 WA
Population 9,190 10,061 11,456 13,591
% Change n.a. 9.5% 13.9% 18.6%
Population under 14 years (%) 24.3% 21.0% 20.7% 20.7% 19.7%
% change n.a. -13.6% -1.7% 0.1%
Population over 65 years (%) 12.0% 14.8% 17.0% 18.2% 12.3%
% change n.a. 23.3% 14.9% 7.4% n.a.
Employed Persons 3,297 3,702 4,716 n.a. n.a.
Unemployed Persons 473 485 231 n.a. n.a.
Labour Force Participation Rate 64.4% 64.8% 69.2% n.a. n.a.
Source: ABS Census of Population and Housing
Employment
At the 2006 Census, manufacturing was the main industry of employment in the Shire of Murray
followed by construction and retail trade. Mining is carried out in the Shire with a bauxite mine near
Dwellingup and alumina refining in Pinjarra, which accounts for 33 per cent of local jobs. Agriculture
and forestry provided fewer than ten per cent of jobs (Mayes, 2012).
The Shire Murray’s March 2011 unemployment rate of 6.2 per cent is substantially higher than that in
WA at large; while the median weekly income (at Census 2006) was very low: $391 compared to the
state average of $500.
A 2010 youth survey conducted by the Shire (SoM, 2010) identified generational unemployment and
the lack of full-time, part-time and casual employment in the area as issues of concern for youth and
youth service providers.

SEIA Draft Forest Management Plan 2014-2023
5 Current socio-economic status in the study area (baseline)
56 42908086/1/03
Figure 5-7 Industries of employment (Shire of Murray)
Source: ABS Census of Population and Housing, 2006
Education
There are six schools catering for primary school children and one school for secondary school
students although the Austin Cove Baptist College will take students from Kindergarten to Year 12 by
2015. Enrolments at these schools totals approximately 1,594 primary school and 673 secondary
school students which represents 80% of the population in the Shire aged between 5 and 19 (Table
5-14).
In relation to post-secondary education, students can attend Challenger TAFE and Murdoch University
Peel Campus. Opportunities for timber related training are provided through the Australian School of
Wood at Dwellingup.
Table 5-14 Enrolment in schools in the Shire of Murray
2008 2009 2010 2011 2012
Austin Cove Baptist College 0 0 0 350 ~550
Carcoola Primary School 130 135 143 157 148
Dwellingup Primary School 57 60 65 74 60
North Dandalup Primary School 93 97 87 84 85
Pinjarra Primary School 588 563 594 576 621
Pinjarra Senior High School 672 655 583 567 573
St. Joseph’s Catholic Primary School n.a. n.a. n.a. n.a. 230
Source: Education Department of Western Australia Schools Online

SEIA Draft Forest Management Plan 2014-2023
5 Current socio-economic status in the study area (baseline)
42908086/1/03 57
Health services
The Peel region encompasses five LGAs – Mandurah, Serpentine Jarrahdale, Murray, Waroona, and
Boddington. In Peel Away the Mask II, prepared by the Peel Community Development Group (Mayes,
2012), the health and community services of the Shire of Murray are discussed. The reports states
that the GP to population ratio is 121.9 per 100,000 people, the highest in the region but significantly
lower than the WA of 157.2 per 100,000 people.
Murray hospital is located in Pinjarra along with most of the medical, dental, physiotherapy and
chiropractic services, Home and Community Care and two aged accommodation services. There is no
local mental health or crisis counselling services and no locally based ambulance service.
Tourism
In 2007, tourism activity in the Shire of Murray was estimated to have contributed $27.5 million of
direct spending in the local community and employing about 230 people (5.1% of the total workforce).
The Shire of Murray receives around 460,000 visitors each year. Heritage tourism is a major drawcard
for the area with attractions including Fairbridge Valley, Edenvale Complex, Coopers Mill and the
Railway Heritage Centre. The area is also developing nature-based tourism with several companies
offering adventure tours that take in canoeing, water sports, white water rafting and, walking trails.
Summary
The Shire of Murray has a growing population that is well served with education and health services.
The unemployment rate of 6.2 per cent is high in comparison to other LGAs considered in this study
and the state unemployment rate of 4.2 per cent.
5.1.9 Shire of Nannup
The Shire of Nannup has an area of 2,953 km2 with the administrative centre located in the town of
Nannup. Approximately 85 per cent of the land area of the Shire is state forest, national park, vacant
crown land or unvested reserve land. Nannup is known as a timber town.
Table 5-15 provides selected social and economic time series data for the Shire of Nannup. At the
2011 Census the population of the Shire of Nannup was 1,262 people. There has been an increase of
around 19 per cent (200 people) in the thirty years from 1981 to 2011. Recently released population
forecasts for the LGA suggest an upper population projection of 1,400 by 2026. Given the growth rate
to date it seems likely this will be exceeded (Department of Planning, 2012)
The increase in population is largely driven by an increase in the proportion of the population aged 65
years or more. This is likely the result of an influx of retirees opting for a ‘tree-change’ lifestyle. In 2011
this age group comprised about 18 per cent of the total population. Only seven per cent of the
population are aged between 15 and 24 years, suggesting that teenagers may be leaving the town for
schooling, while the older cohort of young people could be leaving for employment reasons.

SEIA Draft Forest Management Plan 2014-2023
5 Current socio-economic status in the study area (baseline)
58 42908086/1/03
Table 5-15 Shire of Nannup – selected population data
Source: ABS Census of Population and Housing
The timber and cattle industries continue to dominate Nannup's economy, although tourism and
floriculture/aquaculture are beginning to establish a presence in the Shire. In 2005/06 the value of
agricultural production was $15.1 million. A significant proportion of the Nannup population is
comprised of timber workers and their families.
Education and training
The Nannup District High School caters for students from kindergarten to year 10. Attendance over
the past five years has been increasing for primary school students and declining for lower secondary
school students. Students wishing to attend upper secondary school (i.e. years 11 and 12) travel to
other major centres such as Busselton, Bunbury and Perth. Travel is also required for students who
wish to gain tertiary or vocational education.
Health services
The Nannup Hospital provides limited services including emergency services, home and community
care, medical, occupational therapy, paediatrics and pharmacy. General practitioners services are
available at two centres within the town of Nannup.
Tourism
Tourism represents a significant section of the Nannup economy with visitor accommodation including
hotels, caravan parks, bed and breakfast and chalets. There is a comprehensive calendar of events,
including the Nannup Music Festival, Nannup Flower and Garden Festival, Ladies Garden Party,
Nannup Art Festival, Nannup Cup, Respect Yourself Forest Rally, Festival of Country Gardens,
Woodaburrup Cup, Boat Races and the Downhill Mountain Bike Championship attracting high
1981 1986 1991 1996 2001 2006 2011
2011 WA
Population 1,060 1,121 1,120 1,144 1,183 1,191 1,262
% Change 5.8% -0.1% 2.1% 3.4% 0.7% 6.0%
Population under 14 years (%)
n.a. n.a. n.a. 25.9% 21.3% 19.6% 15.9% 19.7%
% change n.a. n.a. n.a. n.a. -17.7% -7.8% -18.9%
Population over 65 years (%)
n.a. n.a. n.a. 9.6% 9.5% 13.3% 18.3% 12.3%
% change n.a. n.a. n.a. n.a. -1.5% 40.1% 38.0%
Employed Persons n.a. n.a. n.a. 463 526 545 n.a.
Unemployed Persons n.a. n.a. n.a. 67 48 27 n.a.
Labour Force Participation Rate
n.a. n.a. n.a. 71.8% 70.1% 71.6% n.a.
Population under 14 years
296 252 234 201
Population over 65 years 110 112 158 231

SEIA Draft Forest Management Plan 2014-2023
5 Current socio-economic status in the study area (baseline)
42908086/1/03 59
numbers of visitors to the area. However, its location away from the major tourist route of the South
West Highway, means that Nannup does not benefit from passing traffic to the same extent of other
small country towns in the south west region.
In the Shire of Nannup approximately 58 people were estimated to be employed in tourism in the Shire
in 2008 (Tourism WA, 2008).
Community
A Community Resource Centre has been established for the town of Nannup providing a range of
services to the community. The former Telecentre provides access to Centrelink, banking services,
volunteer resources, a community newspaper, vocational education including Certificate III and IV
traineeships and communications services.
A business initiative group has recently formed in Nannup to foster and promote local businesses
specifically and, in turn, help the community to prosper. This is a relatively new group that aims to act
as a lobby group for local businesses as well as promote the region and attract business.
Employment
The major industry of employment for the Shire of Nannup at the 2006 Census was ‘agriculture,
forestry and fishing’. Manufacturing was also a significant employer in the region as shown in Figure
5-8 below.
Generally, there has been a decline in employment in those traditional sectors of agriculture and
forestry from around 2001. To some extent the growth in the tourism sector has provided alternative
employment options however the employment base remains centred around agriculture and forestry.
Of the total workforce of 545, some 122 (or 22 per cent) were employed in the agriculture, forestry and
fishing industry (ABS, 2006).
A SWOT8 analysis conducted by the Shire in 2009 found several weaknesses related to a lack of
development of industries and a resultant lack of employment opportunities in the area. It appears that
there is some disagreement within the community as to whether to develop or to remain the same
(Shire of Nannup, 2011)
Currently the Nannup Timber Mill directly employs 57 workers which represents 7.2 per cent of the
Shire labour force and provides a significant proportion of local GRP.
8 Strengths, Weaknesses, Opportunities, Threats
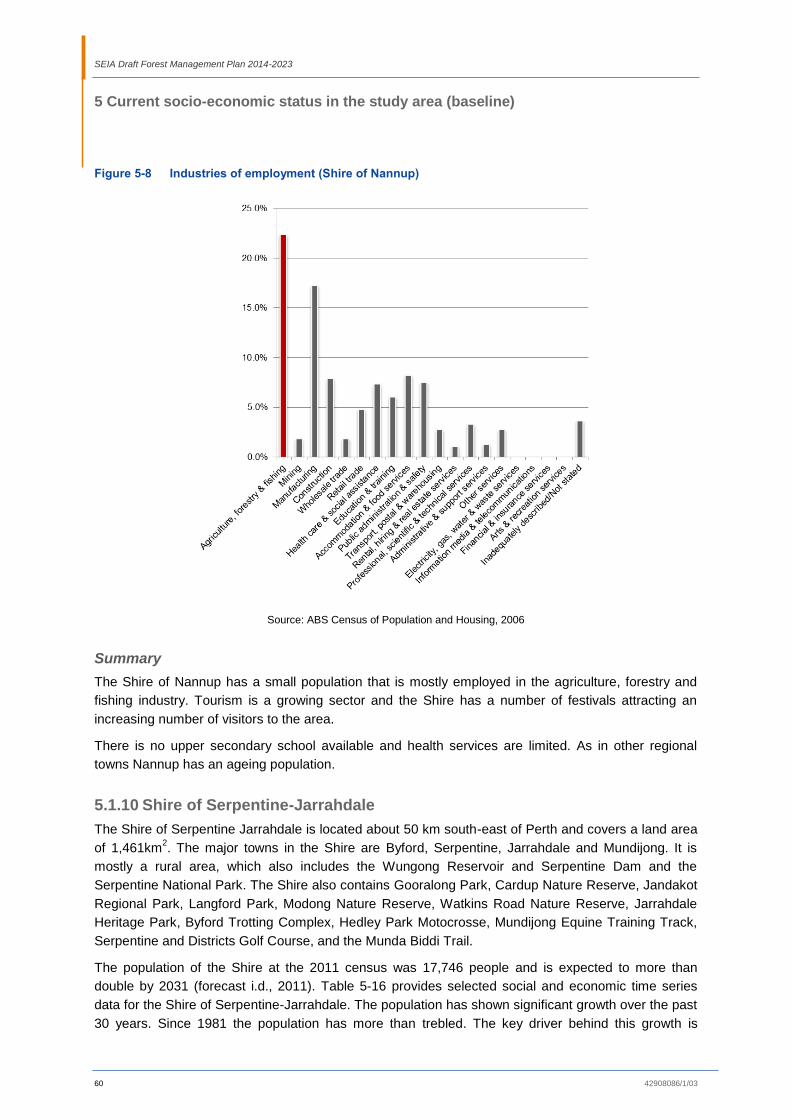
SEIA Draft Forest Management Plan 2014-2023
5 Current socio-economic status in the study area (baseline)
60 42908086/1/03
Figure 5-8 Industries of employment (Shire of Nannup)
Source: ABS Census of Population and Housing, 2006
Summary
The Shire of Nannup has a small population that is mostly employed in the agriculture, forestry and
fishing industry. Tourism is a growing sector and the Shire has a number of festivals attracting an
increasing number of visitors to the area.
There is no upper secondary school available and health services are limited. As in other regional
towns Nannup has an ageing population.
5.1.10 Shire of Serpentine-Jarrahdale
The Shire of Serpentine Jarrahdale is located about 50 km south-east of Perth and covers a land area
of 1,461km2. The major towns in the Shire are Byford, Serpentine, Jarrahdale and Mundijong. It is
mostly a rural area, which also includes the Wungong Reservoir and Serpentine Dam and the
Serpentine National Park. The Shire also contains Gooralong Park, Cardup Nature Reserve, Jandakot
Regional Park, Langford Park, Modong Nature Reserve, Watkins Road Nature Reserve, Jarrahdale
Heritage Park, Byford Trotting Complex, Hedley Park Motocrosse, Mundijong Equine Training Track,
Serpentine and Districts Golf Course, and the Munda Biddi Trail.
The population of the Shire at the 2011 census was 17,746 people and is expected to more than
double by 2031 (forecast i.d., 2011). Table 5-16 provides selected social and economic time series
data for the Shire of Serpentine-Jarrahdale. The population has shown significant growth over the past
30 years. Since 1981 the population has more than trebled. The key driver behind this growth is

SEIA Draft Forest Management Plan 2014-2023
5 Current socio-economic status in the study area (baseline)
42908086/1/03 61
related to the expansion of urban development and a subsequent increase in residents migrating from
Perth.
Unlike other LGAs in the study, Serpentine-Jarrahdale has a young population with almost a quarter of
the population aged less than 15 years. Conversely, the Shire has a lower proportion of people aged
over 65 years than other areas in the south west.
Table 5-16 Shire of Serpentine-Jarrahdale - selected population data
1981 1986 1991 1996 2001 2006 2011 2011 WA
Population 5,053 6,470 8,048 9,783 11,119 12,889 17,746
% Change 28.0% 24.4% 21.6% 13.7% 15.9% 37.7%
Population under 14 years (%) 30.1% 28.9% 26.4% 26.4% 25.1% 23.3% 23.5% 19.7%
% change -3.7% -8.7% -0.2% -5.0% -6.9% 0.9%
Population over 65 years (%) 5.3% 5.4% 5.8% 7.1% 7.2% 8.8% 9.0% 12.3%
% change 2.2% 6.4% 22.0% 2.0% 22.2% 2.6%
Employed Persons 2,104 2,582 3,357 4,360 5,453 6,364 n.a.
Unemployed Persons 97 255 415 299 45 163
Labour Force Participation Rate 67.4% 66.8% 69.2% 71.6% 73.0% 74.6%
Source: ABS Census of Population and Housing
Education and training
The Shire is generally well served with primary schools but does not have a secondary school.
Enrolments at the schools have been relatively stable over the past five years although Marri Grove
Primary School, north west of Byford, has increased its students numbers by nearly 60 per cent. A
new primary school and secondary school is planned to open in Byford by 2014 and the Department
of Education is working towards links to the Peel Education Campus, a multi-partnered facility hosting
co-located campuses of John Tonkin College, Challenger Institute of Technology, Career Enterprise
Centre and Murdoch University.
Table 5-17 Enrolment in schools in the Shire of Serpentine-Jarrahdale
2008 2009 2010 2011 2012
Jarrahdale Primary School 88 85 90 101 94
Mundijong Primary School 175 194 201 194 185
Serpentine Primary School 238 239 255 226 226
Byford Primary School 246 275 269 268 291
Marri Grove Primary School 390 450 482 535 616
Serpentine Jarrahdale Grammar School (Anglican) n.a. n.a. n.a. n.a. 473
Source: Education Department of Western Australia Schools Online
Improving access to education opportunities for secondary (and tertiary students) has been identified
as a need by the Shire. In 2006, a Youth Survey undertaken by the Serpentine Jarrahdale Youth
Advisory Council found that many young people were attending schools outside the Shire including
the following schools:

SEIA Draft Forest Management Plan 2014-2023
5 Current socio-economic status in the study area (baseline)
62 42908086/1/03
Armadale Christian College Armadale Senior High School
Cecil Andrews Senior High School Dale Christian School
Frederick Irwin Anglican School John Wollaston Anglican Community School
Kelmscott Senior High School Kolbe Catholic College
Lumen Christi College Mandurah Baptist College
Mandurah Catholic College Pinjarra Senior High School
Penrhos Ladies College Tranby College (Mayes, 2012)
Pioneer Village School
Health services
The Shire of Serpentine Jarrahdale is serviced by critical health infrastructure, including that located in
the adjacent shires of Armadale and Murray. The Shire is reportedly under-serviced in terms of
medical staff and infrastructure. Data from 2008 indicates the Shire has ten GPs equating to a GP-
Population ratio of 60.6 per 100,000 people, in comparison with WA, which has a ratio of 157.2 GPs
per 100,000 people. The figures tend to reinforce community perceptions that the Peel region and by
extension, Serpentine Jarrahdale, is facing a shortage of GPs (Mayes, 2012).
Employment
Of the total workforce of 6,366 in 2006, some 348 (5.5%) were employed in the agriculture, forestry
and fishing industry in 2006 (ABS, 2006).
In 2006, the major industries of employment were the construction and manufacturing sectors. A
significant number of people travel from the Shire to the Kwinana industrial zones for employment in
these two sectors. The proximity of the Shire to the Perth metropolitan region also provides
employment opportunities for Shire residents. The Shire is home to a substantial FIFO/DIDO
workforce, commuting either to Boddington or to major resource projects around WA.
There are three major forest related businesses in the Shire directly employing about 28 people.
These include sawmills, harvest and haulage contractors and secondary processors

SEIA Draft Forest Management Plan 2014-2023
5 Current socio-economic status in the study area (baseline)
42908086/1/03 63
Figure 5-9 Industries of employment (Shire of Serpentine-Jarrahdale)
Source: ABS Census of Population and Housing, 2006
Summary
The Shire of Serpentine-Jarrahdale lies within close proximity to the Perth metropolitan region and is
experiencing rapid population growth. Despite its proximity to Perth it is mostly a rural area with
agricultural and equine industries although is developing a large residential estate.
The economic base of Serpentine Jarrahdale Shire is still strongly oriented towards primary industries,
but about 50 per cent of Shire residents work outside of the Shire boundaries. Other important
industries include construction (driven by housing growth in the region) and other services, such as
retail trade, education and health.
5.2 Regional economic base
This section describes the regional economic situation so as to give context to any changes that may
result from the implementation of the Draft FMP. Economic (and social) impacts do not occur in
isolation, rather they occur in relation to external events and in response to other government policy
decisions in multiple portfolio areas. The section provides a baseline of the economic activity in areas
overlapping the Draft FMP. That is, those areas where the Draft Plan has the potential to affect, or is
affected by, including tourism, mineral resource activity, recreation, and employment.
The south west of WA has experienced considerable economic and social change over the last 30
years, e.g. growth of the wine industry, change in forest management, increased mining activity, and
dairy industry deregulation. All of this provides a context against which the potential impacts of the
Draft FMP must be considered.

SEIA Draft Forest Management Plan 2014-2023
5 Current socio-economic status in the study area (baseline)
64 42908086/1/03
5.2.1 The south west economy
ABS collects data on gross state product (GSP)9 and industry gross value added (IGVA)
10, however,
these data are aggregated at the state level into broad industry categories; for example, agriculture,
forestry and fishing are aggregated into one category of the same name and presented at the state
level. This makes it difficult to determine the relative contributions of industries to the WA economy
and the regional importance of those industries. However, over the past ten years the industries that
have made the greatest contribution are:
mining transport, postal and warehousing
construction professional scientific and technical services
manufacturing ownership of dwellings
Table 5-18 presents the gross value added (current prices) from 1990 to 2010 by industry in WA, and
the percentage change between 2000 and 2010. Agriculture, forestry and fishing contributed some
two per cent in 2010 of the total industry gross value added, having declined from four per cent of
gross value in 2000. These data do not disaggregate agriculture, forestry and fishing, but the data
highlight the low rate of change across the assessed period. These values are nominal and do not
reflect changes in real value, adjusted for changes in the inflation rate over this period.
Table 5-18 Industry gross value added - WA ($b)
Jun-1990
($b)
Jun-2000
($b)
Jun-2004
($b)
Jun-2005
($b)
Jun-2010
($b)
% change 2000-10
Agriculture, forestry and fishing 2.20 2.85 3.81 3.34 3.38 19%
Information media and telecommunications 5.68 12.43 16.33 20.87 49.50 41%
Accommodation and food services 4.09 5.54 8.70 8.78 11.29 77%
Arts and recreation services 1.17 1.34 2.19 2.43 3.34 84%
Health care and social assistance 3.21 5.03 7.30 8.22 21.04 89%
Rental, hiring and real estate services 1.41 2.18 3.52 4.25 6.14 98%
Manufacturing 1.65 2.99 4.52 4.34 6.47 104%
Public administration and safety 0.60 1.26 1.57 1.46 2.23 108%
Education and training 2.31 3.33 5.02 5.35 9.77 115%
Retail trade 0.90 1.88 2.29 2.47 2.65 116%
Other services 1.59 3.41 4.37 4.71 8.27 124%
Financial and insurance services 1.08 1.41 1.69 1.91 2.78 143%
Administrative and support services 1.50 3.27 4.40 4.80 9.84 148%
Electricity, gas, water and waste services 0.58 1.29 2.14 2.25 3.21 149%
Ownership of dwellings 1.38 2.51 3.28 3.42 5.22 166%
Wholesale trade 1.43 2.43 3.30 3.26 5.23 182%
Transport, postal and warehousing 2.07 4.08 4.84 5.45 7.70 193%
Professional, scientific and technical services 0.18 0.49 0.66 0.67 0.89 200%
Mining 0.65 1.11 1.79 1.69 2.48 298%
Construction 2.41 4.31 5.13 5.45 11.45 319%
Total all industries 36.10 63.12 86.82 95.11 172.85 174%
Source: ABS 2011b
9 GSP is a measure of the production of goods and services within a state or territory.
10 IGVA measures the value of industry production.

SEIA Draft Forest Management Plan 2014-2023
5 Current socio-economic status in the study area (baseline)
42908086/1/03 65
As described in previous sections the study area has a diversified economy with the key industries
including:
mineral extraction, processing and manufacturing;
agriculture and food production;
tourism; and
forest products.
Summary information related to these economic activities is provided below.
5.2.2 Mineral extraction
Approval to explore or mine Crown land is determined by the tenure of the area and is regulated by
the Mining and EP Acts. State legislation means that mineral and petroleum operations are not
generally precluded on State forest and timber reserves and, hence, the FMP does not materially
affect such activities on those land categories.
Mining and mineral processing makes the largest contribution to the economy in the south west
region, with coal, alumina and mineral sands making the largest contributions. In 2010-11 mineral
extraction and mineral processing made a contribution of $5.7 billion and employed more than 16,000
people. Table 5-19 shows the socio-economic contribution of mining in the area covered by the FMP
referring to the output value and the estimate employment.
Table 5-19 Mining values by commodity in the study area ($ million)
Commodity Local Government Area Output value 2010-11
Estimated direct employment
2010-11 ($ millions)
Metals: Copper; Gold; Silver;
Alumina
Boddington, Waroona/Murray 5,171 13,403
Construction Materials: Silica
Sand; Limes and-Limestone;
Gravel; Sand; Clay Shale
Albany, Cockburn, Collie,
Denmark, Gingin, Kalamunda,
Kwinana, Manjimup,
Rockingham, Swan, Wanneroo
44 450
Heavy Mineral Sands: Ilmenite;
Leucozene; Mineral Sands
Concentrate; Zircon; Synthetic
Rutile
Bunbury, Capel, Dardanup 104 1,445
Other: Spodumene; Tin;
Spongolite; Coal
Bridgetown-Greenbushes,
Collie, Plantagenet
421 1,193
Total 5,740 16,491
Source: Department of Mines and Petroleum
In recent years there have been growing calls for the south west region to be protected from mining. A
proposal by Vasse Coal to mine in Margaret River generated community opposition in 2010.
Subsequently, the Minister for Environment upheld an EPA decision to veto the plan. A new
application to explore in the area by Canadian company Western Coal was received in the first half of
2012.
In July 2012 the State Government took steps to prevent future coal mining in the Margaret River area
by terminating all pending applications for coal exploration activities within a 230-square kilometre
zone. The Mines and Petroleum Minister said the decision followed Environmental Protection Authority

SEIA Draft Forest Management Plan 2014-2023
5 Current socio-economic status in the study area (baseline)
66 42908086/1/03
(EPA) advice which indicated coal mining in the area posed an unacceptable environmental risk.
Future applications for exploration or mining activities for commodities other than coal in the Capes
region would be reviewed on a case by case basis (Moore, 2012).
Greens MP Giz Watson introduced the Mining (Community Protection) Amendment Bill 2011 to
parliament in 2012 to amend the Mining Act 1978. The Bill seeks to address community concerns
about the capacity of the Mining Act 1978 to override local or regional planning schemes. The Bill
addresses these concerns by:
1. Expanding the discretion of the Minister for Mines to exempt any land from mining; and
2. Making any application for the grant of a mining tenement subject to planning instruments.
What impacts these policy and statutory amendments may have on the mineral resource sector in the
south west of the state have not been assessed. However, any policy direction that limits mineral
resource activity in the south west of WA will represent opportunities lost in terms of potential
contribution to GDP and reduces future employment opportunities. In isolation, these decisions may
have little effect but if the cumulative effects of low levels of tourism (see below) and reducing activity
in the forest products sector are taken into account, then long-term impacts to the region may be more
substantial.
5.2.3 Agriculture and food production
In 2010-11 the gross value of agricultural production in WA was approximately $5.4 billion, a decrease
of 6.8 per cent (or $366 million) from 2009-10 (ABS, 2012).
Agricultural production in the south west region is shown in Table 5-20. Total agricultural production in
2009-10 was $639 million. The major contributors to agricultural production were milk ($120 million),
vegetables ($113 million), fruit ($110 million), and cattle ($95 million).
Trends in the value of agricultural production across the South West Region (as defined by the
Department of Regional Development and Lands) are shown in Table 5-20. Note that these values are
at ‘farmgate’ and do not include the value of secondary processing (as in wine production, cheese
manufacture etc). There has been a 16 per cent increase in the total value since 2007, with most of
that increase occurring in horticultural crops and milk production. Both of these industries are
important in the local governments where forest products industry is also locally important.
Table 5-20 Trends in the value of agricultural production in the South West ($ million at farm gate)
Enterprise $million (year
ending 30 June)
2007 2008 2009 2010
Cattle 105.4 63.3 66.2 95.7
Sheep 15.1 27.0 31.0 28.8
Pigs & poultry 6.1 4.4 3.4 5.5
Other 0.4 0.2 0 0
Total livestock disposal 127.1 94.9 100.6 130.0
Milk 93.5 114.9 150.0 120.1
Wool 32.8 29.6 23.9 26.0

SEIA Draft Forest Management Plan 2014-2023
5 Current socio-economic status in the study area (baseline)
42908086/1/03 67
Enterprise $million (year
ending 30 June)
2007 2008 2009 2010
Other 0.9 0 1.0 0.1
Total live produce 127.2 144.6 174.9 146.2
Fruit 58.9 73.8 88.1 110.0
Grapes 63.9 71.5 50.3 87.7
Vegetables 77.3 114.5 113.2 113.0
Broadacre crops 95.8 131.3 96.9 52.5
Total crops 296.0 391.1 348.5 363.2
Total value of agricultural production 550.3 630.6 624.0 639.4
Department of Regional Development and Lands (based on ABS data).
Advice from the Department of Agriculture and Food is that structural adjustment continues to occur in
the agricultural industries in the South West, as a result of increasing competition for land and water
adjacent to major population centres (coastal strip south of Perth, greater Bunbury), and the need to
develop economies of scale in industries such as dairying and horticulture.
For example, in milk production, which is the largest single agricultural industry in the South West, the
number of dairy farms has decreased from 222 in 2007 to 170 in 2011, and the average herd size has
increased over the same period from 270 to 320 cows (Dairy Australia www.dairyaustralia.com.au
/Statistics-and-markets/Farm-facts/Cows-and-Farms.aspx accessed 2 August 2012). Further, there is
a gradual move in the locus of the industry towards the south away from population centres. In the last
two years, there has been significant price pressure on the dairy industry with some reduction in
production (5.5% decline between 2011 and 2012 (Dairy Australia, www.dairyaustralia.com.au/
Statistics-and-markets/Production-and-sales/Latest-Statistics.aspx accessed 2 August 2012). In the
last two years, there has also been a slump in grape and wine prices, with the result that some
vineyards have been pulled out.
Currently about 5 per cent of the South West workforce are involved in agriculture. As labour
productivity increases, employment in the agricultural sector decreases on farm, although comparative
data for 2001 and 200611
presented in Table 5-20 show that post-farm gate processing is now an
important and growing employer in the South West. The trend towards decreased on-farm
employment and more post-farm gate processing is likely to continue but overall the agriculture and
food sector is likely to have less, not more employment opportunities.
As the region’s industry composition shifts away from agriculture and employment opportunities in that
sector decrease there will be more competition in the labour market in the region. If this is coupled
with fewer employment opportunities in other sectors it may result in a loss of population as people
move out of the region to find meaningful employment elsewhere.
11
Note: Community Profiles showing industry of employment have not yet been released by the ABS.

SEIA Draft Forest Management Plan 2014-2023
5 Current socio-economic status in the study area (baseline)
68 42908086/1/03
Table 5-21 Numbers of people employed in agriculture and fishing in the South West
Industry Numbers employed
2001 2006
Agriculture 5,070 4,294
Fishing 110 84
Support services for Agriculture, fishing and forestry* 178 200
Food and beverage manufacture 1,702 2,291
Total in agriculture and food sector 7,060 6,869
Total south west workforce 68,473 76,805
Source: ABS 2001 and 2006
5.2.4 Tourism
5.2.4.1 Level of activity
Tourism is an important industry in the South West12
. Regional expenditure in 2010 in the broader
South West region was $881 million, with 1.6 million visitors and 1.7 million visitor nights. Given its
isolation from the rest of Australia, 90 per cent of the domestic visitors are from WA, and there is a
high percentage (85%) of repeat domestic visitation.
In Table 5-22, key tourism indicators for the South West are benchmarked against national standards
and the Tropical North Queensland, an internationally recognised tourism destination. The data
presented show that tourism is relatively more important in the South West than at national scale, and
has some similar attributes to those found in Tropical North Queensland, except in the area of
international visitation where it lags far behind.
Table 5-22 Significance of the tourism industry
Indicator South West Tropical North Qld Australia
Economic importance 4.8% 9.7% 3%
Tourism business numbers (%age of total businesses)
3,999 (18.1%) 5,282 (21.9%) 20.2% (18.2% in regions)
Employing businesses (%age of all tourism businesses)
2,072 (51.8%) 2,700 (51.1%) 39.7%
Accommodation establishments (as at March 2011)
147 228 na
Airports/ Ports Domestic airport Domestic and international airports/port
Domestic and international airports/
ports
Attractions Food/wine; Beaches; Nature
Nature; Indigenous culture; Beaches
na
Domestic overnight visitor nights 5.7 m 8.3 m na
Domestic expenditure $1,073 m $1,670 m na
International overnight visitor nights 1.3 m 6.1 m na
International expenditure $89 m $795 m
Source: Tourism Research Australia (2011), p. 5 and p. 13
12
It is not possible to report accurate tourism activity at local government level, hence the information presented in this section is for the whole of the South West, including the south coast.

SEIA Draft Forest Management Plan 2014-2023
5 Current socio-economic status in the study area (baseline)
42908086/1/03 69
Tourism WA maintains data on visitor (including tourist) activity at regional scale. Trends in visitation
activity for the South West region is presented for intrastate overnight visitor nights in Figure 5-10, for
interstate overnight visitor nights in Figure 5-11 and for international overnight visitor nights in Figure
5-12. Numbers for 2010 and 2011 are presented in Table 5-23 and trends in visitor expenditure are
presented in Table 5-24. Approximately 60 per cent of visitation is for the purpose of holidaying or
leisure, with a further 26 per cent involved with visiting relatives and friends. The remainder includes
business travel.
Intrastate visitation is the most important contributor to the South West tourism economy with visitors
spending 4.989 million nights in the region in calendar year 2011. Figure 5-10 shows a steady decline
in visitor nights after 2003-4, with the numbers bottoming out at about the time of the global financial
crisis. There has been some recovery in the last two years, although numbers at the end of 2011 were
running about 20 per cent lower than in 2004.
Figure 5-10 Trends in intrastate overnight visitor nights in the South West
Source: Tourism Western Australia (2012), p. 9
Interstate visitor nights for calendar year 2011 were 901,000, representing a fall of 25 per cent from
2010 numbers. Figure 5-11 shows considerable fluctuation in visitation over the last 8 years.
We
st
(n)V
isito
rs t
o A
ustr
alia
’s
So
uth
We
st
(n)
Vis
ito
rs W
este
rn A
ustr
alia
(n)

SEIA Draft Forest Management Plan 2014-2023
5 Current socio-economic status in the study area (baseline)
70 42908086/1/03
Figure 5-11 Trends in interstate overnight visitor nights in the South West
Source: Tourism Western Australia (2012), p. 10
International visitors spent 1,719,000 nights in the region in calendar year 2011, and the trend in
visitation both in WA and in the South West presented in Figure 5-12 shows a steady increase in
international visitation over the last 8 years.
Figure 5-12 Trends in international overnight visitor nights in the South West
Source: Tourism Western Australia (2012), p. 11
As shown in Table 5-23, the consequence of lower visitor numbers in the South West over recent
years is a lower aggregate level of expenditure by tourists in the region, with the dollar values showing
no trend over the 5 years to 2010, representing a reduction in real spending.
Vis
ito
rs to
Austr
alia
’s S
ou
th W
est
(n) V
isito
rs W
este
rn A
ustr
alia
(n
)
Vis
ito
rs to
Austr
alia
’s S
ou
th
Vis
ito
rs W
este
rn A
ustr
alia
(n)

SEIA Draft Forest Management Plan 2014-2023
5 Current socio-economic status in the study area (baseline)
42908086/1/03 71
Table 5-23 Tourism expenditure in the South West ($m per year)
Expenditure 2002 2003 2004 2005 2006 2007 2008 2009 2010
Domestic visitors 489.0 509.5 571.0 580.9 518.2 513.0 588.6 551.2 521
International visitors
54.5 49.0 36.7 47.6 61.6 56.0 65.7 69.1 71
Total value 543.5 558.5 607.7 628.5 579.8 569.0 654.3 620.3 592
Source: Department of Regional Development and Lands
The most recent available data on visitor nights in the South West are shown for 2010 and 2011 in
Table 5-24. These data show the general turn-around in visitor nights seen after 2009, with a 5.6 per
cent average annual growth rate in the three years to 2011.
Table 5-24 Visitor nights in the South West in 2010 and 2011
Indicator YE 2010 YE 2011 % change Dec 10-Dec 11 3 year AAGR*
Intrastate visitor nights 4.5 5.0 10.3 2.8
Interstate visitor nights 1.2 0.9 -25.0% 17.6%
International visitor nights 1.3 1.7 28.9% 8.5%
Total visitor nights 7.06 m 7.61 m +7.8% +5.6%
Source: Tourism WA (2012), p. 3 * Average Annual Growth Rate
Overall, while there are indications that total tourism activity is increasing from the low point in
visitation in 2009, overall visitor nights remain well down on the numbers earlier in the 2000s, and the
industry is has not grown its contribution to the regional economy over recent years. If the increase in
activity reported after 2009 can be sustained, the situation will improve. With planning underway to
upgrade and expand the runway and terminal facilities at the Busselton Regional Airport to allow direct
flights into the region from the eastern states and overseas, tourism is likely to increase. Further,
Tourism WA reports that there are 8 significant accommodation developments worth $90 million either
in the planning stage or being constructed in the South West.
There had been an expectation at the time of the forest products industry restructuring in the early
2000s that tourism would provide an increasing contribution to the local and regional economies of the
south west. Certainly, the Shire of Manjimup was hopeful that investment in tourism activities by the
State Government and private investors would offset the losses associated with the restructuring.
These expectations were not fulfilled as visitor numbers declined and the expected investment did not
eventuate. The apparent improvement in the tourism sector as shown in Figure 5-10,
SEIA Draft Forest Management Plan 2014-2023
5 Current socio-economic status in the study area (baseline)
72 42908086/1/03
Figure 5-11 and Figure 5-12, is welcomed by local governments and should open up employment and
business opportunities across the region. Volatility in the trends in the tourism industry is likely to
continue.
5.2.4.2 The forests as a tourism asset
According to Tourism WA, the forests and other lands vested in the Conservation Commission form
one of the cornerstones of tourism in the south-west. This forest-based tourism is promoted by
Tourism WA through their Australia’s South West publication which highlights the forests in the south-
west of the state. The forests also rate highly as attractions for other industry organisations and
businesses such as individual tourism operators, local government, and regional development
commissions.
The current FMP refers a strategic framework plan for recreation and tourism on land to which the
plan applies but to date one has not been developed. This lack of such a strategy was described
during consultation with Tourism WA as an important document that remains central to tourism
planning.
However, DEC advises that its Policy Statement number 18, ‘Recreation, Tourism and Visitor
Services’ (DEC, 2007), and the accompanying visitor strategy serves this need. The Policy and its
associated Policy Guidelines describe;
…the underlying principles, administrative controls and, where appropriate, operational guidelines and
procedures relating to DEC’s PVS Service. When read in conjunction with the CALM Act, the Wildlife
Conservation Act 1950, associated regulations including the Conservation and Land Management
Regulations 2002 and other related policies, this statement provides the basis for planning and
management for recreation, tourism and associated visitor activities on lands and waters managed by
DEC. It should be read in conjunction with DEC’s Parks and Visitor Services Strategy 2007 - 2011
(Appendix 1) and Keeping it Real – A Nature Based Tourism Strategy for Western Australia,
December 2004 (Tourism WA).
The forest areas of WA are an important element in the growing adventure tourism market and for
‘personal challenge activity’ based recreation. The Cape to Cape Walk, Bibbulmun Track, Munda Biddi
Trail and the Anaconda Adventure Race (near Augusta) offer the chance to test personal endurance
and fitness in natural settings and are increasingly significant drivers of tourism in the State
(Department of Sport and Recreation, pers. comm.). Demand for these types of activities is anticipated
to grow and Tourism WA expects that appropriate access, and opportunity is maintained and provided
for (Tourism WA, pers. comm.).
Both Tourism WA and the Department of Sport and Recreation (DSR) advocate for considered
planning in the design of forest trails to encourage use and to discourage unauthorised off-trail
activities. Further, they argue that good trail design allows multiple uses of the forest such that
harvesting and clearing can continue to occur. However, both agencies drew attention to the impacts
on both tourism and recreation that can sometimes result from high levels of truck movements as a
result of log haulage operations. Both agencies, as well as local government authorities, sometimes
receive complaints about logging (and other) trucks on the roads in the small towns of the south west.

SEIA Draft Forest Management Plan 2014-2023
5 Current socio-economic status in the study area (baseline)
42908086/1/03 73
5.2.4.3 Tourism in DEC managed areas
Commercial operators of a tourism or recreation business, or businesses offering educational services
in areas managed by DEC, including State forests, require a commercial operations licence. Examples
of the types of operations that may be conducted commercially on DEC-managed land may include,
but is not limited to:
vehicle tours or safaris minor facilities and services such as food vending
charter tours adventure operations such as canoeing and rock climbing
guided walks corporate or commercial training.
DEC issues two types of commercial operations licences depending on the nature of the operation:
'T' Class Licence - Examples of T class licences include safari tours, guided walks and general
snorkel/dive charters. Most commercial operations fall into this category.
'E' Class Licence - E class licences are required when there are environmental, management,
safety, or access reasons why licence numbers must be limited, for example when demand for
licences exceeds the number that can be sustainably managed.
In 2012, there were 341 commercial licences provided to allow operation in those areas of state forest
located within the following DEC districts:
Table 5-25 Number of tourism commercial license holders by DEC district
District No. Licence
Holders
Swan Coastal District 20
Perth Hills District 23
Donnelly District 40
Frankland District 34
Wellington District 31
Blackwood District 36
TOTAL 184
Source: DEC, 2012, pers. comm.
Note that some commercial licence holders obtain multiple licenses so it should not be presumed that
there are 184 individual operators.
5.2.5 Other economic activity
5.2.5.1 Biotechnology
Biotechnology is currently a small prospective industry in WA without a significant economic impact.
SEIA Draft Forest Management Plan 2014-2023
5 Current socio-economic status in the study area (baseline)
74 42908086/1/03
Using a combination of biotechnology applications and new industrial processes, wood residues from
native forest operations and plantation resources can be used in the production of new products such
as bio-plastics, chemicals and pharmaceuticals.
In North America, the development of integrated forest bio-refineries has been proposed as a way in
which the pulp and paper industry can fully integrate forest biomass for the simultaneous production of
several products, including fibre for pulp and paper products as well as chemicals and energy, thereby
creating additional revenue streams (Forest & Wood Products Australia, 2010).
5.2.5.2 Floriculture and seed industries
WA has a rich and diverse native flora. In particular, the South West region, extending south from
Shark Bay, is recognised as one of the top 34 world biodiversity hotspots (DEC 2008). The
commercial harvesting of native flora was estimated to have an export value of approximately $8.9
million, of which approximately 64% ($5.7 million) was from wild-harvested wildflowers and foliage
from natural stands on both Crown and private land (DEC 2008).
Registration and harvest statistics for wildflower pickers from 2004 to 2010 were provided in the end of
term audit of the current FMP (Conservation Commission, 2012). There has been a 33 per cent
reduction in the number of wildflower pickers within the plan area, from a reported 454 in 2004 to 305
in 2010. This has also led to a reduction in the amount of wildflowers harvested within the plan area,
with a drop from around 10 million stems in 2004 to four million in 2010. This represents a reduction of
around 60 per cent in the harvest. After a steady reduction from 2004 to 2008, harvest levels have
been relatively constant from 2008 to 2010.
The end of term audit also provides statistics for the registration and harvest for seed pickers from
2004 to 2010. These statistics show a significant variation in the level of harvest from a peak of around
20 tonnes in 2008, to a low of around 5.5 tonnes in 2006. DEC has attributed the variation to the
changing demand for seed, coupled with variations in the availability of seed in dry years. Overall DEC
notes a trend in wildflower harvesting from south-west forests from cut flora to seed, which they
attribute to an increased focus on the need to collect seed for use in rehabilitation for mining.
5.2.5.3 Apiculture
Beekeeping is a small but significant industry in WA (primarily in the south-west), with an average
annual total income in recent years of around $10 million and a total worth (including planned and
incidental pollination of commercially exploited crops and plants) of approximately $90 million per
annum to WA in 2010/11 (WA Farmers, 2012).
The Western Australian Farmers Federation – Beekeepers section notes that in 2012 there were 919
registered beekeepers in WA with some 29,100 hives. Of these, 105 beekeepers have between 50
and 1,350 hives producing an average of around 2,600 tonnes of honey. Sixty five per cent of this
honey is sold through retail outlet with the remaining sold via roadside stalls or other cottage industry
outlets. Twenty five per cent of honey produced is exported overseas.
Commercial beekeeping on Crown lands is managed in accordance with the CALM Act and the
Conservation and Land Management Regulations 2002 (CALM Regulations), which allow DEC to
grant apiary site permits and licences for the use of Crown lands for the purpose of beekeeping
including the placement of hives and the removal of forest produce.

SEIA Draft Forest Management Plan 2014-2023
5 Current socio-economic status in the study area (baseline)
42908086/1/03 75
In accordance with the CALM Act and CALM Regulations, licences and permits for apiary sites are
granted subject to consultation with the Conservation Commission (for sites on land vested in it) and
the approval of the Minister for Environment. Granting of the licences and permits must be in
accordance with a management plan for the area (DEC, n.d., ‘Beekeeping in WA’),
Permits are issued for up to five years and contain conditions to ensure compliance with DEC’s
management requirements, water catchment guidelines, dieback control and fire prevention.
Of the eucalypt species in WA, Jarrah, Marri (Redgum) and Karri (and the goldfield Mallees) are
considered of most importance. Jarrah honey accounted for about 15% of the State’s total honey
produced in 2011 (The Western Australian, 2011). Given the importance of these native forest timber
honeys, the WA apiculture industry has highlighted their significant reliance on access to the native
forests, which are considered essential for honey production because these areas are free from
chemical contamination (Wescobee undated).
5.2.5.4 Other wood resources
Craftwood
In their publication ‘Availability and supply of domestic firewood, fencing material, specialty timbers
and craftwoods – answers to common questions’ the FPC state that craftwood is a term used to
describe a piece of wood on the forest floor. It is generally small in size, and includes certain features
of grain, colour or shape that make it suitable for manufacture into craft items. Burls, which are woody
growths on the sides of some trees, are also harvested for the manufacture of craft items, but are not
classified as craftwood (FPC, n.d.).
Small quantities of craftwood (e.g. less than one tonne) can be collected after obtaining a Minor
Production Contract (MPC), which is typically issued for a period of up to three months.
Craftwood costs approximately $20 per tonne and are collected by the buyer. Burls, which are
relatively scarce, can be purchased from people that have a contract of sale with FPC or by
participating at FPC auctions. Burls can be purchased for approximately $400 per tonne (FPC, n.d.).
Firewood
There are two different ways in which firewood removal from the FMP area occurs: by public firewood
collection and under contract of sale by the FPC to commercial suppliers. Public firewood collection
provides for the gathering of forest produce for home heating and other domestic uses. DEC currently
provides for public firewood collection from State forest and timber reserves. In the Swan Region,
where there is strong demand from the public, DEC issues members of the public with a licence to
collect firewood. The licence is a conditional authorisation that requires collectors to take firewood
from within a public firewood collection area, not to collect within three days following rainfall (to
prevent spreading dieback) and to take no more than one cubic metre of firewood. The numbers of
licences for public firewood collection issued recently in the Swan Region were 1,706 in 2008, 4,566 in
2009 and 5,271 in 2010. This trend indicates that there remains a strong demand for public firewood
(Conservation Commission 2012).
Public firewood is often taken from outside designated areas or in breach of conditions of
authorisation. Surveys of public firewood collection undertaken by DEC indicate that the volume taken
is approximately double the authorised amount.

SEIA Draft Forest Management Plan 2014-2023
5 Current socio-economic status in the study area (baseline)
76 42908086/1/03
Firewood removed under contract of sale by the FPC is generally a by-product of timber harvesting
conducted for other logs. The volume of firewood removed under contract of sale is around 10 times
that which is removed via authorised public firewood collection. The FPC administers around 40
individual contracts, each supplying between 200 and 8,000 tonnes per year.
The volume of firewood removed to service FPC contracts of sale has been steady and consistently
below the level allowed, suggesting that demand for firewood is generally stable and is less than the
available supply (Conservation Commission, 2012). Table 5-26 below shows the volume removed by
FPC compared to contracted volume from 2004 to 2010.
Table 5-26 Firewood removal under contract
2004 2005 2006 2007 2008 2009 2010
Number of contracts 42 45 41 44 39 32 45
Contract volume (tonnes) 51,300 87,200 88,000 83,400 84,400 78,600 82,600
Removed volume (tonnes) 50,800 55,600 54,000 32,300 41,200 45,500 47,300
% of contracted volume removed 99% 64% 61% 39% 49% 58% 57%
Source: Conservation Commission (2012)
5.2.6 Forest products industry
For the purposes of this study, the forest products industry is considered as all those enterprises
involved in the management, harvest, transport and processing of wood from native forests. Given that
the FMP predominantly affects this sector, the following section provides greater detail about the
current status of the industry.
Following Schirmer (2012), the production of wood products from native forests broadly involves the
following stages:
At each of these stages in the process an economic impact is generated.
Schirmer (2010) estimated total expenditure of the WA forest industry, and hence contribution to gross
state product (GSP) at $790 - $1,060 million (0.6 – 0.8% of total GSP) over the same period. At a finer
level of detail, ABARES estimated the gross value of log production only13
for WA’s native forest
industry to be $40 million in 2009-10 (ABARES 2011a). This represents some 13 per cent of the value
of all logs harvested in WA (plantation and native forest). The level of value-adding in the native forest
sector is often greater than value-adding in the plantation sector. The gross value of production in the
13
Gross value of log production is the value of logs delivered to mill door, excluding goods and service tax. It includes the
stumpage value and the value of harvest and haulage, but does not include the value of primary or secondary processing.

SEIA Draft Forest Management Plan 2014-2023
5 Current socio-economic status in the study area (baseline)
42908086/1/03 77
native forest sector has been relatively flat over the past eight years, at around $40-50 million per
annum (see Figure 5-13).
Figure 5-13 Value of logs harvested in Western Australia
Source: (ABARES, 2011a)
Native forest-based sawmilling sector
The largest sawmills in WA are located at Greenbushes, Pemberton, Manjimup and Nannup, all of
which are located in the southern regions of the state. Each of these sawmills process 20,000 –
50,000 m3/annum of first and second grade sawlogs, and account for almost 80 per cent of the total
available jarrah and karri first and second grade sawlog volume under the current FMP. Deanmill
sawmill at Manjimup changed ownership in November 2011 with the new owner recently
recommencing operations.
There are around 13 smaller sawmills located throughout southwest WA including Manjimup, Albany,
Busselton, Dwellingup, Donnybrook and Karridale, which process smaller volumes of first and second
grade sawlogs, and higher quality other bole logs. Most of these other mills process less than 10,000
m3/annum.
Logs are supplied to sawmills under contracts administered by FPC. Log supply contracts will expire
at the end of 2013 (in line with the end of the current FMP). Several sawmills have Investment
Security Guarantees (ISGs). An ISG provides for compensation to be paid to the contract holder in the
event that a specified minimum volume and quality of native forest resource that would be provided to
the sawmill under the current FPC contract, cannot be provided as a result of a specified condition or
action described in the ISG.
Table 5-27 provides a summary of all sawmills with contracts for jarrah and/or karri first and second
grade sawlogs. The total volume of jarrah first and second grade sawlog currently supplied to sawmills
is 131,310 m3 per annum. This is marginally higher than the current FMP sustained yield, but some
variation is allowable in any one year provided the total allowed volume over 10 years is not
exceeded. The volume of karri sawlog under contract is about 1,000 m3 less than the sustained yield.

SEIA Draft Forest Management Plan 2014-2023
5 Current socio-economic status in the study area (baseline)
78 42908086/1/03
FPC generally sells this un-contracted volume to its karri customers under existing contract
arrangements.
Table 5-27 Details of 2012 projected sawlog supply to sawmills14
Sawmill Product (species and grade) 2012 volume (m3) –
sawlog equivalent*
AusWest Timbers Jarrah 1st and 2nd grade sawlogs 13,930
Pemberton and Manjimup Jarrah bole sawlogs 16,849
Karri 1st and 2nd grade sawlogs 45,455
Other sawlogs 13,436
Blueleaf Corporation (Whittakers) Jarrah 1st and 2nd grade sawlogs 36,906
Greenbushes Karri 1st and 2nd grade sawlogs 7,379
Other sawlogs 7,649
Nannup Timber Processing Jarrah 1st and 2nd grade sawlogs 24,345
Nannup Other sawlogs 1,926
Hexan Holdings (Whiteland) Jarrah bole sawlogs 9447
Busselton Other sawlogs 2,619
Sawmills processing 5,000 to 10,000 m3 Jarrah bole sawlogs 11,510
2 sawmills
Sawmills processing <5,000 m3 Jarrah 1st and 2nd grade sawlogs 578
11 sawmills Jarrah bole sawlogs 17,745
Karri 1st and 2nd grade sawlogs 160
Other sawlogs 1,594
Total jarrah 1st and 2nd grade sawlog 131,310
Total karri 1st and 2nd grade sawlog 52,994
Total other sawlog 27,225
Source: FPC log supply contract data, provided via email on 12 March 2012 and 9 July 2012 1 Bole sawlogs volumes have been converted to first and second grade sawlog equivalent volume
* These figures may include an amount to make up for under deliveries in previous years but over the 10 year period of the plan the average will not exceed 131,000
14
Supply levels of jarrah are marginally higher than the current FMP sustained yield as they include a backlog of sawlogs not taken in previous years

SEIA Draft Forest Management Plan 2014-2023
5 Current socio-economic status in the study area (baseline)
42908086/1/03 79
Table 5-28 presents an estimate of the number of employees directly employed by sawmills
processing native forest timbers in south-west WA in 2012. These numbers were derived from
stakeholder consultation and estimation by URS.
Table 5-28 Estimate of number of people directly employed by sawmills by local government area
Key SLA/LGA # of employees
Albany 19
Bridgetown-Greenbushes 102
Busselton 43
Collie 10
Donnybrook-Balingup 0
Harvey 0
Manjimup 157
Murray 3
Nannup 57
Metropolitan 18
Serpentine-Jarrahdale 28
South West15
4
Total 441
Source: URS Consultation 2012
Low grade resource sector
Wood residue material is generated either in the forest as a consequence of harvesting and
silvicultural operations, or in the sawmill as a by-product of the conversion of logs, including sawlogs
and other bole logs. The main users of residue, other bole logs and woodchip logs are the production
of charcoal, the firewood industry and the export woodchip industry. Simcoa is the largest other bole
log and residue customer and produces charcoal, which is required in the production of silica.
Approximately 160,000 tonnes of jarrah other bole logs, some of which comes from mine site
clearing,is supplied to Simcoa annually. The company employs approximately 130 people at its site in
Kemerton.
Firewood logs are harvested by FPC and sold through sale contracts, most of which are awarded
through public tender. Firewood is also removed by members of the public.
The major market for karri non-sawlog material is presently as export woodchips, to be used ultimately
in the production of paper-based products. Approximately 117,000 m3 of karri woodchip logs are
exported as woodchips through the port of Bunbury with an export value of around $9 million per year.
15
‘South West’ is used where the residential location of the employee is unknown beyond their location in the south-west region.
SEIA Draft Forest Management Plan 2014-2023
5 Current socio-economic status in the study area (baseline)
80 42908086/1/03
Diamond Mill, located 11 kilometres south of Manjimup on 60 hectares of land leased from DEC,
originally processed the karri and marri residues from native forest and sawmill operations. The mill,
which employs 10 staff, currently processes mostly native forest residues from forest thinning. Wood
chips produced at the mill are sent to Bunbury Port for export to Japan.
Harvest and haulage sector
Harvesting of forest products is carried out by contractors engaged by the FPC, usually following the
calling of a public tender. Harvesting contractors are required to fell trees, prepare and extract log
products to roadside landings, and load and cart logs to the FPC's customers.
The most common products include sawlogs, other bole logs, firewood/charcoal logs, poles, and logs
for fencing purposes (FPC, ‘Contracts and Tenders’ at http://www.fpc.wa.gov.au/
content_migration/products_services/contracts_tenders.aspx).
FPC currently has tenders with nine contractors for native forest harvest and haulage operations. The
volume contracted to each of these companies ranges from 15,000 to 200,000 tonnes per annum.
URS met with two of the larger contractors during stakeholder consultation for this project and
telephoned other smaller contractors and was able to source employment data for these companies.
URS has extrapolated this employment data to derive an estimate of total employment in the harvest
and haulage sector in 2012 of 166 employees.
Secondary processors
The secondary processing sector involves the transformation of initial wood from log breakdown into
further processed wood and paper products, where wood is the sole or primary component of the
manufactured end-products. For example, this might involve the transformation of rough sawn timber
into trusses, pallets, paper, joinery and mouldings, window framing, doors frames, flooring, decking
and furniture.
Furniture, joinery and mouldings, and flooring and decking are probably the most significant secondary
markets for WA native forest timber however, the furniture manufacturing industry in WA is relatively
small. Based on information received during stakeholder consultation, URS estimates that
employment in the furniture manufacturing sector may be in the order of 150 people although this is
considered an under-estimate. The state’s largest furniture manufacturer using native forest timber
processes approximately 2,000 m3 of timber per annum, 70 per cent of which is marri. According to
the secondary processors consulted, decline in the furniture manufacturing sector over the last decade
has primarily been driven by import competition (Appendix D contains a market summary for the
furniture industry).
5.2.6.1 Aggregate employment estimates
A 2011 employment study estimated the number of employees across the forest industry in WA (Dare
and Schirmer, 2012). Table 5-29 shows the number of people employed directly by companies that
work exclusively in the native forest sector, and the number of people employed directly by businesses
that work in both the native forest and plantation sectors. The employment estimates include native
forest management, harvest and haulage, primary processing operations, silvicultural contracting and
nursery and seed supply and do not include secondary processors.

SEIA Draft Forest Management Plan 2014-2023
5 Current socio-economic status in the study area (baseline)
42908086/1/03 81
Table 5-29 Estimations of employment in Western Australia native forest industries in 2011
Sector Native forest only
employees1
Native forest and
plantation employees2
Total
Forest management3 61 141 202
Harvest and haulage 64 187 251
Sawmills/processors 476 10 486
Secondary manufacturing NA NA NA
Other 5 28 33
TOTAL 613 365 978
1. Includes businesses that only work in the native forest sector
2. Includes businesses that work in both the native forest and plantation sectors
3. Includes silvicultural contractors and nurseries
Note: The data do not include secondary processing or indirect employment
Source: Dare and Schirmer (2012)
Table 5-30 summarises URS estimates of employees in each of the major native forest sectors. These
estimates have been derived using information received during stakeholder consultation. Because
these employment numbers have been derived from consultation, it is likely that some numbers,
particularly for secondary processors, are under-estimated as not all companies involved in this sector
have been identified. Employment in other sectors, including maintenance service providers, exporting
and sales and marketing has not been estimated by URS. The estimates also do not include other
categories included in Schirmer’s analysis (e.g. silvicultural contracting, nursery and seed supply)
although these numbers may be picked up to some extent in the forest management employment
figures. The major discrepancy between the employment figures reported in Table 5-29 and Table
5-30 is the forest management sector. The URS forest management employment figures are based on
current estimates of native forest employees from FPC and DEC. The figure for DEC includes staff
that are also involved in plantation forests and broader land management responsibilities, particularly
on the Swan Coastal Plain.
Table 5-30 URS estimates of employees by native forest sector (2012)
Sector Employees
Forest management 286
Harvest and haulage 166
Sawmills 441
Secondary manufacturing 152*
Other NA * Likely to be an under-estimation
TOTAL 1,045 Source: URS Consultation 2012
SEIA Draft Forest Management Plan 2014-2023
5 Current socio-economic status in the study area (baseline)
82 42908086/1/03
5.2.6.2 Issues impacting sawmill viability
A key issue is that the viability of sawmilling operations is a function of input volume, log quality and
log supply cost. These factors are strongly inter-related, and knowledge of each is required to estimate
the impact of change of either factor.
Input volume: Input volume affects unit costs of production. As input volumes decrease, fixed costs
must be spread over a lower volume and unit costs of production increase. Conversely, if input
volumes increase, unit costs of production decrease.
Log quality: Log quality refers to the size and amount of defect in a log. Size and defect allowances
are managed through the log grading system, with first and second grade sawlogs required to have a
minimum SED of 200mm. The cutting equipment in most sawmills in WA is designed to process larger
sawlogs, and timber recovery decreases as log size decreases. The exception to this is Whittakers
sawmill, which has introduced a small log line and can efficiently process smaller sawlogs. As
discussed in Section 3.3, since the implementation of the current FMP there has been a trend of
declining log size. Many of the sawmills consulted as part of this project reported that, in addition to
variable quality, declining log size was a major issue affecting their viability (see Appendix A for more
information on outcomes of sawmill stakeholder consultation).
Log input costs: The cost of logs can vary significantly due to the nature of supply contracts. The
cost of logs delivered to sawmills consists of a stumpage cost and a harvest and haulage cost. The
location of forests from which resources are harvested varies continually, and consequently, delivered
log costs are variable.
As discussed in Section 3.3.3, forest resources have increasingly been sourced from northern forests
and transported to mills in the south and this has led to overall increases in the haulage distance of
logs to sawmills. The effects of haulage distance at an enterprise level vary depending on how logs
are allocated from the forests to sawmills by FPC. Some sawmills have supply zones specified in their
contracts, and this assists in minimising haulage costs for these sawmills. On the other hand this can
act to increase haulage costs for other sawmills which are supplied with logs from supply zones which
are further away.
As the major sawmills are located in the southern regions, any increase in the proportion of jarrah logs
supplied from northern forests will have the effect of further increasing delivered log costs to the
southern sawmills.
Operating costs (unit costs of production): Sawmill unit costs of production increase as log input
volume and quality decreases. Reductions in permitted wood volumes prior to 2004 resulted in some
of the larger mills operating at below their capacity. Sawmills that were designed to operate on a two
shift basis, and which were doing so before the current FMP, are now operating only one shift, and the
fixed costs associated with their plant and equipment are higher as they are being spread over a lower
volume. Average log quality has also declined since the introduction of the ‘Protecting our old-growth
forests’ policy.
Based on consultation undertaken for this study, it appears there is limited opportunity to reduce unit
costs by increasing scale of operations due to constraints on resource availability.
Two other key costs of production are energy and transport costs. These costs will differ between
products, processing techniques and distance from forest to processing facility. As the cost of these

SEIA Draft Forest Management Plan 2014-2023
5 Current socio-economic status in the study area (baseline)
42908086/1/03 83
inputs increase, with, for example, the introduction of the Clean Energy Futures package, the returns
to processors have the potential to decline because they are largely price-takers.
Markets: Wood products are generally traded as a commodity and WA sawmills are subject to
competition in domestic and international markets, and with other products that have a degree of
substitution. Many WA hardwood sawmills have found niche markets for their products (e.g.
international flooring markets, large timber dimensions for furniture or structural application). The
ability of WA sawmills to identify and capture potential niche markets has been fundamental to the
continuation of some businesses (refer to Appendix D for full market overview).

SEIA Draft Forest Management Plan 2014-2023
42908086/1/03
THIS PAGE INTENTIONALLY LEFT BLANK

SEIA Draft Forest Management Plan 2014-2023
42908086/1/03 85
6
6Potential economic impact of implementation of FMP 2014-2023
6.1 FMP indicative volumes and drivers of change
At the time of undertaking this study, the Draft FMP was not finalised. In May 2012, URS was provided
with a range of indicative wood volumes across timber species, unspecific wood source locations, and
an overview of the management policy that may be included within the Draft FMP.
Two indicative wood volumes were analysed for this project: an ‘upper indicative wood volume’ and a
‘lower indicative wood volume’. The wood volumes available under each are shown in Table 6-1. The
upper yield represents a small increase in volumes for jarrah and karri first and second grade sawlogs
and marri other bole logs compared to the current FMP. The lower indicative wood volume represents
a 20 per cent reduction in jarrah sawlog volume and a 7 per cent reduction in karri sawlog volume.
This also results in a reduction in the volume of jarrah other bole log of around 50 per cent. DEC
advises that the significant reduction in the other bole log resource is the result of a number of factors,
including less forest area being harvested and a lack of markets for the lower quality resource, giving
rise to expected substantial delays in undertaking early / scheduled thinning in regrowth and mining
rehabilitation stands.
Note that subsequent to commencing this SEIA, URS was advised that DEC had revised the indicative
wood volumes in the Draft FMP. As a result there is a discrepancy between the volumes quoted here
and those contained within the Draft FMP.
Table 6-1 Draft FMP 2014-2023 indicative wood volumes
Range Geographic area1
Volume wood (‘000 m3 per annum)
Jarrah sawlog
Karri sawlog
Jarrah other bole
Karri other bole
Marri bole log
Upper indicative wood volume
Northern 80 - 230 - 60
Southern 60 60 280 - 140
Total 140 60 510 170 200
Per cent of current FMP 2004-2013 107% 111% 96% 106% 102%
Lower indicative wood volume
Northern 58 - 145 - 50
Southern 47 50 110 120 100
Total 105 50 260 120 150
Per cent of current FMP 2004-2013 80% 93% 49% 75% 77%
Current FMP Total 131 54 534 160 196
1 The Northern area comprises the former Northern and Mornington FPC supply zones, while the Southern comprises the
former Nannup, Sunklands, Greenbushes and Southern FPC supply zones.
Source: DEC
6.1.1 Drivers of industry change beyond the FMP
Whilst the FMP process has been a strong driver of change in the native forest industries, other
factors such as exchange rate, the cost of substitute products and imported wood products, consumer

SEIA Draft Forest Management Plan 2014-2023
6 Potential economic impact of implementation of FMP 2014-2023
86 42908086/1/03
preferences, energy and transport costs and market development have also exerted a strong
influence.
Exchange rates, the cost of substitute products and imported timbers
In recent years, Australia has experienced an appreciation in its exchange rate. Theoretically, this has
made it more competitive to import wood and substitute products, and made Australian exports
relatively less competitive. This would then have implications for domestic wood production. It may
increase substitution of imported products for local products, and reduced demand for Australian
products. The extent to which demand declines is influenced by the degree to which the products are
substitutable. For example substitutes for jarrah flooring are not typically imported as jarrah has few
substitutes; however, hardwood structural products, which can be replaced by laminated veneer
lumber (LVL) in certain structural applications, are produced overseas and sold into the Australian
market. The second, impact of an exchange rate appreciation is its effect on the price at which
domestic products can be sold. The price of imported products effectively puts a cap on the domestic
price and this, in turn, influences the supply of products on the market.
Figure 6-1 contains the volume and origin of hardwood sawntimber that has been imported into
Australia over the last 16 years (left hand axis) against the AUD:US exchange rate16
for the same
period (right hand axis). Until 2004, it showed a positive correlation between import volume and
exchange rate. Since then and the global financial crisis (2008) there is a marked change in this
relationship, and it appears there are other factors more strongly influencing the relationship between
the value of the Australian dollar and the volume of imported hardwood sawn timber. The situation
indicated in Figure 6-1 suggests a benefit to the local industry, as levels of importation are at their
lowest since 1995, even though the exchange rate is at its highest.
Figure 6-1 Imported hardwood sawn timber and exchange rate (1995 – 2011)
Source: GTIS 2012
16
Most wood products are sold in US dollars.

SEIA Draft Forest Management Plan 2014-2023
6 Potential economic impact of implementation of FMP 2014-2023
42908086/1/03 87
Secondary processors noted that high labour costs in Australia relative to countries importing
Australian hardwoods means that value-adding by local processors is less cost effective than that
undertaken by overseas processors. Overseas processors are able to utilise a greater proportion of
lower quality wood for furniture and other products as they can devote more staff at a lower wage to
the task of addressing quality issues.
Consumer preferences
Consumer preferences and consumption of wood products are influenced by a number of factors,
including perceptions regarding quality, value for money, design aesthetic and attitudes towards
environmental certification. Recent trends in the apparent consumption of timber in Australia are
shown in Figure 6-2. Long-term sawn timber consumption in Australia has fluctuated between 4-5
million m3 p.a. in line with housing construction. Figure 6-2 also shows a steady increase in softwood
sawn timber consumption, combined with a decrease in hardwood sawn timber consumption, resulting
from both declining resource availability and increasing competition from softwood producers.
Figure 6-2 Apparent consumption of timber and housing commencements in Australia
0
20
40
60
80
100
120
140
0
1
2
3
4
5
6
7
19
70
/71
19
72
/73
19
74
/75
19
76
/77
19
78
/79
19
80
/81
19
82
/83
19
84
/85
19
86
/87
19
88
/89
19
90
/91
19
92
/93
19
94
/95
19
96
/97
19
98
/99
20
00
/01
20
02
/03
20
04
/05
20
06
/07
20
08
/09
'00
0 u
nit
s co
mm
ence
d
Mill
ion
m3
Total timber Softwood timber
Hardwood timber Housing commencements (RHS)
Source: ABARES (2011); ABS (2012) NB: Consumption data unavailable after 2008/09
Apparent consumption of hardwood sawn timber in Australia has declined by an average of 2.8 per
cent each year since 1984/85. This decline is largely attributed to a reduction in availability of logs
arising from revised land use allocations to timber harvesting, and consequent sustainable harvest
calculations. These revisions reflect both land use determinations arising from state and federal
SEIA Draft Forest Management Plan 2014-2023
6 Potential economic impact of implementation of FMP 2014-2023
88 42908086/1/03
government decisions, and also re-calibration of wood availability estimates in response to new
resource information and perturbations such as wildfire events.
Hardwood products used in structural and high strength applications are also facing increasing
competition from softwood engineered wood products, such as LVL, and consequently it is expected
that hardwood products will continue to focus on higher value, appearance based markets such as
flooring and furniture.
The movement of hardwood timber production away from structural grades to higher value
appearance grades has seen the residential alterations and additions market become a more
important driver of domestic demand for hardwood sawn timber, while the relative importance of
housing commencements has declined. There are also other factors at play largely determined by the
state of the economy at a state, national and global scale. As the local economy of WA has been
strong, relative to other economies, there may have been a shift in consumer preferences towards
quality and luxury items like native hardwood furniture, thereby increasing demand for these products.
6.1.1 Mitigating the impacts
A preferred approach to mitigating the negative effects of the implementation of the FMP will be to
provide to new options for utilising value-adding forest products which will provide opportunities to
existing businesses and people. These are discussed below.
6.1.1.1 Potential for investment in new wood markets
In recent times, only around 120,000 m3 of jarrah other bole log has been harvested, out of an
available volume of 534,000 m3 per annum. This is largely due to a lack of markets for the lower
quality log resource. FPC has been investigating where there may be potential new markets and
products for this resource, including veneer, engineered wood products and bioenergy.
Summaries of the market opportunities considered to have the most potential are provided below.
Marri utilisation
The available marri resource is currently underutilised, primarily due to difficulties in determining log
quality in standing trees. URS understands that if FPC could more accurately predict log quality and
identify good quality marri logs, the economics of log harvesting would be improved and FPC could
sell more of the available volume. Marri is highly favoured by the furniture industry and, anecdotally,
FPC suggests that if marri production were increased the market would take the additional resource
and furniture production would increase. However as marri is more expensive to manufacture than
jarrah or karri, it is important that any additional supply is of ‘better’ quality marri logs (FPC, 2012,
pers. comm.).
Veneer/plywood
Australian plywood mills are typically small by international standards and demand has increasingly
been met by imports over the last decade. However, a veneer operation has been established in
Tasmania by a Malaysian company. Declining supplies of tropical hardwood logs in SE Asia is likely to
have been a factor in the investment.
There may be a similar opportunity for processing of native timber in south west WA. Peeling trials
have suggested that dry veneer recovery of up to 70% is possible, though the logs required are likely

SEIA Draft Forest Management Plan 2014-2023
6 Potential economic impact of implementation of FMP 2014-2023
42908086/1/03 89
to have comparatively demanding specifications in terms of defects and the presence of knots. A
component of the supply is therefore likely to have to come from what is currently allocated to
sawmills. However, around 20-30% of the supply may also be able to be supplied as shorter lengths
than typical sawlogs which may enable increased recovery from the other bole (non-sawlog)
component of the resource.
Engineered wood
As mentioned in section 3.3.2, a large proportion of the available other bole log resource is not utilised
due to a lack of markets. Engineered wood products were considered by URS to represent one of the
best options for utilisation of the other bole log resource.
Engineered wood products based on stranded wood technologies such as laminated strand lumber
(LSL) and oriented strand lumber (OSL) are well established in North America but are not commonly
found in Australia. There is a case for the introduction of laminated strand lumber and board products
in Australia based on the assumption that they could provide an alternative to LVL, solid wood
products, steel and potentially some domestic and imported hardwood products.
There could be an opportunity to use the lower quality native forest logs, which still have high inherent
strength properties, to be processed using reconstituted or stranding technologies. A product similar to
LSL or OSL could potentially be produced. A key attribute of any engineered wood product is the
consistent and known characteristics it has (compared to other wood products which can be quite
variable). An engineered wood product manufactured from jarrah and/or karri is also likely to be high
in strength and stiffness, and have high impact resistance due to its high density.
A key consideration would be the volume of wood fibre required for a full scale plant, which, URS
believes would require a log input of 300–400,000 m3. While less demanding in terms of defects in the
logs, log length and straightness requirements would mean that not all other bole logs would be
suitable.
Bioenergy
There are opportunities for bioenergy production based on woody biomass feedstocks. The growing
maturity of bioenergy technology due to strong industry development in Europe means that production
costs have lowered significantly and bioenergy has become increasingly viable in localised areas
where either production costs can be lowered significantly or demand for on-site energy is high.
Government support for the emerging bioenergy sector is currently a limiting factor in its development.
Therefore, at this stage, bioenergy ventures are highly case specific and are unlikely to be competitive
where strong business conditions and/or government assistance are not present.
In 2008, a proposal to develop a Biomass Power Plant near Manjimup was submitted to the EPA by
Western Australia Biomass Pty Ltd, a joint venture company formed by Babcock and Brown and
National Power. The proposed 40 MW (nominal) Biomass Power Plant facility consisted of a
conventional steam cycle plant generating approximately 322GWh (net) / annum of electrical power
which will be supplied to the South West Interconnected System (SWIS). The proposed plant would
occupy the former Diamond Mill site in Manjimup.
The project gained the necessary environmental approvals to burn residue from plantation timber (with
conditions) in late 2008. However, the plant has faced substantial opposition from conservation groups
and primary producers and has not yet been built.

SEIA Draft Forest Management Plan 2014-2023
6 Potential economic impact of implementation of FMP 2014-2023
90 42908086/1/03
There may be strong localised cases for bioenergy production including production processes where
heat can be captured and utilised for commercial processes or public facilities. Development of
combined heat and power (CHP) facilities outside of the forest products sector (where it has already
been demonstrated as viable) will require strategic marketing either from forest growers/managers or
from government or a combination of the two.
Local industries requiring heat of around 5MW (for example abattoirs and dairies) requires around
15,000 green tonnes of biomass feedstock per year. Larger combined heat and power plants (20+
MW) would require at least 60,000 green tonnes per year.
The market for wood pellets is developing quickly in Europe and North America and one Australian
company has already ventured into supplying this market based on hardwood plantation resource.
This operation proved unviable and export oriented wood pellet production based on forest residues
remains challenging due to shipping costs and the current exchange rate. Wood pellet production
currently favours the use of sawmill residues; however, technologies for utilising forest residues have
been developed and are increasingly being adopted to increase feedstock availability. Wood pellet
production and energy from wood pellets could be used in residential and industrial situations in WA,
as well as supplying export markets, particularly Europe where energy from wood pellet burning has
expanded significantly.
6.1.1.2 Developing these markets
Development of any of these new markets would have positive socio-economic outcomes through
employment generation, capital investment and industry turnover. As an example of the potential
social-economic impacts of new markets, if an engineered wood products facility were established in
the south west region of WA, URS estimates that around 100-150 direct and around 135-205 indirect
jobs would be created and the facility would have potential to create turnover in the order of $300
million per year. An engineered wood product facility will utilise around 300,000-400,000 m3 of other
bole logs each year. Availability of markets for lower quality logs would also have the benefit of
increasing longer-term sawlog yields as it becomes more viable to thin more areas.
The location of an engineered wood products facility would be important in determining the degree of
replacement of potential jobs lost and wider benefit to the local community. Location within the vicinity
of the larger sawmills (or sawmills that may close) could potentially offset job losses associated with
declining volumes, but location nearer ports may not offset localised impacts on the forest products
industry.
There are a number of challenges to the development of new processing facilities and markets. Some
of the major challenges include costs of production such as extraction and haulage of logs to a
centralised facility, the need for more detailed resource information, competition from highly
competitive global product markets and the need for further technology developments for some
products (particularly veneer and bioenergy). There is also the risk that development of new
industries, particularly a veneer industry, may draw on resources currently supplied to sawmills and
would have a negative impact on these existing industries. In addition, an important factor is resource
security – not just in terms of volume, but the duration of the supply contract. As with a commercial
venture of a fixed and technically specific nature, sufficient security of resource access is required to
underpin the investment.

SEIA Draft Forest Management Plan 2014-2023
6 Potential economic impact of implementation of FMP 2014-2023
42908086/1/03 91
6.1.2 Impacts as a result of government policy or from external factors
The Draft FMP will outline the potential range of available wood volumes and/or changes to access to
forest areas and resources for consumptive and non-consumptive uses. Such changes might be
expected to have impacts on associated industries, depending on the extent and location of effects.
The available wood volume is a result of the area of state forest and timber reserves available for
wood production, and the productivity achieved from that area. Any changes in available area result
from policy relating to access or land tenure shifts. Estimates of the productivity of the available area
may change between the current FMP and the Draft FMP as a result of changes in forest
management policy, changes in estimates of forest productivity, or changes in in-forest log utilisation
and the level of silviculture undertaken, including estimates of future levels. A drying climate is a key
external factor in any revisions in forest productivity estimates and associated available wood
volumes.
Given that this study did not have access to the Draft FMP or the forest productivity calculations, it is
not possible to assess the extent of impacts as a result of changes to government policy and their
management implications, or the extent of impact caused by changes in forest productivity as a result
of external factors such as a drying climate.
6.2 Impact assessment – forest products industry
The following discussion summarises the potential impacts associated with any possible change in the
volume of native forest wood available for harvesting. The assessment discusses how a directly
proportional change in wood availability across timber species may affect sawmills. This analysis
doesn’t account for structural adjustment or adaptation by mills that may occur and could see some
mills operate using different volumes and mixes of timber species with products sold into different
markets. This would require direct knowledge of how and where any reductions in wood volumes
might be applied, and a specific analysis of those changes on a mill by mill basis.
Table 6-2 provides a summary of the current volume of sawlogs supplied to sawmills compared to the
volumes allowed under the current FMP. It shows that the total volume of jarrah first and second grade
sawlogs currently supplied to sawmills is equivalent to the levels allowed in the current FMP. The
volume of jarrah sawlogs harvested and marketed by FPC over the period of the current FMP has
consistently been at the allowed level, with the exception of 2010-11 during the period of the Deanmill
(ex-Gunns) sawmill closure and prior to redistribution of the Gunn’s allocation.
As discussed previously in this report (see Section 5.2.6), log input volume is critical to sawmill viability
and any reduction in supply volumes (or poorer average log quality) from current levels is likely to
result in a reduction in the robustness of sawmilling businesses. This consequence was highlighted by
sawmill businesses during stakeholder consultation.
“A 50mm reduction in diameter, from 450mm to 400mm affects our ability to recover large sections for
furniture value add. Then we have to fall back to flooring” [Stakeholder comment]
The volume of karri sawlog under contract is about 1,000m3 less than the level allowed under the
current FMP. FPC generally sells this volume under short term contracts.

SEIA Draft Forest Management Plan 2014-2023
6 Potential economic impact of implementation of FMP 2014-2023
92 42908086/1/03
Table 6-2 Summary of current sawlog supply and current FMP 2004-2013
Product (species and grade) Contracted volume per annum (m
3)*
FMP 2004-2013 sustainable yield (m
3)
Total jarrah 1st and 2nd grade sawlog 131,310 131,000
Total karri 1st and 2nd grade sawlog 52,994 54,000
Total other sawlog 27,225
Source: FPC log supply contract data
* Note: these figures may include an amount to make up for under deliveries in previous years but over the 10 year period of the
plan the average will not exceed 131,000
6.2.1 Indicative upper wood volume
The WA sawmilling sector has faced ongoing decline as a result of yield reductions, declining log size
and average log quality and increased unit costs of production. Under the indicative upper wood
volume, the viability of the sawmilling sector may be marginally improved as any increase in volume
would reduce unit production costs, other factors held constant. The sector will remain finely balanced
and the issues of decreasing log size and average log quality, delivered log costs and sawmill costs of
production impacting on sawmill viability will remain. However additional sawlog resources would
provide stability to the industry and would reduce the likelihood of further business closures and job
losses. The extent of positive benefits associated with a small increase to sawlog volumes would be
dependent on the quality and cost of the logs supplied.
Given the current market demand for marri, the major secondary processors consulted during this
study have indicated support for maintaining a good supply of this species to satisfy demand. There
was a suggestion made by one secondary processor that demand for marri could be satisfied by
reducing the amount of marri currently exported. URS understands that the volume of marri exported
is low.
6.2.2 Indicative lower wood volume
The impacts of the lower jarrah and karri sawlog volumes under the indicative lower wood volume are
discussed below. The lower marri volume available is not expected to have a marked impact on the
forest products industry as FPC sells only around 12,000 m3 per annum of marri. However, as
discussed above, marri-based industry is constrained by the ability to identify good quality logs, not
markets. If FPC were able to identify larger volumes of good quality marri logs, this additional supply
would have positive economic benefits, particularly in the furniture manufacturing industry which is
currently experiencing a high demand for marri products. Conversely, if the volume of marri harvested
decreased under the lower indicative wood volume as a result of changes to forest areas harvested or
available for harvest, this is likely to have a negative impact on the furniture industry.
In her assessment of the employment and economic consequences of change in access to
Tasmania’s publicly owned native forests, Schirmer (2012) makes the following observation:

SEIA Draft Forest Management Plan 2014-2023
6 Potential economic impact of implementation of FMP 2014-2023
42908086/1/03 93
Where there is a reduction in wood supply that reduces volumes available below the minimum needed
to supply all currently operating mills, but still provides some supply, there will be multiple mills
potentially impacted by the change located within economic transport distance of the forests in which
harvest is to be reduced…
This raises a critical question: given that available roundwood volumes are no longer sufficient to
supply all mills, but no individual mill can be clearly identified as having a complete lack of access to
roundwood harvest, which mills will close as a consequence of the loss of a given volume of wood
supply? This question is important to answer in order to identify the communities most likely to be
impacted by change, particularly in the case of Tasmania, where mills are located not in one central
location, but in multiple towns. This means that it is critical to identify which mills are likely to downsize
operations or close in order to identify which communities will likely experience negative impacts as a
consequence of the reservation of an area of forest from timber harvest.
The complexity of overlapping supply zones indicates the difficulty of assessing which mills will be
impacted and how, particularly if a mill is – realistically – assumed to be able to compete to some
degree for supply of roundwood. In this case, the reserved area reduces wood supply by
approximately one-third. It does not remove the entire supply zone of any one mill, instead covering
varying proportions of the supply zones of seven mills, while a further three mills draw supply from
areas outside the reserve zone, but from which mills that are impacted draw the remainder of their
wood supply. The removal of one third of supply suggests that one-third of mills will close (or
otherwise that downsizing will remove one third of mill capacity); but it is not at all simple to identify
which mills are most likely to downsize or close in response to the implementation of the reserve.
These same questions can be equally applied in the Western Australian context and it is towards
determining these impacts that the following discussion is directed.
6.2.2.1 Impact of lower jarrah sawlog yield on sawmill sector
The current FMP permitted volume of first and second grade jarrah sawlogs is fully utilised by the
sawmills in south west WA. Table 6-3 summarises current jarrah sawlog supply by sawmill. The
indicative lower wood volume represents a reduction in the volume of first and second grade jarrah
sawlogs of 26,000 m3 per annum (approximately 20 per cent) compared to the level allowed in the
current FMP. It is the opinion of URS that a reduction in the volume of this magnitude is highly likely to
result in the closure of at least one of the larger sawmills, either in the locality of Manjimup,
Greenbushes or Nannup.
URS considers that the closure of one of the larger sawmills is a more likely outcome than the closure
of several small sawmills for the following reason. The larger sawmills are geared towards processing
larger volumes, and unit costs of production will increase as input volumes decrease, potentially
impacting on sawmill viability. On the other hand the smaller mills have suggested that they are better
able to tolerate log size and quality variability and are more adaptable to find and develop niche
markets for their products.

SEIA Draft Forest Management Plan 2014-2023
6 Potential economic impact of implementation of FMP 2014-2023
94 42908086/1/03
Table 6-3 First and second equivalent grade jarrah sawlog supply – current at July 2012
Sawmill Total current annual volume
(m3)*
AusWest Timbers 30,779
Manjimup
Blueleaf Corporation (Whittakers) 36,906
Greenbushes
Nannup Timber Processing 24,345
Nannup
Hexan Holdings (Whiteland) 9,447
Bussleton
Sawmills processing 5,000 to 10,000 m3 11,510
2 sawmills
Sawmills processing <5,000 m3 18,323
11 sawmills
Total 131,310
Source: FPC log supply contract data, provided via email on 12 March
2012 and 9 July 2012
* Note: these figures may include an amount to make up for
under deliveries in previous years but over the 10 year
period of the plan the average will not exceed 131,000
If the large Manjimup sawmill or Greenbushes sawmill were to close, between 4,000m3 and 10,000 m
3
of jarrah sawlogs may become available in excess of remaining contract commitments. This volume
could be redistributed to remaining sawmills and would potentially assist in improving the financial
viability of these mills. If the Greenbushes sawmill were to close, there would also be approximately
3,000 m3 of excess karri sawlogs, and again this timber could be sold by FPC to other sawmills.
The Nannup sawmill currently processes around 24,000 m3 of jarrah sawlogs per annum - 2,000 m
3
less than the proposed reduction under the indicative lower volume. If this sawmill were to close, there
is also likely to be some impact on other sawmills, either the closure of one or two small sawmills, or
reduction in supply to one or several sawmills.
6.2.2.2 Impact on employment in the native forest-based sawmill sector
Following consultation, URS estimates there are some 441 people directly employed in the primary
processing of timber, that is, in sawmills located in the south west region. This workforce is distributed
as shown in Table 5-28. This number excludes associated support services such as harvest and
haulage contractors, mechanics and electricians who are also locally employed.
The closure of one of the larger sawmills will result in direct employment losses in one or more of
these local areas. As an example, if Auswest Timbers Manjimup sawmill were to close it would see the
loss of at least 86 direct employees based upon employment figures provided during the
consultations. Some of these workers may find employment at the other sawmills who would benefit
from an additional supply reallocation from Auswest, but there is likely to be a major direct loss of
employment. Auswest also undertakes secondary processing for both jarrah and karri at Manjimup. If

SEIA Draft Forest Management Plan 2014-2023
6 Potential economic impact of implementation of FMP 2014-2023
42908086/1/03 95
the Manjimup mill is closed, Auswest Manjimup may move its value adding operations for karri back to
Pemberton, which would result in some re-deployment of Manjimup workers.
Within Manjimup, the town most likely to be affected by closure of the Auswest mill, there is already a
high level of uncertainty within the community about the continuation of the industry. Following the
implementation of the current FMP the Shire and businesses within the Shire have been investigating
options for a possible future without a forest products industry. This has extended to the investments
made as part of the SuperTowns program discussed in Section 5.1.7 However, it was noted during
consultations that planning was made more difficult by the lack of certainty and they would welcome
greater surety around the continuation or otherwise of the forest products industry (see also Section
6.3.2 for further discussion of employment impacts).
Employment opportunities may be available to workers in the south west with transferable skills who
can take advantage of the growth in the FIFO resource sector jobs available. However, the number of
these jobs are limited and the lifestyle may not suit everyone. Similarly, people made redundant could
relocate to other locations to find gainful employment, with commensurate disruptions to themselves
personally and to the existing community fabric.
6.2.2.3 Impact of lower karri sawlog yield on sawmill sector
Under the indicative lower wood yield, the volume of karri sawlogs would reduce by 4,000 m3 from
current levels (i.e. a reduction of approximately 7%). This would have an impact on the Auswest
Timbers Pemberton sawmill and/or Whittakers sawmill.
The Auswest Timbers sawmill at Pemberton processes the majority of the karri sawlog resource. It
has a contract for about 45,000 m3 of first and second grade karri sawlogs. According to Auswest
Timbers, the mill needs to operate at a minimum capacity of around 46,000 m3 to be financially viable.
Auswest currently tops up the supply of karri it receives from FPC with other species and privately
sourced wood. Any reduction in supply of karri sawlogs from FPC would impact on the viability of this
sawmill unless it can secure timber from other sources to maintain a minimum input.
Whittakers processes around 7,000 m3 of first and second grade karri sawlogs at Greenbushes and
any reduction in this volume is also likely to have an impact on sawmill viability. If the Whittakers
sawmill were to close, which would be largely driven by the reduction in jarrah volume, the excess
karri resource that would become available could be sold to other sawmills.
6.2.2.4 Impact of lower other bole log yield
Under the indicative lower wood volume, the volume of jarrah other bole logs will reduce from 534,000
m3 to 260,000 m
3 per annum, a reduction of 51 per cent
17 compared to the level allowed under the
current FMP. Over the past five years, the annual harvest and sale of jarrah other bole logs has been
around 120,000 m3. Therefore, the proposed reduction in volume is not expected to impact on
businesses currently utilising this resource as supply will remain sufficient to meet demand.
17
DEC advises that the significant reduction in the other bole log resource is the result of a number of factors, including less
forest area being harvested and a lack of markets for the lower quality resource, giving rise to expected substantial delays in
undertaking early / scheduled thinning in regrowth and mining rehabilitation stands.

SEIA Draft Forest Management Plan 2014-2023
6 Potential economic impact of implementation of FMP 2014-2023
96 42908086/1/03
As discussed in Section 6.1 and Appendix D, FPC has been investigating where there may be
potential new markets and products for the other bole log resource, such as engineered wood
products or veneer. If the other bole log yield is reduced to 260,000 m3 per annum, it is unlikely that
new markets could be supported and the opportunity for investment in these industries and associated
socio-economic benefits would no longer exist.
URS does not have sufficient information to assess any impacts of changes in harvest or haulage
costs of other bole logs that may result under the indicative lower wood volume.
6.2.2.5 Impact of lower yield on harvest and haul sector
The consultation has indicated that although harvest and haulage rates are well protected the sector
remains vulnerable to reductions in volume. One stakeholder suggested that the sector could not
sustain the number of operators at present should there be a reduction in volume. This is partly a
result of the operational model that is being used, that is, harvest and haul operators typically use
multiple crews which require a minimum volume in order to be functional.
As a result of the consultation conducted for this SEIA, URS estimates there are between 100 and 160
people working in the native forest harvest and haul sector. Reliable information on employment
across this sector was not available and URS has made an estimate based on extrapolating
employment numbers received from harvest and haulage companies during the consultation. Under
the indicative lower volume there is likely to be a direct and proportional reduction in employment in
the native forest harvest and haul sector. A 17 per cent overall reduction in volume is estimated to
result in a 17 per cent loss or some 28 direct jobs. These jobs are predominately located in regional
areas but are not necessarily located where a decline in sawmilling might occur.
6.2.2.6 Impact of lower indicative wood volume on forest management
The FPC overhead costs are largely the result of compliance operations and appropriations to DEC for
activities including forest management planning and prescribed burning. FPC operating costs do not
vary significantly with changes to the volume delivered to sawmills. In 2010/11 when Deanmill was
closed and sawlog sales were around 40,000 m3 lower than previous years, FPC only made a very
small profit from native forest operations.
FPC has expressed its concerns during consultation that under the indicative lower wood volume its
dividend to government would be substantially lower than in previous years. No information was
available to determine the thresholds at which the FPC operates at a loss however, in consultations
FPC suggested that concerns may be raised about overall industry viability if FPC operated at or near
financial break-even level.
DEC has advised that there are approximately 250 staff with responsibilities for sustainable forest
management. However, the figure for DEC includes staff that are also involved in plantation forests
and broader land management responsibilities, particularly on the Swan Coastal Plain. Therefore, the
DEC figure may overestimate the number of employees directly involved in native forest wood
production.
6.2.2.7 Employment impacts
The flow-on effects of direct shifts in employment in one sector are often estimated using input-output
models. Employment and income multipliers are used to estimate aggregate impacts across an

SEIA Draft Forest Management Plan 2014-2023
6 Potential economic impact of implementation of FMP 2014-2023
42908086/1/03 97
economy. Schirmer (2012) outlines a range of output multipliers that have been estimated from
studies in Australian forest industries. The range of multipliers identified in Schirmer’s work fell
between 1.2 and 3.08.
In WA, Islam et al (2010) calculated multipliers for agriculture and food industries. These have since
been updated and the forest products industry employment multiplier calculated by Islam is 2.36
(Islam, 2012, pers. comm.). A multiplier of 2.36 indicates that the loss of 100 people employed in the
forest products industry would generate additional job losses of 136 people in the rest of the State’s
economy. The following analysis uses Islam’s estimated multiplier to estimate aggregate employment
impacts.
Table 6-4 summarises the estimated potential direct and indirect employment losses associated with
the native forest-based sawmilling sector if one of the three major jarrah sawmills were to close
because of the implementation of the lower indicative wood volume under the Draft FMP.
Table 6-4 Summary of major employment impacts
Sawmill closure
Sawmill job
losses
Harvest and haul
job losses
Secondary processing
Forest management
Total direct employment
losses
Indirect job
losses1
Total job losses
Whittakers (Bridgetown)
92 28 26 49 195 265 459
Auswest (Manjimup)
86 28 26 49 189 257 445
Nannup plus small mill/s
63 28 26 49 166 225 391
1 Multiplier of 2.36 applied to direct employment losses. Not all direct or indirect job losses would be located in the LGA of the
sawmill closure. Source: URS consultation
The number of harvest and haul job losses is linked to the volume reduction and not to the specific
sawmill affected and therefore URS estimates a loss of 26 jobs as a result of a combined reduction in
jarrah and karri sawlog yield of 17%.
As with the harvest and haul impacts URS considers that the number of job losses in the secondary
processing and forest management sectors is proportional to the reduction in total wood volume.
Indirect job losses are calculated using the multiplier referred to in the Islam et al (2012) study
described above, which is a multiplier of 2.36. While indirect jobs may not be as immediately sensitive
to harvest volume fluctuations as primary activities, direct jobs lost and not replaced with some new
source of economic activity eventually result in reduced employment spread across many sectors.
If Nannup sawmill were to close, it is assumed that one or two small sawmills would also close (as
described in Section 6.2.2.1).
The analysis assumes no change in log or sawn timber prices.
At the aggregate level, the lower indicative wood volume may result in a loss of between 391 and 459
full time positions in south-west WA. However, there is one factor that is likely to alter these
estimations and this relates to total job losses relates to forest management. Regardless of the
reduction in indicative wood volumes for harvest, there remains a need to maintain forest
management activities. Therefore, there is likely to only be small, if any, reduction in the number of

SEIA Draft Forest Management Plan 2014-2023
6 Potential economic impact of implementation of FMP 2014-2023
98 42908086/1/03
forest management workforce. This applies to both DEC and FPC notwithstanding the discussion
about the continued viability of the FPC in Section 6.2.2.6.
Based upon discussions with both FPC and DEC, and considering the budget implications of a
reduction in operating revenue for FPC, the budget appropriation to DEC for services to FPC is likely
to decrease; therefore the potential number of job losses in forest management is estimated to be in
the order of 12.
Given this factor URS presents a revised estimation of the potential job losses as a result of the
implementation of the indicative wood volumes in Table 6-5. Direct job losses range from 129 to158,
not all located in the LGA in which the sawmill is situated. Indirect job losses range from 175 to 215
depending on the location of the mill closure.
Table 6-5 Adjusted estimated job losses by sector
Sawmill closure
Sawmill job
losses
Harvest and haul
job losses
Secondary processing
Forest management
Total direct employment
losses
Indirect job
losses1
Total job losses
Whittakers (Bridgetown)
92 28 26 12 158 215 373
Auswest (Manjimup)
86 28 26 12 152 207 359
Nannup plus small mill/s
63 28 26 12 129 175 304
1 Multiplier of 2.36 applied to direct employment losses. Not all direct or indirect job losses would be located in the LGA of the
sawmill closure. Source: URS consultation
Based upon the labour force in each of the Shires in which the larger mills are located, it is the Shire of
Nannup that will feel the greatest impact if the sawmill there was to close. Should there be direct
employment losses of 128 workers in the Shire of Nannup, this would represent some 16.2 per cent of
the total labour force of the Shire. However, it is likely that some of the 128 workers may reside in
other LGAs (e.g. secondary processors, harvest and haulage contractors and forest management
officers) so the entire job loss impact will be spread across LGAs. Nevertheless, the data in Table 6-6
provide an indication of the potential impact on these townships.
Table 6-6 Job losses as a proportion of local labour force
Labour force March 2012
Direct job losses
% of labour force
Direct job losses
% of labour force
Bridgetown-Greenbushes (S) 2,578 373 14.5% 158 6.1%
Manjimup (S) 6,061 359 5.9% 152 2.5%
Nannup (S) 791 304 38.4% 129 16.3%
Source: DEEWR, 2012
The potential effect of these changes at a community level is discussed in 6.3.2 below.
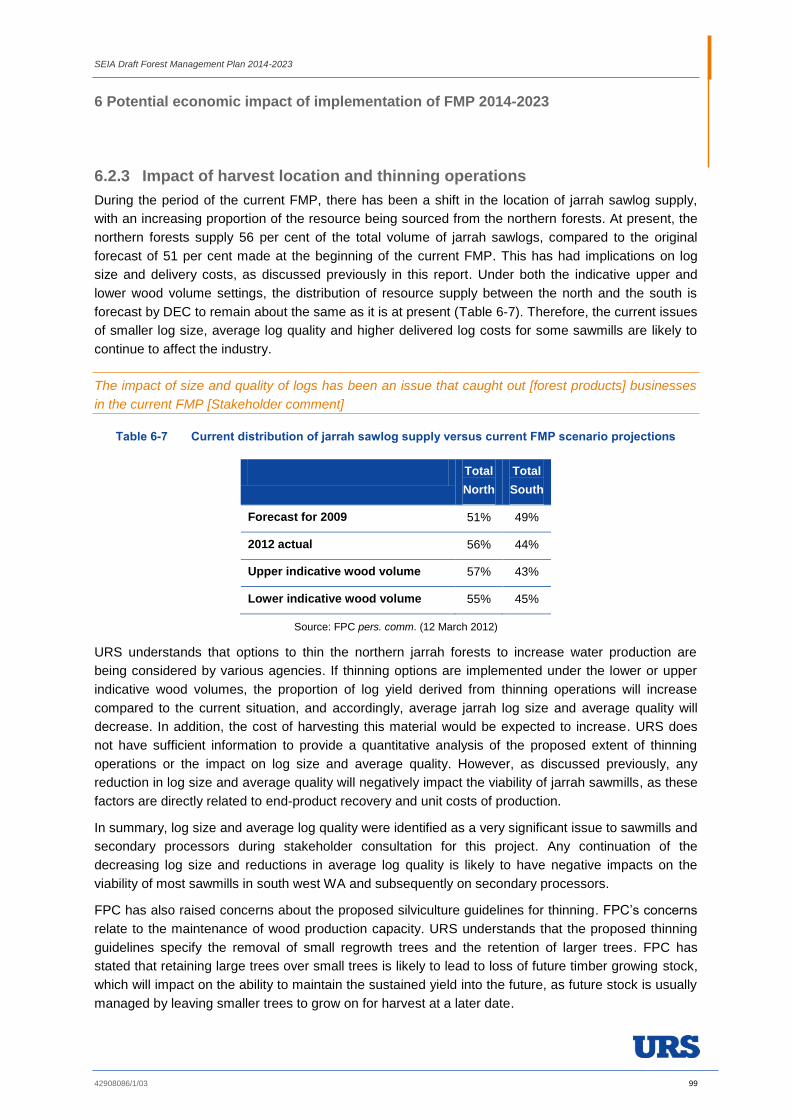
SEIA Draft Forest Management Plan 2014-2023
6 Potential economic impact of implementation of FMP 2014-2023
42908086/1/03 99
6.2.3 Impact of harvest location and thinning operations
During the period of the current FMP, there has been a shift in the location of jarrah sawlog supply,
with an increasing proportion of the resource being sourced from the northern forests. At present, the
northern forests supply 56 per cent of the total volume of jarrah sawlogs, compared to the original
forecast of 51 per cent made at the beginning of the current FMP. This has had implications on log
size and delivery costs, as discussed previously in this report. Under both the indicative upper and
lower wood volume settings, the distribution of resource supply between the north and the south is
forecast by DEC to remain about the same as it is at present (Table 6-7). Therefore, the current issues
of smaller log size, average log quality and higher delivered log costs for some sawmills are likely to
continue to affect the industry.
The impact of size and quality of logs has been an issue that caught out [forest products] businesses
in the current FMP [Stakeholder comment]
Table 6-7 Current distribution of jarrah sawlog supply versus current FMP scenario projections
Total
North
Total
South
Forecast for 2009 51% 49%
2012 actual 56% 44%
Upper indicative wood volume 57% 43%
Lower indicative wood volume 55% 45%
Source: FPC pers. comm. (12 March 2012)
URS understands that options to thin the northern jarrah forests to increase water production are
being considered by various agencies. If thinning options are implemented under the lower or upper
indicative wood volumes, the proportion of log yield derived from thinning operations will increase
compared to the current situation, and accordingly, average jarrah log size and average quality will
decrease. In addition, the cost of harvesting this material would be expected to increase. URS does
not have sufficient information to provide a quantitative analysis of the proposed extent of thinning
operations or the impact on log size and average quality. However, as discussed previously, any
reduction in log size and average quality will negatively impact the viability of jarrah sawmills, as these
factors are directly related to end-product recovery and unit costs of production.
In summary, log size and average log quality were identified as a very significant issue to sawmills and
secondary processors during stakeholder consultation for this project. Any continuation of the
decreasing log size and reductions in average log quality is likely to have negative impacts on the
viability of most sawmills in south west WA and subsequently on secondary processors.
FPC has also raised concerns about the proposed silviculture guidelines for thinning. FPC’s concerns
relate to the maintenance of wood production capacity. URS understands that the proposed thinning
guidelines specify the removal of small regrowth trees and the retention of larger trees. FPC has
stated that retaining large trees over small trees is likely to lead to loss of future timber growing stock,
which will impact on the ability to maintain the sustained yield into the future, as future stock is usually
managed by leaving smaller trees to grow on for harvest at a later date.

SEIA Draft Forest Management Plan 2014-2023
6 Potential economic impact of implementation of FMP 2014-2023
100 42908086/1/03
6.2.4 Impact on secondary processors
Face to face interviews were conducted with three of the larger furniture makers and manufacturers of
timber products including mouldings, door frames and architraves. The following are the key points
raised during the consultation:
There has been an increased demand for marri furniture in the WA market over recent years and
secondary processors would welcome continued access to this resource.
Demand for products for the building and construction industry has been ‘soft’ in 2011/12 and
particularly so in the second quarter of 2012.
There is increasing competition from imported hardwoods for the building industry and these
imported timbers are not necessarily being sourced from sustainably managed sources, and may
also be from illegal operations
The secondary processors noted the change in quality of wood supplied over the past ten years as
well as the change in size. Timber size now varies between 0.9 and 5.4 metres with the smaller
sizes requiring a higher level of labour input to produce marketable products, particularly in the
furniture making industry.
Noted an increase in the price of timber of between 35 per cent to 75 per cent since the
introduction of the current FMP.
On the scenarios: 5 per cent increase in volumes of Marri or Jarrah available would likely have no
discernible impact on Perth based businesses. It might slightly improve their viability but no
significant change. The 5 per cent would have a greater impact on timber communities as it may
mean that sawmills stay in business rather than go out of business.
A decrease in marri would have less of an impact if the marri that were harvested remained in
Australia rather than exported.
Lower quality timbers makes it difficult for high labour cost companies in Australia to be profitable.
Timbers exported to China are better able to be utilised as the cost of labour in China is lower.
A reduction of sawlog supply in the order of the lower indicative wood volume will have a flow on effect
to the secondary processing sector. The larger sawmills are the only mills with the infrastructure to
provide value-added dried material to secondary processors. The combination of lower sawlog yields
and the closure of one of the larger sawmills would result in a reduction in supply of raw materials to
secondary processors, which would directly impact employment and turnover in this sector.
Further decline in log size and quality could also have some impact on supply of larger dimension
timbers to the secondary manufacturing sector and construction markets.
“With lower quality timbers it makes it difficult for high labour cost companies in Australia to be
profitable. If it were exported to China they would probably be able to utilise the low quality timber
better because they can afford the labour required to value-add…”
6.3 Impact assessment – other associated industries
There are a number of other industries that rely on, or take place in areas covered by the Plan, but are
not associated with the harvest of forests for wood. These include:
Other wood resources Craftwood
Tourism and recreation Basic raw materials extraction (e.g. gravel, sand, etc)
SEIA Draft Forest Management Plan 2014-2023
6 Potential economic impact of implementation of FMP 2014-2023
42908086/1/03 101
Apiculture Floriculture and seed industries
Biotechnology Commercial firewood collection
Water resources Mineral resources
The indicative wood supply volumes presented for assessment do not suggest any material changes
to resource access or value that may affect any of the listed industries, other than the following:
Mineral resources - In consultation conducted by the DEC in November 2011, the DMP raised
concerns with extensions to the conservation estate lying over strategic mineral resources,
particularly titanium reserves, that could disallow access to mine the resource. The value of these
known mineral reserves has not been quantified and therefore, the opportunity cost of expanding
the conservation areas is unknown.
Water resources - options to thin the northern jarrah forests to achieve environmental outcomes
and increase water yields are being considered as part of the FMP process, but are still to be
defined. URS understands this will be detailed in the Draft FMP;
Basic raw materials - an option being explored is to implement policy options that would ensure the
extraction comes from a smaller number of larger pits, rather than extraction coming from a large
number of small, dispersed pits. This may add to the cost of supply depending upon the distance to
transport materials from the source pits to end-use location, but should not necessarily limit total
supply; (see Appendix A);
Commercial firewood - DEC has examined options for the future access and management of public
firewood collection in the development of the Draft Forest Management Plan 2014-2023.
Management options may include: DEC transporting firewood in disease risk and other areas to
areas that are accessible to the general public; thinning of selected areas or accessing non-
commercial plantation areas; and moving to a system where firewood is only available from
commercial operators in some locations. Each of these options will have cost implications for
government, consumers of firewood, and the FPC. These have not been estimated by URS.
6.3.1 Impact on forest based economic activity
6.3.1.1 Mineral Resources
Mining and mineral processing makes the largest contribution to the local economy in the south west
region, with coal, alumina and mineral sands making the largest contributions.
Consultation with representatives of the Department of Mines and Petroleum (DMP) identified one
major concern related to access to known mineral reserves under forest and conservation reserves. In
consultation conducted by the DEC in November 2011 the DMP raised concerns with extensions to
the conservation estate over strategic mineral resources, specifically titanium reserves. Should there
be changes to the forest or conservation reserves that limit access to the mineral resources there will
an opportunity cost. The value of these known mineral reserves has not been quantified.
The DMP also made note of the introduction of Mine Closure Plan Guidelines, a joint initiative between
that Department and the Environmental Protection Authority (EPA). The aim of the guidelines is to
ensure that, for every mine in WA, a planning process is in place so the mine can be closed,
decommissioned and rehabilitated in an ecologically sustainable manner, consistent with agreed post-
mining outcomes and land uses, and without unacceptable liability to the State (DMP, 2011). Closure

SEIA Draft Forest Management Plan 2014-2023
6 Potential economic impact of implementation of FMP 2014-2023
102 42908086/1/03
planning should take account of any forest management plan applicable to the area surrounding the
mine.
Companies are expected to adopt a progressive rehabilitation program throughout the life of a mine to
allow for improved rehabilitation outcomes to be achieved. The Mine Closure Plan must identify post-
mining land use(s) and set out site specific closure objectives consistent with those land use(s). The
post-mining land use(s) must be:
Relevant to the environment in which the mine will operate or is operating;
Achievable in the context of post-mining land capability;
Acceptable to the key stakeholders (as defined in Section 4.8); and
Ecologically sustainable in the context of local and regional environment.
Where possible, proponents are encouraged to consider applying resources to achieve improved land
management and ecological outcomes on a wider landscape scale, as well as the potential for multiple
land uses (DMP, 2011: 22)
A second concern raised by the DMP relates to basic raw materials, typically gravel, hard rock, sand
and limestone used in roadway building and other construction primarily by Main Roads WA, DEC and
local government authorities. Extraction of basic raw materials on Crown Land (national parks, state
forests and other Crown reserves) are subject to Section 24 of the Mining Act, 1978, and require the
approvals of the relevant Ministers and Government authorities. These materials are relatively low
value, with the major costs being the extraction of the material and transport. Consequently, access to
resources close to the point of use has a significant impact on the cost of construction.
The removal of gravel and other industrial materials from lands managed by DEC is subject to the
State Gravel Supply Strategy, the DEC Policy No. 2 – Local Government Authority Access to Basic
Raw Materials from State forest and Timber Reserves and the Conservation Commission’s Basic Raw
Materials Policy.
In 1993, DEC and DMP agreed that DEC would manage gravel and other basic raw materials
occurring on DEC managed land. DEC or its agent can take gravel for any agricultural, pastoral,
household, road-making or building purpose, providing that no mining tenement has been granted
over that area. Where other government agencies such as Main Roads WA request to extract gravel
from DEC managed land, DEC may lease those areas to a government agency. However, gravel
taken from a national park or nature reserve may only be used for establishing or re-establishing
public access to the national park or nature reserve. (Environmental Defender’s Office of Western
Australia, 2011). Where this is the case the DMP provides no oversight (and therefore Mine Closure
Planning Guidelines do not apply) of the rehabilitation effort with oversight resting with the DEC and
Conservation Commission.
6.3.1.2 Tourism
The marked volatility in tourism activity in the South West (shown in Section 5.2.4) indicates that there
is no direct relationship between harvesting activities in the forest and level of tourism use. For
example, the period of lower harvest levels post-2003 corresponded to a decline in tourism visitation
to the south west. Recreation is not necessarily incompatible with timber harvesting, and in some
cases facilitates it. For example, some people undertake firewood collection as a form of recreation.
Firewood areas are usually made available following timber harvesting.

SEIA Draft Forest Management Plan 2014-2023
6 Potential economic impact of implementation of FMP 2014-2023
42908086/1/03 103
The question is whether there is unmet demand for areas on which to recreate. The decline in tourism
numbers in the SW over a period where there has been a large increase in land set aside for
conservation indicates that there is no limitation on supply of land suitable for recreation.
The main impacts that the FMP may have will be on tourism operators is where policy decisions alter
the location of access routes where commercial operators have established enterprises based upon
their proximity to the forest. For example Dwellingup Adventures has established itself adjacent to the
Bibbulmun Track and the Munda Biddi trail. They offer equipment hire and supported tours, corporate
and group activities and school excursions. The business relies upon maintaining their (and their
clients) access to the forest region. Should that access be limited, then it will have an effect on their
business viability. Any changes need to be communicated to businesses that rely on the forest for
their livelihood.
There is recognition that the forest products industry itself is also a tourism drawcard. For example,
Dwellingup Timber Centre attracts many visitors, as do the forest products industry museums that
have been established. There is an educational value inherent in these forest products industry places
demonstrating the value of the forest and sustainable forest management.
Through consultations with Tourism WA and local government authorities in the south west region,
URS understands that the tourism sector is struggling in the South West as more domestic tourists
holiday overseas and international tourists stay at home. This has been particularly felt in the towns of
Pemberton, Manjimup and Margaret River where occupancy rates for accommodation have been
lower than long-term averages. While there has been a downturn in tourism in recent years, Tourism
WA expects that visitor numbers will return to higher levels once again and the demand for recreation
and tourism options, including access to the forests in the south west, will increase. However, this will
be dependent upon exchange rates, disposable income, the relative cost of travel to the south west in
comparison to alternative destinations and other factors.
A review of nature-based tourism was conducted in 2007 in recognition of the growth in nature based
tourism over the previous two decades, with the number of operators licensed to undertake
commercial activities in protected areas increasing from around 50 in 1994 to around 400 in 2006.
Outcomes of the review resulted in changes to commercial operating practices; licence and lease
terms for tour operators accessing the State’s conservation estate (Tourism Coordinates, 2007).
The Ministers for Environment and Tourism announced the implementation of recommendations from
the Nature-Based Tourism Review on 7 December 2011. This includes longer-term leases (up to 99
years subject to amendment of the Conservation and Land Management Act 1984 (CALM Act)) and
longer term licences (up to 15 years in total), which will benefit the tourism industry and tour operators
by providing greater surety in their business operation. The changes have been well received by local
tourism organisations, particularly in the south-west.
Tourism and recreation activities may be impacted if there any changes within the Draft FMP that limit
or hinder access to the forests and the activities that can be undertaken in the areas covered by the
Draft FMP.
6.3.1.3 Apiculture
The apiary industry is highly dependent on native forests. In 2012 there are about 1,000 registered
beekeepers with approximately 27,000 hives. About 300 of the smaller commercial operators have an
average of 200-300 hives and are supported economically by other ventures. There are only about 50

SEIA Draft Forest Management Plan 2014-2023
6 Potential economic impact of implementation of FMP 2014-2023
104 42908086/1/03
commercial beekeepers with about 1,000 hives each who derive the majority of their income from the
hives and production of honey. It is estimated that 80% of honey production in WA is derived from
apiaries located on Crown Land (Dave Leyland, pers. comm.).
The industry is considered migratory – beekeepers will ‘follow the bloom’. This refers to the periodic
movement and relocation of beehives to coincide with flowering periods of different preferred flora.
Periodic movement involves beekeepers transporting beehives to sites which may be on private or
public land; for example, farm properties, national or State parks, and state forests, though not
restricted to these.
The warmer Goldfields region has been a desirable destination as a safe feeding area for rebuilding
the strength and health of hives over the winter period. Advice received during consultation was that
DEC had increased the size of reserves around Goldfields thereby restricting access to apiary sites.
Additionally access to Mt Gibson Station (part of the Australian Wildlife Conservancy’s Mt Gibson
Sanctuary) has been withdrawn and this has reduced the areas to which beekeepers can relocate
their apiaries. These changes have impacted parts of the industry who had previously utilised this
resource. Changes in land tenure such as transfer from multiple-use forests to nature conservation
reserves, which can become protected and unavailable for commercial bee keeping, have the
potential to impact on honey production. Migratory beekeepers seek to maintain access to a number
of sites in a variety of floral environments to support a yearly cycle of movements.
According to the Beekeepers consulted, one of the most important areas for honey production in WA
are the jarrah, red gum (marri), blackbutt, white gum (wandoo) and karri forests in the south west area.
Jarrah honey, a leading variety found only in WA, accounts for about 15 per cent of the State’s total
honey production. It is known worldwide for its healing properties and low level of glucose (DAFWA,
n.d.). The jarrah forests are only utilised every second year because of the flowering patterns of these
trees, but if access to these forests was lost then it would be difficult for the industry in WA to be
sustained as a commercial enterprise.
“If we lost access to the jarrah forests then we couldn’t keep bees as a business in WA” [Stakeholder
comment]
In a submission to the 2007 inquiry of the future development of the Australian Honey Bee Industry,
Wescobee Limited (Australia Parliament House of Representatives Standing Committee, 2008) made
the following comment:
…beekeepers need secured access to native forest reserves. They are increasingly being reduced
access to this resource (if we compare the last 30 years alone). Without access to native flora the
commercial beekeeping industry would simply find it very difficult to exist. Continued access to native
flora on private and especially public land is essential for our beekeepers in Western Australia as it
provides critical nutrition for colony build up of the bees and a valuable honey crop production.
Further reservation of land for nature conservation may further limit the resources available to the
industry. However, any expansion of State forests (particularly from unallocated crown land (UCL)
may increase opportunities for apiarists. URS understands there will be a wide range of proposed
reserve changes in the Draft FMP. There may be opportunities for the creation of further apiary sites
on existing state forest, particularly where there are currently vacant sites, and these could be
investigated further.

SEIA Draft Forest Management Plan 2014-2023
6 Potential economic impact of implementation of FMP 2014-2023
42908086/1/03 105
DEC’s management practices, such as the extent and timing of prescribed burning, also have the
potential to adversely affect an apiarist’s use of particular areas of vegetation at a particular time. The
beekeepers consulted stated that continued access to floral resources is considered crucial to the
beekeeping industry and to individual beekeepers.
6.3.1.4 Firewood collection
URS understands there are some changes canvassed in the Draft FMP with respect to public firewood
collection. Both the local governments and Indigenous groups noted the high dependence of a number
of Southwest communities on firewood for heating, particularly the elderly population and Indigenous
communities. The FPC reports that some 50,000 people take advantage of public firewood collection.
If access for public firewood collection were to be constrained, or alternative supply arrangements put
in place, this would bring a significant cost to those in the community reliant on this resource. There is
already a high level of unauthorised firewood collection and the shift to commercial only suppliers, for
example, could further exacerbate this problem and would mean that some people would have to pay
for firewood, who previously have not.
6.3.2 Impact on key communities
Communities that are historically and economically linked to the forest industry are likely to be
impacted in multiple ways when there is a change in the way the industry operates. Foremost are
changes in employment and, subsequently, in spending in the local economy. The extent to which
these impacts occur is not easily determined as it will be dependent on the level of change and the
existing situation in the community. As Schirmer (2011: 39) notes:
The impacts of loss of jobs and expenditure vary for different communities depending on the
characteristics of that community. A community with high unemployment and declining population is
more likely to experience population loss as a consequence of a decline in the forest industry than a
community with a strong employment market and a stable or growing population.
Predicting impacts on communities requires identifying how loss of jobs will impact on factors such as
migration of local population, real estate markets, unemployment, labour force participation, demand
for local businesses and services, community groups and social capital in a given community. This
requires assessing a community’s vulnerability to change and capacity to adapt to change.
Based upon the location of the major native forest based sawmills that may be affected and the
proportion of the local population who are dependent on the sawmills (either through direct
employment, in harvest and haulage, and primary and secondary processing), three communities
emerge as more vulnerable should there be any reduction in the available wood volumes under the
next FMP. These three communities are Manjimup, Nannup and Bridgetown (Greenbushes).
Manjimup
As discussed previously (see sections 3.3.4 and 5.1.7), the Shire of Manjimup is continuing to
experience the effects of the significant restructuring in the forest products industry that occurred as a
result of the Protecting our Old Growth Forests policy, reflected in the settings in the current FMP. The
long-term effect of these changes has been an overarching lack of confidence in the forest products

SEIA Draft Forest Management Plan 2014-2023
6 Potential economic impact of implementation of FMP 2014-2023
106 42908086/1/03
industry. This affects both individual and business long term decision making and creates an
unwillingness to invest in the region.
In 2001, the State government identified a range of initiatives that were intended to off-set the negative
effects of restructuring. Two of the initiatives that were welcomed by the Shire residents related to
tourism and value-adding (e.g. support for furniture manufacturing). Neither initiative is considered to
have offset the losses experienced in the forest products industry (Shire of Manjimup, 2012, pers.
comm.).
Timber Communities Australia (TCA), a not for profit group who had close involvement with Manjimup
community following the restructuring from 2003, believed the forest products industry is a “way of life
for most people” in the town of Manjimup and the mass redundancies that occurred with the
restructuring had a considerable effect on the “emotional well-being” of the community members. They
said was particularly “felt by children of workers who had lost their jobs and the disruptions to home
life that ensued”. The representative from TCA noted that even a small increase in volumes would
have a beneficial impact on the community and restore some of the confidence that had been lost with
the introduction of the current FMP. Equally, there is concern that a reduction in wood volumes may
lead to the closure of the mill and associated industries and bring similar levels of distress that were
seen form 2003.
During consultations with those who have strong links to the Shire and town of Manjimup, there was a
view that the uncertainty that resulted from the earlier restructuring in 2003 had not necessarily lifted.
The uncertainty had been exacerbated by the falling tourist/visitor numbers and the general economic
downturn brought about by the global financial crisis. In response, the Shire has been investigating
options for an economic future that does not have a reliance on the employment and economic
support of the forest products industry. In spite of the recent purchase by Auswest of Gunns Manjimup
mills, there remains, concern in the Shire about the possibility of a mill closure and the flow on effects
that may have for other businesses in the area.
The SWDC commissioned a study to investigate options for the future development of the forest
products industry in the Shire. The AEC Group presented the findings of that study in May 2011.
Broadly, opportunities existed in broadening established markets and opening up new markets. While
a range of options has been explored, there were also a number of constraints to realising the
opportunities that were identified. In addition to financial feasibility, other constraints included low
resource utilisation, lack of investment and incentive to invest, transport costs and lower graded logs
(AEC Group, 2012c; 2012d). The AEC Group concluded;
Manjimup LGA‘s reliance, and subsequently the reliance of Manjimup Town, on the agriculture and
forestry sectors poses a potential risk to the sustainability of the Manjimup economy. Such a heavy
reliance on individual sectors exposes the wealth and well-being of residents to the volatility of that
industry – and in the case of export industries, the volatility of international markets and world prices.
Manjimup Town will need to diversify and broaden its economic base into other industries (or at least
new areas within its favoured agricultural, timber and horticultural industry), so as to ensure the
region’s long term sustainability and reduce its susceptibility to shocks in individual sectors.
The economy of Manjimup will possibly benefit from its inclusion as a SuperTown and the investment
that will flow from this classification. More than $12.6 million has been provided under the SuperTowns

SEIA Draft Forest Management Plan 2014-2023
6 Potential economic impact of implementation of FMP 2014-2023
42908086/1/03 107
program in 2012 to progress two projects designed to create new jobs and industry investment in the
region, and transform the town centre for future development. A document produced by the DRDL
declares “Manjimup is more than a timber town – it has grown to become a premium ‘food bowl’ of
Western Australia”.
The DRDL (n.d.) brochure further states:
Agriculture is Manjimup’s main economic driver – valued at around $96million per annum – and,
despite the industry’s current size, there is capacity for the industry to double, given more investor
confidence, better research integration and pathways to markets. The potential also exists to help the
industry evolve from merely a growers’ market to a value-added food supplier and, given its unique
environment, establish Manjimup as a culinary food destination (DRDL, n.d.).
In addition to the SuperTowns funding, Manjimup has been allocated almost $24.5million in Royalties
for Regions funding. Some of the major projects include the Manjimup Airport, upgrades to community
buildings and facilities (Manjimup town hall, Manjimup council chambers, Imperials Oval, Timber Park
museum, Pemberton community centre, Collier Street recreation centre, Pemberton library and Clem
Collins recreation centre), Pemberton main street upgrade, construction of Seal Mill Hall and of the
boardwalk in Walpole to link the Bibbulmun Track to the town jetty and other town trails and a boost to
the recreational boating facilities at Windy Harbour.
These state initiatives and the resources flowing in to support them should mean that Manjimup and
nearby towns should remain sustainable should the economic contributions of the forest products
industry reduce in this LGA.
Nannup
The consultations undertaken for this study suggest that sections of the Nannup community relate
strongly to their timber history and identify as a ‘timber town’. A large proportion of the town of Nannup
have either an economic or social relationship with the forest products industry and any change that
would see a loss of that industry activity would have a significant impact on this segment of the
community. Although the Shire of Nannup is looking to expand its economic base, particularly through
tourism and agriculture, there remains a strong economic reliance on the forest products industry.
The town of Nannup is home to a number of festivals and attracts many visitors for its nature based
tourism activities that include walking trails and heritage tours. The value of the tourism industry
specific to Nannup is not available. Agricultural production in the area includes dairy, beef cattle,
broccoli and olive oil. Four wineries are also located in the Shire. The area is known for its productive
soils and the Shire suggests that it may attract boutique agricultural enterprises into the area, including
additional wine makers. These industries, if they emerge, will help maintain the economy of Nannup
should there be any loss of the forest product industry in the area.
In the 2003 SIA, Nannup was considered the most vulnerable community affected by the
implementation of the current FMP, due to its marginal growth, high unemployment, and limited
employment opportunities. This situation has not changed in 2012 and Nannup remains vulnerable to
any reduction in indicative wood volumes. Should a decision be taken to close the sawmill in Nannup it
would lead to a significant change in employment opportunities and other aspects of the local
economy.

SEIA Draft Forest Management Plan 2014-2023
6 Potential economic impact of implementation of FMP 2014-2023
108 42908086/1/03
Any loss of population from the area is likely to have flow-on effects to the economy and to service
provision within the town. One area highlighted during the consultation was the effect of a reduced
population on the provision of schooling. Education is provided through the Nannup District High
school, which offers schooling from kindergarten to Year 10. Currently, years 1 through 4 are at full
capacity but years 4 through 10 are low in student numbers. The concern is that if student numbers
fall any lower, the State may elect to close the school.
The WA Department of Education Services procedures for establishing and registering non-
government schools notes the minimum number of children for schools proposing to offer pre-
compulsory and compulsory (years 1 – 7) education is 180 for urban areas and 90 for rural catchment
areas with a population of less than 5,000. Additionally, the minimum number of children for schools
proposing to offer compulsory education (years 8 – 12) is an average of 40 per year level in urban
areas or an average of 25 per year level in rural catchment areas with a population of less than 5,000.
In comparison, the recent School Viability Reference Group in Tasmania proposed the following
benchmarks as a starting point with respect to student enrolment numbers:
Descriptor Primary Secondary Combined
Urban <150 FTE <300 FTE <300 FTE
Rural <100 FTE <200 FTE <200 FTE
Source: School Viability reference Group, 2012
With a total of 120 primary and secondary students, of which 16 are in secondary school, the
sustainability of Nannup District High School may already be questionable. In submissions to the
Tasmanian School Viability study, stakeholders argued that as well as providing an educational
platform for their community, schools contribute to the economic wealth, employment opportunities,
social networks and infrastructure, real estate values and prospective development opportunities of
certain localities. Stakeholders stated that in a number of instances that particular regions were
expecting possible development opportunities in the future and could not have a school closed as it
may jeopardise such development/s. If the Nannup District High School were to close (or to revert to
primary schooling only) this would almost certainly influence the decisions of parents with children in
secondary school as to whether to move to a town with a school or stay in Nannup and have their
children commute.
Bridgetown – Greenbushes
The forestry sector is a significant employer in the Shire of Bridgetown-Greenbushes although the
town of Bridgetown was not considered by stakeholders interviewed for this study to have as strong an
association with the forest products industry as Nannup or Manjimup. However, there are a number of
businesses in the town that service the sawmills and support the harvest and haulage sector.
The major employer in Greenbushes is the minerals lithium mine located south of the town comprising
a number of open cut mining operations for spodumene (lithium). The site contains the largest and
highest grade hard rock lithium minerals resource in the world. According to the Shire of Bridgetown-
Greenbushes, the mine is the largest employer in the Shire with 180 employees including contractors.
In 2011, the mine operator noted that there were further opportunities for extensions to the current
mineral resources and additions to the current mineral reserves within and around the current mining

SEIA Draft Forest Management Plan 2014-2023
6 Potential economic impact of implementation of FMP 2014-2023
42908086/1/03 109
areas which may result in further employment opportunities (Behre Dolbear Australia Pty Limited,
2011).
Two sawmills located within the Shire of Bridgetown-Greenbushes employ approximately 100 workers
with the majority employed at the large Whittakers Sawmill located in Greenbushes. The majority of
the workforce at both of these sites are aged between 30 and 50 years and are resident local to the
mills. One of the major harvest and haul contractors is also located in the Shire of Bridgetown-
Greenbushes and currently employs about 55 staff. Not all of these staff members are resident in
Bridgetown. In addition to those directly employed at the sawmills, the forest products industry in this
LGA is reliant upon locally based service technicians (e.g. mechanics, electricians, fuel suppliers, etc)
and others from Shire of Manjimup and/or Bridgetown.
Representatives from the Shire of Bridgetown-Greenbushes who were consulted for this study
referred to the impacts on the towns in the Shire of the forest products industry, notably the transport
impacts. The Shire is concerned with high proportion of trucks on the roads in comparison with local
traffic. Although they recognise that not all heavy haulage is a result of the native forest products
industry there is, nonetheless, a perception in the town that logging trucks are contributing to safety
issues for pedestrians and other road users and to a ‘poor image’ for the community. The perception
of more heavy haulage may be partially a function of the layout of the town and transport corridor than
reflecting a substantial increase in heavy haulage.
The economy of the Shire of Bridgetown-Greenbushes is not dependent on the forest products
industry as mining, tourism, agriculture and horticulture are all major contributors in the area.
However, there are a number of service industries located within the Shire that provide service support
to the forest products sector. Any reduction in harvesting or processing of wood products is likely to
have a flow-on effect to these service industries. The Shire suggests that these effects will be
“significant”.
Impacts on Indigenous forest users
Two issues are of primary importance to representatives of the Aboriginal community, specifically for
the Noongar People of the south west of WA. These issues related to access to the forests and
consultation around management of the forests. These were also the issues of concern to Aboriginal
groups with the introduction of the current FMP 2003 – 2014.
The major concern is a lack of consultation around activities that take place in the forests, particularly
where those activities are near to places of significant heritage and cultural value. While some
Aboriginal heritage sites are registered on the Department of Indigenous Affairs heritage register,
many are not. This creates some difficulty when activities planned within the forest, ranging from road
building to timber harvesting, do not take account of sites of heritage value and may result in their
destruction or damage. Alternatively, the activity may compromise access to sites of cultural
importance.
Representatives from the South West Aboriginal Land and Sea Council (SWALSC) indicated that the
FPC typically consults with Aboriginal groups in their annual harvest planning but that consultation
relied upon goodwill rather than established formal processes being in place. There is a preference for
more robust processes to be put in place in the next FMP such that consultation is required prior to a
management decision being made and in a timeframe that allows wide community input.

SEIA Draft Forest Management Plan 2014-2023
6 Potential economic impact of implementation of FMP 2014-2023
110 42908086/1/03
There have been concerns expressed by Aboriginal people in relation to some management practices
within the forests, such as, prescribed burning, which is applied to large areas. SWALSC welcomed
the 2011 amendments to the Conservation and Land Management Act 1984 providing for the joint
management with Aboriginal people of DEC managed lands and waters between the DEC and other
landowners, or those with a vested or other interest in the land, including Aboriginal people..
In addition, the amendments to the CALM Act will allow Aboriginal people to undertake certain
activities for customary purposes on reserves, or to take flora and fauna usually protected under the
Wildlife Conservation Act if it is for customary purposes. These activities consist of entering the land,
camping temporarily, driving or riding a vehicle, navigating a vessel, bringing an animal, lighting or
kindling fire, and taking or removing a protected thing (including hunting).
The changes will give Aboriginal people the right to do these activities if it is for a customary purpose
unless they are otherwise restricted or excluded by regulation.
Until the Regulations have been implemented it is not possible to judge the impacts that these
legislative amendments might have.
Peak conservation groups
Invitations were extended to the three major peak groups with an interest in forest management
planning, being the Conservation Council of Western Australia, Wilderness Society and the Western
Australian Forest Alliance. These groups issued a joint letter to the Conservation Commission advising
that they would not be participating in the process.

SEIA Draft Forest Management Plan 2014-2023
42908086/1/03 111
7
7Findings
In February 2001, the new State Government began implementing its Protecting our old growth forests
policy. This included an immediate end to timber harvesting in old-growth forests and work to create
30 new national parks and two new conservation parks. The FMP 2004-2013 came into effect on 1
January 2004 covering the management of the lands vested in the Conservation Commission in the
south-west of WA within DEC’s Swan, South West and Warren regions.
The introduction of the its Protecting our old growth forests policy and the current FMP brought
significant change to several south west communities. Over 100 businesses and 700 workers have so
far been assisted in leaving the native forest products industry A 2005 review by the Auditor General’s
noted there were 716 displaced workers, 79 per cent of whom found employment elsewhere (64 per
cent full time, seven per cent part time, four per cent casual and 25 per cent self-employed). Eighteen
per cent of displaced workers left the workforce altogether and three per cent remained unemployed.
Over 100 businesses were also provided with financial assistance by the State Government as a
result of the restructuring.
The consultations undertaken for this SEIA have found that the townships of Nannup and Manjimup
were particularly adversely affected by the changes brought by the policy and implementation of the
current FMP. It is likely that these two towns, and to a lesser extent Bridgetown, will feel the greatest
impact should the indicative wood volumes be reduced in the Draft FMP. Should the indicative wood
volumes increase in the order identified as the ‘upper’ level by DEC, there is likely to be a marginal
improvement in the viability of the forest products industry but few, if any, flow on effects to the rest of
the economy.
This study has been based upon information provided by DEC with regard to indicative wood volumes.
The ‘upper indicative wood volume’ involves a 5 per cent increase in log volumes compared to the
current FMP. This is essentially a continuation of the existing situation as it does not represent a
significant shift. The ‘lower indicative wood volume’ represents a reduction of 20 per cent in jarrah
sawlog volume and 7 per cent in karri sawlog volume, compared to the current FMP. These upper and
lower indicative volumes guided stakeholder consultation.
Interviews with key stakeholder groups revealed a range of issues/perceived impacts in relation to the
implementation of the FMP. These are summarised in Table 7-1.
Table 7-1 Stakeholder issues associated with the Draft FMP
Key findings for forest products industry
The forest products industry is finely balanced utilising current sawlog volumes
Four major impacts on current viability in the forest products sector have been identified and
these are:
— Several mills are operating at below capacity due to lack of supply as a result of
determinations about permitted log volumes
— There has been a reduction in log size due to sourcing regrowth timber, particularly from
northern forests
— Quality of logs supplied is variable
— Fluctuation in the delivered price of logs as a result of variable transport costs depending on

SEIA Draft Forest Management Plan 2014-2023
7 Findings
112 42908086/1/03
the source location of logs is affecting business decisions
About 55% of logs are expected to be harvested from the northern forests (north of the Preston
River) over the period of the next FMP. This represents no significant change in existing
harvesting practice. In recent years there has been a shift towards higher log production from
northern forests and this has resulted in smaller log size, lower average log quality and higher
delivered costs for some mills. Continuation of this north/south supply balance will continue to
place pressure on mills.
Upper Indicative wood volume outcomes are assessed as follows:
— Forest products industry remains finely balanced and there remains uncertainty across the
industry
— Quality issue remains – flow on impacts to end users where it is not economic to value-add
to poorer quality logs
— Transport costs issues remain
— Impacts as a result of potentially smaller log sizes and transport costs will determine
business decisions of mills and end-users and thus be the key determinant of employment
Lower Indicative wood volume
— Likely to result in the closure of at least one of the larger mills in the south west
— Smaller mills are likely to maintain their presence as they are able to tolerate the size and
quality variability to some degree and have niche market for their product, however one or
more small sawmills may be impacted depending upon which of the larger sawmills closes
— Workforce source communities for the two largest mills are Manjimup, Nannup and
Bridgetown/Greenbushes
o Forest products industry a major employer in these communities. In addition, the
supporting service industries are mostly local and employ significant numbers of
people.
o Agriculture industry diminishing in importance also – fewer people employed in
this sector than previously.
o Tourism in the south west has experienced a downturn since about 2004 and has
not recovered to previously high levels.
o Because impact of exchange rates and other factors, the increases in tourism
expected at the implementation of the current FMP have not eventuated and thus
expectations for tourism-related income have not been realised
o ‘Timber’ communities are anxious about the state of the industry already and this
has impacts on their decisions about the future.
o Closure of mills near to smaller towns will have a significant impact upon those
communities in terms of their population and the business interests in town.
o Some compensation offered with the Protecting our old-growth forests policy and
the current FMP 2004-2013 have not been fully delivered/realised, resulting in

SEIA Draft Forest Management Plan 2014-2023
7 Findings
42908086/1/03 113
wariness in these communities, particularly Manjimup
o Other economic opportunities are limited at present although progressing - actual
and potential mining operations in the area offer alternative sources of
employment
o Investment in Manjimup through the SuperTowns initiative may offset negative
impact of mill closures
o South west communities are looking to become host communities for FIFO
workforce, potentially offering alternative employment opportunities
o Reduction in transport movements would be welcomed by some members of the
south west community (this includes log haulage)
Under the lower indicative wood volume, the lower marri volume available would not be expected to
have a marked impact on the forest products industry as the FPC currently sells only around 12,000
m3/annum of better quality marri logs. The marri-based industry is constrained by the ability to identify
good quality logs, not markets. If FPC were able to identify larger volumes of good quality marri logs,
this additional supply would have positive economic benefits, particularly in the furniture manufacturing
industry which is currently experiencing a high demand for marri products. Conversely, if the volume of
marri harvested decreased under the lower indicative wood volume as a result of changes to forest
areas harvested or available for harvest, this is likely to have a negative impact on the furniture
industry.
The current FMP permitted volume of first and second grade jarrah sawlogs is fully utilised by the
sawmills in south west WA. The indicative lower wood volume represents a reduction in the volume of
first and second grade jarrah sawlogs of 26,000 m3 per annum (approximately 20 per cent) compared
to the level allowed in the current FMP. It is the opinion of the consultant that a reduction in the volume
of this magnitude is highly likely to result in the closure of at least one of the larger sawmills, either in
the locality of Manjimup, Greenbushes or Nannup.
URS considers that the closure of one of the larger sawmills is a more likely outcome than the closure
of several small sawmills. The larger sawmills are geared towards processing larger volumes, and unit
costs of production will increase as input volumes decrease, potentially making the larger sawmills
less viable. On the other hand, the smaller mills have suggested that they are better able to tolerate
log size and quality variability and are more able to quickly adapt to find and develop niche markets for
their products.
Under the lower indicative wood volume, URS has estimated potential job losses as a result of the
implementation of the Draft FMP. Direct job losses for those involved in the forest products industry
range from 129 to158, depending on the closure of one or more sawmills, with those losses not all
located in the LGA in which the sawmill is situated. Indirect job losses, that is, additional job losses
elsewhere in the economy, range from 175 to 215 depending on the location of the mill closure.
Based upon the labour force in each of the Shires in which the larger mills are located, it is the Shire of
Nannup that will feel the greatest impact if the sawmill there was to close. Should there be direct
employment losses of 128 workers in the Shire of Nannup, this would represent some 16.2 per cent of
the total labour force of the Shire. However, it is likely that some of the 128 workers may reside in
other LGAs (e.g. secondary processors, harvest and haulage contractors and forest management

SEIA Draft Forest Management Plan 2014-2023
7 Findings
114 42908086/1/03
officers) so the entire job loss impact will be spread across LGAs. Nevertheless, there is potential for a
significant impact on the town of Nannup.
This SEIA has highlighted potential social and economic impacts that may occur as a result of the
implementation of the Draft FMP. However, due to a number of factors, including lack of data and
access to the Draft FMP, along with time constraints, a more detailed analysis of the impacts has not
been possible. It is anticipated that further social and economic impacts may be raised through the
statutory consultation processes associated with the release of Draft FMP for public comment. It is
understood that DEC and the Conservation Commission will review the submissions in conjunction
with this SEIA and other inputs to revise the FMP for submission to the Environmental Protection
Authority in 2013.

SEIA Draft Forest Management Plan 2014-2023
42908086/1/03 115
8
8Limitations
URS Australia Pty Ltd (URS) has prepared this SEIA in accordance with the usual care and
thoroughness of the consulting profession for the use of the Department of Environment and
Conservation and the Conservation Commission of Western Australia and only those third parties who
have been authorised in writing by URS to rely on this SEIA.
It is based on generally accepted practices and standards at the time it was prepared. No other
warranty, expressed or implied, is made as to the professional advice included in this SEIA.
It is prepared in accordance with the scope of work and for the purpose outlined in the contract dated
20 March 2012.
Where this SEIA indicates that information has been provided to URS by third parties, URS has made
no independent verification of this information except as expressly stated in the SEIA. URS assumes
no liability for any inaccuracies in or omissions to that information.
This SEIA was prepared between 1 May 2012 and 8 August 2012 and is based on the conditions
encountered and information reviewed at the time of preparation. URS disclaims responsibility for any
changes that may have occurred after this time.
This SEIA should be read in full. No responsibility is accepted for use of any part of this report in any
other context or for any other purpose or by third parties. This SEIA does not purport to give legal
advice. Legal advice can only be given by qualified legal practitioners.
Except as required by law no third party may use or rely on this SEIA unless otherwise agreed by URS
in writing. Where such agreement is provided, URS will provide a letter of reliance to the agreed third
party in the form required by URS.
To the extent permitted by law, URS expressly disclaims and excludes liability for any loss, damage,
cost or expenses suffered by any third party relating to or resulting from the use of, or reliance on, any
information contained in this SEIA. URS does not admit that any action, liability or claim may exist or
be available to any third party.
Except as specifically stated in this section, URS does not authorise the use of this SEIA by any third
party.
It is the responsibility of third parties to independently make inquiries or seek advice in relation to their
particular requirements and proposed use of the site.
Any estimates of potential costs which have been provided are presented as estimates only as at the
date of the SEIA. Any cost estimates that have been provided may therefore vary from actual costs at
the time of expenditure.

SEIA Draft Forest Management Plan 2014-2023
42908086/1/03
THIS PAGE INTENTIONALLY LEFT BLANK

SEIA Draft Forest Management Plan 2014-2023
42908086/1/03 117
9
9References
ABC News (2008) ‘Gunns pulls out of Yarloop sawmill’ [online], 10 October 2008, Retrieved from http://www.abc.net.au/news/2008-10-10/gunns-pulls-out-of-yarloop-sawmill/537698 on 13 July 2012
ABC News (2012) ‘Manjimup sawmill back in action [online], 15 June 2012, Retrieved from http://www.abc.net.au/news/2012-06-15/manjimup-sawmill-back-in-action/4073118 on 13 July 2012
Australian Bureau of Agricultural and Resource Economics and Sciences (ABARES) (2011a) Australian forest and wood products statistics, March and June quarters 2011, ABARES, Canberra, November.
ABARES (2011b) Potential effects of climate change on forests and forestry in Australia, Australian
Bureau of Agricultural and Resource Economics and Sciences, Canberra, August.
Australian Bureau of Statistics (1992) 1991 Census Basic Community Profiles
Australian Bureau of Statistics (1997) 1996 Census Basic Community Profiles
Australian Bureau of Statistics (2002) 2001 Census Basic Community Profiles
Australian Bureau of Statistics (2001). 2001 Workforce Population Profile, South West (Statistical
Division) – WA. Australian Government
Australian Bureau of Statistics (2006). 2006 Workforce Population Profile, South West (Statistical
Division) – WA. Australian Government
Australian Bureau of Statistics (ABS) (2007) 2006 Census Basic Community Profiles
ABS (2011a) 2011Census of Population and Housing Time Series Profile
2011Census of Population and Housing Time Series Profile. Bridgetown-Greenbushes.. Cat. number 2003.0
2011 Census of Population and Housing Time Series Profile. Busselton. Cat. number 2003.0
2011 Census of Population and Housing Time Series Profile. Collie. Cat. number 2003.0
2011 Census of Population and Housing Time Series Profile. Harvey. Cat. number 2003.0
2011 Census of Population and Housing Time Series Profile. Manjimup. Cat. number 2003.0
2011 Census of Population and Housing Time Series Profile. Nannup. Cat. number 2003.0
2011 Census of Population and Housing Time Series Profile. Serpentine-Jarrahdale. Cat. number 2003.0
ABS (2011b) National Regional Profiles 2006-2010
ABS (2011c) Australian National Accounts: State Accounts
ABS (2012) - Value of Agricultural Commodities Produced, Australia, 2010-11, Cat. Number 7503.0
Tourist Accommodation, Small Area Data, Western Australia, Mar 2012, Cat. Number
8635.5.55.001
AEC Group (2012a), Collie SuperTown Combined Report, Report prepared for the South West Development Commission, April 2012
AEC Group (2012b), Manjimup SuperTown Combined Report, Report prepared for the South West Development Commission, April 2012
AEC Group (2012c), Options for the Future Development of the Timber Industry in the Shire of
Manjimup (Stage One), Report prepared for the South West Development Commission, May,
2011

SEIA Draft Forest Management Plan 2014-2023
9 References
118 42908086/1/03
AEC Group (2012d), Options for the Future Development of the Timber Industry in the Shire of
Manjimup (Stage Two), Report prepared for the South West Development Commission, May,
2011
Auditor General for WA (2005), Administration of Protection of Old Growth Forest Policy Funding
Programs Report 6 – August 2005, Perth
Australia Parliament House of Representatives Standing Committee on Primary Industries and
Resources. & Adams, Dick. (2008). More than honey : the future of the Australian honey bee
and pollination industries : report of the inquiry into the future development of the Australian
honey bee industry. Canberra: Parliament of the Commonwealth of Australia,
http://www.aph.gov.au/house/committee/pir/honeybee/subs.htm
Behre Dolbear Australia Pty Limited (2011), Greenbushes Lithium Operations NI 43-101 Technical
Report, Report Prepared for Talison Lithium Limited, 15 June 2011
Bureau of Rural Sciences (BRS) (2010). Australia’s forests at a glance 2010: data to 2009. Department of Agriculture, Fisheries and Forestry, Canberra
Burdge, R.J. (2004) The Concepts, Process and Methods of Social Impact Assessment, Social
Ecology Press, Middleton
Busselton Chamber of Commerce and Industry, 2011, Submission to the Commonwealth House of
Representatives Standing Committee on Regional Australia Inquiry into the use of ‘fly-in, fly-
out’ (FIFO) workforce practices in regional Australia, Submission No. 41, 6 October 2011
Carlsen, J. and D. Wood (2004) Assessment of the economic value of recreation and tourism in
Western Australia’s national parks, marine parks and forests, CRC for Sustainable Tourism
Pty Ltd, Gold Coast
Coakes Consulting (2002), Socio-Economic Assessment of the Forest Management Plan, Report
prepared for the Conservation Commission and Forest Products Commission, August 2002
Collie River Valley Visitor Centre, n.d. Accessed from: http://collierivervalley.org.au/
Conservation Commission of Western Australia (Conservation Commission) (2003) Forest Management Plan 2003-14.
Conservation Commission (2012). Forest Management Plan 2004–2013 End-of-term audit of performance report. 30 March 2012. Conservation Commission of Western Australia
Demographic Change Advisory Council (2008) Tasmanian Demographic Change: impact on state
schools Discussion Paper, April 2008
Dare, L. and Schirmer, J. (2012) Western Australia Forest Industry Survey unpublished data. CRC for Forestry, Hobart
Department of Agriculture and Food WA (DAFWA) (n.d.) ‘Jarrah Honey’, Brochure prepared by the Department of Agriculture and Food WA, Retrieved from http://www.jarrahhoneyinfo.com/Jarrah-Honey.pdf, 10 July 2012
Department of Employment, Education and Workplace Relations (2012), Small Area Labour Market, viewed 12 June 2012, http://www.deewr.gov.au/Employment/LMI/Pages/SALM.aspx
Department of Environment and Conservation (DEC) (2007) Policy Statement No. 18 - Recreation,
Tourism and Visitor Services, Government of Western Australia

SEIA Draft Forest Management Plan 2014-2023
9 References
42908086/1/03 119
DEC (2008) Management of commercial harvesting of protected flora in Western Australia 1 July 2008 – 30 June 2013. For submission under the Commonwealth Environment Protection and Biodiversity Conservation Act 1999.
DEC (2012) Beekeeping on Crown Land in Western Australia. http://www.dec.wa.gov.au/content/category/43/117/1993/. Accessed 25 May 2012.
DEC (2011). Timber Resource Profiles Meeting Presentation. Department of Environment and Conservation. Prepared for Forest Products Commission.
DEC (n.d.) ‘Who needs to be licenced?’ http://www.dec.wa.gov.au/content/view/2671/1633/1/1/. Accessed 28 May 2012.
DEC (n.d.) ‘Beekeepers in WA’, http://www.dec.wa.gov.au/content/view/884/1993/. Accessed 28 May 2012
Department of Health (2011), South West Coastal Health Service Plan: Busselton, Margaret River and Augusta, May 2011, WA Country Health Service
Department of Local Government and Regional Development, Statistical Snapshot – Regional Economy, Government of Western Australia, accessed 26 July 2006 at: http://www.dlgrd.wa.gov.au/content.asp?page=statisticInfo/_pubBin/StatSnapshot_regionEconomy.asp
Department of Mines and Petroleum (DMP) and Environmental Protection Authority (EPA), (2011), Guidelines for Preparing Mine Closure Plans, June 2011
Department of Planning (2012), Western Australian Tomorrow Population Report No. 7, 2006 – 2026 Forecast Summary Local Government Areas of WA, Department of Planning, Perth
Department of Regional Development and Lands (n.d.) ‘Manjimup …a WA SuperTown’, SuperTowns Fact Sheet, Government of Western Australia, Retrieved from http://www.rdl.wa.gov.au/publications/Documents/SuperTownsFactSheet-Manjimup.pdf, 10 July 2012
Department of State Development (n.d.) Think Big: Western Australia Big on Winemaking, Retrieved from http://www.dsd.wa.gov.au/thinkbig/_documents/ThinkBig-Winemaking.pdf
Department of Treasury and Finance (DTF) (2010) Regulatory Impact Assessment Guidelines for Western Australia. Updated July 2010.
Environmental Defender’s Office of Western Australia (2011), Gravel Pits and Quarries: Fact Sheet No. 37, Retrieved from http://www.edowa.org.au/files/factsheets/me_gravel.pdf
Environmental Protection Authority (EPA) (2005) ‘Wungong Catchment Environment and Water
Management Project’, Advice of the Environmental Protection Authority to the Minister for the
Environment under Section 16 of the Environmental Protection Act 1986, Perth, Western
Australia, Bulletin 1196, September 2005
FAOSTAT (2012). Online statistical database of the Food and Agricultural Organisation of the United Nations. (http://faostat.fao.org/default.aspx)
Forecast ID (2011), Serpentine Jarrahdale Shire Population Forecasts, accessed in July 2011,
available at: http://forecast2.id.com.au/Default.aspx?id=323&pg=5000
Forest Products Commission (FPC) (n.d.), ‘Availability and supply of domestic firewood, fencing material, specialty timbers and craftwoods – answers to common questions’, Retrieved from http://www.fpc.wa.gov.au/content_migration/_assets/documents/about_us/publications/firewood_questions.pdf, 2 July 2012
FPC (2011) Schedules of Gross Native Forest Stumpages 2004-2011. Provided by Forest Products
Commission.

SEIA Draft Forest Management Plan 2014-2023
9 References
120 42908086/1/03
Forest & Wood Products Australia (2010), RD&E strategy for the forest and wood products sector,
February 2010
GTIS (2012). Global Trade Atlas GTIS. Online database provided by Global Trade Information Service. Available at: http://www.gtis.com/gta/default.cfm?msg=1 Department of Finance ‘Pay-roll Tax’ Source: http://www.finance.wa.gov.au/cms/content.aspx?id=177&linkidentifier=id&itemid=177 .
Harvey Visitor Centre (.n.d) ‘Welcome to the Harvey Visitor Centre’, Retrieved from http://www.harveytourism.com/, 13 July 2012
Islam, N (2010). Personal communication. Senior Economist Department of Agriculture and Food WA, and Adjunct Associate Professor Curtin University of Technology. 20 December 2011.
Maher, D., McCaw, L., and Yates, C. (2010) Vulnerability of Forests in South-West Western Australia to Timber Harvesting Under the Influence of Climate Change. Sustainable Forest Management Series. SFM Technical Report No. 5. Department of Environment and Conservation.
Mayes, R. (2012), Peel Away the Mask II, Report prepared for the Peel Community Development Group Inc. February 2012
MIG (2008). Criterion 6 - Maintenance and enhancement of long term multiple socio-economic benefits to meet the needs of societies, State of the Forests Report 2008. Montreal Process Implementation Group for Australia, Canberra.
Montreal Process Implementation Group for Australia (2008). Australia’s State of the Forests Report 2008. Bureau of Rural Sciences, Canberra
Moore, N. (2012), ‘No coal mining for Margaret River’, Media statement by the Minister for Mines and Petroleum; Fisheries; Electoral Affairs, Tue 24 July 2012, Retrieved from http://www.mediastatements.wa.gov.au/Pages/default.aspx?ItemId=150539, 9 August 2012
Neville, I (2012) Overview of the South West Regional Development Australia Labour Market, Labour
Market Research and Analysis Branch, Department of Education, Employment and Workplace
Relations, Retrieved from http://www.deewr.gov.au/Employment/LMI/RegionalReports
/WA/Pages/2012.aspx, 10 August 2012
Schirmer, J. (2008), Forestry, jobs and spending: Forest industry employment and expenditure in
Western Australia, 2005–2006, Technical report 189, Cooperative Research Centre for
Forestry, Hobart
Schirmer, J. (2012), Assessment of the employment and economic consequences of change in
access to Tasmania’s publicly owned native forests: overview of methodology, Appendix 2 of
the report prepared as part of the Independent Verification Group Socio-Economic Work
Stream Relevant to Tasmanian Forest Inter-Government Agreement (IGA) Progress Report,
February 2012
School Viability Reference Group (2012), Ministerial Report: School Viability, Report to the Minister for
Education and Skills, 31 January 2012, Retrieved from
http://www.education.tas.gov.au/__data/assets/pdf_file/0004/344848/Ministerial-Report-
School-Viability-2012.pdf on 23 July 2012
Shire of Donnybrook-Balingup (2008), Townsite Expansion Strategy, Report prepared by Griffiths
Planning
Shire of Manjimup (2011), Agenda from the Ordinary Meeting of Council, 8 December 2011

SEIA Draft Forest Management Plan 2014-2023
9 References
42908086/1/03 121
Shire of Manjimup, 2012, Business Case Proposal ‘Manjimup’s Agricultural Expansion’, Retrieved
from http://www.manjimup.wa.gov.au, 2 July 2012
Shire of Murray (2010) Youth Strategy 2010-2015.
Shire of Nannup (2011) Forward Plan 2011/12 – 2015/16, Adopted by Council March 2011
South West Development Commission (n.d.) Mining values by commodity. http://www.swdc.wa.gov.au/information-centre/statistics/mining.aspx Accessed June 2012.
South West Development Commission (SWDC) (n.d.) Collie SuperTown: Townsite Growth Plan. Accessed from http://collie.wa.gov.au/live/supertowns/
South West Development Commission (n.d.), ‘Agriculture’, retrieved from
http://www.swdc.wa.gov.au/information-centre/statistics/agriculture.aspx, 16 July 2012
SWDC (2011) South West Trends Report, South West Development Commission, Retrieved from http://www.swdc.wa.gov.au/media/92101/south%20west%20trends%20report%20march%202011.pdf, 23 July 2012
SWDC (2012) Collie SuperTown Combined Report. Accessed from: http://www.swdc.wa.gov.au
Tourism Research Australia (2011). Economic importance of tourism in Australia’s regions. Phase 2:
Large tourism-dependent regions. Department of Resources, Energy and Tourism. Australian
Government.
Tourism Coordinates (2007) Review of nature based tourism, Report prepared for the Minister for the
Environment and Minister for Tourism, March 2007
Tourism Western Australia (2008) Tourism in south-west Western Australia: climate change
vulnerability and adaptation, Report prepared by Tourism Western Australia and the
Department of Environment and Conservation for the Garnaut Climate Change Review, ,
Government of Western Australia
Tourism Western Australia (2010) Australia’s South West: Overnight visitor fact sheet. Years ending December 2008/09/10, Government of Western Australia
Tourism Western Australia (2011a), Shire of Busselton Overnight Visitor Fact Sheet Years Ending
December 2009/10/11, Government of Western Australia
Tourism Western Australia (2011b), Shire of Manjimup Overnight Visitor Fact Sheet Years Ending
December 2009/10/11, Government of Western Australia
Tourism Western Australia (2011c). Register of Significant Tourist Accommodation Development,
Western Australia. Government of Western Australia
Tourism Western Australia (2012). Australia’s South West. Overnight Visitor Fact Sheet Years Ending
December 2009/10/11. Government of Western Australia
URS (2012), Timber Market Survey, Report prepared for Forest and Wood Products Australia, Forests
NSW, Timber Queensland, VicForests, HVP Plantations, Forest Plantations Queensland,
DERM Qld, Forestry Tasmania, Forestry SA, Forest Products Commission WA
Water Corporation (2006), ‘’Collaboration the key to increasing knowledge’, Wungong Whispers, vol. 1, July 2006
Water Corporation (2012), Wungong Catchment Trial Streamflow and groundwater enhancement in
native forest within Treatment Area 4, Water Corporation, Perth

SEIA Draft Forest Management Plan 2014-2023
9 References
122 42908086/1/03
Wescobee Limited (undated) Apiculture. Retrieved from http://www.wescobee.com/faq. Accessed 28/05/12.
Western Australian Farmers Federation (WAFarmers), (2012), ‘Public encouraged to celebrate first WA Honey Week’, Media release issued on 23 May 2012, Retrieved from https://wafarmers.org.au/media-release/198-public-encouraged-to-celebrate-first-wa-honey-week
The Western Australian Newspaper (2011), ‘Jarrah honey crisis as yield wiped out’, page 46
Western Australian Planning Commission (2000) Statement of Planning Policy No. 2.4. Basic Raw Materials.
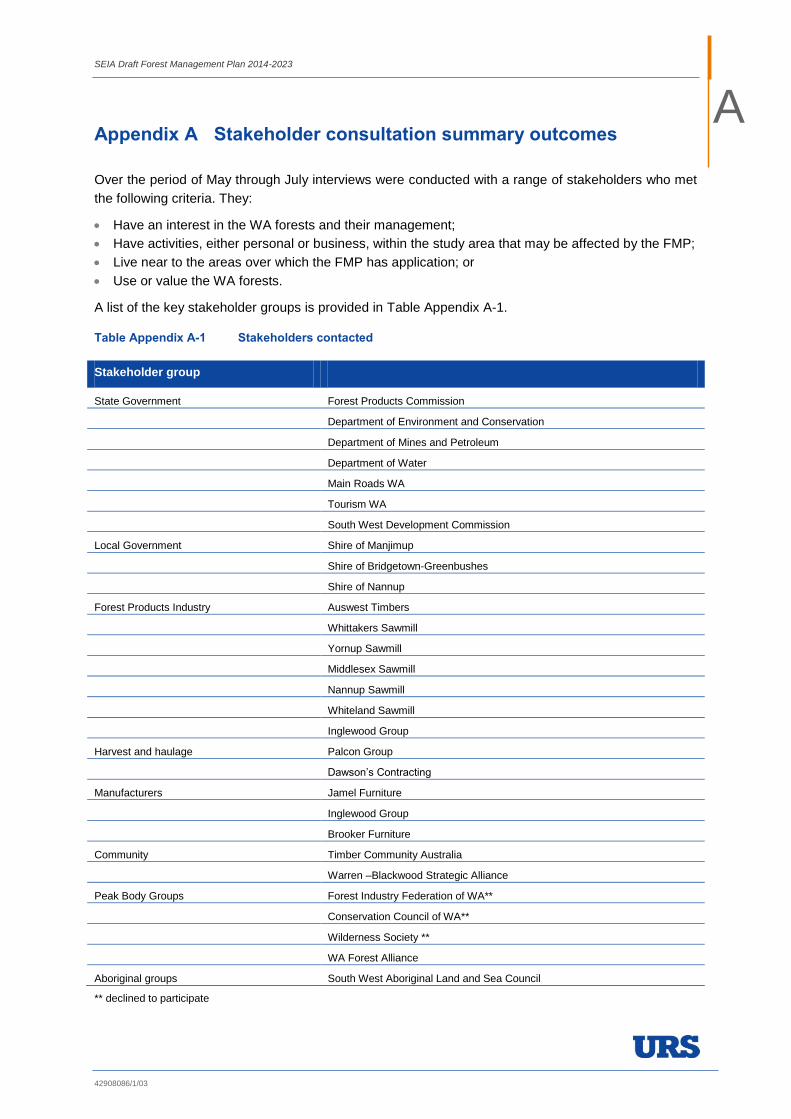
SEIA Draft Forest Management Plan 2014-2023
42908086/1/03
A
Appendix A Stakeholder consultation summary outcomes
Over the period of May through July interviews were conducted with a range of stakeholders who met
the following criteria. They:
Have an interest in the WA forests and their management;
Have activities, either personal or business, within the study area that may be affected by the FMP;
Live near to the areas over which the FMP has application; or
Use or value the WA forests.
A list of the key stakeholder groups is provided in Table Appendix A-1.
Table Appendix A-1 Stakeholders contacted
Stakeholder group
State Government Forest Products Commission
Department of Environment and Conservation
Department of Mines and Petroleum
Department of Water
Main Roads WA
Tourism WA
South West Development Commission
Local Government Shire of Manjimup
Shire of Bridgetown-Greenbushes
Shire of Nannup
Forest Products Industry Auswest Timbers
Whittakers Sawmill
Yornup Sawmill
Middlesex Sawmill
Nannup Sawmill
Whiteland Sawmill
Inglewood Group
Harvest and haulage Palcon Group
Dawson’s Contracting
Manufacturers Jamel Furniture
Inglewood Group
Brooker Furniture
Community Timber Community Australia
Warren –Blackwood Strategic Alliance
Peak Body Groups Forest Industry Federation of WA**
Conservation Council of WA**
Wilderness Society **
WA Forest Alliance
Aboriginal groups South West Aboriginal Land and Sea Council
** declined to participate

SEIA Draft Forest Management Plan 2014-2023
Appendix A - Stakeholder consultation summary outcomes
42908086/1/03
Additional information provided by stakeholders that is not contained in the body of this report is
presented here. The views and opinions expressed by stakeholders are reported as delivered and
have not been subject to verification. These views and opinions do not necessarily reflect those of the
consultant nor of DEC.
Timber processing
Primary processors
Primary processors consulted during this SEIA have identified a number of concerns relating to the
supply and quality of logs harvested. The following discussion reflects the combined findings emerging
from the consultation with seven primary processors.
There has been a noticeable reduction in the quality and size of logs being provided which is having a
flow-on effect to the costs of production as follows:
more time is required to sort through the supplied logs to identify good quality logs for processing
and thus incurs handling cost on the business and reduces throughput efficiency. Logs that do not
meet grade are returned to the haulage contractor and thus impact upon business efficiency and
costs.
Log size and quality has a high impact on recovery volumes.. The cutting equipment in most
sawmills in WA is designed to process larger sawlogs, and timber recovery decreases as log size
and quality decreases. For some mills any logs under 200mm in diameter are not cost effective to
process as the recovery of useable timber is low. The exception to this is Whittakers sawmill which
has a small log line and can handle smaller sawlogs.
Logs that are sourced from the northern forests are typically smaller than logs sourced from the
southern supply zone. Also, northern logs have higher transport costs for mills located in the
southern forests adding around $20/m3 to the overall cost.
The market dictates demand and currently there is a high demand for marri products in line with a
general (current) preference for lighter/blonde woods. The slowdown in the construction sector has
resulted in a decreased demand for structural timbers including floorboards and timber decking.
Demand is also influenced by the extent to which the WA construction and building market shifts to
imported hardwood products. Primary processors highlighted the regulation of the WA forestry sector,
in particular the requirement for ecologically sustainable forestry practices, compared with the lack of
regulation in many overseas forestry sectors – the source location for much of the hardwood timber
products imported into Australia.
State Government
Mineral resources
Mining and mineral processing makes the largest contribution to the local economy in the south west
region, with coal, alumina and mineral sands making the largest contributions.
Consultation with representatives of the Department of Mines and Petroleum (DMP) identified one
major concern related to access to known mineral reserves under forest and conservation reserves. In
consultation conducted by the DEC in November 2011 the DMP raised concerns with extensions to

SEIA Draft Forest Management Plan 2014-2023
Appendix A - Stakeholder consultation summary outcomes
42908086/1/03
the conservation estate over strategic mineral resources, specifically titanium reserves. The value of
these known mineral reserves has not been quantified.
The DMP also made note of the introduction of Mine Closure Plan Guidelines, a joint initiative between
that Department and the Environmental Protection Authority (EPA). The aim of the guidelines is to
ensure that, for every mine in WA, a planning process is in place so the mine can be closed,
decommissioned and rehabilitated in an ecologically sustainable manner, consistent with agreed post-
mining outcomes and land uses, and without unacceptable liability to the State (DMP, 2011).
Companies are expected to adopt a progressive rehabilitation program throughout the life of a mine to
allow for improved rehabilitation outcomes to be achieved. The Mine Closure Plan must identify post-
mining land use(s) and set out site specific closure objectives consistent with those land use(s). The
post-mining land use(s) must be:
Relevant to the environment in which the mine will operate or is operating;
Achievable in the context of post-mining land capability;
Acceptable to the key stakeholders (as defined in Section 4.8); and
Ecologically sustainable in the context of local and regional environment.
Where possible, proponents are encouraged to consider applying resources to achieve improved land
management and ecological outcomes on a wider landscape scale, as well as the potential for multiple
land uses (DMP, 2011: 22)
A second concern raised by the DMP relates to basic raw materials, typically gravel, hard rock, sand
and limestone used in roadway building and other construction primarily by Main Roads WA, DEC and
local government authorities. These materials are relatively low value, with the major costs being the
extraction of the material and transport. Consequently, access to resources close to the point of use
has a significant impact on the cost of construction. Extraction of basic raw materials on Crown Land
(national parks, state forests and other Crown reserves) are subject to Section 24 of the Mining Act,
1978, and require the approvals of the relevant Ministers and Government authorities.
The removal of gravel and other industrial materials from lands managed by DEC is subject to the
State Gravel Supply Strategy, the DEC Policy No. 2 – Local Government Authority Access to Basic
Raw Materials from State forest and Timber Reserves and the Conservation Commission’s Basic Raw
Materials Policy. Gravel has previously been extracted from State forest and timber reserves by way
of a CALM Act forest lease, however, a 2000 amendment to the CALM Act and legal advice now
stipulate that the Department must respond to notices of intent by local government or Main Roads
WA for gravel extraction under the Local Government Act 1995.
In 1993, DEC and DMP agreed that DEC would manage gravel and other basic raw materials
occurring on DEC managed land. DEC or its agent can take gravel for any agricultural, pastoral,
household, road-making or building purpose, providing that no mining tenement has been granted
over that area. Where other government agencies such as Main Roads WA request to extract gravel
from DEC managed land, DEC may lease those areas to a government agency. However, gravel
taken from a national park or nature reserve may only be used for establishing or re-establishing
public access to the national park or nature reserve. (Environmental Defender’s Office of Western
Australia, 2011). Where this is the case the DMP provides no oversight (and therefore Mine Closure
Planning Guidelines do not apply) of the rehabilitation effort with oversight resting with the DEC and
Conservation Commission.

SEIA Draft Forest Management Plan 2014-2023
Appendix A - Stakeholder consultation summary outcomes
42908086/1/03
Community
Local Government
Semi-structured interviews were conducted with representatives of three local government authorities
being the Shires of Bridgetown-Greenbushes, Manjimup and Nannup. The following provides an
overview of the key views and concerns within these communities and that were common across
each.
Each of the Shires are focused on ensuring their economic base is strong and are therefore looking
towards policies that attract investment into the area. All are directed towards diversification of their
economies and reducing reliance on any one industry. The environment (physical, social and cultural)
of the south west lends itself to developing tourism, agriculture, and horticulture and each of the Shires
is seeking to expand these industries. However, there is also recognition of the contribution of the
forest products industry and a desire for this industry to remain.
The identity of shires has been tied to the forest products industry for some time although this is
changing. The same applies to the economy of these three shires. The major employer in the Shire of
Bridgetown-Greenbushes is the mine located at Greenbushes. The second largest employer is the
Whittakers sawmill, who employ approximately 80 people with a further 10 employed at nearby
Yornup Mill. However, it is not only the direct employment in the sawmill but also the employment in
industries servicing the sawmill that is to be considered if there were to be any structural change in the
forest products industry. Local haulage company, Wilson’s Haulage employ approximately 30 to 40
people who are mostly resident in the Shire.
Transport is a major issue for each LGA with the over-riding concern being the impact of log transport
on local and tourist safety, and local amenity. There is generally high proportion of haulage vehicles in
relation to other road traffic and the existing road system means that large transport vehicles travel
through small towns, resulting in road (and pedestrian) conflict. A key determinant of these travel
routes is the location of coupe from which logs are harvested and the location of the sawmill to which
the timber is transported. However, it must be noted that many of the vehicles transporting logs are
hauling plantation logs and not native forest logs and this will continue regardless of the settings in the
next FMP.
While the tourism market is somewhat depressed at the time of writing there has been a growth in the
industry in the south west (see below). One area of growth, described by the LGA representatives, has
been the ‘trails tourism’ market. In the south west a number of trails (e.g. Bibbulmun Track, Cape to
Cape Track, Margaret River Rail Trail, Meelup Reserve Trail, Munda Biddi Trail, Oak Grove Walk, Old
Timberline and Sidings Rail Trails, Understory - Art in Nature, Warren River Loop Walk) are attracting
increasing numbers of visitors. The Bibbulmun Track and Munda Biddi Trail in particular bring
domestic and international visitors traversing these trails into local communities.
Timber Communities Australia
Timber Communities Australia (TCA) is a national not-for profit organisation established 26 years ago
to represent timber communities and timber workers across Australia. TCA aims to promote
“productive conservation” in the forests sector. Membership is broad based and includes employees
and businesses in the forest products industry as well as other interested community members.

SEIA Draft Forest Management Plan 2014-2023
Appendix A - Stakeholder consultation summary outcomes
42908086/1/03
TCA closely monitored the effects of the implementation of the Protecting our old growth forests policy
reflected in the current FMP 2003-2014. Key points raised in the consultation in 2012 are as follows:
The restructuring in 2003 created high levels of uncertainty in the communities with an interest in
the forest products industry. Working in this sector was a “way of life” for many people and the job
losses had a significant impact on the emotional well-being of employees and their families.
Many towns suffered population losses as people moved elsewhere looking for employment.
With the loss of population, a number of businesses were no longer viable and were forced to
close.
Housing prices slumped making it difficult for people to sell their houses or resulted in people
selling their houses at a loss.
In the consultations undertaken for this study, representative of the TCA noted that any increase in
permitted levels of log harvest would help to restore confidence in the industry and in the communities
in which the industry operates. Conversely, should there be a decrease in available log volumes and it
resulted in the closure of a major sawmill then it would have a detrimental effect on the local
community. This would particularly be the case in towns where the sawmill was the major employer as
is the case in Nannup. It is the view of TCA that Nannup would struggle with the closure of the local
sawmill.

SEIA Draft Forest Management Plan 2014-2023
42908086/1/03
THIS PAGE INTENTIONALLY LEFT BLANK

SEIA Draft Forest Management Plan 2014-2023
42908086/1/03
B
Appendix B Interview Schedule
. Sawmills
1 Discuss current resource allocation
- Species, volumes, log grades
- Investment Security Guarantees versus contract volumes versus actual supply volumes
- How have volumes and quality/size changed over time and how has this impacted the business
2 Sawmill capacity
Number of employees (full time and part time) and what is the average age of employees?
What products does the sawmill produce
How does log size impact on product recovery
What inputs (including labour) do you source locally?
What proportion do locally-sourced inputs constitute as a total of all input costs?
Where are your primary markets located?
3 How do the following factors affect business viability
- Log input volume
- Delivered log costs
- Log size and quality
Discuss the tipping points for the business
- Ability to cope with decreased log volumes
- Ability to cope with increased log costs
- Additional resource required to initiate new investment
Secondary Processors
1 Discuss current business
- Products produced
- Timber products purchased from WA sawmills – what’s important – species, quality, timber dimension
- Changes over the last decade – reducing supply of WA timbers, import competition
2 How many people do you employ (specify full time and part time, if applicable)?
What’s the average age of your workforce?
What inputs (including labour) do you source locally?
What proportion do locally-sourced inputs constitute as a total of all input costs?
What proportion of your sales are to local customers?
3 Discuss the impacts of scenarios
- Impact of lower volumes
- Impact of higher volumes
- Impact of increased timber prices

SEIA Draft Forest Management Plan 2014-2023
Appendix B - Interview Schedule
42908086/1/03
Harvest and Haul
1 Discuss process for securing harvest and haul contracts
How have contract volumes changed since 2004 and what has been the impact of this
What proportion of total business income comes from the forest products industry
2 Discuss the impacts of scenarios
- Impact of lower volumes
- Impact of higher volumes
- Impact of change in proportion of resource harvested in the north versus the south
- Impact of increasing volumes transported from the north to the south
3 How many people do you employ (specify full time and part time, if applicable)?
What’s the average age of your workforce?
What inputs (including labour) do you source locally? e.g. do you outsource mechanical maintenance to a local firm?
What proportion do locally-sourced inputs constitute as a total of all input costs?

SEIA Draft Forest Management Plan 2014-2023
42908086/1/03
C
Appendix C Shire of Manjimup analysis of commitments made
Table Appendix C-2 Labor Party election commitments following implementation of the Protecting our old growth forests policy
Protecting our Old Growth Forests Policy election commitments Delivered
yes/no/?
Creating new jobs
Create an independent WA Forest Benefactor Foundation No
Create 100 new jobs in CALM and FPC for forest management No
Create 30 jobs in jarrah and karri regrowth thinnings program No
Create 850 new direct jobs in the plantation industry (1,250 jobs by 2008) No
$5M re-tooling for value adding to safeguard 100 jobs at the Pemberton karri mill Partial
Incentives to Albany based plantation wood chip mill – 230 jobs No
Mobile mill converting logging waste to charcoal blocks – 5 jobs ?
$500,000 for training development Pemberton Aquaculture Centre training for 12 -18
persons each year
No
Laminated veneer lumber plant in WA – 140 jobs Yes (Donnybrook)
MDF or particle board plant using plantations No
Pulp mill using plantation woodchips – 80 to 230 jobs No
Worker and Industry Assistance
Worker assistance program Yes
Timber industry assistance program Yes
Transition to whole bowl logging Yes
Encourage sawing and value adding of marri sawlogs No
TAFE course in Forest Management & Silviculture at Manjimup No
Environmental science degree at ECU Bunbury to include forest management, silviculture
and wood technology
No
Dwellingup and Harvey centres for tertiary units value adding, kiln drying gluing and fine
wood preparation
No
Furniture and fine wood industries (*)
$1m marketing to assist the timber furniture industry No
Create a craftwood licensing system for local WA artisans only No
Royalty subsidy for value adding and increased utilisation ?
Promote greater value adding Yes
Assist furniture companies purchase machinery to generate jobs ?
Nominal royalty portion used for marketing furniture and fine wood No
Support WATC initiatives promoting fine wood craft tourism No
Plantations
Assist industry with infrastructure for value adding plantation timber No
Incentives to encourage long term investment hard & soft plantations No

SEIA Draft Forest Management Plan 2014-2023
Appendix C - Shire of Manjimup analysis of commitments made
42908086/1/03
Protecting our Old Growth Forests Policy election commitments Delivered
yes/no/?
Marketing push for plantation timber to replace jarrah / karri ?
Research plantations species for specialty timber processing ?
Road and rail network improvements to assist plantation industry Partial
Tourism
Walpole Wilderness integral to ecotourism & recreation strategies (subsequently identified
as):
Eco tourism camps
$1m Karri-Tingle Discovery Centre
$2m tourist attraction in the Manjimup/Nannup region
No
No
No
Expansion of regional and rural tourism No
Source: Shire of Manjimup Council Meeting Minutes, 8 December 2011

SEIA Draft Forest Management Plan 2014-2023
42908086/1/03
D
Appendix D Forest products industry market overview
The following provides an overview of the market for forest products. It describes the key end uses for
forest products, the drivers for their ongoing viability and the challenges they face in the current global
economy.
Substantial parts of this summary are also contained in Section 6.1.1.
Markets - sawlogs
The sawn timber market is highly competitive with the output of WA sawmills competing in local timber
markets with domestic supplies from other states as well as international imports of both timber and
non-timber substitutes. As hardwood timber has increasingly been replaced by softwood timber in the
structural timber market, production of hardwood products has moved towards appearance grade
applications. This has favoured jarrah more than karri due to jarrah’s appearance and durability
characteristics being more marketable for flooring and decking products. Furthermore karri has been
replaced in some structural uses by competitor products including those arising from softwood. This
section summarises the current market conditions for products derived from first and second grade
jarrah and karri sawlogs.
Flooring and decking timber
Flooring markets have been very important in the shift to appearance markets for hardwood sawn
timber. Solid spending in residential alterations and additions has ensured there is steady demand for
appearance products such as flooring and joinery timber and for landscaping and decking products.
During downturns in Australian housing commencements, residential alterations and additions has
shown to be a more reliable prospect for hardwoods than the new house construction market.
Indications from timber wholesalers suggest that jarrah flooring sells for around $75-85/m2 for 85 x
19mm standard and better grade delivered retail to the Sydney market. This is broadly similar in price
to Sydney blue gum and blackbutt flooring of the same grade and dimension. Lower value flooring
products such as Victorian ash and Tasmanian oak sell for considerably less than this price range.
Conversely, species such as brushbox and spotted gum tend to sell for a higher price than jarrah. As
such, jarrah could be considered a medium level timber product, in terms of its pricing point in the
market. WA retail prices could be expected to be more cost competitive for consumers due to the
timber not having the cost of freight to eastern Australia built into the price however indications from
flooring manufacturers suggests that the high price of WA native timber tends to “price it out of the
market”.
While the volume of hardwood flooring produced has expanded over the past decade, prices have
also remained relatively strong. Figure Appendix D-1 shows prices over time for flooring available from
the Timber Market Survey (URS 2012). The prices shown are for low feature (select grade) NSW
spotted gum, Sydney blue gum, and blackbutt – all popular flooring species on the Australian east
coast.

SEIA Draft Forest Management Plan 2014-2023
Appendix D - Forest products industry market overview
42908086/1/03
Figure Appendix D-1 Hardwood flooring timber nominal buying price index from NSW wholesalers
80.0
90.0
100.0
110.0
120.0
130.0
Jun
-03
Dec
-03
Jun
-04
Dec
-04
Jun
-05
Dec
-05
Jun
-06
Dec
-06
Jun
-07
Dec
-07
Jun
-08
Dec
-08
Jun
-09
Dec
-09
Jun
-10
Dec
-10
Jun
-11
Ind
ex (
Jun
e-03
=100
)
Spotted gum Sydney Blue Gum Blackbutt
Source: Timber Market Survey (2011)
Structural and outdoor timber
Structural timber is produced from sawmilling jarrah and karri sawlogs. Karri is a high strength timber
with excellent load bearing properties useful in construction. Because this timber has a lower
proportion of appearance grade wood than jarrah, it tends to produce a higher quantity of structural
timber.
The WA housing construction market has been a reliable market over the past 10 years and is
predicted to remain so due to the sound economic base in the State. Housing starts and spend on
alterations and additions have been relatively strong, particularly the alterations market which is
important to the WA hardwood manufacturers (See Figure Appendix D-2). Ongoing opportunities
should still be available for hardwood structural timber particularly where applications can be found
that provide jarrah and karri a competitive edge against mainstream softwood products. Sawmills may
benefit from targeting more niche markets for structural hardwood such as markets for larger
dimension timber products (used for high strength applications and as exposed beams).

SEIA Draft Forest Management Plan 2014-2023
Appendix D - Forest products industry market overview
42908086/1/03
Figure Appendix D-2 Western Australian residential construction activity
0
1
2
3
4
5
6
7
8
0
50
100
150
200
250
Mar
-200
0Se
p-2
000
Mar
-200
1Se
p-2
001
Mar
-200
2Se
p-2
002
Mar
-200
3Se
p-2
003
Mar
-200
4Se
p-2
004
Mar
-200
5Se
p-2
005
Mar
-200
6Se
p-2
006
Mar
-200
7Se
p-2
007
Mar
-200
8Se
p-2
008
Mar
-200
9Se
p-2
009
Mar
-201
0Se
p-2
010
Mar
-201
1
'000
un
its
com
men
ced
Mill
ion
$A
sp
ent
Alterations and additions spending (LHS)
Dwelling commencements (RHS)
Source: ABS (2011)
The timber market still holds strong prospects for the WA hardwood industry. The market for flooring
and decking products in particular is a high volume market with a stable source of demand throughout
the major metropolitan areas in Australia. Reducing domestic and international supplies of native
hardwood timbers creates a positive pricing environment. However cost competitiveness in the
sawmilling sector will be important to its ongoing viability.
Furniture
The world’s largest furniture manufacturers have traditionally been the US, Germany, Japan and Italy.
However, over the last 10-15 years, China has emerged as the world’s largest producer and exporter
of furniture. Chinese furniture exports increased from around 40 million units in 1996 to around 330
million units in 2011 (Figure Appendix D-3). China’s export volume and cost-competitiveness, relative
to other producers has had a large impact on the world furniture industry. In many cases, furniture
manufacturers in western countries have been faced with either outsourcing their production to China
or shrinking their businesses to become more niche, locally oriented markets.
The furniture market in WA has been a significant market in the past for jarrah and karri sawlogs. The
total turnover of the Australian furniture industry was approximately $7.4 billion in 2006/07 (ABS,
2008), however the volume of production has dropped significantly since this time with the increase in
overseas imports of both indoor and outdoor furniture (Figure Appendix D-4).

SEIA Draft Forest Management Plan 2014-2023
Appendix D - Forest products industry market overview
42908086/1/03
Figure Appendix D-3 Australian imports of wooden furniture
Figure Appendix D-4 Chinese exports of wooden furniture
0
50
100
150
200
250
300
350
400
19
95
19
96
19
97
19
98
19
99
20
00
20
01
20
02
20
03
20
04
20
05
20
06
20
07
20
08
20
09
20
10
20
11
Mill
ion
un
its
United States Japan United KingdomGermany Australia CanadaOther
0
5
10
15
20
25
19
95
19
96
19
97
19
98
19
99
20
00
20
01
20
02
20
03
20
04
20
05
20
06
20
07
20
08
20
09
20
10
20
11
Mill
ion
un
its
China Malaysia Vietnam Indonesia Other
Source: Global Trade Atlas (2012)
Source: Global Trade Atlas (2012)
WA has been impacted significantly by the increase in furniture imports into the state. While there is
likely to remain a strong market for locally produced high value hardwood furniture, furniture at the low
end of the value scale is likely to be subject to ongoing pressures from imports. This will limit further
growth in this industry.
On the other hand, ongoing expansion of the furniture industry combined with declining local
resources in Asian countries may provide opportunities to supply sawn timber (typically short lengths
and of a lower quality) to these producers. However, these markets are extremely competitive with
timber from other countries often out competing Australian hardwoods.
Joinery and mouldings
Joinery and moulding applications offer a high value market opportunity for appearance grade
hardwood sawn timber product. The unique appearance of WA hardwood timbers make them
desirable for joinery and moulding end uses. In particular, jarrah timber is used in the manufacture of
moulding and joinery products and receives premium prices in this market. However, it is a highly
competitive market with intense competition from a range of domestically produced and imported
products (hardwood and softwood timber and MDF). Like furniture, the value of mouldings imports has
increased dramatically over the past decade (Figure Appendix D-5).

SEIA Draft Forest Management Plan 2014-2023
Appendix D - Forest products industry market overview
42908086/1/03
Figure Appendix D-5 Value of Australian imports of wooden mouldings by source country
0
50
100
150
200
250
300
350
19
95
19
96
19
97
19
98
19
99
20
00
20
01
20
02
20
03
20
04
20
05
20
06
20
07
20
08
20
09
20
10
20
11
Mill
ion
$A
Indonesia New Zealand MalaysiaChina Chile Other
Source: Global Trade Atlas (2012)
Markets – other bole logs and residues
The main uses of other bole logs and timber residues are firewood, charcoal production from jarrah,
and the export of karri chip. This section summarises the current market conditions for products
derived from other bole logs and timber residues, as well as potential new markets for these products.
Firewood
There are two different ways in which firewood removal from the FMP area occurs: by public firewood
collection and under contract of sale by the FPC to commercial suppliers. Public firewood collection
provides for the gathering of forest produce for home heating and other domestic uses. DEC currently
provides for public firewood collection from state forest and timber reserves. In the Swan Region,
where there is strong demand from the public, DEC issues members of the public with a licence to
collect firewood. The licence is a conditional authorisation that requires collectors to take firewood
from within a public firewood collection area, not to collect within three days following rainfall (to
prevent spreading dieback) and to take no more than one cubic metre of firewood. The numbers of
licences for public firewood collection issued recently in the Swan Region were 1,706, 4,566 and
5,271 in 2008, 2009 and 2010 respectively. This trend indicates that there remains a strong demand
for public firewood (Conservation Commission 2012).
Public firewood is often taken from outside designated areas or in breach of conditions of
authorisation. Surveys of public firewood collection undertaken by DEC indicate that the amount taken
is approximately double the authorised amount.
Firewood removed under contract of sale by the FPC is generally a by-product of harvesting
conducted for sawlogs. The amount of firewood removed under contract of sale is around 10 times
that which is removed via authorised public firewood collection. The FPC administers around 40
individual contracts, each supplying between 200 and 8,000 tonnes per year.

SEIA Draft Forest Management Plan 2014-2023
Appendix D - Forest products industry market overview
42908086/1/03
The amount of firewood removed to service FPC contracts of sale has been steady and consistently
well below the amount authorised, suggesting that demand for firewood is generally stable and is less
than the available supply. Table Appendix D-3 below shows the volume removed by FPC compared to
contracted volume from 2004 to 2010.
Table Appendix D-3 Firewood removal under contract
2004 2005 2006 2007 2008 2009 2010
Number of contracts 42 45 41 44 39 32 45
Contract volume (tonnes) 51,300 87,200 88,000 83,400 84,400 78,600 82,600
Removed volume (tonnes) 50,800 55,600 54,000 32,300 41,200 45,500 47,300
% of contracted volume removed 99% 64% 61% 39% 49% 58% 57%
Source: Conservation Commission (2012)
Woodchip export
Hardwood woodchips have a short fibre length that makes them well suited to the production of pulp
for high quality printing and writing papers. Australian woodchips have historically been traded almost
exclusively in the Pacific Rim market. The Pacific Rim woodchip market is driven largely by Japanese
demand and to a lesser extent by China and South Korea. FPC (and predecessor agencies) has
overseen the export of karri woodchips to Japan since the early 1970s.
Japan relies predominantly on imported hardwood fibre to supply its pulp production sector. Between
1994 and 2008, annual Japanese hardwood chip imports had increased from approximately 9 million
bdmt to 12 million bdmt. In 2009, when domestic paper production fell, the demand for hardwood chip
imports also fell by around -26%. Japan has historically relied on imports of both native forest and
plantation woodchip to meet its demand; however, the Japanese market has a preference for
plantation woodchips due to the perception amongst consumers that plantation forestry is more
environmentally sustainable.
China has been the world’s largest producer of paper since 2008 when it overtook US production
output. Since 2000, the growth of paper production in China has increased almost three fold, despite
the international impact of the global financial crisis (Figure Appendix D-6). Historically, China has
relied on non-wood fibres, low quality domestic sources of pulpwood or imported wood pulp rather
than importing large quantities of woodchips for pulp conversion. However, since 2000, Chinese paper
production has grown particularly fast, resulting in corresponding growth in demand for pulp and
woodchips.

SEIA Draft Forest Management Plan 2014-2023
Appendix D - Forest products industry market overview
42908086/1/03
Figure Appendix D-6 Chinese paper & paperboard production by type
Figure Appendix D-7 Chinese hardwood chip imports by source country
0
1
2
3
4
5
6
7
19
95
19
96
19
97
19
98
19
99
20
00
20
01
20
02
20
03
20
04
20
05
20
06
20
07
20
08
20
09
20
10
20
11
Mill
ion
BD
MT
Vietnam Thailand Indonesia Australia Other
Source: FAOSTAT (2012) Source: GTIS (2012)
China’s current woodchip supply means that ongoing developments in pulp production capacity will
most likely result in a further increase in demand for woodchip imports. Where possible, China will
continue to source low cost woodchips from the Asia-Pacific for these mills. However, the price of
woodchips from current suppliers will be influenced by pulp industry developments in their own
countries, particularly in the case of Vietnam and Indonesia where a number of green field
developments are proposed. Constraints in supply from these suppliers may place upward pressure
on prices and leave Australia in a stronger position as a key fibre supplier. This is a positive outlook for
Australia, particularly for native woodchips, which will eventually be diverted from Japan into
alternative markets (such as China) due to growing Japanese preference for plantation woodchips.
The price of Australian woodchip exports to Japan increased steadily in nominal terms from 2000 to
2008, reaching a high in 2008, with free on board18
(FOB) prices of $A185/bdmt for native chip and
$A207/bdmt for Tasmanian blue gum E. globulus plantation chip. These prices were maintained in
nominal terms since 2009 and 2011 despite the market downturn. However, price negotiations in early
2012 have largely resulted in a price decrease of around $10/bdmt for both planation and native forest
woodchips.
Generally woodchips are traded internationally in US dollars. In the case of the Japanese market,
Australia is an exception and trades directly in Australian dollars. As a result, the Australian woodchip
Cost, Insurance, Freight19
(CIF) price often exhibits different price trends because of exchange rate
movements that are unique to Australian supply contracts. As the Australian dollar strengthens against
the US dollar, Australian hardwood chips become more expensive relative to other producers and less
18
The Free on Board price of an internationally traded good is the price of producing and delivering a good up to the point of loading on delivery transportation to the buyer. An FOB price therefore excludes freight, insurance costs and foreign exchange risk but includes delivery to a port of export and loading onto a vessel where relevant. 19
The Cost, Insurance and Freight price of an internationally traded good is the price producing and delivering the good to the buyer’s port of destination, inclusive of insurance, freight and other delivery costs.

SEIA Draft Forest Management Plan 2014-2023
Appendix D - Forest products industry market overview
42908086/1/03
cost-competitive as a fibre source for Japanese buyers. The appreciation of the Australian dollar since
early 2009 has decreased Australia’s competitiveness in US dollar CIF terms.
Given that Australia is currently the highest cost supplier to the Japanese market, there is likely to be
pressure for Australian exporters to lower prices in order to align the price of Australian woodchips
with its international competitors.
Chinese buyers generally pay lower prices for hardwood chips than Japanese buyers and import
predominantly from the immediate South East Asian region. Anecdotal evidence suggests that China’s
predominant concern is maintaining a low cost fibre source rather than other factors such as woodchip
quality or species preferences. This is reflected in the substantially lower CIF prices that Chinese
buyers pay and in the fact that Chinese buyers appear to more readily import Australian native
woodchips where Japanese buyers are showing increasing hesitancy. Figure Appendix D-8 shows the
quarterly average CIF price trend in US dollars for major countries supplying China.
Figure Appendix D-8 Quarterly CIF price of hardwood chip exports to China (US dollars)
Source: Global Trade Atlas (2012)
Woodchip export will remain an important market for woodchips produced as a bi-product of native
forest harvesting in WA. FPC has historically exported around 160,000 bdmt of hardwood chip to
Japan each year. This volume is expected to reduce to around 130,000 bdmt in 2012. The reduction in
both export volume and price will place some pressure on woodchip revenues from WA native forest
operations. There is also the risk that the Japanese market for native forest woodchip will continue to
shrink.
On the other hand, China presents a market opportunity for WA native forest woodchip. As pulp
capacity in China increases in coming years, the country will look for increasing supplies of better
quality woodchip. However, export to China will be constrained by high exchange rates.

SEIA Draft Forest Management Plan 2014-2023
Appendix D - Forest products industry market overview
42908086/1/03
Charcoal
FPC has a contract with Simcoa Operations Pty Ltd (Simcoa) for the supply of residue wood extracted
from Alcoa bauxite mine sites in the northern jarrah forest. The residue timber, comprising branches,
stumps and otherwise unsaleable logs, is processed on-site into small consignments and transported
for manufacture into charcoal at Simcoa’s Kemerton silicon smelter. Each year Alcoa mines
approximately 650 hectares of jarrah forest with approximately 160,000 tonnes supplied annually.
Potential new markets
URS recently reviewed potential new markets for the WA native forest logs as part of a separate
project undertaken for the FPC. Summaries of the market opportunities considered to have the most
potential are provided below.
Veneer/plywood
Australian plywood mills are typically small by international standards and demand has increasingly
been met by imports over the last decade. However, a veneer operation has been established in
Tasmania by a Malaysian company. Declining supplies of tropical hardwood logs in SE Asia is likely to
have been a factor in the investment.
There may be a similar opportunity for processing of native timber in south west WA. Peeling trials
have suggested that dry veneer recovery of up to 70% is possible, though the logs required are likely
to have comparatively demanding specifications in terms of defects and the presence of knots. A
component of the supply is therefore likely to have to come from what is currently allocated to
sawmills. However, around 20-30% of the supply may also be able to be supplied as shorter lengths
than typical sawlogs which may enable increased recovery from the other bole (non-sawlog)
component of the resource.
Engineered wood
As mentioned in section 3.3.2, a large proportion of the available other bole log resource is not utilised
due to a lack of markets. Engineered wood products were considered by URS to represent one of the
best options for utilisation of the other bole log resource.
Engineered wood products based on stranded wood technologies such as laminated strand lumber
(LSL) and oriented strand lumber (OSL) are well established in North America but are not commonly
found in Australia. There is a case for the introduction of laminated strand lumber and board products
in Australia based on the assumption that they could provide an alternative to LVL, solid wood
products, steel and potentially some domestic and imported hardwood products.
There could be an opportunity to use the lower quality native forest logs, which still have high inherent
strength properties, to be processed using reconstituted or stranding technologies. A product similar to
LSL or OSL could potentially be produced. A key attribute of any engineered wood product is the
consistent and known characteristics it has (compared to other wood products which can be quite
variable). An engineered wood product manufactured from jarrah and/or karri is also likely to be high
in strength and stiffness, and have high impact resistance due to its high density.
A key consideration would be the volume of wood fibre required for a full scale plant, which, URS
believes would require a log input of 300–400,000 m3. While less demanding in terms of defects in the

SEIA Draft Forest Management Plan 2014-2023
Appendix D - Forest products industry market overview
42908086/1/03
logs, log length and straightness requirements would mean that not all other bole logs would be
suitable.
Bioenergy
There are opportunities for bioenergy production based on woody biomass feedstocks. The growing
maturity of bioenergy technology due to strong industry development in Europe means that production
costs have lowered significantly and bioenergy has become increasingly viable in localised areas
where either production costs can be lowered significantly or demand for on-site energy is high.
Government support for the emerging bioenergy sector is currently a limiting factor in its development.
Therefore, at this stage, bioenergy ventures are highly case specific and are unlikely to be competitive
where strong business conditions and/or government assistance are not present.
In 2008, a proposal to develop a Biomass Power Plant near Manjimup was submitted to the EPA by
Western Australia Biomass Pty Ltd, a joint venture company formed by Babcock and Brown and
National Power. The proposed 40 MW (nominal) Biomass Power Plant facility consisted of a
conventional steam cycle plant generating approximately 322GWh (net) / annum of electrical power
which will be supplied to the South West Interconnected System (SWIS). The proposed plant would
occupy the former Diamond Mill site in Manjimup.
The project gained the necessary environmental approvals to burn residue from plantation timber (with
conditions) in late 2008. However, the plant has faced substantial opposition from conservation groups
and primary producers and has not yet been built.
There may be strong localised cases for bioenergy production including production processes where
heat can be captured and utilised for commercial processes or public facilities. Development of
combined heat and power (CHP) facilities outside of the forest products sector (where it has already
been demonstrated as viable) will require strategic marketing either from forest growers/managers or
from government or a combination of the two.
Local industries requiring heat of around 5MW (for example abattoirs and dairies) requires around
15,000 green tonnes of biomass feedstock per year. Larger combined heat and power plants (20+
MW) would require at least 60,000 green tonnes per year.
The market for wood pellets is developing quickly in Europe and North America and one Australian
company has already ventured into supplying this market based on hardwood plantation resource.
This operation proved unviable and export oriented wood pellet production based on forest residues
remains challenging due to shipping costs and the current exchange rate. Wood pellet production
currently favours the use of sawmill residues; however, technologies for utilising forest residues have
been developed and are increasingly being adopted to increase feedstock availability. Wood pellet
production and energy from wood pellets could be used in residential and industrial situations in WA,
as well as supplying export markets, particularly Europe where energy from wood pellet burning has
expanded significantly.

SEIA Draft Forest Management Plan 2014-2023
42908086/1/03
E
Appendix E Indicative harvest plans
SEE FOLLOWING PAGES

SEIA Draft Forest Management Plan 2014-2023
42908086/1/03

SEIA Draft Forest Management Plan 2014-2023
Appendix E - Indicative harvest plans
42908086/1/03

SEIA Draft Forest Management Plan 2014-2023
42908086/1/03

URS Australia Pty Ltd
Level 4, 226 Adelaide Terrace
Perth WA 6000
Australia
www.ap.urscorp.com