Embed Size (px)
Citation preview
HAL Id: hal-00719745https://hal.inria.fr/hal-00719745v2
Submitted on 28 Nov 2012
HAL is a multi-disciplinary open accessarchive for the deposit and dissemination of sci-entific research documents, whether they are pub-lished or not. The documents may come fromteaching and research institutions in France orabroad, or from public or private research centers.
L’archive ouverte pluridisciplinaire HAL, estdestinée au dépôt et à la diffusion de documentsscientifiques de niveau recherche, publiés ou non,émanant des établissements d’enseignement et derecherche français ou étrangers, des laboratoirespublics ou privés.
SoC-Trace InfrastructureGeneroso Pagano, Vania Marangozova-Martin
To cite this version:Generoso Pagano, Vania Marangozova-Martin. SoC-Trace Infrastructure. [Technical Report] RT-0427,Inria. 2012, pp.33. <hal-00719745v2>

ISS
N02
49-0
803
ISR
NIN
RIA
/RT-
-427
--FR
+EN
G
TECHNICALREPORTN° 427July 2012
Project-Team MESCAL
SoC-Trace InfrastructureGeneroso Pagano, Vania Marangozova-Martin


RESEARCH CENTREGRENOBLE – RHÔNE-ALPES
Inovallée655 avenue de l’Europe Montbonnot38334 Saint Ismier Cedex
SoC-Trace Infrastructure
Generoso Pagano ∗, Vania Marangozova-Martin †
Équipe-Projet MESCAL
Rapport technique n° 427 � version 2 � version initiale July 2012 �version révisée November 2012 � 33 pages
Résumé : Les traces d'exécution sont largement utilisées pour la mise au point et l'optimisa-tion des applications embarquées. Dans ce contexte, le projet SoC-Trace a pour objectif de fournirune infrastructure logicielle ouverte, capable d'exploiter de manière e�cace les traces provenantd'exécutions de systèmes embarqués multi-c÷ur. Ce rapport décrit l'architecture système et logi-cielle du premier prototype de l'infrastructure. Ce prototype comprend, d'une part, un modèle dedonnées qui représente les concepts intervenant lors de l'analyse de traces. D'autre part, il fournitune implémentation de ce modèle pour les bases de données relationnelles, ainsi qu'une interfacelogicielle pour son exploitation. Les utilisateurs peuvent travailler avec des traces de formats dif-férents, les accéder à travers une interface uni�ée et, après analyse, stocker les résultats dans labase de données. En fournissant des mécanismes partagés et réutilisables, l'architecture permet lacollaboration de plusieurs outils d'analyse de traces, facilitant ainsi la création de chaînes d'analysede traces innovantes et complexes.
Mots-clés : Traces d'exécution, débogage, pro�ling, systèmes embarqués, multi-c÷ur, sourcelibre, gestion de traces, infrastructure, modèle de données, base de données, format de trace, SoC.
This research is supported by the FUI Project [1]

SoC-Trace Infrastructure
Abstract: Execution traces are a powerful instrument for debugging and pro�ling embed-ded applications. The SoC-Trace project aims at developing an open-source trace managementinfrastructure able to exploit multi-core embedded-systems execution traces. This document des-cribes the �rst prototype of the trace management infrastructure, clarifying its objectives anddescribing its system and software architectures. The infrastructure provides, in the �rst place, ageneric data-model representing the main concepts needed for trace management. Furthermore,the infrastructure provides a relational-database implementation of this model and a softwarelibrary to interface with the database in a convenient way. The proposed prototype allows theuser to deal with traces of di�erent formats, to access them through a common interface and�nally to save analysis results. Providing shared and reusable mechanisms, the trace managementinfrastructure facilitates the cooperation among di�erent tools, thus creating an innovative andcomplex trace analysis environment.
Key-words: Execution traces, debugging, pro�ling, embedded systems, multi-core, open source,trace management, infrastructure, data-model, database, trace formats, SoC.

SoC-Trace Infrastructure 3
Table of contents
1 SoC-Trace Project 4
2 Infrastructure Objectives 4
3 System Architecture 43.1 Multi-Trace DB . . . . . . . . . . . . . . . . . . . . . . . . . . . . . . . . . . . . . 5
3.1.1 Conceptual model . . . . . . . . . . . . . . . . . . . . . . . . . . . . . . . 53.1.2 Database architecture . . . . . . . . . . . . . . . . . . . . . . . . . . . . . 73.1.3 Database schema . . . . . . . . . . . . . . . . . . . . . . . . . . . . . . . . 7
3.2 SoC-Trace Library . . . . . . . . . . . . . . . . . . . . . . . . . . . . . . . . . . . 133.3 SoC-Trace Management Tool . . . . . . . . . . . . . . . . . . . . . . . . . . . . . 14
4 Software Architecture 144.1 Java interface to the DB . . . . . . . . . . . . . . . . . . . . . . . . . . . . . . . . 15
4.1.1 Model . . . . . . . . . . . . . . . . . . . . . . . . . . . . . . . . . . . . . . 154.1.2 Storage . . . . . . . . . . . . . . . . . . . . . . . . . . . . . . . . . . . . . 174.1.3 Query . . . . . . . . . . . . . . . . . . . . . . . . . . . . . . . . . . . . . . 184.1.4 Search . . . . . . . . . . . . . . . . . . . . . . . . . . . . . . . . . . . . . . 214.1.5 Utilities . . . . . . . . . . . . . . . . . . . . . . . . . . . . . . . . . . . . . 23
4.2 Management Tool . . . . . . . . . . . . . . . . . . . . . . . . . . . . . . . . . . . 234.2.1 Core . . . . . . . . . . . . . . . . . . . . . . . . . . . . . . . . . . . . . . . 234.2.2 Ui . . . . . . . . . . . . . . . . . . . . . . . . . . . . . . . . . . . . . . . . 23
5 External Tools 245.1 KPTrace Importer . . . . . . . . . . . . . . . . . . . . . . . . . . . . . . . . . . . 24
5.1.1 Parser architecture . . . . . . . . . . . . . . . . . . . . . . . . . . . . . . . 245.2 Test Tool . . . . . . . . . . . . . . . . . . . . . . . . . . . . . . . . . . . . . . . . 25
6 Performance Evaluation 266.1 Trace DB size . . . . . . . . . . . . . . . . . . . . . . . . . . . . . . . . . . . . . . 266.2 Trace import time . . . . . . . . . . . . . . . . . . . . . . . . . . . . . . . . . . . 276.3 Bu�ered reading . . . . . . . . . . . . . . . . . . . . . . . . . . . . . . . . . . . . 286.4 Complex parameters queries . . . . . . . . . . . . . . . . . . . . . . . . . . . . . . 29
7 Future Works 307.1 Database architecture . . . . . . . . . . . . . . . . . . . . . . . . . . . . . . . . . 307.2 Analysis result . . . . . . . . . . . . . . . . . . . . . . . . . . . . . . . . . . . . . 317.3 Tool management . . . . . . . . . . . . . . . . . . . . . . . . . . . . . . . . . . . . 317.4 Other improvements . . . . . . . . . . . . . . . . . . . . . . . . . . . . . . . . . . 31
8 Conclusions 31
RT n° 427
4 G.Pagano & V.Marangozova-Martin
1 SoC-Trace Project
Execution traces are a powerful instrument for analyzing embedded systems behavior. Theyare used for understanding particular behaviors of a system, for debugging, for pro�ling and foroptimization. The research on trace management is currently raising more and more interest inboth industrial and academic world [2] [3].
The main objective of the SoC-Trace project [4] is the development of a generic trace mana-gement infrastructure and a set of tools able to exploit multi-core embedded-systems executiontraces. The infrastructure should be able to store and analyze multiple traces of di�erent formatswhose size can be huge (i.e. of the order of TB). The infrastructure is to be open source, genericand e�cient. The �nal goal is to have di�erent tools, built on top of the infrastructure and provi-ding new analysis methods, like data mining analysis, probabilistic analysis, richer visualizationtechniques, etc.
The trace management infrastructure, described in this document, has a critical importancein the whole project, since it de�nes the interfaces to access trace data and analysis results, thusbeing an integration point for the di�erent analysis tools.
2 Infrastructure Objectives
The main objectives of the infrastructure are :• The management of several traces in a database, using a shared generic data-model.• The management of di�erent tools able to work on traces.• The management of the analysis results produced by the various tools.The infrastructure shall be generic, since its usage must not be limited to a single trace
format or a speci�c tool. Its data-model shall be able to re�ect di�erent trace formats anddi�erent analysis results. The infrastructure, being open source, shall provide extensible andreusable mechanisms. At the same time it shall be able to manage external black-box tools.The infrastructure shall be e�cient, being in charge of dealing with huge amount of data : anexecution trace, in fact, can easily exceed the size of several GBs or almost TBs. Finally, theinfrastructure shall be complete, meaning that all the required functional and non functionalrequirements described so far shall be accomplished.
The following sections of this document are organized as follows. Section 3 presents thesystem architecture, with emphasis on the data-model. Section 4 provides some details on theinfrastructure software architecture, with the description of the main modules. Section 5 des-cribes two external tools developed to work with the infrastructure. Section 6 shows some �rstperformance evaluation results obtained with the infrastructure prototype. Section 7 describesthe future works we are planning. Finally, section 8 concludes.
3 System Architecture
The SoC-Trace infrastructure is built on top of the Eclipse Platform [5], which has beenchosen because it is easily extensible and well designed in order to be used as an integrationpoint for di�erent applications. In order to take the greatest advantage of the Eclipse Platformcapabilities, the Java programming language has been chosen. The general architecture of theSoC-Trace infrastructure is shown in Figure 1.
The elements strictly belonging to the SoC-Trace infrastructure are :• The Multi-Trace DB : a database able to store (meta)information about traces, traceanalysis tools and analysis results. The traces can be of di�erent formats, the tools can
Inria

SoC-Trace Infrastructure 5
Multi-Trace DB(MySQL)
SoC-Trace Library (Java)
SoC-Trace Management Tool
Tool y
--------
Black Box Tools
External Files
Java Tools
Tool x
Fig. 1 � SoC-Trace Infrastructure Architecture
provide di�erent types of analyses and the results may be of various types. The databasestores also references to external �les, in order to make it possible to organize the di�erent�les related to a trace.
• The SoC-Trace Library : a software library composed by a set of Eclipse plugins, providinga convenient interface to deal with the database and the entities of the data-model.
• The SoC-Trace Management Tool : a simple front-end tool used to graphically executebasic management operations on the whole system.
The infrastructure source code is written in Java, since the use of this language is, at the mo-ment being, mandatory to write Eclipse plugins. However, the infrastructure is able to manageboth Java and non-Java tools. The latter have the possibility to access directly the databaseand the external �les, without necessarily passing through the SoC-Trace Library. The databasemanagement system (DBMS) we have chosen is MySQL [6]. The main motivations are its scala-bility and �exibility, its good performance and its open source license. In the following sectionswe describe in detail the three main blocks of the SoC-Trace infrastructure.
3.1 Multi-Trace DB
3.1.1 Conceptual model
The conceptual model of the SoC-Trace Multi-Trace DB has been designed with the aim ofcapturing the most signi�cant concepts concerning the area of execution traces management andanalysis. We have organized these concepts in three groups :
• Trace General Information : here we will typically gather information about the tracingcon�guration and the �les related to a trace.
• Raw Trace Data : this includes the registered-execution data, i.e. the events and theirformat, as well as the information about their producer.
RT n° 427

6 G.Pagano & V.Marangozova-Martin
• Analysis Data : this concerns the meta-data about the used analysis tools and the di�erentanalysis results.
We can �nd these three groups, with their corresponding entities, in the Crow's Foot diagramshown in Figure 2.
TRACE
EVENTEVENT_PRODUCER
FILE TOOLANALYSIS_RESULT
SEARCH RESULT_FILE
Trace General Information
Raw Trace Data
Analysis Data
ANNOTATION
STATISTIC
other ...
EVENT_GROUP
EVENT_TYPE_GROUP
GROUP
EVENT_SEARCH
EVENT_PRODUCER_SEARCH
other ... other ...
PROCESSED_TRACE
Fig. 2 � Conceptual Model
The system manages several execution traces (TRACE), which can be related to one or more�les (FILE) (e.g. con�guration �les, raw trace �les, IP-XACT [7] hardware description �les).
Each trace is composed by several events (EVENT), an event being some change in thestate of the traced system. An event is caused to happen by a single active entity we call anevent producer (EVENT_PRODUCER). Examples of event producers are typically processesor threads. An event producer can generate several events and there can be a hierarchy amongevent producers (e.g. a process creating son processes).
The model also integrates information about the tools performing operations on traces (TOOL).Tools may save the results of their analyses (ANALYSIS_RESULT) in order to avoid their (pos-sibly expensive) re-computation. In the current model, an analysis result involves a single trace.In the diagram, the concept of analysis result is modeled as an abstract entity, which has itsconcrete realizations in speci�c kinds of analysis results. We have de�ned namely :
• Searching/Filtering (SEARCH) Result : a result of a searching/�ltering operation, whichcan be performed over the events or over the event producers of a trace.
• Custom File (RESULT_FILE) Result : this models a result which is stored in a custom�le outside of the infrastructure. The database contains only the reference to the �le, thesemantics of the �le content being understandable by the tool that produced the �le.
• Grouping (GROUP) Result : a result structured in terms of groups of model entities (events,types of events or types of event parameters), possibly de�ning a hierarchy among suchgroups.
• Generic Annotation (ANNOTATION) Result : an annotation is an analysis result whichdescribes itself (it uses the Self-De�ning Pattern, discussed in section 3.1.3). It allows thetool to de�ne both the structure and the value of the result.
• Processed Trace (PROCESSED_TRACE) Result : this result is a trace produced aftertreating another trace through, for example, adding additional information.
A detailed description of each kind of analysis result is provided in section 3.1.3.By de�ning a standard interface for analysis results, the infrastructure enables the cooperation
among di�erent tools. For example, using the analysis result provided by the data-model, it ispossible for a tool A to retrieve the results of a tool B, perform other elaborations and �nally
Inria

SoC-Trace Infrastructure 7
produce another result. Furthermore, a shared set of analysis result types is also a base brick forthe de�nition of complex work�ows among di�erent tools.
3.1.2 Database architecture
The Multi-Trace DB is designed as a two-level hierarchy of databases, as shown in Figure 3.
• Traces general information
• Tools registry
• Raw trace events
• Event producers
• Trace related files
• Analysis result
Fig. 3 � Multi-Trace DB architecture
The entry point of this database architecture is the System DB, which contains generalinformation about traces and the registry of the tools registered to the infrastructure. Then,there are several Trace DBs, each containing the information related to a single trace. Moreprecisely, a Trace DB stores raw events, event producers, �le references and analysis resultsrelated to the concerned trace.
We have chosen such distributed architecture mainly for simplicity of implementation, sca-lability and e�ciency. Indeed, the database schema of each Trace DB is simpler compared toa centralized solution. Yet, it is still possible to perform multi-trace (multi-DB) queries withMySQL. Other points that would impact the performance in a centralized solution are the spaceoverhead to store a �trace id� in all rows of almost all tables, the time overhead to perform queriesin presence of the above mentioned �trace id� and the presence of huge tables, which can lead tothe necessity of table partitioning [8].
This distributed architecture leaves the place for extensions. In particular, if in the futuremulti-trace analyses will be performed, the System DB schema will be accordingly extended tosupport the storage of such multi-trace analysis results.
3.1.3 Database schema
Before explaining in detail the System DB and Trace DB table structures, we present theconcept of Self-De�ning Pattern which is used in several places.
RT n° 427

8 G.Pagano & V.Marangozova-Martin
Self-De�ning Pattern
In both System DB and Trace DB, we have used a Self-De�ning Pattern (SDP) in orderto achieve the greatest genericity of representation. A SDP, as the name suggests, allows therepresentation of both values and their structure (type) information.
In order to illustrate this pattern, let us consider an Element (Figure 4).
Fig. 4 � Self-De�ning Pattern (SDP)
The SDP represents the Element concept using 4 tables.An Element (ELEMENT) has a type (ELEMENT_TYPE) which is described by a given setof parameter types (ELEMENT_PARAM_TYPE). The values of these parameters for a givenElement are stored in the ELEMENT_PARAM table. So the right part of the SDP describes thetype of an Element (type and related parameter types), while the left part contains the values(the Element prede�ned attributes and parameters values). Each table contains the IDs (primarykeys or foreign keys) necessary to perform the join with the other tables.
The Self-De�ning Pattern is used in the DB schema to model the concepts of Trace, Eventand Annotation. In the following, when talking about a generic concept modeled using the SDP,we will often use the name Element to identify such generic concept.
System DB and Trace DB schema
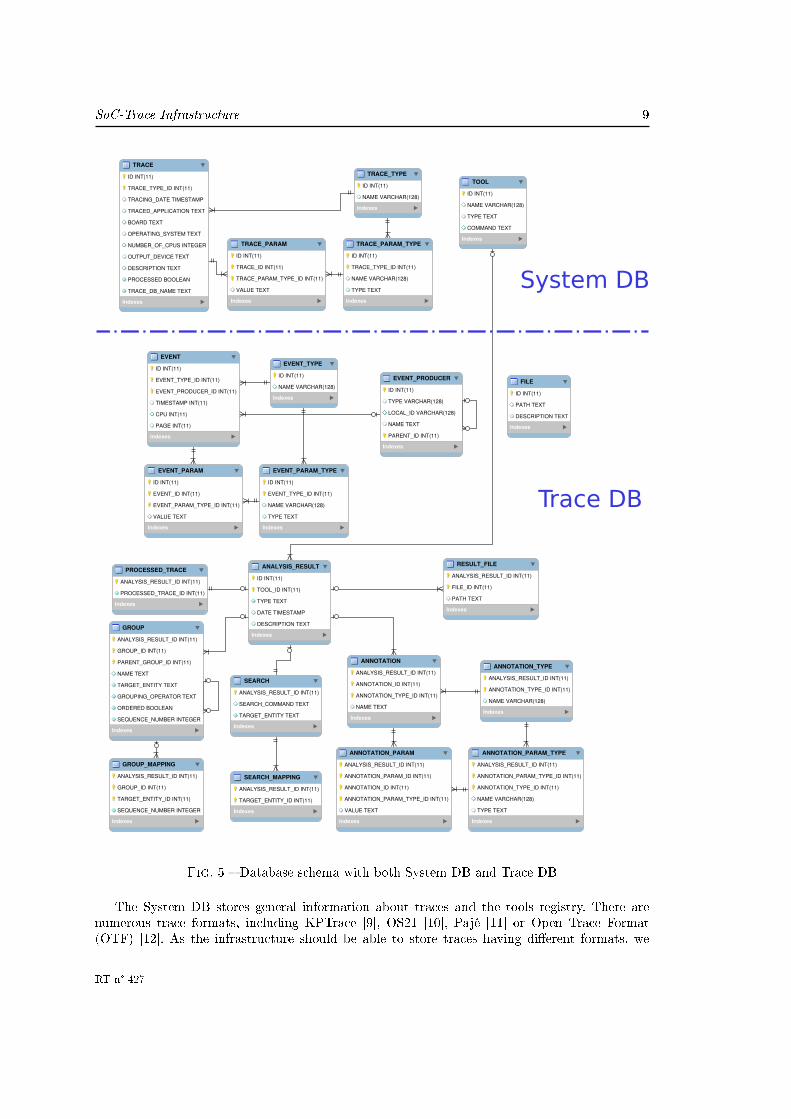
Figure 5 shows both System DB and Trace DB database schemas, using the Crow's Footnotation.
Inria
SoC-Trace Infrastructure 9
System DB
Trace DB
Fig. 5 � Database schema with both System DB and Trace DB
The System DB stores general information about traces and the tools registry. There arenumerous trace formats, including KPTrace [9], OS21 [10], Pajé [11] or Open Trace Format(OTF) [12]. As the infrastructure should be able to store traces having di�erent formats, we
RT n° 427

10 G.Pagano & V.Marangozova-Martin
have used the SDP for the representation of the Trace concept. In this case a trace type identi�esa particular kind of trace (e.g. KPTrace trace) and the parameter types can be conveniently usedto model speci�c con�guration parameters, necessary to describe the environment where thattrace has been produced (e.g. version of a driver, version of the tracing API, etc.). On the otherhand, in the TRACE table, we store some attributes common to all kinds of trace (whatevertrace type), like the date the trace has been produced and the number of CPUs.
The Tool concept is described by its name, its type and its launching command. The supportedtypes of tools are currently : IMPORT and ANALYSIS. The �rst group concerns the tools incharge of importing raw traces into the infrastructure : the idea is to have a speci�c importerfor each kind of trace format, which acts as an adapter from the speci�c format details to theSoC-Trace data-model. The second group of tools is quite large and includes all the tools ableto perform whatever kind of analysis on a trace : pattern mining analysis, probabilistic analysis,etc.
Note that there is no explicit link between the TOOL table and the trace SDP tables, sincethis link passes through the Trace DB (whose name is one of the prede�ned attributes stored inthe TRACE table). The Trace DB stores the link between the result of one analysis performedon the trace and the ID of the tool performing such analysis.
The Trace DB stores the raw trace data and the trace analysis results. For the ease ofexplanation, we can separate the Trace DB schema in two parts, the one related to the raw traceand the one related to the analysis results.
Trace DB : raw trace data
Fig. 6 � Trace DB : raw trace data
In Figure 6 we can see the raw trace data section of the Trace DB schema. This part of theTrace DB stores information about raw events of di�erent types, event producers and �les relatedto the trace. As a trace may contain di�erent types of events (e.g. context switch events, memoryallocations, etc.), we have represented the event concept using the SDP. Thus we can store in theEVENT table the attributes common to all event types (e.g. the timestamp or the CPU wherethe event has been produced), and use the other tables to describe the parameters typical of a
Inria

SoC-Trace Infrastructure 11
speci�c event type (e.g. a context switch event could be described by the new PID and the oldPID). An event producer is described by its type (e.g. process, thread, etc.), its local identi�er(e.g. the PID, if the producer considered is a process) and its name. The EVENT_PRODUCERtable contains also a parent ID, intended to allow an importer tool to build a hierarchy amongsources, while parsing the trace (e.g. threads created by a process). A �le (FILE table) is simplydescribed by its path and a custom textual description.
Example Let us consider how an event related to a context switch (name CS) could bemapped to the model. The event is traced with the following format :
<timestamp> CS <oldpid> <newpid>
A concrete event could be the following :
227.537525 CS 0 21
This line can be imported into the database �lling the four Event-SDP tables as shown inFigure 7.
EVENTID EVENT_TYPE_ID EVENT_PRODUCER_ID TIMESTAMP CPU PAGE.. .. .. .. ..9 3 54 227.537525 0 0.. .. .. .. ..
EVENT_TYPEID NAME.. ..3 CS.. ..
EVENT_PARAM_TYPEID EVENT_TYPE_ID NAME TYPE.. .. .. ..14 3 OLDPID INTEGER15 3 NEWPID INTEGER.. .. .. ..
EVENT_PARAMID EVENT_ID EVENT_PARAM_TYPE_ID VALUE.. .. .. ..37 9 14 038 9 15 21.. .. .. ..
Fig. 7 � Example of event importing
The event type mnemonic (CS) is used to �ll the EVENT_TYPE table : the NAME attributeis CS and the corresponding ID is 3. This event type is described by two event parameter types,the OLDPID and the NEWPID, both typed INTEGER. So in the EVENT_PARAM_TYPE tablewe have the corresponding two lines, where the EVENT_TYPE_ID attribute is 3 and thespeci�c IDs of the parameter types are respectively 14 and 15. Coming to the EVENT table, the<timestamp> value (227.537525) of the trace line is used to �ll the prede�ned attribute withthe same name, the EVENT_TYPE_ID is again 3 and the ID is 9. The values given to theother attributes of the EVENT table depend on the context when the event was produced (whatprocess, what CPU, etc.). Finally in the EVENT_PARAM table we �nd two lines, correspondingto the two parameter types describing this event. Both lines have the EVENT_ID set to 9.The line corresponding to the OLDPID has the EVENT_PARAM_TYPE_ID set to 14 and the
RT n° 427

12 G.Pagano & V.Marangozova-Martin
VALUE set to 0, the other line (NEWPID) has the EVENT_PARAM_TYPE_ID set to 15 andthe VALUE set to 21.
Trace DB : analysis result data
Fig. 8 � Trace DB : analysis result data
In Figure 8 we can see the analysis result part of the Trace DB schema. This part allowsthe representation of di�erent analysis results produced by analysis tools. The entry point tounderstand this part is the ANALYSIS_RESULT table. Each analysis result is described by aunique identi�er (ID), the identi�er of the tool that performed the analysis (TOOL_ID), the typeof analysis result produced (TYPE), the date of the analysis (DATE) and a custom description(DESCRIPTION). Considering the TYPE �eld, the data-model currently allows �ve di�erentkinds of results to be stored in the DB :
Custom result �le This result type is represented using the RESULT_FILE table, whichstores the analysis result ID, the �le ID (a result can contain more than one �le) andthe �le path.
Grouping A grouping is composed by several groups of entities of the data-model (for themoment being it is possible to create groups of events, of event types or of event parametertypes). A grouping can be possibly organized as a hierarchy of groups. For each group ofa grouping it is possible to de�ne several structural properties. First of all you specify thetarget entity being grouped (EVENT, EVENT_TYPE or EVENT_PARAM_TYPE) andthe grouping operator (AND, OR). Then you specify if there is a total ordering among
Inria

SoC-Trace Infrastructure 13
the entities grouped (TRUE, FALSE). Finally it is possible to specify a sequence number,meaningful if the parent group is ordered. This result type is represented using two tables :• GROUP : it stores the analysis result ID, the group ID (a grouping result can of courseinvolve several groups), an optional parent ID (used to build hierarchies), the groupname, the target entity name, the grouping operator, the ordered �ag and the sequencenumber.
• GROUP_MAPPING : this table links each group (GROUP_ID) with the target en-tity instances belonging to that group (TARGET_ENTITY_ID). In a hierarchy, onlyleaf groups (the ones actually containing entity instances and not containing only othergroups) are present here. The key of the table contains both the group identi�er and theentity identi�er, thus making it possible to have more entities in a given group and thesame entity in more than one group.
Searching/Filtering A searching or a �ltering of entities of the data-model produces as outputa list of such entities. Currently it is possible to save the searching/�ltering output relatedto events or event producers. This result type is represented using two tables :• SEARCH : it stores the analysis result ID, the custom command used to perform thesearch/�ltering operation (tool dependent) and the target entity name.
• SEARCH_MAPPING : this table lists the IDs of the entity instances being the resultof the search/�ltering operation.
Annotations This result type is intended to be as generic as possible, leaving to the analysistool the freedom of de�ning a result format and saving the corresponding values. This kindof result is therefore implemented using the SDP. A tool can de�ne an annotation type,specifying the corresponding parameter types. Then the tool can create concrete annotationinstances of such type, computing the parameters values. An analysis tool, in a singleanalysis, can de�ne several annotation types and for each type can save several concreteannotation instances. For example, a tool can de�ne an annotation type representing a�memory statistic�, being described by two parameter types : �memory used by functionX� and �memory used by function Y�. Then the tool can compute for each CPU the valuesfor such parameters and save them in di�erent annotation instances (one for each CPU).
Processed trace This result type is actually a link to another trace, being created starting fromthe current trace (the trace corresponding to the current Trace DB) and performing somekind of processing. The result type is saved in the PROCESSED_TRACE table that, inaddition to the analysis result ID, simply contains the processed trace ID. In practice, theprocessed trace is stored in another Trace DB, thus being a completely normal trace : thesingle particular to consider is that in the TRACE table of that Trace DB, the PROCESSED�ag shall be set to TRUE.
As anticipated above, the precise de�nition of common analysis result types is a powerfulenabler for the cooperation among di�erent analysis tools. For example, being the groupingresult type format de�ned, a tool A can reuse a grouping de�ned by a tool B, in order to performits elaboration. Let's imagine that the tool B identi�es a pattern (saved as a group of eventtypes) : the tool A can take into account this pattern de�nition to perform a �ltering of theevent instances for that pattern in order to do further analysis.
3.2 SoC-Trace Library
The SoC-Trace Library is a software library written in Java, providing a convenient interfaceto the Multi-Trace DB. The library is composed by a group of Eclipse plugins and allows Javaexternal tools and the SoC-Trace Management Tool to interact with the database in a convenient
RT n° 427
14 G.Pagano & V.Marangozova-Martin
way. In fact it provides an object oriented vision of the data-model and several mechanisms todeal with the objects of the model without caring about SQL and databases low level issues.More details about this software library are given in section 4.1.
3.3 SoC-Trace Management Tool
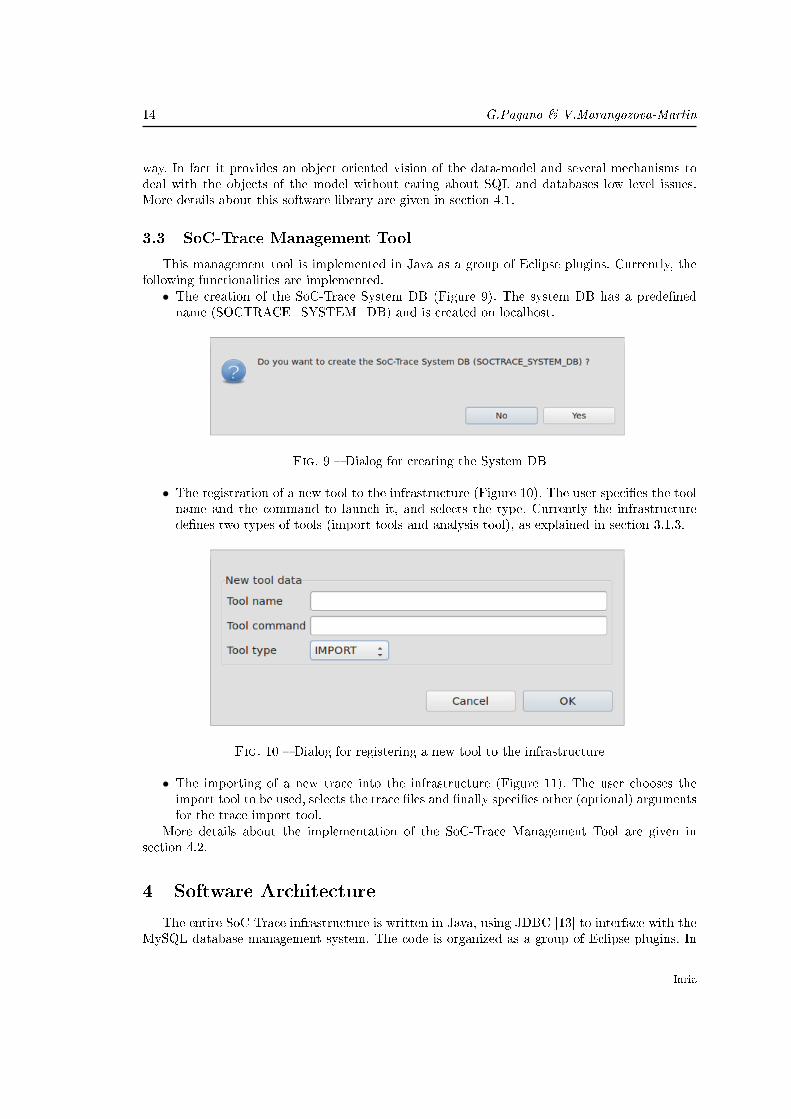
This management tool is implemented in Java as a group of Eclipse plugins. Currently, thefollowing functionalities are implemented.
• The creation of the SoC-Trace System DB (Figure 9). The system DB has a prede�nedname (SOCTRACE_SYSTEM_DB) and is created on localhost.
Fig. 9 � Dialog for creating the System DB
• The registration of a new tool to the infrastructure (Figure 10). The user speci�es the toolname and the command to launch it, and selects the type. Currently the infrastructurede�nes two types of tools (import tools and analysis tool), as explained in section 3.1.3.
Fig. 10 � Dialog for registering a new tool to the infrastructure
• The importing of a new trace into the infrastructure (Figure 11). The user chooses theimport tool to be used, selects the trace �les and �nally speci�es other (optional) argumentsfor the trace import tool.
More details about the implementation of the SoC-Trace Management Tool are given insection 4.2.
4 Software Architecture
The entire SoC-Trace infrastructure is written in Java, using JDBC [13] to interface with theMySQL database management system. The code is organized as a group of Eclipse plugins. In
Inria

SoC-Trace Infrastructure 15
Fig. 11 � Dialog for importing a new trace into the infrastructure
the following sections the various plugins are described. We can separate the plugins formingthe actual Java interface to the DB (SoC-Trace Library) from the ones forming the SoC-TraceManagement Tool.
4.1 Java interface to the DB
This software library is composed by the following di�erent plugins :• com.inria.soctrace.lib.model
• com.inria.soctrace.lib.storage
• com.inria.soctrace.lib.query
• com.inria.soctrace.lib.search
• com.inria.soctrace.lib.utils
4.1.1 Model
The data-model is implemented in the plugin com.inria.soctrace.lib.model, which pro-vides an object oriented representation of the DB schema. For all the tables of the DB (excludingsome of the tables related to the concrete realization of speci�c analysis result, as explained be-low) there is a Java class that directly maps to it. These classes are implemented according tothe following principles :
• The class stores all the attributes of the corresponding table, with the exception of theforeign key IDs (the IDs allowing the join with other tables) : in this case a reference tothe corresponding foreign object is stored.
• Considering the SDP tables, an Element class always stores its ElementParam references,and an ElementType class always stores its ElementParamType references. See for exampleFigure 12, which shows the high level UML diagram related to the Event SDP objectoriented implementation.
The plugin de�nes four Java interfaces :• IModelElementThis interface is implemented by all the classes strictly modeling entities of the model.◦ The four SDP classes for the trace entity (Trace, TraceType, TraceParam, TraceParam-Type)
◦ The four SDP classes for the event entity (Event, EventType, EventParam, EventPa-ramType)
◦ The classes for tool, �le and event producer entities (Tool, File, EventProducer)
RT n° 427

16 G.Pagano & V.Marangozova-Martin
EventParam
EventType
EventParamType
Event
[*] [*]
Fig. 12 � Event SDP UML diagram
◦ The class for the analysis result entity (AnalysisResult)All these classes have an ID getter and can accept an IModelVisitor (see below).
• ISearchableThis interface is implemented by all the classes that model entities that can be the target ofa searching/�ltering analysis. Currently Event and EventProducer classes implement thisinterface.
• IGroupableThis interface is implemented by all the classes that model entities that can be the targetof a grouping analysis. Among the classes already mentioned, currently Event, EventTypeand EventParamType classes implement this interface. This interface is implemented alsoby the class Group, which models a group of IGroupable objects (Composite pattern [14]).Actually the Group class is abstract and has two concrete implementations : OrderedGroupand UnorderedGroup.
• IModelVisitorThis is the interface for all the visitors (see Visitor pattern [14]) for the classes implementingIModelElement interface. Currently, the Visitor pattern is used to save the di�erent objectsof the data-model into the DB (see section 4.1.2).
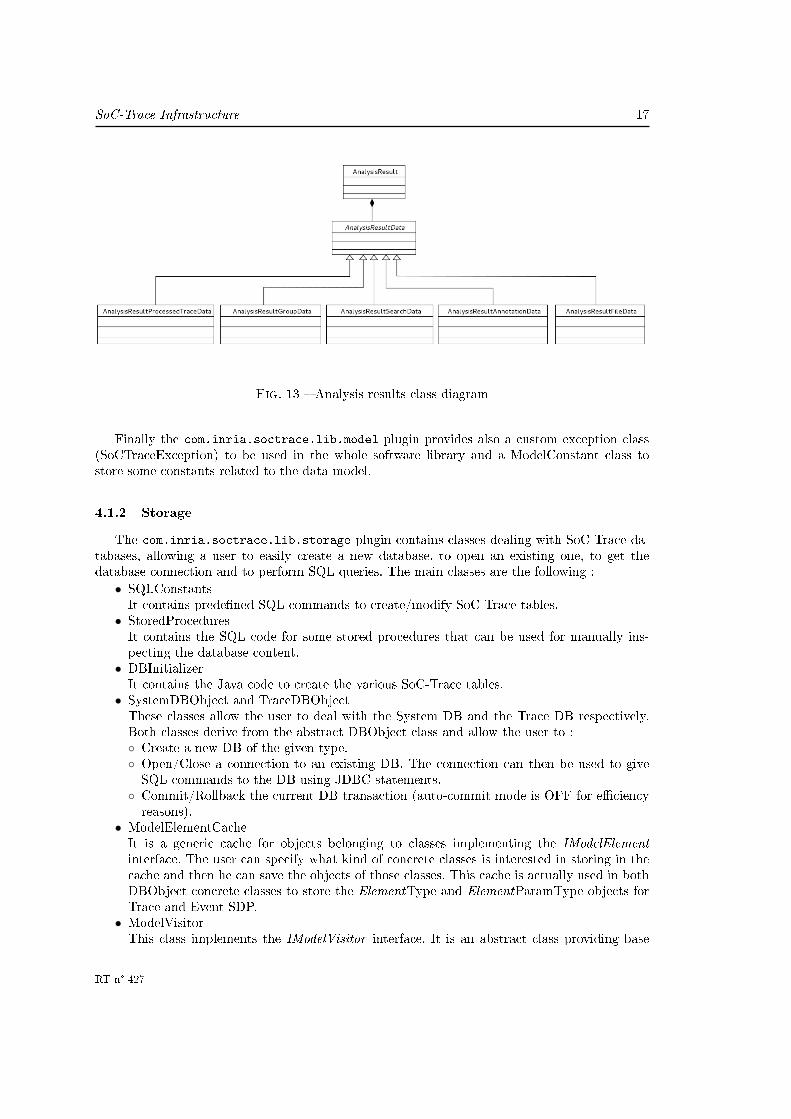
The analysis result part of the data-model deserves more explanations. Figure 13 shows ahigh level UML diagram of this part.
As we said, the AnalysisResult class implements the IModelElement interface. This classcontains a reference to an AnalysisResultData, which is an abstract class whose concrete imple-mentations store the necessary information for the di�erent types of analysis result. Currentlywe have the following concrete classes :
• AnalysisResultProcessedTraceDataIt contains the references to the source Trace and the processed Trace objects.
• AnalysisResultGroupDataIt contains the reference to the root node of the grouping.
• AnalysisResultSearchDataIt contains a list of ISearchable objects.
• AnalysisResultAnnotationDataIt contains a list of Annotation objects and the corresponding AnnotationType objects.
• AnalysisResultFileDataIt contains a list of ResultFile objects.
Inria
SoC-Trace Infrastructure 17
Fig. 13 � Analysis results class diagram
Finally the com.inria.soctrace.lib.model plugin provides also a custom exception class(SoCTraceException) to be used in the whole software library and a ModelConstant class tostore some constants related to the data-model.
4.1.2 Storage
The com.inria.soctrace.lib.storage plugin contains classes dealing with SoC-Trace da-tabases, allowing a user to easily create a new database, to open an existing one, to get thedatabase connection and to perform SQL queries. The main classes are the following :
• SQLConstantsIt contains prede�ned SQL commands to create/modify SoC-Trace tables.
• StoredProceduresIt contains the SQL code for some stored procedures that can be used for manually ins-pecting the database content.
• DBInitializerIt contains the Java code to create the various SoC-Trace tables.
• SystemDBObject and TraceDBObjectThese classes allow the user to deal with the System DB and the Trace DB respectively.Both classes derive from the abstract DBObject class and allow the user to :◦ Create a new DB of the given type.◦ Open/Close a connection to an existing DB. The connection can then be used to giveSQL commands to the DB using JDBC statements.
◦ Commit/Rollback the current DB transaction (auto-commit mode is OFF for e�ciencyreasons).
• ModelElementCacheIt is a generic cache for objects belonging to classes implementing the IModelElementinterface. The user can specify what kind of concrete classes is interested in storing in thecache and then he can save the objects of those classes. This cache is actually used in bothDBObject concrete classes to store the ElementType and ElementParamType objects forTrace and Event SDP.
• ModelVisitorThis class implements the IModelVisitor interface. It is an abstract class providing base
RT n° 427

18 G.Pagano & V.Marangozova-Martin
functionalities common to all the visitors that work on the DB, dealing with model objects.For the moment being, only the ModelSaveVisitor class has been implemented, in order tosave the model objects into the DB. Each of the DBObject concrete class o�ers a save()method, that accepts an object implementing the IModelElement interface and calls theaccept() method on such object passing an instance of the ModelSaveVisitor. This way,the interface to save a model object into the DB is very easy for the library-user. Forexample, to save a list of Event objects into the DB, you have to write only the code shownin Figure 14, where events is a list of Event objects and traceDB is the reference to aTraceDBObject.
Fig. 14 � Saving Event objects into the DB
As we can see, all the complexity related to saving into a DB objects of di�erent types(Event and EventParam in the example), is hidden behind the DBObject, which containsthe save visitor. The visitor class contains a JDBC prepared statement for each supportedobject of the model. Like this, each call to the save() actually adds the object to theprepared statement batch, while the actual save operation into the DB is done in a bu�eredway, executing the prepared statement batch at the end.
4.1.3 Query
The com.inria.soctrace.lib.query plugin contains classes used to perform generic querieson the objects of the model. The plugin provides both query-classes and condition-classes. Thebasic idea is that to perform a query on an element of the model, you instantiate the speci�cquery-class for that element and add to such query-object the required conditions to be ful�lled.Both query and condition classes are described in the following.
Condition-classes
To understand how query-classes work, �rst we describe the conditions that can be attachedto them. We can have two kinds of condition-classes :
• The condition-classes implementing the ICondition interface, used to specify conditions forsimple attributes of a generic table.
• The condition-classes implementing the IParamCondition interface, used to specify condi-tions on Element-SDP parameters. We remind that, here and in the following, by Elementwe identify a generic concept modeled as SDP.
Both kinds of condition-classes are built using the same design pattern (Composite [14]), asshown in Figure 15(a) and Figure 15(b).
In both cases (ICondition and IParamCondition classes), Simple conditions are used to modelexpressions having the following format :
<name> <comparison_operator> <value>
It is possible to arbitrarily combine simple conditions using Logical conditions (AND/OR).
Inria

SoC-Trace Infrastructure 19
«Interface»ICondition
+ getSQLString()
SimpleCondition
+ getSQLString()
LogicalCondition
+ getSQLString() + addCondition()
[2..*]
(a) ICondition classes
«Interface»IParamCondition
+ getSQLString()
+ getSQLString() + getSQLString()
SimpleParamCondition LogicalParamCondition
+ addCondition()
[2..*]
(b) IParamCondition classes
Fig. 15 � Condition-classes UML diagrams
<condition> <logical_operator> <condition>
For the classes implementing ICondition interface, <name> refers to the name of an attri-bute of a speci�c table and <value> refers to the value of this attribute. An example of SQLcondition produced using ICondition and referring to the EVENT table could be the following :
( ( TIMESTAMP > 1000 ) AND ( CPU = 0 ) )
For the classes implementing IParamCondition, <name> refers to the value of the attribute'NAME' in the ELEMENT_PARAM_TYPE table and <value> refers to the value of theattribute 'VALUE' in the ELEMENT_PARAM table. So, in this case the actual SQL conditionis more complicated, since it requires information from the two tables above mentioned, plus theELEMENT_TYPE table. However this complexity is hidden by the IParamCondition class, sothe �nal SQL condition can be safely put in the WHERE clause of a query performed on theELEMENT table.
RT n° 427

20 G.Pagano & V.Marangozova-Martin
Query-classes
A query-class is a class that can be used to perform queries on database tables, possibly usingthe condition-classes described above. The com.inria.soctrace.lib.query plugin de�nes threemain abstract classes for query-classes :
• ElementQueryThis class provides the basic functionalities to perform generic queries on simple (non-SDP)DB tables. For this kind of queries, only ICondition classes are used. The concrete classesimplementing this abstract class are :◦ AnalysisResultQuery◦ EventParamTypeQuery◦ EventProducerQuery◦ EventTypeQuery◦ FileQuery◦ ToolQueryNote that the AnalysisResultQuery does not retrieve from the DB the analysis result data(AnalysisResultData abstract class). For this purpose, you should use the AnalysisResult-DataQuery (see below) class explicitly. This is done for e�ciency reasons : �rst you performthe query to get the AnalysisResult objects respecting some conditions, then you load theAnalysisResultData only into those objects that actually are of interest for you. A commonuse case is in fact to browse into analysis results, just to see the type or the date of theanalysis itself, without being interested in loading the analysis result data (potentially ahuge amount of data).
• SelfDe�ningElementQueryThis class extends the ElementQuery class, adding the support for IParamCondition. Theclass is in fact designed to be the base class of query-classes for SDP elements. The concreteclasses implementing this abstract class are :◦ EventQuery◦ TraceQuery
• AnalysisResultDataQueryThis class is designed to be the base of all the classes that are used to retrieve an analysisresult from the DB, specifying the analysis result ID. This class does not support ICondi-tion or IParamCondition, since the only purpose is to retrieve from the DB the analysisresult data produced in a given analysis. Once the data is retrieved, it can be set in thecorresponding AnalysisResult object. The concrete classes implementing this abstract classare :◦ AnalysisResultProcessedTraceDataQuery◦ AnalysisResultGroupDataQuery◦ AnalysisResultSearchDataQuery◦ AnalysisResultAnnotationDataQuery◦ AnalysisResultFileDataQuery
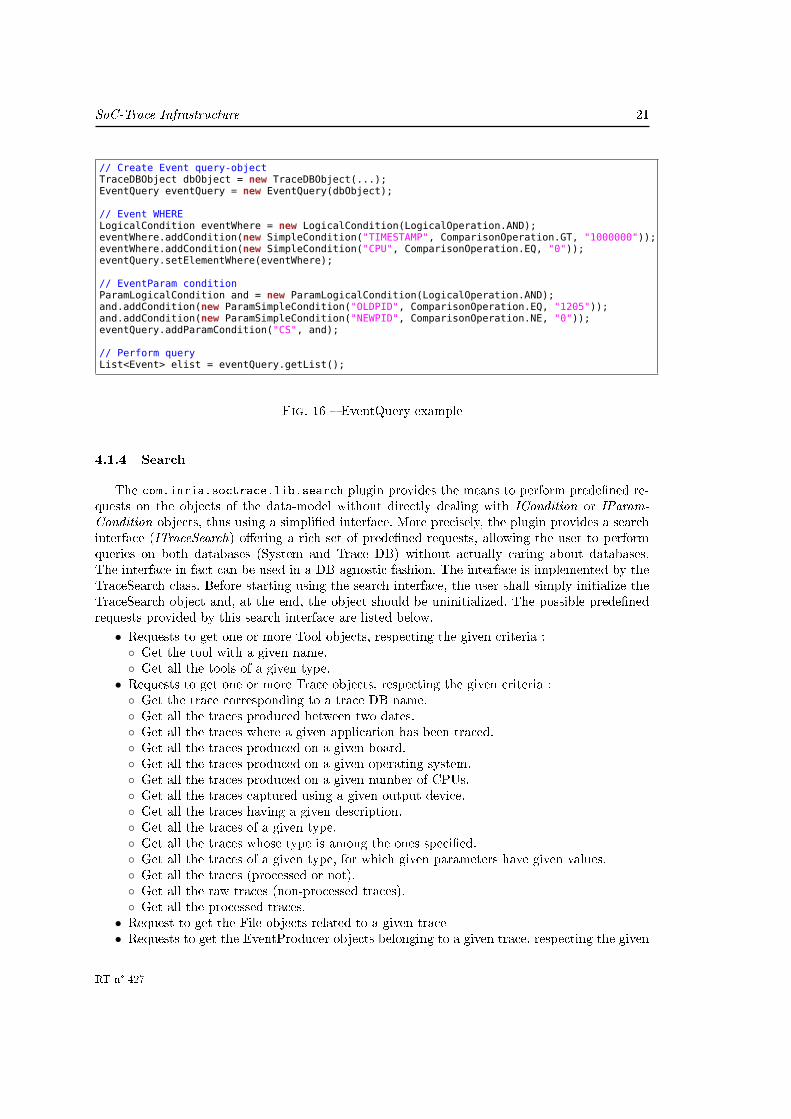
Example Figure 16 shows an example of usage of the EventQuery class. In this examplewe want to �nd all the context switch events (CS) produced after the timestamp 1000000 onCPU 0, where the old PID is 1205 and the new PID di�ers from 0.
As the example shows, this query interface is quite powerful and generic, but has the drawbackof being not so straightforward to use. Query-classes and condition-classes are therefore used tobuild a simpli�ed higher-level query interface, described in section 4.1.4.
Inria
SoC-Trace Infrastructure 21
Fig. 16 � EventQuery example
4.1.4 Search
The com.inria.soctrace.lib.search plugin provides the means to perform prede�ned re-quests on the objects of the data-model without directly dealing with ICondition or IParam-Condition objects, thus using a simpli�ed interface. More precisely, the plugin provides a searchinterface (ITraceSearch) o�ering a rich set of prede�ned requests, allowing the user to performqueries on both databases (System and Trace DB) without actually caring about databases.The interface in fact can be used in a DB-agnostic fashion. The interface is implemented by theTraceSearch class. Before starting using the search interface, the user shall simply initialize theTraceSearch object and, at the end, the object should be uninitialized. The possible prede�nedrequests provided by this search interface are listed below.
• Requests to get one or more Tool objects, respecting the given criteria :◦ Get the tool with a given name.◦ Get all the tools of a given type.
• Requests to get one or more Trace objects, respecting the given criteria :◦ Get the trace corresponding to a trace DB name.◦ Get all the traces produced between two dates.◦ Get all the traces where a given application has been traced.◦ Get all the traces produced on a given board.◦ Get all the traces produced on a given operating system.◦ Get all the traces produced on a given number of CPUs.◦ Get all the traces captured using a given output device.◦ Get all the traces having a given description.◦ Get all the traces of a given type.◦ Get all the traces whose type is among the ones speci�ed.◦ Get all the traces of a given type, for which given parameters have given values.◦ Get all the traces (processed or not).◦ Get all the raw traces (non-processed traces).◦ Get all the processed traces.
• Request to get the File objects related to a given trace• Requests to get the EventProducer objects belonging to a given trace, respecting the given
RT n° 427

22 G.Pagano & V.Marangozova-Martin
criteria :◦ Get the event producer, given the type and a local identi�er.◦ Get the all the event producers of a given type.
• Requests to get the Event objects belonging to a given trace, respecting the given criteria :◦ Get all the events of a given CPU.◦ Get all the events of a given type.◦ Get all the events whose type is among the ones speci�ed.◦ Get all the events with a given producer.◦ Get all the events whose producer is among the passed ones.◦ Get all the events whose timestamp is included in the speci�ed interval.◦ Get all the events whose timestamp is included in one of the speci�ed intervals.◦ Get all the events of a given type, for which given parameters have given values.◦ Get all the events of a given type, for which given parameters have given values andwhose timestamp belongs (at least) to one of the intervals speci�ed.
◦ Get all the events whose type is among the ones speci�ed, whose timestamp belongs (atleast) to one of the intervals speci�ed and whose producer is among the one speci�ed.
• Requests to get the AnalysisResult objects related to a given trace :◦ Get all the analysis results produced by a tool.◦ Get all the analysis results produced by a tool and of a given type.
• Request to get the AnalysisResultData object related to a given analysis result.
Example Figure 17 shows an example of usage of the ITraceSearch interface. In thisexample �rst we get the Trace object corresponding to a given DB name. Then we search for allthe context switch events of this trace, where the old PID is 1203 and the new PID is 1205.
Fig. 17 � Search interface usage example
The com.inria.soctrace.lib.search plugin o�ers also an utility class (Printer) providingmethods to print collections of data-model objects, as returned by the search interface methods.The Printer class o�ers also a method (selectResult()) to interactively browse the analysisresults saved in the database, in order to visualize them in a simple, textual form. The analysisresult browsing is performed according to the following steps :
• First select the trace where the analysis has been performed (e.g. trace imported on datex ).
• Then select the tool performing the analysis (e.g. analysis tool y).• Then select the type of result produced by that tool (e.g. searching, grouping, etc.).• Finally select the result instance of that type (e.g. grouping performed on date z ).
Inria

SoC-Trace Infrastructure 23
4.1.5 Utilities
The com.inria.soctrace.lib.utils plugin provides some utility classes, useful for deve-loping client applications interacting with the SoC-Trace Library. The classes currently presentare the following :
• IdManager : this class can be used to manage sequential IDs for model entities. In factthe burden of setting the ID values to the elements of the model (for the storage with therelational database representation) is currently up to the library-user : at the applicationlevel is in fact convenient to be aware of the IDs in order to manage objects e�ciently (e.g.using maps of objects).
• Con�guration : this is a Singleton [14] that wraps the SoC-Trace infrastructure con�gura-tion �le (.soctrace.conf, located in the user directory). The class provides an enumerate(SoCTraceProperty) which contains the di�erent properties de�ned in the con�guration �leand a getter method that allows the user to access such properties.
• Portability : this class provides some basic functionalities to ensure the portability of theinfrastructure on both Unix and Windows systems.
• DeltaManager : simple class that can be used to measure time intervals, for example tomonitor execution times.
• HeapMonitor : utility class providing facilities to measure the size of the used heap in aJava application.
• History : utility class that can be used to log runtime events in a thread-safe way, usefulto debug multithreaded Java code without perturbating too much the execution.
4.2 Management Tool
The SoC-Trace Management Tool is implemented by two di�erent plugins :• com.inria.soctrace.management.core
• com.inria.soctrace.management.ui
The tool implementation is split over this pair of plugins in order to decouple what is relatedto visualization (UI) from what is related to functionality. Currently both plugins are very simplebecause of the prototype-nature of the tool itself.
4.2.1 Core
The core plugin (com.inria.soctrace.management.core) provides basic functionalities tothe UI plugin. It encapsulates the SoC-Trace Library functionalities needed to provide servicesto the end user. For the moment being the main classes provided are :
• SoCTraceManagementConstants : it stores system level constants.• SoCTraceManager : it provides the implementation of the operations accessible from theUI.
• ToolExecutionManager : it provides a simple interface to launch an external command asan Eclipse Job.
4.2.2 Ui
The UI plugin (com.inria.soctrace.management.ui) provides the graphical elements thatform the SoC-Trace infrastructure user interface. For the moment being it contains classes for :
• UI constants• The JFace [15] actions and dialogs for the operations described in section 3.3.
RT n° 427

24 G.Pagano & V.Marangozova-Martin
5 External Tools
In order to test and use the infrastructure with real use cases, we developed some externaltools. First of all, to import real-life traces into the infrastructure, we wrote a parser for theKPTrace format (see section 5.1). Then, to test the di�erent functionalities of the infrastructure,we developed also a simple test tool, described in section 5.2.
5.1 KPTrace Importer
This parser is simpler than the one provided by STMicroelectronics [16], since it containsvery little semantics and is written using several simpli�cations. Typically, only a subset of eventtypes is supported and no link is created between sibling events. Nevertheless the tool is usefulsince it allows the storage of traces with a real-life format into the SoC-Trace infrastructure andshows a possible usage of the SoC-Trace Library in order to write a Java importer.
5.1.1 Parser architecture
The KPTrace Importer is written as a normal Java program, using the SoC-Trace Library.This tool (KpParserTool) can be exported as an executable jar in order to be registered to theinfrastructure tool registry. In the following the main classes of the tool are described.
• KpParserArgs : class containing the command line parameters necessary to the parser.• KpRecord : simple class to store the raw information contained in a single raw-trace line.• KpConstants : KPTrace parser constants (e.g. event producer types).• KpParser : it is the actual parser class, which performs the parsing of all trace �les in orderto put them in the DB format. It uses the following utility classes to perform its job :◦ KpEventFormatManager : manages EventType and EventParamType objects for thespeci�c KPTrace format. This class, starting from an intermediate description of theformat, stored in the KpEventFormatDescription singleton, builds a map where eachevent type mnemonic is linked to the corresponding EventType object. The intermediatedescription stored in the KpEventFormatDescription singleton is a list of strings withthe following format :
<event_type_mnemonic> : <par0> <type0>, <par1> <type1>, [...]
For example, for the context switch event it could be :CS : OLDPID INTEGER, NEWPID INTEGER
The use of such generic intermediate format makes the importer code easily reusable forother trace formats.
◦ KpEventProducerManager : manages EventProducer objects, for KPTrace speci�c eventproducer entities.
◦ KpTraceInfoManager : manages the Trace element SDP, providing the prede�ned Tra-ceType with the prede�ned trace parameter types. It provides also parsing functionalityto �ll the corresponding Trace and TraceParam objects.
• KpParserLauncher : open the System DB, creates the new Trace DB and launches theKpParser. At the end of parsing operations, commits all the changes to the databases.
• KpParserTool : it is the class containing the main method of the parser. This methodsimply handles command line arguments, checking them and then traslating them into aninstance of the KpParserArgs class, which is then passed to the KpParserLauncher.
Inria

SoC-Trace Infrastructure 25
5.2 Test Tool
In order to test and debug the SoC-Trace infrastructure, we developed a Test Tool, whichprovides several batteries of tests for the di�erent functionalities. Basically the tool providesseveral classes, each providing di�erent methods to test a speci�c part of the infrastructure. Themain class of the tool allows the user to set up a working environment (creation of the SystemDB and import of sample traces) and to enable or disable the di�erent tests on such environment.Currently we developed test classes for the following macro-areas of the infrastructure :
• low level queries using the com.inria.soctrace.lib.query plugin• high level search requests using the com.inria.soctrace.lib.search plugin• analysis results saving• simple trace processingIn addiction to the possibility to produce and save sample analysis results, the Test Tool
allows the user to interactively browse through the analysis results saved into the database,using the result browsing method provided by the Printer class (see 4.1.4). We �nally observethat the source code contained in the Test Tool, besides o�ering testing functionalities, providesalso a rich set of code snippets, useful for application developers aiming to add a tool to theSoC-Trace infrastructure.
RT n° 427
26 G.Pagano & V.Marangozova-Martin
6 Performance Evaluation
In this section we present the �rst performance evaluation results we obtained on the SoC-Trace infrastructure prototype implementation. To get these results we used both the KPTraceImporter (section 5.1) and some simple ad-hoc programs, written to test speci�c features of theSoC-Trace Library (section 4.1). The machine used to perform our performance evaluation testshas the following characteristics :
• RAM : 4 GB @ 1066 MHz• CPU : dual-core @ 2.40 GHz• OS : Fedora 16, 64 bit
The MySQL database is used with the InnoDB engine, with auto-commit disabled and allthe other con�guration parameters left with their default values. The version of Eclipse used isthe 4.2.0 (Juno).
6.1 Trace DB size
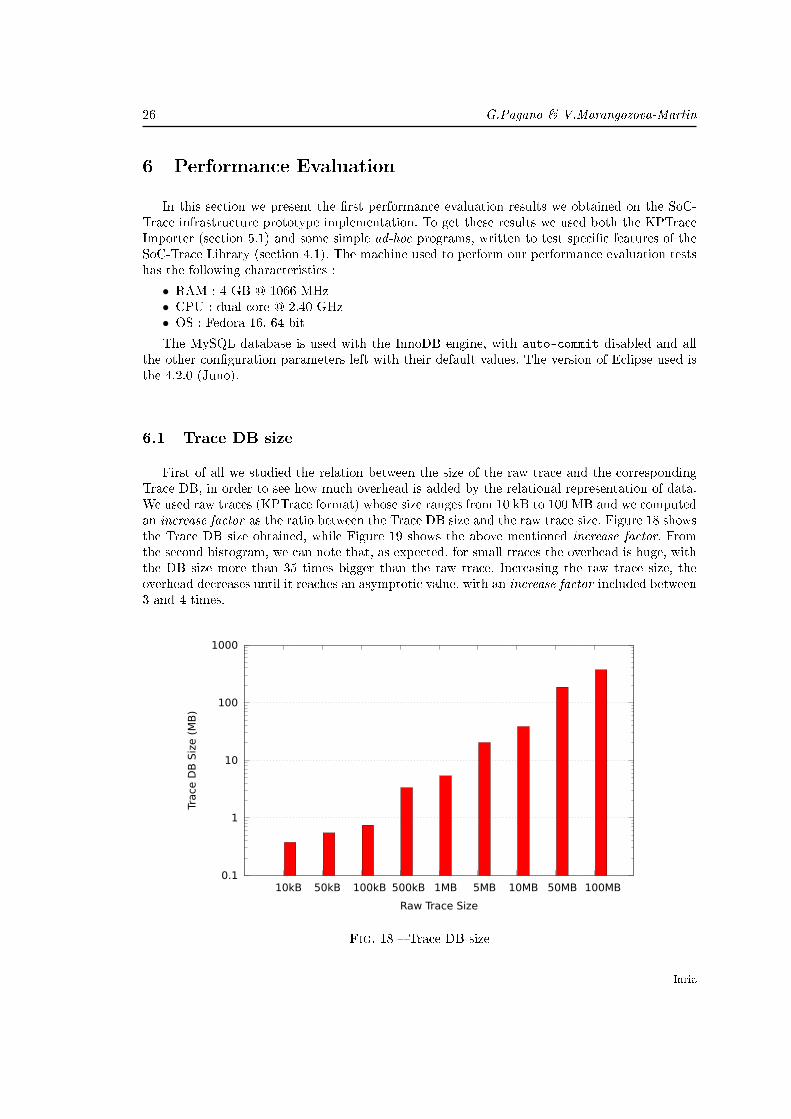
First of all we studied the relation between the size of the raw trace and the correspondingTrace DB, in order to see how much overhead is added by the relational representation of data.We used raw traces (KPTrace format) whose size ranges from 10 kB to 100 MB and we computedan increase factor as the ratio between the Trace DB size and the raw trace size. Figure 18 showsthe Trace DB size obtained, while Figure 19 shows the above mentioned increase factor. Fromthe second histogram, we can note that, as expected, for small traces the overhead is huge, withthe DB size more than 35 times bigger than the raw trace. Increasing the raw trace size, theoverhead decreases until it reaches an asymptotic value, with an increase factor included between3 and 4 times.
0.1
1
10
100
1000
10kB 50kB 100kB 500kB 1MB 5MB 10MB 50MB 100MB
Trace
DB
Siz
e (
MB
)
Raw Trace Size
Fig. 18 � Trace DB size
Inria

SoC-Trace Infrastructure 27
0
5
10
15
20
25
30
35
40
10kB 50kB 100kB 500kB 1MB 5MB 10MB 50MB 100MB
Incr
ease
Fact
or
Raw Trace Size
Fig. 19 � Database overhead
6.2 Trace import time
We measured the time needed to import the events of a raw trace into the infrastructureusing our KPTrace Importer (section 5.1). The size of the raw traces used ranges from 10 kB to50 MB. For each di�erent con�guration we performed 10 runs in order to have reliable values.The results are shown in Figure 20.
0
50
100
150
200
250
300
350
400
0 10 20 30 40 50
Tim
e (
s)
Raw Trace Size (MB)
Fig. 20 � Time needed to import KPTrace traces into the infrastructure
We note that the time needed for the import operation increases linearly with the raw trace
RT n° 427
28 G.Pagano & V.Marangozova-Martin
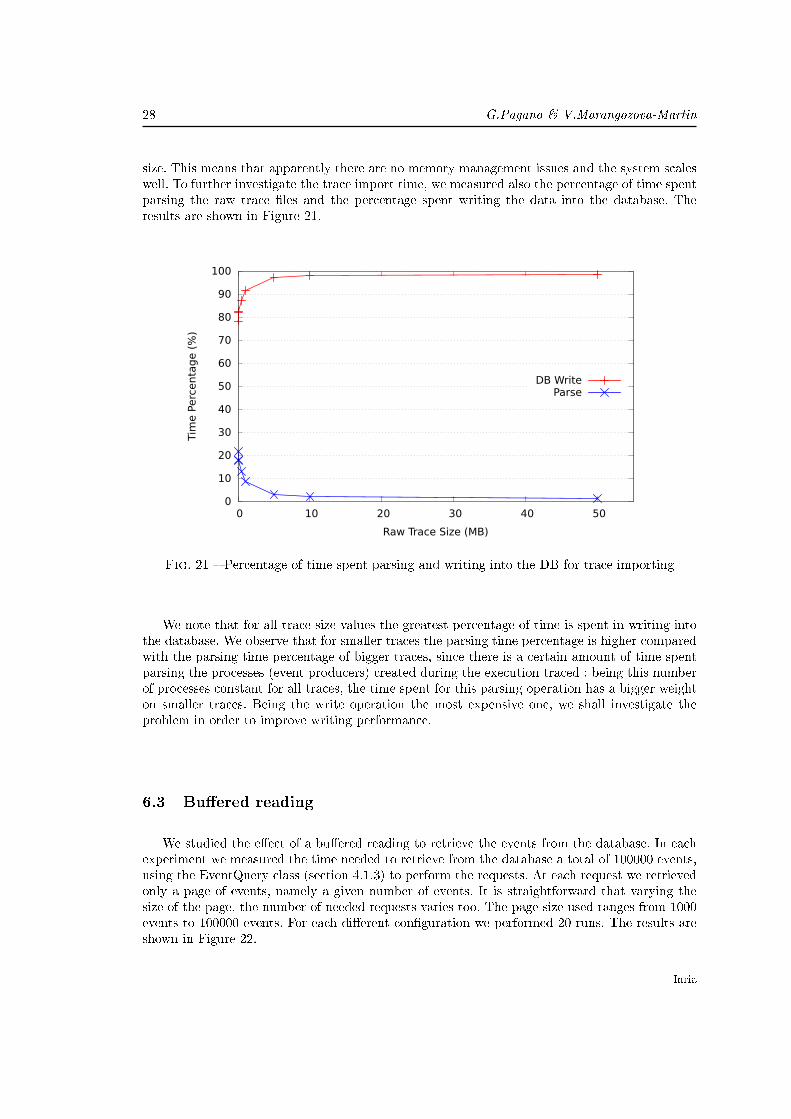
size. This means that apparently there are no memory management issues and the system scaleswell. To further investigate the trace import time, we measured also the percentage of time spentparsing the raw trace �les and the percentage spent writing the data into the database. Theresults are shown in Figure 21.
0
10
20
30
40
50
60
70
80
90
100
0 10 20 30 40 50
Tim
e P
erc
enta
ge (
%)
Raw Trace Size (MB)
DB WriteParse
Fig. 21 � Percentage of time spent parsing and writing into the DB for trace importing
We note that for all trace size values the greatest percentage of time is spent in writing intothe database. We observe that for smaller traces the parsing time percentage is higher comparedwith the parsing time percentage of bigger traces, since there is a certain amount of time spentparsing the processes (event producers) created during the execution traced : being this numberof processes constant for all traces, the time spent for this parsing operation has a bigger weighton smaller traces. Being the write operation the most expensive one, we shall investigate theproblem in order to improve writing performance.
6.3 Bu�ered reading
We studied the e�ect of a bu�ered reading to retrieve the events from the database. In eachexperiment we measured the time needed to retrieve from the database a total of 100000 events,using the EventQuery class (section 4.1.3) to perform the requests. At each request we retrievedonly a page of events, namely a given number of events. It is straightforward that varying thesize of the page, the number of needed requests varies too. The page size used ranges from 1000events to 100000 events. For each di�erent con�guration we performed 20 runs. The results areshown in Figure 22.
Inria

SoC-Trace Infrastructure 29
2000
4000
6000
8000
10000
12000
14000
16000
18000
20000
0 20000 40000 60000 80000 100000
Tim
e (
ms)
Buffer Size (number of events)
Fig. 22 � Time needed to read a given number of events using di�erent bu�er size
It is clear from the curve that performing a bigger number of requests a�ects negativelytime performance. With a page size of 1000 events (100 requests) the time spent to read all theevents is about 19 seconds, then increasing the page size (reducing the number of requests) thetime decreases up to 2.4 seconds, which is the time obtained with a page size of 20000 events.Continuing to increase the page size the time needed to retrieve the events does not changesigni�cantly.
6.4 Complex parameters queries
Finally we performed complex queries using the ITraceSearch interface (section 4.1.4), inorder to see how increasing the number of SDP-parameter-conditions involved in the queriesa�ects requests duration. For this purpose, we used a trace containing 100000 events, performingqueries concerning the Event-SDP tables, with a variable number of SDP-parameter-conditions(parameter = value) linked by the AND logical operator. The number of events of the result isalways the same for each con�guration (for each number of di�erent parameter-conditions). Thenumber of parameter-conditions used ranges from 1 to 50. For each con�guration we performed20 runs. The results are shown in Figure 23.
RT n° 427

30 G.Pagano & V.Marangozova-Martin
0
1000
2000
3000
4000
5000
6000
7000
0 10 20 30 40 50
Tim
e (
ms)
Number of Parameter-Condition
Fig. 23 � Time needed to perform a request varying the number of SDP-parameter-conditions
We note that the amount of time needed to perform the requests increases linearly with thenumber of parameter-conditions, meaning that there is no visible issue in memory managementand the system scales well. It will be interesting to try to optimize the system in order to decreasethe slope of the curve, for example using custom DB indexes on the SDP tables.
7 Future Works
The SoC-Trace infrastructure described in this document is a �rst prototype which will evolvein the near future. In this section some of the main works that we are planning are described.
7.1 Database architecture
As described in section 3.1.2, currently the database has a distributed architecture, with asingle System DB and several Trace DBs. This has been done basically for scalability reasons.However, from a logical point of view, all Trace DBs have the same schema. Furthermore, eachnew trace added to the infrastructure needs the creation of a new database. These observationsmade us think about a centralized solution, with a single database that stores all the information,without su�ering from the single-DB issues discussed in 3.1.2. Instead of replicating all thedatabase tables for each trace, we can simply replicate only the tables that contain speci�c-traceraw information : EVENT, EVENT_PARAM and EVENT_PRODUCER tables. Obviously, foreach trace, these tables shall have a di�erent name : for example there can be a su�x with thetrace ID in the name of the table (e.g. EVENT_1). Like this, when a new trace is importedinto the infrastructure, only these three tables shall be created and not a whole database. Thissolution has the additional advantage that it is no longer necessary to rewrite the trace formatdescription (EVENT_TYPE and EVENT_PARAM_TYPE table information) for each traceof a given type : it is enough to write the format once, then all the trace of that format canrefer the same event type and event parameter types. For these reasons we started implementing
Inria

SoC-Trace Infrastructure 31
a centralized version of the database architecture, in order to better compare the pros and thecons of the two di�erent solutions to �nally choose the best one.
7.2 Analysis result
The current data-model is designed to support single-trace analysis results, however futureanalysis tools will be able to perform complex, multi-trace, analyses. For this reason, a crucialenhancement for the infrastructure will be the support for multi-trace analysis results. Thisenhancement can be done either keeping the distributed DB architecture or using the centralizedDB architecture described in 7.1. In the former case, we can extend the System DB schema inorder to save multi-trace analysis result. In the latter case, we simply need to add a new table,mapping the analysis results with the traces involved in the analysis. Furthermore, we are alreadythinking about adding new prede�ned types of analysis result, like for example Graph Results,which could be useful to represent Bayesian networks.
7.3 Tool management
A possible point of improvement for the infrastructure is to enhance the tool managementfeatures. First of all, the SoC-Trace Management Tool should be enhanced in order to providesupport for work�ow de�nition. It should be possible for a user to de�ne a trace-management-work�ow in order to accomplish a speci�c goal. For example a possible work�ow could be thefollowing : import a raw trace using this importer, perform a pattern mining analysis with thisanalysis tool and �nally visualize the saved results with this visualization tool.
Then it will be interesting to explore the possibility to add speci�c support for tools written asplain Eclipse plugins and not necessarily as external applications. This will bring the advantageof making the tool integration easier and will let the tools use to the greatest extent Eclipsefunctionalities. As we said, now only generic external tools are managed, storing them into theTOOL table, which acts as a tool registry. Eclipse has actually a built-in registry mechanism forplugin management, that automatically recognizes and loads (if necessary) the requested plugins.In order to have an integration between the two kinds of tools, we should be able to keep theadvantages of Eclipse plugins automatic discovering and loading, while preserving the possibilityto manage non-Eclipse tools.
7.4 Other improvements
We are planning to do some implementation enhancements in order to make the SoC-Trace Library richer and easier to test. First of all we plan to add new Visitor classes to thecom.inria.soctrace.lib.storage plugin, in order to support other common DB operations,like the update or the delete of an existing data-model entity. Then we want to improve the testtool, making it easier to add new tests and possibly adding an installation-checking utility, ableto check if the SoC-Trace infrastructure has been correctly installed.
8 Conclusions
In this document we described the �rst prototype of the SoC-Trace infrastructure. After cla-rifying the objectives of the project and the infrastructure, we described both the system andthe software architecture of the prototype, showing how the solutions are a solid starting pointfor the ful�llment of the desired goals. We also described some external tools we developed inorder to start using the prototype with concrete use cases. We provided some �rst performance
RT n° 427

32 G.Pagano & V.Marangozova-Martin
evaluation results, useful to have a critical view on the technical choices done so far. Finally wediscussed some of the future works we are planning to do in order to get an enhanced version ofthe infrastructure. The possibility to easily use the infrastructure with real-life traces, concreteanalysis and result saving, showed that the proposed data-model, though being open to improve-ments, is actually generic enough to deal with arbitrary formats and non-trivial analyses. On theother side, performance evaluation results showed that there is room for enhancements in orderto make the infrastructure more e�cient. Our future e�orts will be therefore on the improvementof both functionalities and performance.
Inria
SoC-Trace Infrastructure 33
References
[1] FUI (Fonds Unique Interministériel). http://competitivite.gouv.fr.
[2] Carlos Prada-Rojas, Miguel Santana, Serge De-Paoli, and Xavier Raynaud. SummarizingEmbedded Execution Traces through a Compact View. In Conference on System Software,SoC and Silicon Debug � S4D 2010, Southampton, UK, September 2010.
[3] Damien Hedde and Frédéric Pétrot. A non intrusive simulation-based trace system to analyseMultiprocessor Systems-on-Chip software. In International Symposium on Rapid SystemPrototyping, pages 106�112, 2011.
[4] Miguel Santana. Présentation du Projet SoC-Trace, 2011.
[5] Eclipse. http://www.eclipse.org.
[6] MySQL. http://www.mysql.com.
[7] IP-XACT. IEEE 1685-2009, ISBN 978-0-7381-6160-0.
[8] MySQL Table Partitioning. http://dev.mysql.com/doc/refman/5.6/en/partitioning.html.
[9] KPTrace Trace Format. http://www.stlinux.com/stworkbench/interactive_
analysis/stlinux.trace/kptrace_traceFormat.html.
[10] OS21 Trace Format. http://www.stlinux.com/stworkbench/introduction/STAPISDK_
OS21.html.
[11] Jacques Chassin De Kergommeaux and Benhur De Oliveira Stein. Paje : An ExtensibleEnvironment for Visualizing Multi-Threaded Program Executions. In Proc. Euro-Par 2000,Springer-Verlag, LNCS, pages 133�144, 2000.
[12] Andreas Knüpfer, Ronny Brendel, Holger Brunst, Hartmut Mix, and Wolfgang Nagel. In-troducing the Open Trace Format (OTF). In Vassil Alexandrov, Geert van Albada, PeterSloot, and Jack Dongarra, editors, Computational Science � ICCS 2006, volume 3992 ofLecture Notes in Computer Science, pages 526�533. Springer Berlin / Heidelberg, 2006.
[13] JDBC. http://www.oracle.com/technetwork/java/javase/jdbc/index.html.
[14] Erich Gamma, Richard Helm, Ralph E. Johnson, and John Vlissides. Design Patterns :Elements of Reusable Object-Oriented Software. Addison-Wesley, 1995.
[15] JFace. http://wiki.eclipse.org/index.php/JFace.
[16] STMicroelectronics. http://www.st.com.
RT n° 427

RESEARCH CENTREGRENOBLE – RHÔNE-ALPES
Inovallée655 avenue de l’Europe Montbonnot38334 Saint Ismier Cedex
PublisherInriaDomaine de Voluceau - RocquencourtBP 105 - 78153 Le Chesnay Cedexinria.fr
ISSN 0249-0803