Embed Size (px)
Citation preview

SNP Analysis Report for Eastern European A
DNA Tribes®
2016-06-23
Introduction
DNA Tribes SNP analysis is a proprietary geographical genetic analysis that uses the part ofyour DNA known as autosomal SNPs (Single Nucleotide Polymorphisms) to identify your DeepAncestry (ancient ancestry). You have inherited 50% of your autosomal DNA from your paternaland 50% from your maternal ancestors, including genetic signatures from all four of yourgrandparents and so on. Our Deep Ancestry analysis emphasizes the more ancient genetic links ofyour genome to ethnic groups (populations) around the world, rather than a more limited searchfor family relatives or an assessment of recent nationality or ethnicity.
Your DNA Tribes SNP report includes the results of a number of robust statistical analyses, eachproviding a different perspective on your Deep Ancestry: (1) Admixture Analysis is based on DNATribes proprietary analysis of world genetic structure; (2) Multi-Dimensional Scaling (MDS) is usedto visualize your relative genetic position among continental cores, regional clusters and individualpopulations; and (3) Total Similarity Analysis compares your genotype directly to individual ethnicgroups around the world.
• Admixture analyses are based on DNA Tribes proprietary statistical analysis of world genetic structure andidentify the combinations of eight continental cores, 53 detailed regional clusters and over 400 individualpopulations that best match your SNP profile respectively
• Multi-dimensional scaling (MDS) visualizes your genetic relationship with the continental cores, regionalclusters and individual populations identified by DNA Tribes
• World genetic grid visualizes the areas around the world where your SNP profile fits best
• Total ancestral fit rankings assess how closely your SNP profile matches more than 400 populations in theDNA Tribes reference database when each population is considered independently
DNA Tribes is a private, personal genomics and biotechnology company founded in 2006 inArlington, VA. Our company specializes in genetic ancestry testing, and our products have beenfeatured in articles by the New York Times and Time Magazine.
1

© 2006-2016 DNA Tribes® All rights reserved.DNA Tribes genetic ancestry analysis is available exclusively from DNA Tribes.
Satellite images courtesy NASA Earth Observatory.
Contents
Introduction 1
Admixture Analysis: 8 Continental Cores 3
Multi-Dimensional Scaling (MDS): 8 Continental Cores 4
Admixture Analysis: 53 Regional Clusters 5
Multi-Dimensional Scaling (MDS): 53 Regional Clusters 6
Population Admixture: Native and Jewish Populations 7
Iterative Population Admixture: Native and Jewish Populations 8
Multi-Dimensional Scaling (MDS): Native and Jewish Populations 9
World Genetic Grid 10
Total Ancestral Fit: European Populations 11
Total Ancestral Fit: Caucasus Mountains Populations 14
Total Ancestral Fit: Middle Eastern Populations 15
Total Ancestral Fit: African Populations 17
Total Ancestral Fit: East Asian Populations 19
Total Ancestral Fit: Oceanian and South Malay Archipelago Populations 21
Total Ancestral Fit: North Asian Populations 22
Total Ancestral Fit: South Asian Populations 24
Total Ancestral Fit: Native American Populations 26
Total Ancestral Fit: Diasporic Populations 27
Page 2

© 2006-2016 DNA Tribes® All rights reserved.DNA Tribes genetic ancestry analysis is available exclusively from DNA Tribes.
Satellite images courtesy NASA Earth Observatory.
Admixture Analysis: 8 Continental Cores
This portion of your report summarizes ancestral contributions to your genome from eightcontinental cores identified by DNA Tribes (illustrated in the map below). More specifically, Table 1exhibits the combination of the eight continental cores (expressed in percentages) that most closelymatches your SNP profile. These continental cores reflect the most high-level division of the geneticvariation in the world and will usually result in only one or two continental cores having non-zeromixture percentages for individuals who are of non-mixed heritage. Please keep in mind that yourresults may reflect your family’s recent genealogical ancestry as well as ancient genetic links.
Table 1: Your Continental Core Mixture
Continental Core Mixture
European 100%
Page 3

© 2006-2016 DNA Tribes® All rights reserved.DNA Tribes genetic ancestry analysis is available exclusively from DNA Tribes.
Satellite images courtesy NASA Earth Observatory.
Multi-Dimensional Scaling (MDS): 8 Continental Cores
This MDS plot illustrates your geo-genetic relationship with the eight continental cores identifiedby DNA Tribes. Each point in the plot corresponds to a unique individual in the DNA Tribesreference database1, and the MDS plot is a two-dimensional representation of the genetic distancescomputed using 10,000s or 100,000s of SNPs (depending on the testing company sequencing yourraw SNP data). Your genotype’s position is displayed as a red circle in the MDS plot, and yourgenetic make-up is most similar to the continental cores that are close to your position in the plot.
1Note that DNA Tribes reference database contains 10,000s of individuals and the plot contains a representative sample of these individuals.
Page 4

© 2006-2016 DNA Tribes® All rights reserved.DNA Tribes genetic ancestry analysis is available exclusively from DNA Tribes.
Satellite images courtesy NASA Earth Observatory.
Admixture Analysis: 53 Regional Clusters
This portion of your report summarizes ancestral contributions to your genome from 53 regionalgenetic clusters identified by DNA Tribes and illustrated in the map below. More specifically, Table2 exhibits the combination of the regional clusters (expressed in percentages) that most closelymatches your SNP profile. These regional clusters at times include multiple cultures and languagesand can cross perceived boundaries between modern countries and ethnic groups.
Table 2: Your Regional Cluster Mixture
Regional Cluster Mixture
Balto - North Slavic 72.9%Balkan 9.8%
Northwest European 9.4%Finnish 7.8%Other 0.1%
Page 5

© 2006-2016 DNA Tribes® All rights reserved.DNA Tribes genetic ancestry analysis is available exclusively from DNA Tribes.
Satellite images courtesy NASA Earth Observatory.
Multi-Dimensional Scaling (MDS): 53 Regional Clusters
This MDS plot illustrates your geo-genetic relationship with the 53 regional clusters identified byDNA Tribes. Each point in the plot corresponds to a unique individual in the DNA Tribes referencedatabase2, and the MDS plot is a two-dimensional representation of the genetic distancescomputed using 10,000s or 100,000s of SNPs (depending on the testing company sequencing yourraw SNP data). Your genotype’s position is displayed as a red circle in the MDS plot, and yourgenetic make-up is most similar to the regional clusters that are close to your position in the plot.
2Note that DNA Tribes reference database contains 10,000s of individuals and the plot is a representative sample of these individuals.
Page 6

© 2006-2016 DNA Tribes® All rights reserved.DNA Tribes genetic ancestry analysis is available exclusively from DNA Tribes.
Satellite images courtesy NASA Earth Observatory.
Population Admixture: Native and Jewish Populations
This portion of your report summarizes the results of admixture analysis for identifying potentialcontributions to your genome from individual native3 and Jewish populations around the world.Table 3 lists the combination of native and Jewish populations (expressed in percentages) thatmost closely matches your SNP profile. These results do not necessarily indicate percentages ofrecent family ancestors from each country or ethnic group listed, but instead express the closestgenetic fit for your genome using SNP markers.
Table 3: Your Population Mixture
Population Mixture
Lithuania 73.2%Estonia 14.4%
Ukraine Western 10.8%Slovenia 1.5%
Other 0.1%
3DNA Tribes classifies as native populations that have neither migrated nor mixed in recent history (approximately the past 500 years).
Page 7

© 2006-2016 DNA Tribes® All rights reserved.DNA Tribes genetic ancestry analysis is available exclusively from DNA Tribes.
Satellite images courtesy NASA Earth Observatory.
Iterative Population Admixture: Native and Jewish Populations
This portion of your report lists additional combinations of all native and Jewish populations in ourreference database that closely fit your ancestral composition. More specifically, the topcontributing population from the previous iteration is excluded in the current iteration and theprocess is repeated and summarized eight times. The iterative population mixture approach showsthat some populations are close substitutes, and your genome can be accurately approximatedusing different combinations. That is, it is difficult to attribute your genomic make-up to a single,specific combination of populations; rather, it can be summarized using different combinations.
The table below summarizes the absolute and relative divergences from your genome exhibited bythe iterative population combinations.
Table 4: Your Divergence Scores for Iterative Mixture Results
Iteration Absolute Divergence Relative Divergence
1 0.14% 0.002 0.16% 0.123 0.22% 0.564 0.33% 1.305 0.33% 1.356 0.35% 1.497 0.38% 1.678 0.46% 2.23
Page 8

© 2006-2016 DNA Tribes® All rights reserved.DNA Tribes genetic ancestry analysis is available exclusively from DNA Tribes.
Satellite images courtesy NASA Earth Observatory.
Multi-Dimensional Scaling (MDS): Native and Jewish Populations
This plot illustrates your geo-genetic relationship with native and Jewish populations identified ashaving some of the largest contributions in your iterative population mixture analyses. Unlike theMDS plots for Continental Cores and Regional Clusters, the population MDS plot aggregates allindividuals from the same population into a single point on the plot to reduce the amount ofvariability inherent within any population. Your genotype’s position is displayed as a red circle inthe MDS plot, and your genetic make-up is most similar to the populations that are close to yourposition in the plot.
Page 9

© 2006-2016 DNA Tribes® All rights reserved.DNA Tribes genetic ancestry analysis is available exclusively from DNA Tribes.
Satellite images courtesy NASA Earth Observatory.
World Genetic Grid
This portion of your report shows the geographical distribution of your ancestral composition basedon native populations in our database. Locations on the grid that are genetically most similar to youare mapped in red; locations that are substantially dissimilar to you are mapped in blue. The colorsin between red and blue visualize the strength of your relationship to specific geographical areas ofthe world.
Page 10

© 2006-2016 DNA Tribes® All rights reserved.DNA Tribes genetic ancestry analysis is available exclusively from DNA Tribes.
Satellite images courtesy NASA Earth Observatory.
Total Ancestral Fit: European Populations
This portion of your report ranks the similarity of your genome to European populations in ourdatabase when each population is considered independently. Each population on the map islabeled with a number expressing its ranking among your population matches.
Table 5: Your Population Matches: Europe
Rank Population Map Area
1 Latvia Europe2 Lithuania Europe3 Belarus Europe4 Russia Voronezh Europe5 Russia Oryol Europe6 Russia Kursk Europe7 Russia Smolensk Europe8 Ukraine General Europe9 Poland Europe10 Russia Tver Europe11 Russia General Europe12 Slovakia Europe13 Estonia Europe14 Mordvin Europe15 Ukraine Western Europe16 Moldavia Europe17 Russia Vologda Europe18 Czech Europe19 Russia Kostroma Europe20 Hungary Europe21 Russia Pinega Europe
Page 11

© 2006-2016 DNA Tribes® All rights reserved.DNA Tribes genetic ancestry analysis is available exclusively from DNA Tribes.
Satellite images courtesy NASA Earth Observatory.
Rank Population Map Area
22 Croatia Europe23 Slovenia Europe24 Lapland Europe25 Germany Europe26 Finland Europe27 Vepsas Europe28 Bosnia Europe29 Karelian Europe30 Sweden Europe31 Gagauz Moldova Europe33 Serbia Europe35 Netherlands Europe36 England Europe37 Cornwall West Britain Europe38 Komi Europe40 Macedonia Europe41 Kryashens Christianized Tatars Europe42 Tatarstan Europe43 Ireland Europe44 Argyll and Bute Scottish Highlands Europe45 Bulgaria Europe46 Belgium Europe47 Romania Europe48 Orkney Islands Scotland Europe49 Norway Europe50 Montenegro Europe51 France Europe52 Tuscany Italy Europe54 Denmark Europe55 Bergamo Italy Europe56 Greece Macedonia Region Europe57 Italy General Europe59 Spain Europe61 Chuvash Russian Federation Europe62 Kosovo Europe63 Thessaly Greece Europe64 Greece Peleponnesse Region Europe65 Galicia Spain Europe68 Basque France Europe70 Eastern Sicily Europe71 Western Sicily Europe72 Central Greece Europe76 Abruzzo Italy Europe79 Greece General Europe84 Andalusia Spain Europe89 Basque Spain Europe99 Portugal Europe100 Southern Italy Europe101 Udmurts Europe115 Maris Europe116 Sardinia Europe121 Agrigento Sicily Europe
Page 12

© 2006-2016 DNA Tribes® All rights reserved.DNA Tribes genetic ancestry analysis is available exclusively from DNA Tribes.
Satellite images courtesy NASA Earth Observatory.
Rank Population Map Area
138 Malta Europe142 Central Sicily Europe236 Nenets Europe
Page 13

© 2006-2016 DNA Tribes® All rights reserved.DNA Tribes genetic ancestry analysis is available exclusively from DNA Tribes.
Satellite images courtesy NASA Earth Observatory.
Total Ancestral Fit: Caucasus Mountains Populations
This portion of your report ranks the similarity of your genome to Caucasus Mountains populationsin our database when each population is considered independently. Each population on the map islabeled with a number expressing its ranking among your population matches.
Table 6: Your Population Matches: Caucasus Mountains
Rank Population Map Area
78 Adyghe North Caucasus Caucasus81 Lezgins Caucasus82 Chechen Caucasus85 Dargin Urkarah Dagestan Caucasus88 Kumyk Caucasus91 Tabasaran Caucasus95 Balkar Caucasus102 Nogay Caucasus105 Azeri Dagestan Caucasus113 Imer Georgia Caucasus114 Georgia Caucasus Caucasus117 Kabardin Caucasus118 Abkhazian Caucasus119 Laz Caucasus126 Armenian Caucasus127 Ossetia Caucasus128 Azerbaijan Caucasus135 Turkey Caucasus139 Azeri Iran Caucasus240 Kalmyk Caucasus
Page 14

© 2006-2016 DNA Tribes® All rights reserved.DNA Tribes genetic ancestry analysis is available exclusively from DNA Tribes.
Satellite images courtesy NASA Earth Observatory.
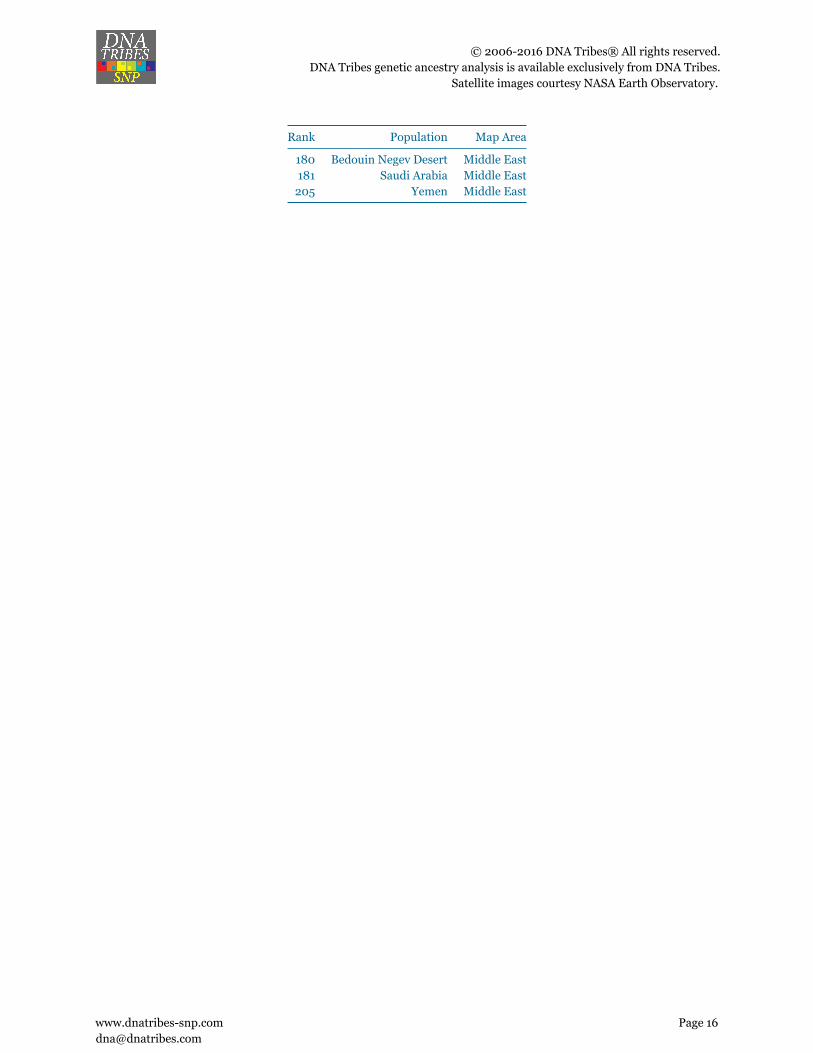
Total Ancestral Fit: Middle Eastern Populations
This portion of your report ranks the similarity of your genome to Middle Eastern populations inour database when each population is considered independently. Each population on the map islabeled with a number expressing its ranking among your population matches.
Table 7: Your Population Matches: Middle East
Rank Population Map Area
112 Cyprus Middle East125 Assyrian Middle East131 Lebanese Muslim Middle East132 Kurdish Middle East136 Druze Israel Carmel Middle East140 Iraq Middle East143 Lebanese Druze Middle East145 Lebanese Christian Middle East150 Syria Middle East152 Iran Middle East153 Samaritan Middle East154 Turkish Cyprus Middle East155 Lebanon General Middle East156 Jordan Middle East158 Palestinian Israel Middle East165 Egyptian Copt Middle East168 Arabs UAE Middle East170 Arab Qatar Middle East174 Egyptian Middle East179 Qatar General Middle East
Page 15
© 2006-2016 DNA Tribes® All rights reserved.DNA Tribes genetic ancestry analysis is available exclusively from DNA Tribes.
Satellite images courtesy NASA Earth Observatory.
Rank Population Map Area
180 Bedouin Negev Desert Middle East181 Saudi Arabia Middle East205 Yemen Middle East
Page 16

© 2006-2016 DNA Tribes® All rights reserved.DNA Tribes genetic ancestry analysis is available exclusively from DNA Tribes.
Satellite images courtesy NASA Earth Observatory.
Total Ancestral Fit: African Populations
This portion of your report ranks the similarity of your genome to African populations in ourdatabase when each population is considered independently. Each population on the map islabeled with a number expressing its ranking among your population matches.
Table 8: Your Population Matches: Africa
Rank Population Map Area
159 Libya Africa183 Morocco Africa184 Algeria Africa185 North Morocco Africa190 Tunisia Africa194 Mozabite Algeria Mzab Africa200 Saharawi Africa225 South Morocco Africa257 Amhara Ethiopia Africa262 Tigray Ethiopia Africa265 Ethiopia General Africa267 Afar Ethiopia Africa275 Oromo Ethiopia Africa290 Somalia Africa302 Somali Ethiopia Africa351 Wolayta Ethiopia Africa379 Maasai Kenya Africa385 Ari Cultivator Ethiopia Africa386 Vezo Madagascar Africa388 Mikea Madagascar Africa
Page 17

© 2006-2016 DNA Tribes® All rights reserved.DNA Tribes genetic ancestry analysis is available exclusively from DNA Tribes.
Satellite images courtesy NASA Earth Observatory.
Rank Population Map Area
389 Temoro Madagascar Africa390 Sandawe Tanzania Africa391 Fulani Nigeria Africa392 Hema East Central Africa Africa396 Herero South Africa Africa397 Ari Blacksmith Ethiopia Africa398 Tanzania Africa400 Khomani San Askham South Africa Africa401 Bantu Kenya Africa402 Luhya Kenya Africa403 Nama Khoe Windhoek Namibia Africa404 Gumuz Ethiopia Africa405 Bulala Chad Africa406 Anuak Ethiopia Africa407 South Sudanese Africa408 Mada Cameroon Africa411 Kaba Chad Africa412 Alur East Central Africa Africa413 Mandenka Senegal Africa414 Ovambo South Africa Africa415 Bambara West Africa Africa416 Dogon West Africa Africa417 Brong Africa418 Bamoun Cameroon Africa419 Yoruba Nigeria Africa420 Igbo Nigeria Africa421 Pedi South Africa Africa422 Bantu South Africa Africa423 Yembe Africa424 Khwe San Caprivi Southern Africa Africa425 Hausa Nigeria Africa426 Khomani San South Africa Africa427 Hadza Tanzania Africa428 Herero Namibia Africa429 Nguni South Africa Africa430 Congo Africa431 Xhosa Africa432 Karretjie San Colesberg South Africa Africa433 Fang Cameroon Africa434 San Namibia Africa435 Tswana South Africa Africa436 Sotho South Africa Africa437 Aka Central African Republic Africa438 Xun San Menongue Angola Africa439 Mbuti East Central Africa Africa440 Kung Kalahari Desert Africa441 Gui and Gana San Botswana Africa442 Juoansi San Tsumkwe Namibia Africa
Page 18
© 2006-2016 DNA Tribes® All rights reserved.DNA Tribes genetic ancestry analysis is available exclusively from DNA Tribes.
Satellite images courtesy NASA Earth Observatory.
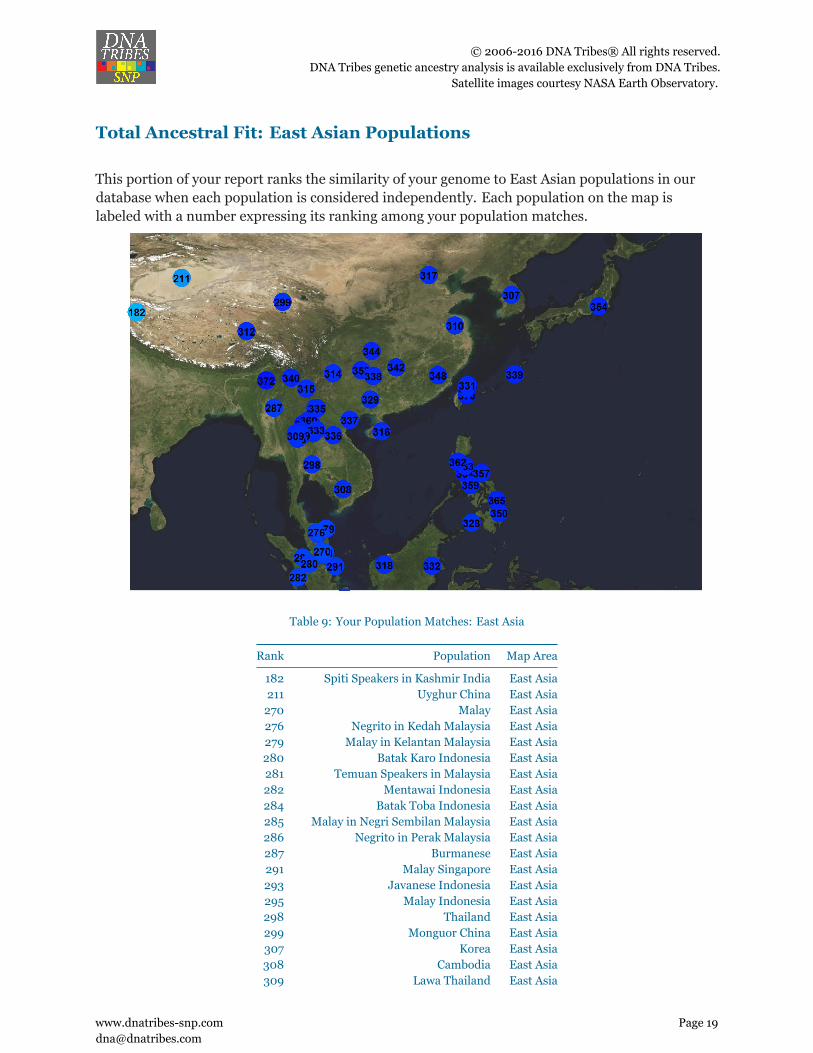
Total Ancestral Fit: East Asian Populations
This portion of your report ranks the similarity of your genome to East Asian populations in ourdatabase when each population is considered independently. Each population on the map islabeled with a number expressing its ranking among your population matches.
Table 9: Your Population Matches: East Asia
Rank Population Map Area
182 Spiti Speakers in Kashmir India East Asia211 Uyghur China East Asia270 Malay East Asia276 Negrito in Kedah Malaysia East Asia279 Malay in Kelantan Malaysia East Asia280 Batak Karo Indonesia East Asia281 Temuan Speakers in Malaysia East Asia282 Mentawai Indonesia East Asia284 Batak Toba Indonesia East Asia285 Malay in Negri Sembilan Malaysia East Asia286 Negrito in Perak Malaysia East Asia287 Burmanese East Asia291 Malay Singapore East Asia293 Javanese Indonesia East Asia295 Malay Indonesia East Asia298 Thailand East Asia299 Monguor China East Asia307 Korea East Asia308 Cambodia East Asia309 Lawa Thailand East Asia
Page 19

© 2006-2016 DNA Tribes® All rights reserved.DNA Tribes genetic ancestry analysis is available exclusively from DNA Tribes.
Satellite images courtesy NASA Earth Observatory.
Rank Population Map Area
310 Jiangsu China East Asia312 Tibet East Asia313 Karen Thailand East Asia314 Yi China East Asia315 Naxi China East Asia316 Jiamao China East Asia317 Han Beijing China East Asia318 Iban Borneo East Asia319 Tai Yong Thailand East Asia320 Bidayuh Malaysia East Asia328 Filipino Philippines East Asia329 Zhuang China East Asia331 Chinese Hakka Speakers in Taiwan East Asia332 Dayak Indonesia East Asia333 Htin Thailand East Asia334 Hmong Miao Thailand East Asia335 Jinuo China East Asia336 Lahu China East Asia337 Vietnam East Asia338 Hmong China East Asia339 Ryukyuan Japan East Asia340 Wa East Asia341 Tai Yuan Thailand East Asia342 Han Southern China East Asia344 Tujia China East Asia345 Atayal Taiwan East Asia347 Chinese Minnan Speakers in Taiwan East Asia348 She China East Asia349 Tai Lue Thailand East Asia350 Minanubu Philippines East Asia352 Dai China East Asia353 Miao China East Asia354 Japanese East Asia355 Mlabri Thailand East Asia356 Tai Khuen Thailand East Asia357 Agta Philippines East Asia358 Mon Thailand East Asia359 Ati Philippines East Asia360 Plang Thailand East Asia362 Ayta Philippines East Asia363 Philippines General East Asia364 Yao Thailand East Asia365 Mamanwa Philippines East Asia366 Paluang Thailand East Asia369 Iraya Philippines East Asia370 Ami Taiwan East Asia372 Naga India East Asia374 Taiwan East Asia380 Alorese Indonesia East Asia
Page 20

© 2006-2016 DNA Tribes® All rights reserved.DNA Tribes genetic ancestry analysis is available exclusively from DNA Tribes.
Satellite images courtesy NASA Earth Observatory.
Total Ancestral Fit: Oceanian and South Malay ArchipelagoPopulations
This portion of your report ranks the similarity of your genome to South Malay Archipelagopopulations in our database when each population is considered independently. Each populationon the map is labeled with a number expressing its ranking among your population matches.
Table 10: Your Population Matches: Oceania and South MalayArchipelago
Rank Population Map Area
292 Sunda Indonesia Oceania311 Kambera Indonesia Oceania324 Lamaholot Indonesia Oceania326 Toraja Indonesia Oceania327 Maluku Islands Oceania330 Manggarai Indonesia Oceania377 Tonga Oceania378 Samoa Oceania381 Lembata Indonesia Oceania384 Melanesian Bougainville Oceania399 Papuan New Guinea Oceania
Page 21

© 2006-2016 DNA Tribes® All rights reserved.DNA Tribes genetic ancestry analysis is available exclusively from DNA Tribes.
Satellite images courtesy NASA Earth Observatory.
Total Ancestral Fit: North Asian Populations
This portion of your report ranks the similarity of your genome to North Asian populations in ourdatabase when each population is considered independently. Each population on the map islabeled with a number expressing its ranking among your population matches.
Table 11: Your Population Matches: North Asia
Rank Population Map Area
69 Tajik Rushan North Asia73 Tajik Shugnan North Asia94 Yaghnobi North Asia103 Tajik Ishkashim North Asia122 Bashkir North Asia129 Tajik North Asia134 Russia Urals North Asia157 Turkmen North Asia163 Uzbek Central Asia North Asia193 Kazakh North Asia195 Hazara Pakistan North Asia201 Karakalpaks North Asia213 Yukaghir Russian Federation North Asia222 Selkup Russian Federation North Asia238 Kyrgyz North Asia243 Khakas North Asia248 Ket Russian Federation North Asia251 Altai Russian Federation North Asia261 Mongol Mongolia North Asia266 Buryat China North Asia
Page 22

© 2006-2016 DNA Tribes® All rights reserved.DNA Tribes genetic ancestry analysis is available exclusively from DNA Tribes.
Satellite images courtesy NASA Earth Observatory.
Rank Population Map Area
268 Tuvinians Russian Federation North Asia274 Dolgan Russian Federation North Asia277 Buryat Russian Federation North Asia278 Chukchi Russian Federation North Asia288 Yakut Siberia North Asia289 Mongola China North Asia296 Oroqen China North Asia297 Daur China North Asia300 Xibo China North Asia304 Hezhen China North Asia305 Nganasan Russian Federation North Asia306 Evenk Russian Federation North Asia323 Even North Asia325 Shors North Asia367 Koryak Russian Federation North Asia410 Nivkh North Asia
Page 23

© 2006-2016 DNA Tribes® All rights reserved.DNA Tribes genetic ancestry analysis is available exclusively from DNA Tribes.
Satellite images courtesy NASA Earth Observatory.
Total Ancestral Fit: South Asian Populations
This portion of your report ranks the similarity of your genome to South Asian populations in ourdatabase when each population is considered independently. Each population on the map islabeled with a number expressing its ranking among your population matches.
Table 12: Your Population Matches: South Asia
Rank Population Map Area
147 Pashtun Pakistan South Asia148 Pashtun Afghanistan South Asia164 Brahui Pakistan South Asia166 Burusho Pakistan South Asia167 Makrani Pakistan South Asia169 Brahmin Tamil Nadu India South Asia171 Hindi Speakers in Haryana India South Asia172 Kalash Pakistan South Asia173 Brahmin Uttar Pradesh India South Asia175 Punjab India South Asia176 Balochi Pakistan South Asia177 Kashmir India South Asia178 Meena India South Asia186 Pahari Speakers in Uttaranchal India South Asia187 Arain Punjab Pakistan South Asia188 Sindhi Pakistan South Asia189 Kshatriya Uttar Pradesh India South Asia191 Gujarat India South Asia192 Muslim Uttar Pradesh India South Asia197 Hindi Speakers in Rajasthan India South Asia
Page 24

© 2006-2016 DNA Tribes® All rights reserved.DNA Tribes genetic ancestry analysis is available exclusively from DNA Tribes.
Satellite images courtesy NASA Earth Observatory.
Rank Population Map Area
198 Dharkar India South Asia202 Brahmin Andhra Pradesh India South Asia203 Bhili Speakers in Rajasthan India South Asia204 Scheduled Caste Tamil Nadu India South Asia206 Hindi Speakers in Uttar Pradesh India South Asia207 Scheduled Caste Uttar Pradesh India South Asia208 Tharu India South Asia209 Brahmin Uttaranchal India South Asia212 Velama India South Asia214 Lambadi India South Asia215 Kanjar India South Asia216 Kol India South Asia218 Chamar India South Asia219 Meghawal India South Asia220 Dalit Tamil Nadu India South Asia221 Dusadh India South Asia223 Mala Andhra Pradesh India South Asia224 Irula South India South Asia226 Nepal South Asia227 Piramalai Kallar India South Asia228 Sri Lanka South Asia229 Gond India South Asia230 Marathi Speakers in Maharastha India South Asia231 North Kannadi India South Asia232 Madiga Andhra Pradesh India South Asia233 Chenchu India South Asia234 Hakkipikki India South Asia235 Kurmi India South Asia237 Sakilli India South Asia239 Asur Jharkand India South Asia241 Nihali India South Asia242 Telugu Speakers in Andhra Pradesh India South Asia244 Mawasi India South Asia245 Bangladesh South Asia246 Bengali India South Asia247 Kurumba India South Asia253 Paniya India South Asia256 Juang Orissa India South Asia258 Savara Orissa India South Asia259 Pulliyar India South Asia264 Ho Bihar India South Asia271 Khasi Meghalaya India South Asia272 Bonda Orissa India South Asia273 Dhurwa India South Asia294 Gadaba Orissa India South Asia301 Garo Meghalaya India South Asia361 Bhunjia India South Asia368 Kharia Chattishgarh India South Asia
Page 25
© 2006-2016 DNA Tribes® All rights reserved.DNA Tribes genetic ancestry analysis is available exclusively from DNA Tribes.
Satellite images courtesy NASA Earth Observatory.
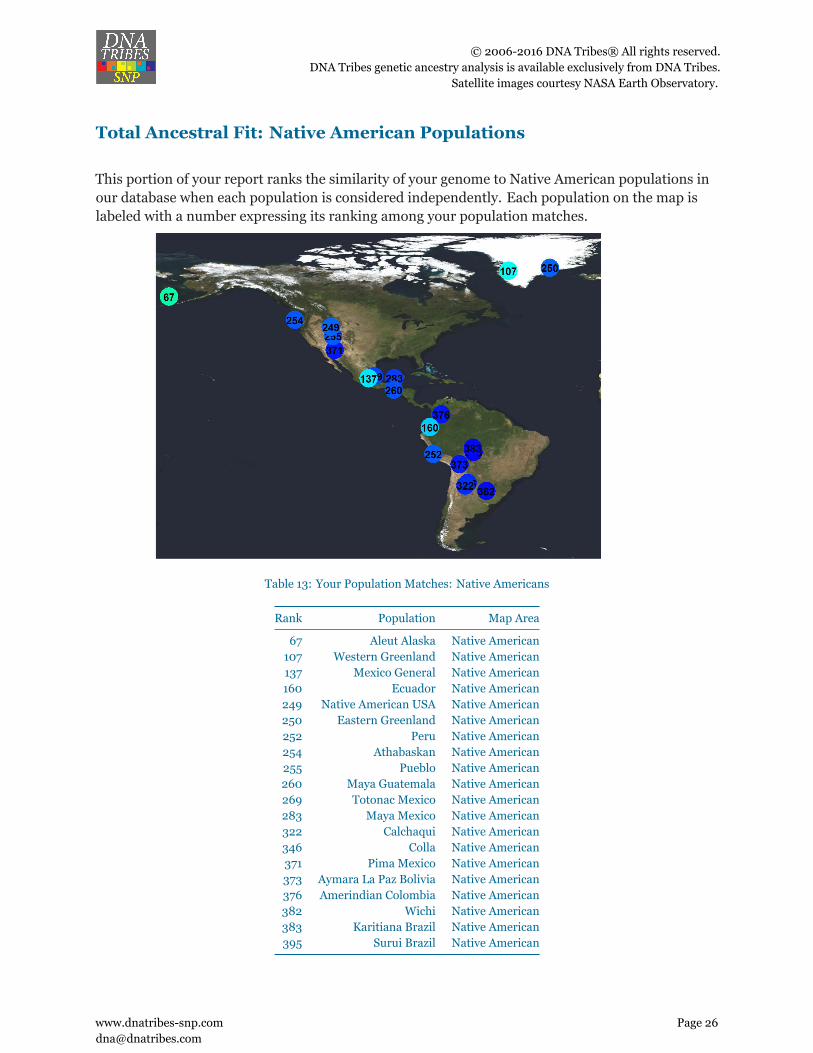
Total Ancestral Fit: Native American Populations
This portion of your report ranks the similarity of your genome to Native American populations inour database when each population is considered independently. Each population on the map islabeled with a number expressing its ranking among your population matches.
Table 13: Your Population Matches: Native Americans
Rank Population Map Area
67 Aleut Alaska Native American107 Western Greenland Native American137 Mexico General Native American160 Ecuador Native American249 Native American USA Native American250 Eastern Greenland Native American252 Peru Native American254 Athabaskan Native American255 Pueblo Native American260 Maya Guatemala Native American269 Totonac Mexico Native American283 Maya Mexico Native American322 Calchaqui Native American346 Colla Native American371 Pima Mexico Native American373 Aymara La Paz Bolivia Native American376 Amerindian Colombia Native American382 Wichi Native American383 Karitiana Brazil Native American395 Surui Brazil Native American
Page 26

© 2006-2016 DNA Tribes® All rights reserved.DNA Tribes genetic ancestry analysis is available exclusively from DNA Tribes.
Satellite images courtesy NASA Earth Observatory.
Total Ancestral Fit: Diasporic Populations
This portion of your report ranks the similarity of your genome to Diasporic populations in ourdatabase when each population is considered independently. Diasporic populations includemodern ethnic groups that have migrated or mixed in recent history (approximately the past 500years). Each population on the map is labeled with a number expressing the ranking among yourworld population matches.
Table 14: Your Population Matches: Diasporic Populations
Rank Population Diaspora Type
32 European American Diaspora34 Caucasian New Zealand and Australia Diaspora39 Romani Europe Diaspora53 Canary Islands Diaspora58 Cuba Diaspora60 Ashkenazi Jewish Europe General Jewish Diaspora66 Brazil Diaspora74 Ashkenazi Jewish Nertherlands Jewish Diaspora75 Ashkenazi Jewish Romania Jewish Diaspora77 Puerto Rico Diaspora80 Mestizo Diaspora83 Ashkenazi Jewish Poland Jewish Diaspora86 Italian Jewish Jewish Diaspora87 Ashkenazi Jewish Belarus Jewish Diaspora90 Ashkenazi Jewish Latvia Jewish Diaspora92 Moroccan Jewish Jewish Diaspora93 Sephardic Jewish Turkey Jewish Diaspora96 Algerian Jewish Jewish Diaspora97 Persian Qatar Diaspora98 Ashkenazi Jewish Russia Jewish Diaspora104 Costa Rica Diaspora106 Sephardic Jewish General Jewish Diaspora
Page 27

© 2006-2016 DNA Tribes® All rights reserved.DNA Tribes genetic ancestry analysis is available exclusively from DNA Tribes.
Satellite images courtesy NASA Earth Observatory.
Rank Population Diaspora Type
108 Colombia Diaspora109 Ashkenazi Jewish Austria Jewish Diaspora110 Ashkenazi Jewish France Jewish Diaspora111 Syrian Jewish Jewish Diaspora120 Ashkenazi Jewish Germany Jewish Diaspora123 Georgian Jewish Jewish Diaspora124 Uzbekistani Jewish Jewish Diaspora130 Mexican American Los Angeles CA Diaspora133 Tunisian Jewish Jewish Diaspora141 Azerbaijani Jewish Jewish Diaspora144 Iranian Jewish Jewish Diaspora146 Libyan Jewish Jewish Diaspora149 Kurdistand Jewish Jewish Diaspora151 Iraqi Jewish Jewish Diaspora161 Dominican Republic Diaspora162 Yemenite Jewish Jewish Diaspora196 Mumbai Jewish Jewish Diaspora199 Indian Singaporean Diaspora210 Cochin Jewish India Jewish Diaspora217 Coloured Wellington South Africa Diaspora263 Ethiopian Jewish Jewish Diaspora303 African American Diaspora321 Chinese American Denver CO Diaspora343 Chinese Singaporean Diaspora375 Coloured Colesberg South Africa Diaspora387 African Qatar Diaspora393 Jamaica Diaspora394 Barbados Diaspora409 Haiti Diaspora
Page 28