Embed Size (px)
Citation preview

SNELLING AVENUE RAPID BUS VISSIM EVALUATION
FINAL REPORT
July 2, 2013
Prepared for
Metro Transit
Prepared by
SRF CONSULTING GROUP, INC. One Carlson Parkway North, Suite 150
Minneapolis, MN 55447-4443 (763) 475-0010
Fax: (763) 475-2429
SRF No. 0127939


SNELLING AVENUE RAPID BUS VISSIM EVALUATION
EXECUTIVE SUMMARY
Metro Transit has developed a concept for Arterial Bus Rapid Transit, or “rapid bus”, to improve transit speed and attractiveness on its busiest urban corridors. Metro Transit is advancing Snelling Avenue/Ford Parkway as the first corridor for rapid bus implementation. This corridor extends roughly 10 miles from the Rosedale Transit Center to the 46th Street LRT Station just west of Trunk Highway 55 (Hiawatha Avenue) in Minneapolis. Metro Transit hopes to begin rapid bus service on this corridor in 2015. Two components of the rapid bus concept are geometric modification of bus stations to include curb extensions, or bumpouts, to improve the efficiency of loading and unloading maneuvers, and the addition of Transit Signal Priority (TSP) to reduce the amount of transit delay due to red lights. The purpose of this project is to perform a detailed analysis of the potential benefits and costs of these improvements. Input was sought from agency stakeholders including MnDOT Metro District, Ramsey County, Hennepin County, the City of Saint Paul and the City of Minneapolis. The study process was refined based on input from these stakeholders. To estimate the potential benefit of TSP and evaluate the performance of the new station configurations, the corridor was modeled using VISSIM. The 34 signalized intersections along the route were included. Year 2012 traffic counts were assumed for the majority of the intersections. Older count data with higher traffic volumes was used for the segment of Snelling Avenue between County Road B and Selby Avenue due to low volumes caused by construction of the Green Line (Central Corridor) LRT at University Avenue during collection of count data in 2012. The cities of Minneapolis and St. Paul are both in the process of implementing new signal timing plans. The anticipated new timing plans were included in the model. ASC/3 software-in-the-loop technology was used to model signal operations, including TSP. The operations of the soon-to-be-completed Green Line were also included in the model. The a.m. and p.m. peak hours of five scenarios were modeled. The scenarios included a baseline with no rapid bus service, three rapid bus service alternatives with varying station configurations, and a rapid bus alternative scenario with TSP. Significant findings from the analysis included the following:
During the a.m. peak hour, proposed rapid bus operations with have very little, if any, discernible impact on traffic operations. In quantitative terms, average delay per vehicle for general traffic is expected to increase by less than 2 seconds near each of the proposed stations.
During the p.m. peak hour, proposed rapid bus operations with have very little impact (less than 2 seconds of added delay per vehicle) at 15 of the 17 stations modeled.
Snelling Avenue Rapid Bus VISSIM Evaluation Executive Summary July 2, 2013 Page 2
During the p.m. peak hour, the northbound University Avenue rapid bus station is likely to have an impact on traffic operations of approximately 5 seconds of added delay per vehicle. An analysis of an alternate location for the Northbound University Avenue station at Spruce Tree Avenue was completed. The new configuration of the station moved the stop out of the travel lane and into a right turn lane. The results showed that average delay could be improved by 2 to 5 seconds in the p.m. peak hour under this alternative.
During the p.m. peak hour, the northbound Hague Avenue rapid bus station is likely to have an impact on traffic operations of approximately 7 seconds of additional delay per vehicle. The southbound Hague Avenue rapid bus station appears to have a slight impact to traffic operations of approximately 2 seconds per vehicle in the p.m. peak hour. An analysis of alternate locations for the Hague Avenue station pair with a northbound station at Selby and a southbound station at Dayton was completed. The results showed that moving the stations further north would result in slightly increased delay (around 2 seconds in the p.m. peak hour) for general traffic.
VISSIM model analysis results indicate that TSP could reduce travel time for rapid buses by 3 to 5 minutes (10 to 14%). The analysis showed that rapid bus running time during peak periods is expected to vary between 35 and 40 minutes per one-way run without TSP.
98% percent of the potential benefit of TSP came from its use at seven project intersections. 13 project intersections in total saw a net benefit from TSP use, while the potential disbenefit outweighed the potential benefit at the remaining 20 project intersections where TSP use was analyzed.
The intersections showing a potential net benefit due to TSP are as follows. The seven intersections showing greatest potential benefit are in bold.
1. County Road B2 at Snelling Avenue at East Ramps 2. Snelling Avenue at Hoyt Avenue 3. Snelling Avenue at Midway Parkway 4. Snelling Avenue at Thomas Avenue 5. Snelling Avenue at Spruce Tree Avenue 6. Snelling Avenue at St. Anthony Avenue (I-94 North Ramps) 7. Snelling Avenue at Concordia Avenue (I-94 South Ramps) 8. Snelling Avenue at Marshall Avenue 9. Snelling Avenue at Selby Avenue 10. Ford Parkway at Fairview Avenue 11. Ford Parkway at Cretin Avenue 12. 46th Street at 46th Avenue 13. 46th Street at 42nd Avenue

Snelling Avenue Rapid Bus VISSIM Evaluation Final Report July 2, 2013 Page i
TABLE OF CONTENTS
Page
1.0 INTRODUCTION ................................................................................................... 1
1.1 PROJECT PURPOSE ........................................................................................... 1 1.2 ANALYSIS METHODOLOGY .................................................................................. 3 1.3 STAKEHOLDER INVOLVEMENT ............................................................................. 4 1.4 TSP BACKGROUND............................................................................................ 5
2.0 VISSIM MODEL DEVELOPMENT ........................................................................ 6
2.1 ROADWAY GEOMETRY ....................................................................................... 6 2.2 TRAFFIC VOLUMES ............................................................................................. 7 2.3 SIGNAL TIMING .................................................................................................. 7 2.4 RAPID BUS STATION CONFIGURATION AND OPERATION ........................................ 8 2.5 RAPID BUS CHARACTERISTICS .......................................................................... 10 2.6 MOE REPORTING ............................................................................................ 10 2.7 LIGHT RAIL TRANSIT LINES ............................................................................... 10
3.0 EVALUATION OF RAPID BUS STATION TRAFFIC IMPACT ........................... 12
3.1 BASELINE VS. ALPHA ANALYSIS – AVERAGE DELAY PER VEHICLE ........................ 12 3.2 BASELINE VS. ALPHA ANALYSIS – NON-RAPID BUS TRAVEL TIME ........................ 14 3.3 CONCLUSIONS FROM BASELINE VS. ALPHA ANALYSIS ......................................... 16 3.4 ALPHA VS. BETA ANALYSIS – UNIVERSITY AVENUE STATION ............................... 17 3.5 ALPHA VS. BETA ANALYSIS – HAGUE AVENUE STATION ...................................... 20 3.6 RAPID BUS REFINED SCENARIO ........................................................................ 24
4.0 ASSESSMENT OF POTENTIAL TSP BENEFIT ................................................ 25
4.1 TSP SLACK TIME ANALYSIS ............................................................................. 25 4.2 DEVELOPMENT OF PRELIMINARY TSP TIMING SETTINGS ..................................... 27 4.3 VISSIM ANALYSIS OF POTENTIAL TSP BENEFIT – NETWORK WIDE ..................... 28 4.4 VISSIM ANALYSIS OF POTENTIAL TSP BENEFIT – BY INTERSECTION .................. 30 4.5 VISSIM ANIMATION ......................................................................................... 33
5.0 STATION-BY-STATION SUMMARIES ............................................................... 36
6.0 CONCLUSIONS AND RECOMMENDATIONS ................................................... 47
6.1 CONCLUSIONS ................................................................................................. 47 6.2 RECOMMENDATIONS ........................................................................................ 48
7.0 APPENDIX .......................................................................................................... 50

Snelling Avenue Rapid Bus VISSIM Evaluation Final Report July 2, 2013 Page ii
LIST OF FIGURES
Page
Figure 1.1 – Snelling Avenue Rapid Bus Corridor ....................................................... 2
Figure 3.1 – University Avenue Northbound – Rapid Bus Alpha Scenario Station Configuration ............................................................................................................. 18
Figure 3.2 – University Avenue Northbound – Rapid Bus Beta Scenario Station Configuration ............................................................................................................. 19
Figure 3.3 – Hague Avenue – Rapid Bus Alpha Scenario Station Configurations ..... 21
Figure 3.4 – Hague Avenue Northbound – Rapid Bus Beta Scenario Station Configuration ............................................................................................................. 22
Figure 3.5 – Hague Avenue Southbound – Rapid Bus Beta Scenario Station Configuration ............................................................................................................. 23
LIST OF TABLES
Page
Table 1.1 – Scenarios Modeled ................................................................................... 4
Table 2.1 – Snelling Avenue Corridor Signalized Intersections ................................... 6
Table 2.2a – Northbound Rapid Bus Stations – Preliminary Configuration ................. 9
Table 2.2b – Southbound Rapid Bus Stations – Preliminary Configuration................. 9
Table 3.1 – Rapid Bus Impact on Average Delay per Vehicle ................................... 13
Table 3.2 – Rapid Bus Impact on non-Rapid Bus Arterial Travel Time ..................... 15
Table 3.3 – Northbound University Avenue Station Alternatives Studied .................. 17
Table 3.4 – University Avenue Northbound Station Alternatives – Rapid Bus Impact on Average Delay per Vehicle ................................................................................... 20
Table 3.5 – University Avenue Northbound Station Alternatives – Rapid Bus Impact on Non-Rapid Bus Arterial Travel Time ..................................................................... 20
Table 3.6a – Hague Avenue Northbound Station Alternatives Studied ..................... 21
Table 3.6b – Hague Avenue Southbound Station Alternatives Studied .................... 21
Table 3.7 – Hague Avenue Station Alternatives – Rapid Bus Impact on Average Delay per Vehicle ...................................................................................................... 23
Table 3.8 – Hague Avenue Station Alternatives – Rapid Bus Impact on Non-Rapid Bus Arterial Travel Time ............................................................................................ 24
Table 4.1 – Slack Time Analysis Summary ............................................................... 26

Snelling Avenue Rapid Bus VISSIM Evaluation Final Report July 2, 2013 Page iii
Table 4.2 – Corridor Travel Time Reduction with TSP .............................................. 28
Table 4.3 – Total Network Delay Increase with TSP ................................................. 29
Table 4.4 – TSP Impact on Network-Wide Person-Delay .......................................... 30
Table 4.5 – TSP Impact on Person-Delay, By Intersection ....................................... 31
Table 4.6 – High Potential Benefit TSP Intersections ................................................ 32
Table 4.7a – Video Interpretation Log – Rapid Bus with TSP – Northbound PM ...... 34
Table 4.7b – Video Interpretation Log – Rapid Bus with TSP – Southbound PM ...... 35
Table 5.1 – Rapid Bus MOE Summary – County Road B / Har Mar Station ............. 37
Table 5.2 – Rapid Bus MOE Summary – Roselawn Station ...................................... 37
Table 5.3 – Rapid Bus MOE Summary – Larpenteur Station .................................... 38
Table 5.4 – Rapid Bus MOE Summary – Hewitt Station ........................................... 38
Table 5.5 – Rapid Bus MOE Summary – Minnehaha (St. Paul) Station .................... 39
Table 5.6 – Rapid Bus MOE Summary – University Station ...................................... 40
Table 5.7 – Rapid Bus MOE Summary – Hague Station ........................................... 41
Table 5.8 – Rapid Bus MOE Summary – Grand Station ........................................... 41
Table 5.9 – Rapid Bus MOE Summary – St. Clair Station ......................................... 42
Table 5.10 – Rapid Bus MOE Summary – Randolph Station .................................... 42
Table 5.11 – Rapid Bus MOE Summary – Highland Station ..................................... 43
Table 5.12 – Rapid Bus MOE Summary – Fairview Station ...................................... 43
Table 5.13 – Rapid Bus MOE Summary – Kenneth Station ...................................... 44
Table 5.14 – Rapid Bus MOE Summary – Finn Station ............................................ 44
Table 5.15 – Rapid Bus MOE Summary – Woodlawn Station ................................... 45
Table 5.16 – Rapid Bus MOE Summary – 45th/46th Station .................................... 45
Table 5.17 – Rapid Bus MOE Summary – Minnehaha (Minneapolis) Station ........... 46
H:\Projects\7939\SD\Report\2013-07-02 Final\Snelling Avenue Rapid Bus VISSIM Evaluation - Final Report.docx

Snelling Avenue Rapid Bus VISSIM and TSP Benefit Evaluation Final Report July 2, 2013 Page 1
1.0 INTRODUCTION
Metro Transit has developed a concept for Arterial Bus Rapid Transit, or “rapid bus”, to improve transit speed and attractiveness on its busiest urban corridors. To date, 12 corridors have been identified for potential future implementation of rapid bus. Based on the outcome of the 2012 Arterial Transitway Corridors Study (ATCS), Metro Transit is advancing Snelling Avenue/Ford Parkway as the first corridor for rapid bus implementation. Metro Transit hopes to begin rapid bus service on this corridor in 2015, shortly after the opening of the Green Line (Central Corridor LRT). The Snelling Avenue rapid bus corridor extends roughly 10 miles from the Rosedale Transit Center south on Snelling Avenue, to Ford Parkway in St. Paul and across the Mississippi River and onto 46th Street, terminating in Minneapolis at the 46th Street LRT Station just west of Trunk Highway 55 (Hiawatha Avenue). The corridor passes through 34 signalized intersections, and crosses two light rail transit (LRT) lines, the Blue Line (Hiawatha) and Green Line (Central Corridor). Twenty rapid bus stations are planned for the corridor, spaced roughly every half mile. Figure 1 provides an overview of the corridor’s route and station locations. 1.1 Project Purpose
Two components of the rapid bus concept are geometric modification of bus stations to include curb extensions, or bumpouts, to improve the efficiency of loading and unloading maneuvers, and the addition of Transit Signal Priority (TSP) to reduce the amount of transit delay due to red lights. These two components have the potential to greatly benefit transit operations, but may also adversely impact traffic flow, either on conflicting approaches in the case of TSP, or on the mainline in the case of curb extensions. The ATCS included a high-level evaluation of the potential time savings benefit to transit of curb extensions and TSP on the Snelling/Ford corridor. The purpose of this project is to build upon the ATCS evaluation and perform a more detailed analysis of the potential benefits and costs of curb extensions and TSP along the corridor. To properly estimate the potential benefit of TSP and evaluate the performance of the new station configurations, the corridor was modeled using the VISSIM software tool. VISSIM is a microscopic traffic simulation software program capable of modeling complex multimodal transportation networks. It is particularly useful in modeling and evaluating networks with complex transit operations and TSP. The specific goals for this project are as follows:
1. Identify whether the proposed station locations and configurations are appropriate and can be operated without significant impact to traffic.
2. Evaluate the potential benefit of TSP and provide a ranking of which signalized intersections might benefit most from TSP.
3. Seek input from corridor stakeholders and document the process used to develop recommendations on goals one and two.

!53
!70
!16
!9
!3
!65
!63
!46
!7 !87
!134
!67!67
!70
!63
!70
!74 !74!134
!84 !84!84
!23
!23
!74
!9
!46
!3
!3!3
!61
!87
!23!74!
46!84
!65
!61
!53
R
R
R
R
R
R
R
R
R
R
R
R
RRRRR
RRR R RR R R R
R
R
RR
R
R
R
RR
R
R
R
R
R
G R E E N L I N E
B L UE L I N
E
Highland Park
Union Park
Como
St. Anthony Park
Macalester-Groveland
Hamline-Midway
LONGFELLOW
Roseville
Falcon Heights
Hague
Hewitt
Roselawn
HighlandFairvi
ew
Wood
lawn
Rosedale
University
46th
Stree
t Stat
ion
ComoFin
n
Grand
Kenn
eth
Randolph
Minnehaha
St. Clair
45th/
46th
Minn
ehah
aLarpenteur
County Road B
!°0 0.5 1
Miles
SNELLING AVENUEARTERIAL BRT/RAPID BUS CONCEPTupdated 10/8/2012

Snelling Avenue Rapid Bus VISSIM and TSP Benefit Evaluation Final Report July 2, 2013 Page 3
1.2 Analysis Methodology
The following process was used to determine the traffic operations impact of the proposed station configurations and the potential benefit of TSP. Baseline Scenario: First, a baseline model was constructed in VISSIM. This baseline model primarily represented existing (2012) conditions, with some revisions to account for planned geometric and signal timing improvements planned for implementation before the start of rapid bus service in 2015. Further discussion of the enhancements made is provided in Section 2 of this report. After the baseline model was developed using a set of default assumptions, the model was calibrated to replicate real world conditions as accurately as possible. This scenario is termed the Baseline in this report. Rapid Bus Alpha Scenario: The next scenario modeled rapid bus service and stations without any other geometric, traffic volume, or signal timing modifications. Preliminary station configurations, representing the desired condition for transit operations, were assumed for the rapid bus stations under this scenario. For the purposes of this report, this scenario is labeled as Rapid Bus Alpha. Rapid Bus Beta Scenario: Based on input provided by Metro Transit and stakeholders (see Section 1.3), modifications to the station configurations were made to improve areas where significant operational impacts were observed in the model. No other traffic volume, roadway geometry or signal timing modifications were made to this scenario in order to isolate the impact of the revised station geometry. This scenario is termed Rapid Bus Beta. Rapid Bus Refined Scenario: Based on the results of the Rapid Bus Beta scenario, and taking into account constraints identified by Metro Transit outside the scope of this study, a final Rapid Bus Refined scenario was developed. This scenario incorporates some of the station locations from the Rapid Bus Alpha scenario and some of the station locations from the Rapid Bus Beta scenario. Rapid Bus Refined with TSP Scenario: The final step in the analysis process was to incorporate Transit Signal Priority. TSP was added to the model through the use of Econolite ASC/3 software-in-the-loop signal controllers within the VISSIM model. The use of software-in-the-loop technology enables the signal timing in the model to be performed via the same signal controller software that would be used in the field.1 For the final scenario, labeled as Rapid Bus Refined with TSP, the signal timing plans were modified to allow the rapid buses to call for transit signal priority. Traffic operations between this scenario and the Rapid Bus Refined scenario were compared in order to estimate the potential benefit of TSP. Detailed discussion on the signal timing modifications made to incorporate TSP and the measures of effectiveness (MOEs) used to assess potential TSP benefit are provided in Section 4 of this report.
1 The City of Minneapolis uses Siemens/Eagle EPAC controllers to provide TSP. Operation is similar, but not
identical to Econolite ASC/3 controllers.
Snelling Avenue Rapid Bus VISSIM and TSP Benefit Evaluation Final Report July 2, 2013 Page 4
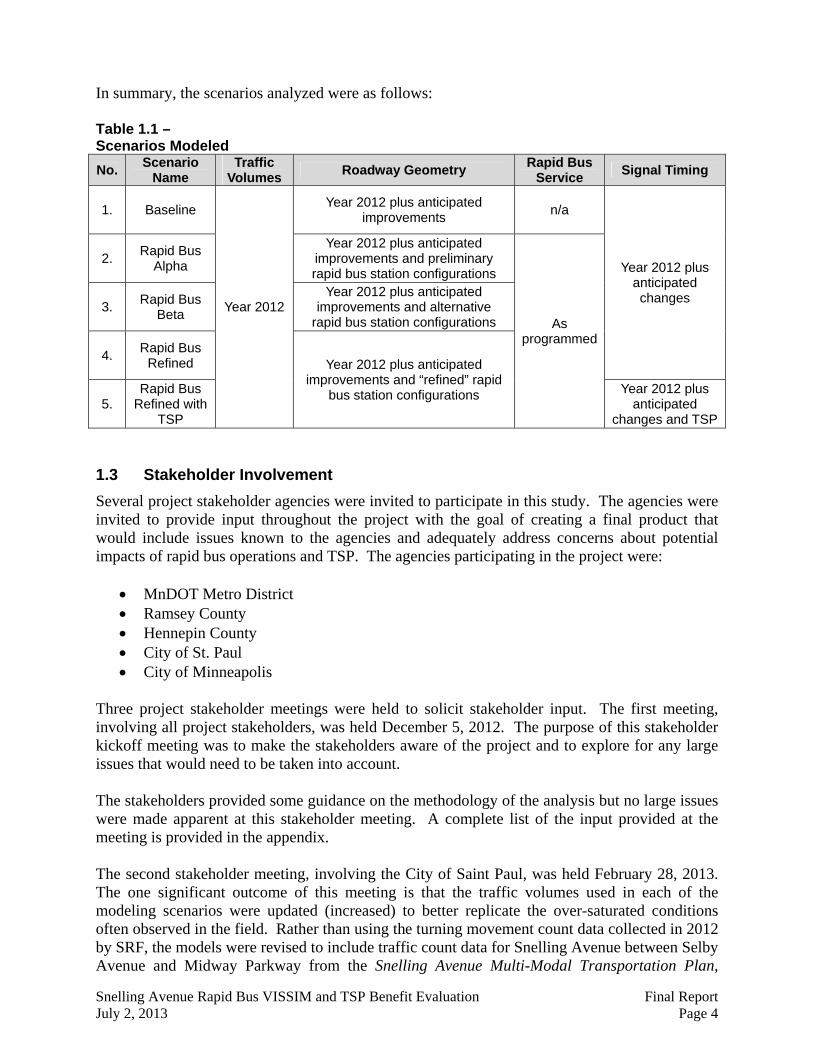
In summary, the scenarios analyzed were as follows: Table 1.1 – Scenarios Modeled
No. Scenario
Name Traffic
Volumes Roadway Geometry
Rapid Bus Service
Signal Timing
1. Baseline
Year 2012
Year 2012 plus anticipated improvements
n/a
Year 2012 plus anticipated changes
2. Rapid Bus
Alpha
Year 2012 plus anticipated improvements and preliminary rapid bus station configurations
As programmed
3. Rapid Bus
Beta
Year 2012 plus anticipated improvements and alternative
rapid bus station configurations
4. Rapid Bus
Refined Year 2012 plus anticipated improvements and “refined” rapid
bus station configurations 5.
Rapid Bus Refined with
TSP
Year 2012 plus anticipated
changes and TSP
1.3 Stakeholder Involvement
Several project stakeholder agencies were invited to participate in this study. The agencies were invited to provide input throughout the project with the goal of creating a final product that would include issues known to the agencies and adequately address concerns about potential impacts of rapid bus operations and TSP. The agencies participating in the project were:
MnDOT Metro District Ramsey County Hennepin County City of St. Paul City of Minneapolis
Three project stakeholder meetings were held to solicit stakeholder input. The first meeting, involving all project stakeholders, was held December 5, 2012. The purpose of this stakeholder kickoff meeting was to make the stakeholders aware of the project and to explore for any large issues that would need to be taken into account. The stakeholders provided some guidance on the methodology of the analysis but no large issues were made apparent at this stakeholder meeting. A complete list of the input provided at the meeting is provided in the appendix. The second stakeholder meeting, involving the City of Saint Paul, was held February 28, 2013. The one significant outcome of this meeting is that the traffic volumes used in each of the modeling scenarios were updated (increased) to better replicate the over-saturated conditions often observed in the field. Rather than using the turning movement count data collected in 2012 by SRF, the models were revised to include traffic count data for Snelling Avenue between Selby Avenue and Midway Parkway from the Snelling Avenue Multi-Modal Transportation Plan,
Snelling Avenue Rapid Bus VISSIM and TSP Benefit Evaluation Final Report July 2, 2013 Page 5
collected in 2004-2005, and volumes used by MnDOT to develop signal timing plans for Snelling Avenue between County Road B and Midway Parkway, collected in 2008. The Snelling Avenue Multi-Modal Transportation Plan was produced in 2012 for MnDOT and the City of Saint Paul. The final stakeholder meeting involved all project stakeholders and was held June 17, 2013. The purpose of this meeting was to present the findings of the study to the project stakeholders and to respond to any questions. The one-hour presentation included a viewing of a five-minute VISSIM animation showing the proposed operation of the Rapid Bus in the p.m. peak hour. Approximately a half dozen stakeholder questions were addressed during the course of the presentation. Meeting minutes for this meeting, include a list of attendees, were prepared by Metro Transit and are available through the Snelling Rapid Bus project office. 1.4 TSP Background
Transit Signal Priority (TSP) is currently used by Metro Transit at 29 intersections in the Twin Cities. 27 of the intersections are along Central Avenue in northeast Minneapolis and adjacent suburbs. The remaining two intersections are near the Rosedale Transit Center in Roseville. Of these 29 intersections, 18 are operated by the City of Minneapolis, 10 are operated by the MnDOT, and one is operated by Ramsey County. All Metro Transit buses (approximately 850) are equipped with the hardware necessary to facilitate TSP. The EMTRAC brand of TSP equipment was used to equip both the buses and intersections. EMTRAC uses GPS-based technology to perform TSP and also interfaces with the Trapeze Automated Vehicle Location (AVL) system on the buses to provide TSP calls on a conditional basis (when buses are behind schedule by a user-configurable amount of time). Metro Transit’s current TSP functionality was procured and made operational as part of the Urban Partnership Agreement (UPA) project two years ago. Metro Transit contributed funding totaling approximately $4 million to implement the system.
Snelling Avenue Rapid Bus VISSIM and TSP Benefit Evaluation Final Report July 2, 2013 Page 6
2.0 VISSIM MODEL DEVELOPMENT
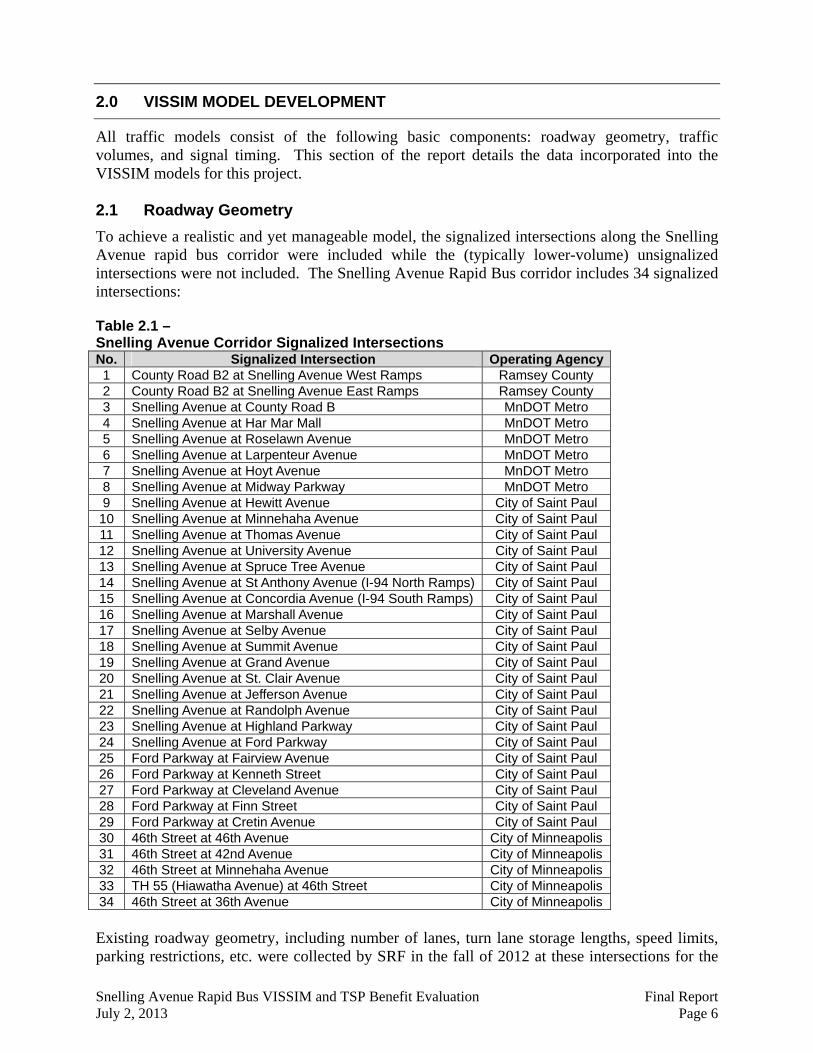
All traffic models consist of the following basic components: roadway geometry, traffic volumes, and signal timing. This section of the report details the data incorporated into the VISSIM models for this project. 2.1 Roadway Geometry
To achieve a realistic and yet manageable model, the signalized intersections along the Snelling Avenue rapid bus corridor were included while the (typically lower-volume) unsignalized intersections were not included. The Snelling Avenue Rapid Bus corridor includes 34 signalized intersections: Table 2.1 – Snelling Avenue Corridor Signalized Intersections No. Signalized Intersection Operating Agency 1 County Road B2 at Snelling Avenue West Ramps Ramsey County 2 County Road B2 at Snelling Avenue East Ramps Ramsey County 3 Snelling Avenue at County Road B MnDOT Metro 4 Snelling Avenue at Har Mar Mall MnDOT Metro 5 Snelling Avenue at Roselawn Avenue MnDOT Metro 6 Snelling Avenue at Larpenteur Avenue MnDOT Metro 7 Snelling Avenue at Hoyt Avenue MnDOT Metro 8 Snelling Avenue at Midway Parkway MnDOT Metro 9 Snelling Avenue at Hewitt Avenue City of Saint Paul 10 Snelling Avenue at Minnehaha Avenue City of Saint Paul 11 Snelling Avenue at Thomas Avenue City of Saint Paul 12 Snelling Avenue at University Avenue City of Saint Paul 13 Snelling Avenue at Spruce Tree Avenue City of Saint Paul 14 Snelling Avenue at St Anthony Avenue (I-94 North Ramps) City of Saint Paul 15 Snelling Avenue at Concordia Avenue (I-94 South Ramps) City of Saint Paul 16 Snelling Avenue at Marshall Avenue City of Saint Paul 17 Snelling Avenue at Selby Avenue City of Saint Paul 18 Snelling Avenue at Summit Avenue City of Saint Paul 19 Snelling Avenue at Grand Avenue City of Saint Paul 20 Snelling Avenue at St. Clair Avenue City of Saint Paul 21 Snelling Avenue at Jefferson Avenue City of Saint Paul 22 Snelling Avenue at Randolph Avenue City of Saint Paul 23 Snelling Avenue at Highland Parkway City of Saint Paul 24 Snelling Avenue at Ford Parkway City of Saint Paul 25 Ford Parkway at Fairview Avenue City of Saint Paul 26 Ford Parkway at Kenneth Street City of Saint Paul 27 Ford Parkway at Cleveland Avenue City of Saint Paul 28 Ford Parkway at Finn Street City of Saint Paul 29 Ford Parkway at Cretin Avenue City of Saint Paul 30 46th Street at 46th Avenue City of Minneapolis 31 46th Street at 42nd Avenue City of Minneapolis 32 46th Street at Minnehaha Avenue City of Minneapolis 33 TH 55 (Hiawatha Avenue) at 46th Street City of Minneapolis 34 46th Street at 36th Avenue City of Minneapolis Existing roadway geometry, including number of lanes, turn lane storage lengths, speed limits, parking restrictions, etc. were collected by SRF in the fall of 2012 at these intersections for the

Snelling Avenue Rapid Bus VISSIM and TSP Benefit Evaluation Final Report July 2, 2013 Page 7
purpose of building the VISSIM model. As a part of the data collection, traffic patterns were observed to help calibrate the baseline scenario model. Based on stakeholder input, several roadway improvement projects were identified as likely to occur within a short-term (one- to three-year) time frame. These improvements were incorporated into the model to represent expected conditions when rapid service begins:
Reconstruction of Ford Parkway between Snelling Avenue and Howell Street Reconstruction of the 46th Street/Minnehaha Avenue intersection
2.2 Traffic Volumes
Two-hour a.m. and two-hour p.m. peak period turning movement counts were conducted by SRF on typical (non-holiday) weekdays at each of the signalized intersections along the corridor in 2012. Although rapid bus service is not anticipated to begin until 2015, the Snelling Avenue corridor extends through a fully developed portion of the Twin Cities metro area where volumes are not expected to change dramatically between 2012 and 2015. Background growth in traffic volumes between 2012 and 2015 was therefore not included in the model. For the intersections between (and including) County Road B and Selby Avenue, stakeholders commented that the volumes collected by SRF in 2012 did not appear to be high enough to replicate the over-saturated conditions often observed in the field. As part of the calibration process, and based on stakeholder input, the turning movement counts used in the model for these 15 intersections were revised. For the intersections from County Road B to Midway Parkway, turning movement count data provided by MnDOT, collected in 2008 for the purpose of developing signal timing plans, was used. For the intersections from Hewitt Avenue to Selby Avenue, count data from the Snelling Avenue Multi-Modal Transportation Plan, collected in 2004-2005, was used. In order to isolate the impacts of rapid bus and transit signal priority, traffic volumes were held constant across of the four scenarios analyzed. For the purpose of calculating person-delay in Section 4 of this report, average automobile occupancy was assumed at 1.28 persons per vehicle, based on the findings of the most recent Metropolitan Council Travel Behavior Inventory.2 2.3 Signal Timing
The Baseline model assumed a mixture of existing and anticipated near-term future signal timing plans. Existing signal timing was assumed at the intersections operated by Ramsey County and MnDOT Metro.
2 Details are available at http://www.dot.state.mn.us/planning/program/benefitcost.html.

Snelling Avenue Rapid Bus VISSIM and TSP Benefit Evaluation Final Report July 2, 2013 Page 8
SRF has developed new timing plans for the City of Saint Paul intersections along the corridor as part of a project currently in progress with the City. These timing plans, anticipated to be implemented in mid-2013, were assumed in the Baseline model. The City of Minneapolis is in the midst of a multi-year project to upgrade communication to each of its 800-plus traffic signals. As part of this process, the City is working to develop updated signal timing plans for each intersection. As of December 2012, timing plan development for the 46th Street intersections was partially complete. Cycle lengths had been chosen, but splits and offsets had not yet been determined. For the Baseline model, a set of splits and offsets were developed based on the 2012 count data and proposed cycle lengths for the intersections along 46th Street at 46th Avenue, 42nd Avenue, and Minnehaha Avenue. The timing plans were developed with the goal of maximizing two-way progression along 46th Street. For the Hiawatha Avenue/46th Street and 46th Street/36th Avenue intersections, the traffic signals were assumed to operate in actuated-uncoordinated, or “Free” mode. Max green times were assumed from existing signal timing data provided by the City. Detailed discussion on how the Baseline model was altered to incorporated transit signal priority is provided in Section 4.2. 2.4 Rapid Bus Station Configuration and Operation
The station configurations for the Rapid Bus Alpha scenario were based on information provided by Metro Transit. The Snelling Avenue Multi-Modal Transportation Plan was used as an additional reference. This plan included high-level conceptual typical station platform designs for stations at Snelling/Como, Snelling/Hewitt, Snelling/Minnehaha, and Snelling/University. The assumptions for rapid bus operation at each station provided by Metro Transit were based on preliminary site review and stakeholder input. The most important consideration, in terms of the potential impact to traffic operations, is the anticipated dwell time of the bus at each station. Average dwell times by station were estimated based on ridership forecasts developed during the ATCS. Based on these forecasts and an average per-person boarding time factor, each directional station was placed in a short, medium, or long dwell time category, with dwell times of 7, 14 and 21 seconds, respectively. A summary of the assumed preliminary station configuration data is provided in Tables 2.2a and 2.2b for the southbound and northbound directions, respectively.

Snelling Avenue Rapid Bus VISSIM and TSP Benefit Evaluation Final Report July 2, 2013 Page 9
Table 2.2a – Northbound Rapid Bus Stations – Preliminary Configuration
No. Rapid Bus Station Stop Location Platform
Type
Station Length
(ft.)
Dwell Time (sec.)
1 46th Street Station n/a n/a n/a 21 2 Minnehaha Nearside Curbside 80 7 3 45th/46th Nearside 46th Curbside 80 7 (see note 3) 4 Woodlawn Midblock Bumpout 80 14 5 Finn Farside Bumpout 80 14 6 Kenneth Nearside Bumpout 80 7 7 Fairview Farside Bumpout 80 7 8 Highland Farside Bumpout 80 7 9 Randolph Farside Bumpout 80 7 10 St. Clair Farside Bumpout 80 14 11 Grand Farside Bumpout 80 7 12 Hague Farside Bumpout 80 7 13 University Farside Bumpout 80 21 14 Minnehaha Farside Bumpout 80 14 15 Hewitt Farside Bumpout 80 7 16 Como Farside Curbside 80 7 17 Larpenteur Farside Curbside 80 14 18 Roselawn Farside Curbside 80 7 19 County Road B / Har Mar Midblock Curbside 80 7 20 Rosedale Transit Center n/a n/a n/a 21 Table 2.2b – Southbound Rapid Bus Stations – Preliminary Configuration
No. Rapid Bus Station Stop Location Platform TypeStation
Length (ft.) Dwell
Time (sec.)1 Rosedale Transit Center n/a n/a n/a 21 2 County Road B / Har Mar Farside Cty. Rd. B Curbside 80 7 3 Roselawn Farside Curbside 80 7 4 Larpenteur Farside Curbside 80 14 5 Como Farside Curbside 80 7 6 Hewitt Farside Bumpout 80 7 7 Minnehaha Farside Bumpout 60 14 8 University Farside Curbside 80 21 9 Hague Farside Bumpout 80 7 10 Grand Farside Bumpout 80 7 11 St. Clair Nearside Bumpout 80 14 12 Randolph Farside Curbside 80 7 13 Highland Farside Bumpout 80 7 14 Fairview Farside Bumpout 80 7 15 Kenneth Nearside Curbside 60 7 16 Finn Farside Bumpout 80 14 17 Woodlawn Nearside Bumpout 80 14 18 45th/46th Nearside 45th Curbside 80 7 19 Minnehaha Farside Curbside 80 7 20 46th Street Station n/a n/a n/a 21
3 Dwell time was modeled as 20 seconds in VISSIM. This error was discovered after modeling had been completed
and reported. Since no discernible traffic impact was observed at this station, the error was not corrected.

Snelling Avenue Rapid Bus VISSIM and TSP Benefit Evaluation Final Report July 2, 2013 Page 10
2.5 Rapid Bus Characteristics
Inputs needed to model the rapid buses included bus length, schedule, and anticipated ridership. Information on each of these inputs was provided by Metro Transit. Rapid buses are assumed to be 40 feet in length. Rapid buses are proposed to operate on 10-minute headways, yielding a total of 6 rapid buses per hour in each direction. Assumed occupancy during the a.m. and p.m. peak hours ranges from 5 to 42, with higher volumes near the middle (“max load”) point on the line, and lower volumes near the ends. 2.6 MOE Reporting
VISSIM is a microscopic traffic modeling tool. Like all microscopic modeling tools, a random number “seed” is used for each model run. This seed is used to determine when vehicles enter the network. The measures of effectiveness (MOEs) reported by the model, such as delay, travel time, etc. vary across successive runs. The amount of variability tends to increase as traffic becomes more congested and reaches saturation. To account for this variability, MOEs from multiple runs of each modeling scenario were completed. Average MOEs from across the multiple runs are reported. For the a.m. peak period, five model runs were completed for each scenario. For the p.m. peak period, it was found that significant variability still remained after averaging across five runs, and that 20 runs were needed to sufficiently control the variability. 2.7 Light Rail Transit Lines
The proposed Snelling Avenue rapid bus line crosses two LRT lines, one existing and one under construction. Two different methods were used to account for these two lines. For the existing Blue Line (Hiawatha), the City of Minneapolis is currently wrapping up a project to install new advanced traffic signal controllers at the signalized intersections along Hiawatha Avenue. This project includes the intersection at 46th Street, where the Snelling Avenue rapid bus line crosses the LRT line. The new controllers, manufactured by Northwest Signal, are intended to improve the traffic operational performance at the intersections by responding more equitably to the preempt events caused by passing Blue Line trains. The controllers will track the amount of time each movement has been waiting at an intersection. After the preempt event is over, the controller will serve the movement that has been waiting the longest first, rather than a preset phase. It is not currently possible to model the Northwest Signal controller in VISSIM. Based on a past history of poor traffic operations at the Hiawatha Avenue/46th Street intersection and on stakeholder comments received at the kickoff meeting, the decision was made to assume actuated-coordinated (Free) operation of the traffic signal, ignoring the impact of LRT vehicles at this intersection, and to assume that TSP for rapid buses would not be appropriate for this intersection. In short, this intersection would only be included in the model for the purpose of providing continuity along the corridor and estimating rapid bus running time. Unlike the Blue Line, which preempts traffic signals in a manner similar to the operation of a freight train, the Green Line (Central Corridor) will instead request priority in a manner identical to the process proposed for rapid buses in this study. Using vehicle size, dwell time, and scheduling information from the Snelling Avenue Multi-Modal Transportation Plan, along with
Snelling Avenue Rapid Bus VISSIM and TSP Benefit Evaluation Final Report July 2, 2013 Page 11
the functionality available through the ASC/3 software-in-the-loop controller, the Green Line, anticipated to begin service in 2014, was included in the VISSIM models. Based on the current TSP algorithm used in the ASC/3 controller, only one approach is allowed to request priority at a time. For the purpose of this study, no conditions or restrictions on priority requests were applied to either Snelling rapid buses or Green Line LRT vehicles. Calls received were processed first-come, first-served. In practice, the functionality built into the equipment used to place the TSP calls (i.e. EMTRAC, GTT, or others) may be used to give higher priority to the LRT calls than to the rapid bus calls.
Snelling Avenue Rapid Bus VISSIM and TSP Benefit Evaluation Final Report July 2, 2013 Page 12
3.0 EVALUATION OF RAPID BUS STATION TRAFFIC IMPACT
Twenty stations are proposed along the length of the Snelling Avenue rapid bus corridor, spaced at roughly one-half mile intervals. This section of the report takes a detailed look at the traffic operations near each of these stations with and without rapid bus in place to assess the impact of the preliminary station configurations. To assess how traffic is operating in the vicinity of each station area, traffic operations for the a.m. and p.m. peak hours at each of the study intersections were analyzed in VISSIM. As noted previously, three scenarios were analyzed to better understand the impact of station location and configuration. In general, where traffic operations in the Rapid Bus Alpha scenario declined noticeably from the Baseline scenario, a recommendation was made to adjust either the location or the configuration of the nearby station(s). Operations with the new station locations/configurations in place were analyzed in the Rapid Bus Beta scenario. A melded Rapid Bus Refined scenario was developed at the end of this process that included some station configurations from the Alpha scenario and some from the Beta scenario. This Rapid Bus Refined scenario is intended to represent Metro Transit’s preferred station configuration, based not only on the results of the modeling from the Alpha and Beta scenarios, but also on project goals and other constraints. The results of this study will be used to inform stakeholder discussions about final station locations and configurations. Final location decisions will be made in cooperation with stakeholders based on this information and other factors. This Rapid Bus Refined scenario forms the baseline for analysis of TSP impact in the next section of this report. 3.1 Baseline vs. Alpha Analysis – Average Delay per Vehicle
Several measures of effectiveness (MOEs) were used to gauge the impact of the added Rapid Bus operations. The first MOE used was average delay per vehicle. This MOE was computed for each approach and each intersection in each of the three scenarios. Changes in average delay per vehicle less than around two seconds were observed to occur between successive runs of the same model, and were therefore considered insignificant. Table 3.1 summarizes the change in intersection delay and arterial travel time between the Baseline and Rapid Bus Alpha Scenarios. As shown in the table, impact to traffic operations due to Rapid Bus, based on this MOE, is minimal during the a.m. peak hour, with no intersections experiencing an increase in average delay per vehicle of over two seconds. During the p.m. peak hour, seven intersections experience an increase in average delay per vehicle of between two and five seconds. The impact is concentrated on Snelling Avenue in the vicinity of the Interstate 94 interchange.
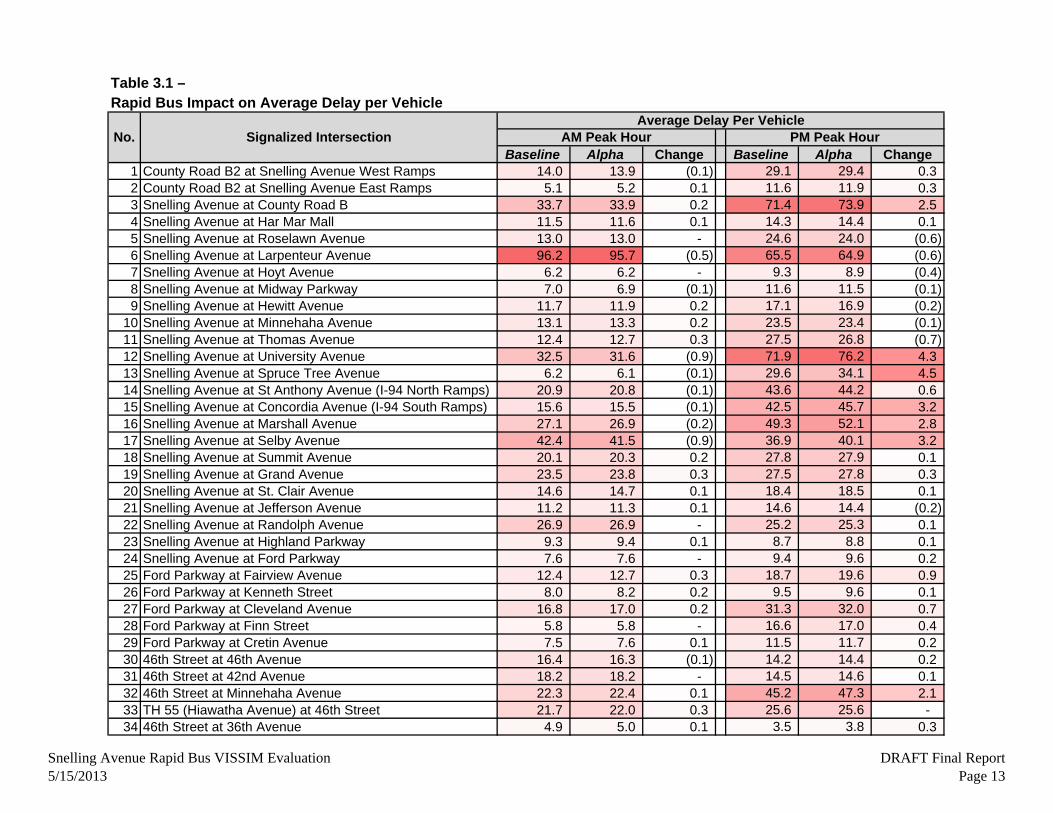
Table 3.1 –Rapid Bus Impact on Average Delay per Vehicle
Baseline Alpha Change Baseline Alpha Change1 County Road B2 at Snelling Avenue West Ramps 14.0 13.9 (0.1) 29.1 29.4 0.3 2 County Road B2 at Snelling Avenue East Ramps 5.1 5.2 0.1 11.6 11.9 0.3 3 Snelling Avenue at County Road B 33.7 33.9 0.2 71.4 73.9 2.5 4 Snelling Avenue at Har Mar Mall 11.5 11.6 0.1 14.3 14.4 0.1 5 Snelling Avenue at Roselawn Avenue 13.0 13.0 - 24.6 24.0 (0.6)6 Snelling Avenue at Larpenteur Avenue 96.2 95.7 (0.5) 65.5 64.9 (0.6)7 Snelling Avenue at Hoyt Avenue 6.2 6.2 - 9.3 8.9 (0.4)8 Snelling Avenue at Midway Parkway 7.0 6.9 (0.1) 11.6 11.5 (0.1)9 Snelling Avenue at Hewitt Avenue 11.7 11.9 0.2 17.1 16.9 (0.2)
10 Snelling Avenue at Minnehaha Avenue 13.1 13.3 0.2 23.5 23.4 (0.1)11 Snelling Avenue at Thomas Avenue 12.4 12.7 0.3 27.5 26.8 (0.7)12 Snelling Avenue at University Avenue 32.5 31.6 (0.9) 71.9 76.2 4.3 13 Snelling Avenue at Spruce Tree Avenue 6.2 6.1 (0.1) 29.6 34.1 4.5 14 Snelling Avenue at St Anthony Avenue (I-94 North Ramps) 20.9 20.8 (0.1) 43.6 44.2 0.6 15 Snelling Avenue at Concordia Avenue (I-94 South Ramps) 15.6 15.5 (0.1) 42.5 45.7 3.2 16 Snelling Avenue at Marshall Avenue 27.1 26.9 (0.2) 49.3 52.1 2.8 17 Snelling Avenue at Selby Avenue 42.4 41.5 (0.9) 36.9 40.1 3.2 18 Snelling Avenue at Summit Avenue 20.1 20.3 0.2 27.8 27.9 0.1 19 Snelling Avenue at Grand Avenue 23.5 23.8 0.3 27.5 27.8 0.3 20 Snelling Avenue at St. Clair Avenue 14.6 14.7 0.1 18.4 18.5 0.1 21 Snelling Avenue at Jefferson Avenue 11.2 11.3 0.1 14.6 14.4 (0.2)22 Snelling Avenue at Randolph Avenue 26.9 26.9 - 25.2 25.3 0.1 23 Snelling Avenue at Highland Parkway 9.3 9.4 0.1 8.7 8.8 0.1 24 Snelling Avenue at Ford Parkway 7.6 7.6 - 9.4 9.6 0.2 25 Ford Parkway at Fairview Avenue 12.4 12.7 0.3 18.7 19.6 0.9 26 Ford Parkway at Kenneth Street 8.0 8.2 0.2 9.5 9.6 0.1 27 Ford Parkway at Cleveland Avenue 16.8 17.0 0.2 31.3 32.0 0.7 28 Ford Parkway at Finn Street 5.8 5.8 - 16.6 17.0 0.4 29 Ford Parkway at Cretin Avenue 7.5 7.6 0.1 11.5 11.7 0.2 30 46th Street at 46th Avenue 16.4 16.3 (0.1) 14.2 14.4 0.2 31 46th Street at 42nd Avenue 18.2 18.2 - 14.5 14.6 0.1 32 46th Street at Minnehaha Avenue 22.3 22.4 0.1 45.2 47.3 2.1 33 TH 55 (Hiawatha Avenue) at 46th Street 21.7 22.0 0.3 25.6 25.6 - 34 46th Street at 36th Avenue 4.9 5.0 0.1 3.5 3.8 0.3
AM Peak HourAverage Delay Per Vehicle
PM Peak HourNo. Signalized Intersection
Snelling Avenue Rapid Bus VISSIM Evaluation5/15/2013
DRAFT Final ReportPage 13
Snelling Avenue Rapid Bus VISSIM and TSP Benefit Evaluation Final Report July 2, 2013 Page 14
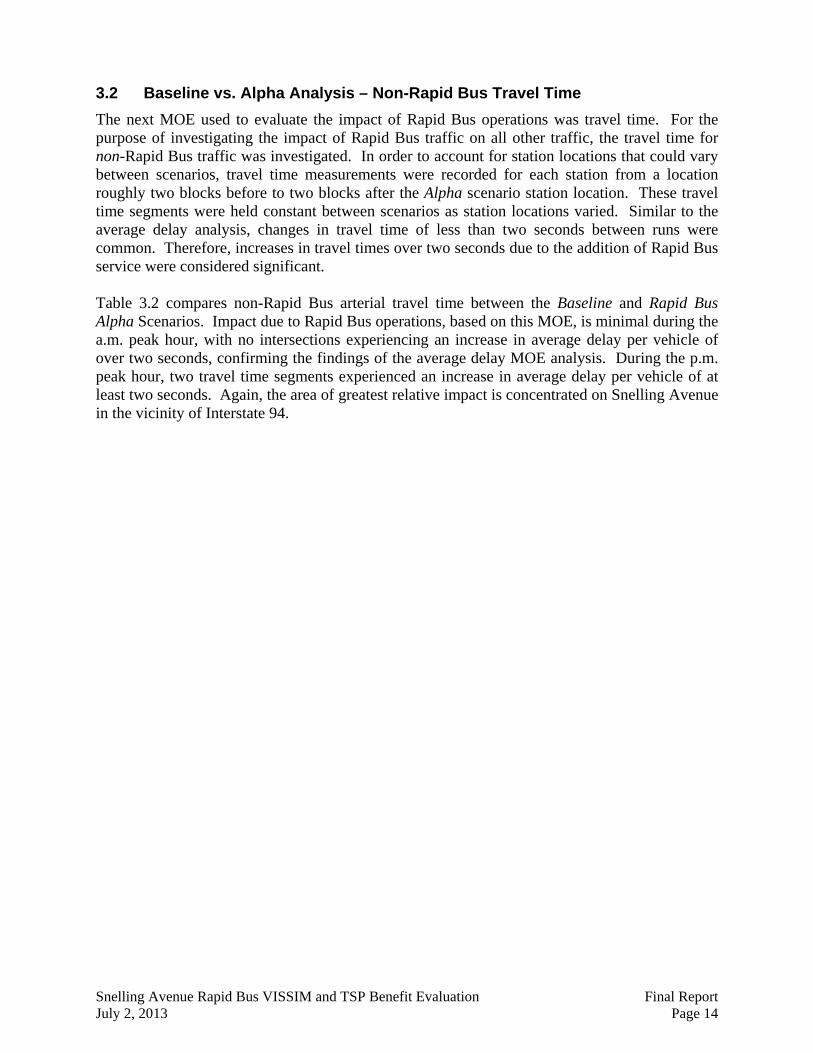
3.2 Baseline vs. Alpha Analysis – Non-Rapid Bus Travel Time
The next MOE used to evaluate the impact of Rapid Bus operations was travel time. For the purpose of investigating the impact of Rapid Bus traffic on all other traffic, the travel time for non-Rapid Bus traffic was investigated. In order to account for station locations that could vary between scenarios, travel time measurements were recorded for each station from a location roughly two blocks before to two blocks after the Alpha scenario station location. These travel time segments were held constant between scenarios as station locations varied. Similar to the average delay analysis, changes in travel time of less than two seconds between runs were common. Therefore, increases in travel times over two seconds due to the addition of Rapid Bus service were considered significant. Table 3.2 compares non-Rapid Bus arterial travel time between the Baseline and Rapid Bus Alpha Scenarios. Impact due to Rapid Bus operations, based on this MOE, is minimal during the a.m. peak hour, with no intersections experiencing an increase in average delay per vehicle of over two seconds, confirming the findings of the average delay MOE analysis. During the p.m. peak hour, two travel time segments experienced an increase in average delay per vehicle of at least two seconds. Again, the area of greatest relative impact is concentrated on Snelling Avenue in the vicinity of Interstate 94.
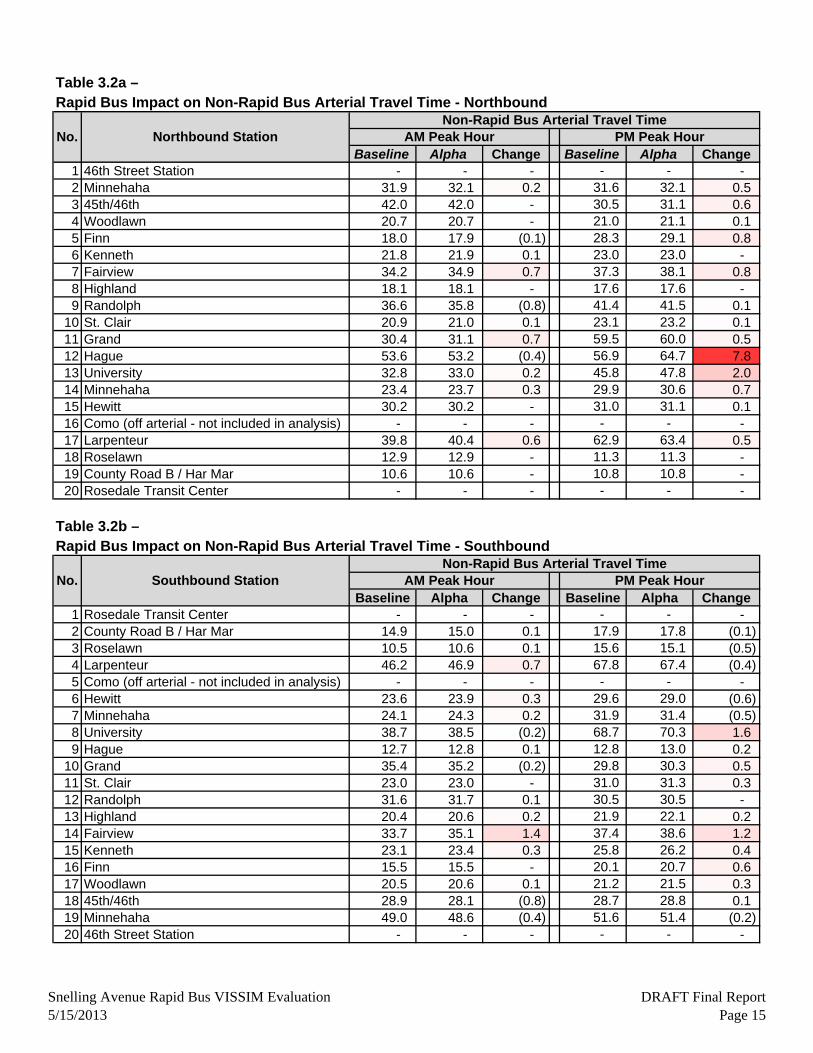
Table 3.2a –Rapid Bus Impact on Non-Rapid Bus Arterial Travel Time - Northbound
Baseline Alpha Change Baseline Alpha Change1 46th Street Station - - - - - - 2 Minnehaha 31.9 32.1 0.2 31.6 32.1 0.5 3 45th/46th 42.0 42.0 - 30.5 31.1 0.6 4 Woodlawn 20.7 20.7 - 21.0 21.1 0.1 5 Finn 18.0 17.9 (0.1) 28.3 29.1 0.8 6 Kenneth 21.8 21.9 0.1 23.0 23.0 - 7 Fairview 34.2 34.9 0.7 37.3 38.1 0.8 8 Highland 18.1 18.1 - 17.6 17.6 - 9 Randolph 36.6 35.8 (0.8) 41.4 41.5 0.1
10 St. Clair 20.9 21.0 0.1 23.1 23.2 0.1 11 Grand 30.4 31.1 0.7 59.5 60.0 0.5 12 Hague 53.6 53.2 (0.4) 56.9 64.7 7.8 13 University 32.8 33.0 0.2 45.8 47.8 2.0 14 Minnehaha 23.4 23.7 0.3 29.9 30.6 0.7 15 Hewitt 30.2 30.2 - 31.0 31.1 0.1 16 Como (off arterial - not included in analysis) - - - - - - 17 Larpenteur 39.8 40.4 0.6 62.9 63.4 0.5 18 Roselawn 12.9 12.9 - 11.3 11.3 - 19 County Road B / Har Mar 10.6 10.6 - 10.8 10.8 - 20 Rosedale Transit Center - - - - - -
Table 3.2b –Rapid Bus Impact on Non-Rapid Bus Arterial Travel Time - Southbound
Baseline Alpha Change Baseline Alpha Change1 Rosedale Transit Center - - - - - - 2 County Road B / Har Mar 14.9 15.0 0.1 17.9 17.8 (0.1)3 Roselawn 10.5 10.6 0.1 15.6 15.1 (0.5)4 Larpenteur 46.2 46.9 0.7 67.8 67.4 (0.4)5 Como (off arterial - not included in analysis) - - - - - - 6 Hewitt 23.6 23.9 0.3 29.6 29.0 (0.6)7 Minnehaha 24.1 24.3 0.2 31.9 31.4 (0.5)8 University 38.7 38.5 (0.2) 68.7 70.3 1.6 9 Hague 12.7 12.8 0.1 12.8 13.0 0.2
10 Grand 35.4 35.2 (0.2) 29.8 30.3 0.5 11 St. Clair 23.0 23.0 - 31.0 31.3 0.3 12 Randolph 31.6 31.7 0.1 30.5 30.5 - 13 Highland 20.4 20.6 0.2 21.9 22.1 0.2 14 Fairview 33.7 35.1 1.4 37.4 38.6 1.2 15 Kenneth 23.1 23.4 0.3 25.8 26.2 0.4 16 Finn 15.5 15.5 - 20.1 20.7 0.6 17 Woodlawn 20.5 20.6 0.1 21.2 21.5 0.3 18 45th/46th 28.9 28.1 (0.8) 28.7 28.8 0.1 19 Minnehaha 49.0 48.6 (0.4) 51.6 51.4 (0.2)20 46th Street Station - - - - - -
No. Southbound Station AM Peak Hour PM Peak HourNon-Rapid Bus Arterial Travel Time
No. Northbound Station AM Peak Hour PM Peak HourNon-Rapid Bus Arterial Travel Time
Snelling Avenue Rapid Bus VISSIM Evaluation5/15/2013
DRAFT Final ReportPage 15

Snelling Avenue Rapid Bus VISSIM and TSP Benefit Evaluation Final Report July 2, 2013 Page 16
3.3 Conclusions from Baseline vs. Alpha Analysis
Based on the MOE tables above the following conclusions were drawn from the VISSIM analysis: For the a.m. peak hour:
Traffic volumes are relatively low. All intersections are under capacity. There is no practical difference in the results between the Baseline and Alpha scenarios,
in terms of either Average Delay per Vehicle or Non-Rapid Bus Travel Times. This means that the addition of Rapid Buses would be expected to have very little impact on traffic flow in the a.m. peak hour.
In quantitative terms, the maximum amount of added delay to other traffic due to Rapid Buses observed at any intersection in the model is less than two seconds per vehicle.
For the p.m. peak hour:
The segment of Snelling between (and including) University and Selby is at/over capacity. As previously discussed in section 2.6, this causes significant variation in the model from run to run. To help control for this variability, 20 model runs were averaged, as opposed to 5 runs for the a.m. peak hour. MOEs were averaged across all runs.
The average delay and travel time MOE results suggest that adding Rapid Buses will only result in a noticeable traffic flow impact at two station locations: Northbound at University and Northbound at Hague Avenue. The impact at these two stations is approximately 5-12 seconds of increased delay per vehicle due to the Rapid Buses stopping in a travel lane.
There also appears to be slight impact due to the Southbound station at Hague Avenue. Though the southbound results are not as conclusive as northbound, the impact at this station for southbound traffic is approximately 3-4 seconds per vehicle judging from the added delay at Marshall.
At all other stations, the impact due to Rapid Buses is at or below two seconds per vehicle.
Based on these conclusions, SRF recommended that alternative station locations/configurations be examined for the Northbound University Avenue and Northbound Hague Avenue stations, and, if possible, the Southbound Hague Avenue station. To help improve traffic operations, SRF recommended that stations either be moved farther away from the congested segment of Snelling Avenue (away from Interstate 94), or out of the flow of traffic (convert from a bumpout station to a non-bumpout station). In order to assess traffic impacts of multiple station location alternatives that meet project goals, Metro Transit directed SRF to investigate the effects of the following changes to these three stations:
Northbound University Avenue: move the station from farside University Avenue to nearside Spruce Tree Avenue and eliminate bumpout. The station would be located in the right turn lane.
Northbound Hague Avenue: move the station one block north from farside Hague Avenue to farside Selby.

Snelling Avenue Rapid Bus VISSIM and TSP Benefit Evaluation Final Report July 2, 2013 Page 17
Southbound Hague Avenue: move the station two blocks north from farside Hague to nearside Dayton.
The remainder of Section 3 of this report looks at these three stations in detail to assess the station location and configuration options studied. Section 5 of this report provides a station-by-station breakdown of station configuration assumptions and the resulting VISSIM MOEs for each scenario. 3.4 Alpha vs. Beta Analysis – University Avenue Station
As noted in the previous section of the report, based on a review of overall network traffic operations with and without Rapid Bus service, the University Avenue Northbound station was identified as one of three stations that had the potential for causing traffic flow disruption upon the introduction of Rapid Bus service. Table 3.3 provides details on the station configuration analyzed in the initial Rapid Bus VISSIM scenario, Rapid Bus Alpha, and also on the proposed changes to the station configuration to be analyzed in the Rapid Bus Beta scenario. Figures 3.1 and 3.2 below illustrate the proposed station configuration alternatives. Table 3.3 – Northbound University Avenue Station Alternatives Studied
Scenario
Intersection Location Platform Type
Station Length (ft.)
Dwell Time (sec.)
Rapid Bus Alpha
University Avenue Farside Bumpout 80 21
Rapid Bus Beta
Spruce Tree Lane (one block south)
Nearside Curbside 80 21

Snelling Avenue Rapid Bus VISSIM and TSP Benefit Evaluation Final Report July 2, 2013 Page 18
Figure 3.1 – University Avenue Northbound – Rapid Bus Alpha Scenario Station Configuration
(Graphic from Snelling Multi-Modal Transportation Plan)
Snelling Avenue Rapid Bus VISSIM and TSP Benefit Evaluation Final Report July 2, 2013 Page 19
Figure 3.2 – University Avenue Northbound – Rapid Bus Beta Scenario Station Configuration
VISSIM modeling of the Beta scenario with the revised station configuration was completed to assess the impact of the revised station location and configuration. Tables 3.4 and 3.5 below illustrate the traffic impacts of the station configuration alternatives, compared to the Baseline scenario. Average delay per vehicle is summarized in Table 3.4, while non-Rapid Bus travel time is covered in Table 3.5. From the results of the Baseline vs. Alpha analysis discussed earlier, no traffic impact due to Rapid Bus service is expected during the a.m. peak period. Detailed results available in the appendix confirm that the station locations and configurations studied in the Beta scenario do not impact this conclusion. Tables 3.4 and 3.5 focus on the traffic impacts during the p.m. peak hour.

Snelling Avenue Rapid Bus VISSIM and TSP Benefit Evaluation Final Report July 2, 2013 Page 20
Table 3.4 – University Avenue Northbound Station Alternatives – Rapid Bus Impact on Average Delay per Vehicle
Signalized Intersection
Approach PM Peak Hour Average Delay Per Vehicle
Baseline Alpha Beta
University Avenue
Eastbound 112.0 121.9 110.3 Westbound 82.4 82.4 86.0 Northbound 28.8 30.7 28.8 Southbound 73.6 78.2 80.5
Total 71.9 76.2 74.3
Spruce Tree Avenue
Eastbound 26.9 25.1 26.8 Westbound 77.0 70.6 71.7 Northbound 35.5 48.4 35.4 Southbound 14.6 14.4 14.7
Total 29.6 34.1 29.1 Table 3.5 – University Avenue Northbound Station Alternatives – Rapid Bus Impact on Non-Rapid Bus Arterial Travel Time
Rapid Bus Station Direction PM Peak Hour Average Travel Times
Baseline Alpha Beta
University Avenue Northbound 79.9 89.4 78.2 Southbound 68.7 70.3 71.4
As shown in Tables 3.4 and 3.5, the Beta scenario of the Northbound University Rapid Bus station results in an improvement in traffic flow compared with the Alpha scenario for both the average delay and travel time MOEs. Specifically, average delay improves by 1.9 seconds at University Avenue and by 5.0 seconds at Spruce Tree Avenue. Travel time for the approximately four-block segment of Snelling Avenue in the vicinity of the station improves by 11.2 seconds in the northbound direction. Compared with the Baseline scenario, the Beta scenario results in similar traffic flow. Average delay at both University and Spruce Tree is within two seconds of the Baseline scenario, while travel times are within three seconds of the Baseline scenario. 3.5 Alpha vs. Beta Analysis – Hague Avenue Station
The network-wide analysis section of the report identified the Hague Avenue station as the only other station with potential to noticeably impact traffic after the addition of Rapid Bus service. Based on the network-wide analysis, the recommended mitigation measure to improve traffic flow in the vicinity of the Hague Avenue station pair was to either move them south away from the congested portion of Snelling Avenue, or to reconfigure them as non-bumpout stations. However, moving the stations farther south (to Laurel Avenue or beyond) would result in unacceptably wide station spacing to the north, toward the University Avenue station (0.8 mile or greater) and unacceptably narrow spacing to the south toward the Grand Avenue station (0.3 mile or less). Reconfiguring to non-bumpout stations would result in additional delay to transit, reducing the effectiveness of Rapid Bus and working against the project goal of providing faster Rapid Bus service.

Snelling Avenue Rapid Bus VISSIM and TSP Benefit Evaluation Final Report July 2, 2013 Page 21
Given the noticeable traffic impact of the Hague locations and constraints to the south, station locations to the north were examined in the interest of alternatives comparison. Tables 3.6a and 3.6b provide details on the station configurations analyzed in the Rapid Bus Alpha and Rapid Bus Beta scenarios. Figures 3.3 and 3.4 below illustrate the configuration alternatives. Table 3.6a – Hague Avenue Northbound Station Alternatives Studied
Scenario
Intersection Location
Platform Type
Station Length
(ft.)
Dwell Time (sec.)
Rapid Bus Alpha
Hague Avenue Farside Bumpout 80 7
Rapid Bus Beta
Selby Avenue (one block north)
Farside Bumpout 80 7
Table 3.6b – Hague Avenue Southbound Station Alternatives Studied
Scenario
Intersection Location
Platform Type
Station Length
(ft.)
Dwell Time (sec.)
Rapid Bus Alpha
Hague Avenue Farside Bumpout 80 7
Rapid Bus Beta
Dayton Avenue (two blocks north)
Nearside Bumpout 80 7
Figure 3.3 – Hague Avenue – Rapid Bus Alpha Scenario Station Configurations
Rapid Bus Platforms
Snelling Avenue Rapid Bus VISSIM and TSP Benefit Evaluation Final Report July 2, 2013 Page 22
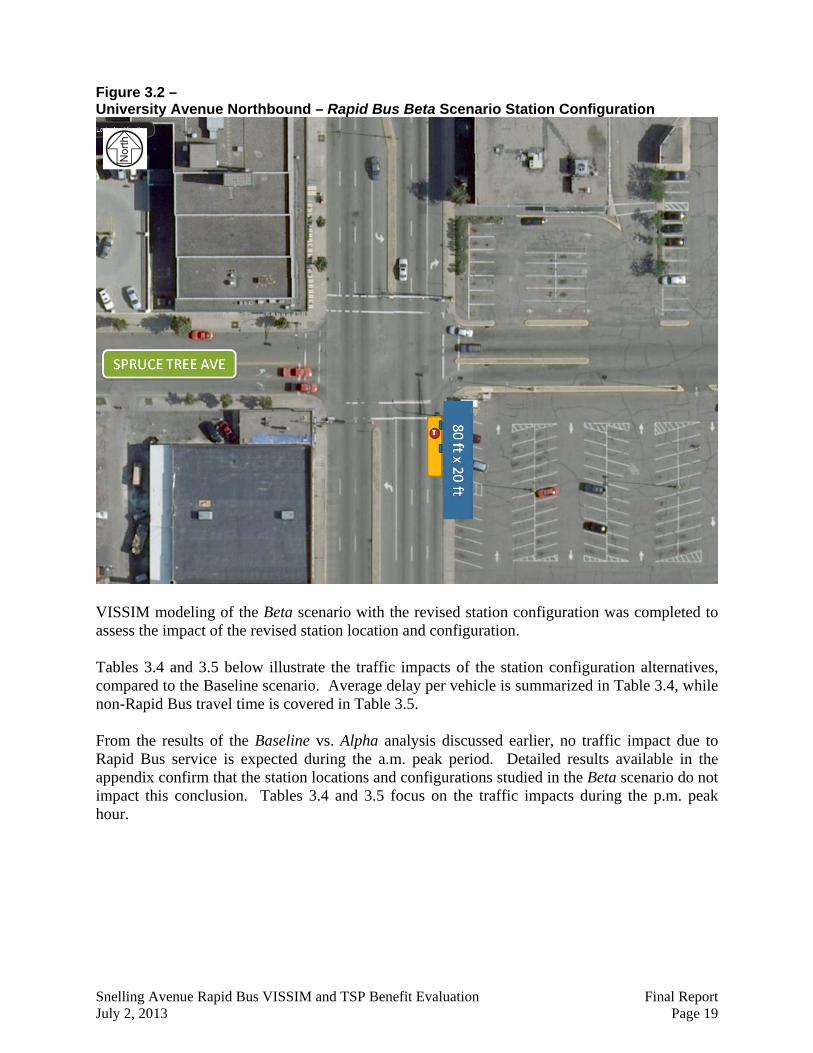
Figure 3.4 – Hague Avenue Northbound – Rapid Bus Beta Scenario Station Configuration

Snelling Avenue Rapid Bus VISSIM and TSP Benefit Evaluation Final Report July 2, 2013 Page 23
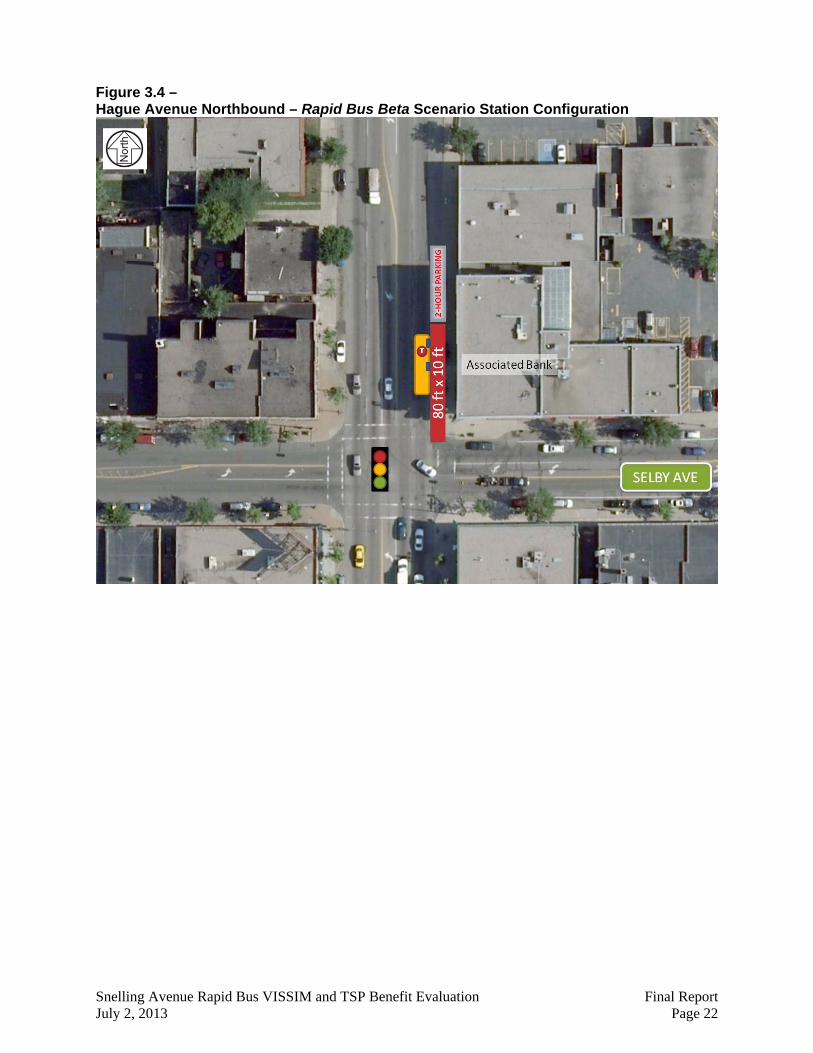
Figure 3.5 – Hague Avenue Southbound – Rapid Bus Beta Scenario Station Configuration
Tables 3.7 and 3.8 below illustrate the traffic impacts of the station configuration alternatives, compared to the Baseline scenario. Average delay per vehicle is summarized in Table 3.7 and non-Rapid Bus travel time is covered in Table 3.8. Table 3.7 – Hague Avenue Station Alternatives – Rapid Bus Impact on Average Delay per Vehicle
Signalized Intersection
Approach PM Peak Hour Average Delay Per Vehicle
Baseline Alpha Beta
Marshall Avenue
Eastbound 41.2 43.0 41.4 Westbound 38.2 38.3 38.3 Northbound 44.8 46.0 44.4 Southbound 57.3 62.1 60.8
Total 49.3 52.1 50.8
Selby Avenue
Eastbound 34.0 34.4 34.0 Westbound 31.5 32.2 31.4 Northbound 58.7 68.3 76.2 Southbound 26.7 27.5 28.3
Total 36.9 40.1 42.5

Snelling Avenue Rapid Bus VISSIM and TSP Benefit Evaluation Final Report July 2, 2013 Page 24
Table 3.8 – Hague Avenue Station Alternatives – Rapid Bus Impact on Non-Rapid Bus Arterial Travel Time
Rapid Bus Station Direction PM Peak Hour Average Travel Times
Baseline Alpha Beta
Hague Avenue Northbound 72.8 79.7 84.8 Southbound 39.3 39.7 40.3
As shown in Table 3.4, the Beta scenario of the Northbound Hague Rapid Bus station (relocated to Selby) results in a slight decline in traffic efficiency at Marshall Avenue, with slight improvement at Selby, compared with the Alpha scenario. Specifically, average delay shrinks by 1.3 seconds at Marshall and grows by 2.4 seconds at Selby Avenue. This result is consistent with the relocation of the Hague Avenue stations away from Selby Avenue northward toward Marshall Avenue. Table 3.5 shows that non-Rapid Bus arterial travel times increased in both the northbound and southbound directions for the roughly four-block segment of Snelling Avenue in the vicinity of the Hague Avenue station. Northbound travel time increased by 5.1 seconds while Southbound increased by 0.6 seconds. The conclusion from these results is that the location of the Hague Avenue stations does have a slight impact of traffic efficiency. Shifting the northbound station one block north appears to have a bigger impact on traffic operations (around 5 seconds per vehicle of added delay, on average) than does shifting the southbound station two blocks north (2 seconds of added delay). 3.6 Rapid Bus Refined Scenario
Based on the results of the Alpha and Beta scenarios, and taking into account external constraints and project goals, Metro Transit established a “chosen” scenario to be used for the TSP analysis discussed in the next section of this report. The Rapid Bus Refined scenario is Metro Transit’s desired scenario to use for the purposes of testing the potential benefit of TSP. In particular, At University Avenue, Metro Transit chose to keep the Alpha northbound station location, rather than the Beta location that resulted in improved traffic flow metrics. Similarly, the Rapid Bus Refined scenario incorporates the Beta location for both the northbound and southbound Hague Avenue stations. In summary, the Rapid Bus Refined scenario should not be considered a “preferred” scenario from a purely traffic operations perspective, but rather a chosen baseline scenario for the purposes of assessing potential TSP benefit. As decisions are made regarding the placement of the University and Hague Avenue stations, sections 3.2 and 3.3 of this report should be used as reference to understand the pros and cons of each from a traffic flow perspective.
Snelling Avenue Rapid Bus VISSIM and TSP Benefit Evaluation Final Report July 2, 2013 Page 25
4.0 ASSESSMENT OF POTENTIAL TSP BENEFIT
The second goal of this project was to determine the potential benefit of transit signal priority at the signalized intersections along the corridor. The determination of potential benefit was broken into a three-step process. The first step was to analyze the Baseline scenario signal timing plans to determine where additional green time could be taken from conflicting phases during a TSP call to increase the amount of green time for the TSP phase. This process will be referred to as a “slack time analysis.” The next step was to develop a practice for the maximum amount of green time that could realistically be taken from conflicting phases, based on traffic operations and driver expectancy considerations, and apply this practice to develop the settings to input into the ASC/3 software-in-the-loop controller used in the VISSIM models. The final step was to run the VISSIM model with the TSP-enabled timing plans in place. By analyzing the difference in MOEs between the Rapid Bus Refined and Rapid Bus Refined with TSP scenarios, conclusions were be drawn as to the potential benefit of TSP at each of the signalized intersections along the corridor. This section of the report details this process and resulting findings.
4.1 TSP Slack Time Analysis
The first step in determining where TSP may be of benefit along the Snelling Avenue rapid bus corridor is to look at where the TSP signal phase(s) would be able to take time from conflicting phase(s). For the Snelling Avenue rapid bus corridor, the TSP phases are generally the mainline through phases, while the conflicting phases are typically the mainline left turn phases as well as the cross street through and left turn phases. The amount of time available to reallocate from conflicting phases is equal to the difference between the actual green time, or split, and the minimum time for that phase. In simple terms, the minimum time for a phase is the greater of either the:
Minimum Green + Yellow + All Red times, or the Walk + Flashing Don’t Walk + Yellow + All Red times for that phase.
In general, the intersections with the most slack time on conflicting phases have the greatest potential for TSP benefit. However, a slack time analysis is only a preliminary gauge of the potential benefit of TSP. It does not take into account the level of traffic congestion that may be present at intersections. To fully gauge the potential benefit of TSP therefore, an understanding of both the availability of slack time and the availability to transfer green time from non-TSP phases to TSP phases is necessary. The slack time analysis was completed for the a.m. and p.m. peak hours for the signalized intersections on the Snelling Avenue rapid bus corridor. Table 4.1, below, provides a summary of the slack time analysis. Details of the analysis are available in the appendix.

Table 4.1Slack Time Analysis Summary
No. Intersection
AM TSP
Slack Time
(1)
PM TSP
Slack Time
(1)
Overall TSP
Potential (2) Notes
1 Snelling Ave & B2 West Ramps 21% 61% Med
2 Snelling Ave & B2 East Ramps 48% 78% High
3 Snelling Ave & Cty Rd B 11% 19% Med
4 Snelling Ave & Har Mar 6% 14% Med
5 Snelling Ave & Roselawn 2% 0% Low
6 Snelling Ave & Larpenteur 18% 32% Med
7 Snelling Ave & Hoyt 6% 2% Low
8 Snelling Ave & Midway 6% 2% Low
9 Snelling Ave & Hewitt Ave 0% 0% Low
10 Snelling Ave & Minnehaha Ave 1% 30% Med
11 Snelling Ave & Thomas Ave 0% 14% Low
12 Snelling Ave & University Ave 8% 24% Med Consider CCLRT impacts (3)
13 Snelling Ave & Spruce Tree Ave 2% 33% Med
14 Snelling Ave & St Anthony Ave 72% 95% High benefit primarily for SB
15 Snelling Ave & Concordia Ave 25% 66% Med benefit primarily for NB
16 Snelling Ave & Marshall Ave 2% 3% Low
17 Snelling Ave & Selby Ave 72% 81% High benefit primarily for NB
18 Snelling Ave & Summit Ave 20% 41% Med
19 Snelling Ave & Grand Ave 15% 33% Med
20 Snelling Ave & St Clair Ave 25% 45% Med
21 Snelling Ave & Jefferson Ave 11% 4% Low
22 Snelling Ave & Randolph Ave 10% 34% Med
23 Snelling Ave & Highland Pkwy 0% 0% Low
24 Snelling Ave & Ford Pkwy 5% 5% Low
25 Ford Pkwy & Fairview Ave 38% 38% Med
26 Ford Pkwy & Kenneth Ave 23% 24% Med
27 Ford Pkwy & Cleveland Ave 12% 37% Med
28 Ford Pkwy & Finn Ave 6% 41% Med benefit primarily for EB
29 Ford Pkwy & Cretin Ave 14% 4% Low benefit primarily for WB
30 46th & 46th 22% 31% Med
31 46th & 42nd 30% 31% Med
32 46th & Minnehaha 67% 116% High
33 Hiawatha & 46th 134% 134% High Avoid TSP ‐ LRT impacts (4)
34 46th & 36th 71% 71% High
Notes:
(3) Central Corridor LRT will use TSP on University Avenue. See discussion in Section 2.5.
(1) The percentage reported for "TSP Slack Time" reflects the average amount of slack time available for use by
the TSP phase(s) at an intersection.
(2) Overall TSP Potential categorizes intersections by the average amount of slack time available for TSP. The
ranges (0‐10%,10%‐50%,>50%) are arbitrary.
(4) Based on stakeholder input, TSP to be avoided at Hiawatha/46th due to existing traffic operational issues on
Hiawatha Avenue related to LRT. See Section 2.5.
Snelling Avenue Rapid Bus VISSIM Evaluation6/24/2013
DRAFT Final ReportPage 26
Snelling Avenue Rapid Bus VISSIM and TSP Benefit Evaluation Final Report July 2, 2013 Page 27
As shown in Table 4.1, the five intersections with the greatest TSP potential, based solely on available slack time, are:
Snelling Avenue/St. Anthony Avenue; Snelling Avenue/Selby Avenue; County Road B2/Snelling Avenue East Ramps; 46th Street/Minnehaha Avenue, and; 46th Street/36th Avenue.
(The intersection of Hiawatha Avenue and 46th Street was removed from TSP consideration due to Hiawatha corridor LRT conflicts – see Section 2.4). 18 intersections have “medium” potential for TSP benefit based solely on the slack time analysis, while the remaining 10 intersections have “low” potential. The thresholds between the low, medium, and high rankings were based on average available slack time across the AM and PM peak periods, and are arbitrary (10% potential increase in TSP approach green time for the low-to-medium threshold and 50% potential increase in TSP approach green time for the medium-to-high threshold). While some intersections have a higher potential for TSP benefit than others based solely on the slack time analysis, all of the intersections with the exception of two (Snelling Avenue at Hewitt Avenue and Snelling Avenue at Highland Avenue) have the potential for some TSP benefit, based on Table 4.1. The next two sections of the report cover the second part of the TSP analysis where the VISSIM model was used to assess the impact of traffic congestion on the potential benefit of TSP. 4.2 Development of Preliminary TSP Timing Settings
In order to model TSP in VISSIM (and operate TSP in real life), settings relating to the amount of time that a TSP approach is allowed to take from conflicting approaches during a TSP call must be determined and applied. Although it is actually possible to take up to 100% of the available slack time from a conflicting approach for a TSP event, in practice this can result in poor traffic operations on the conflicting approach. Discussion on this topic at the stakeholder kickoff meeting resulted in the identification of conflicting interests. While Metro Transit’s goal for this project was to identify the maximum potential benefit of TSP, MnDOT Metro requested that a realistic assumption be made on the amount of time TSP is allowed to take from conflicting phases. To accommodate MnDOT’s request, the practice for developing the TSP settings assumed as part of the analysis was as follows: the maximum reduction in green time for any one phase was equal to 25% of the green time split for that phase. For example, at the intersection of Snelling Avenue and Selby Avenue, the current split for phase 4 EB/WB is 53 seconds in the p.m. peak. Per the Maximum Green Time Reduction practice applied, the largest reduction in green time for this phase during a TSP call would be 13 seconds (25% of 53 seconds). The slack time for this phase during the p.m. peak is 24 seconds. So while the maximum potential green time reduction for this phase is 24 seconds, the analysis completed for this project would assume that a TSP call would reduce the green time on this phase by up to

Snelling Avenue Rapid Bus VISSIM and TSP Benefit Evaluation Final Report July 2, 2013 Page 28
only 13 seconds. The actual amount of time that the split is reduced varies depending on the point during the cycle that a TSP call is received. The basis for the assumed Maximum Green Time Reduction practice is the process used to develop the TSP settings for over 75 intersections in St. Cloud, Minnesota, where TSP has been in use successfully for over 10 years. This Green Time Reduction Practice is being used for the purpose of assessing potential TSP benefit only as part of this study. Because every system and every intersection is different, the actual maximum green time reduction thresholds to be used in the field should to be refined and fine-tuned intersection-by-intersection as part of TSP implementation to ensure that the optimal balance between transit benefit and non-transit impact is achieved. Using the assumed Maximum Green Time Reduction practice, Maximum Green Reduction settings were developed for both the a.m. and p.m. peak hour timing plans for all phases at each of the study intersections. These settings were entered into the ASC/3 software-in-the-loop controllers and used for the Rapid Bus Refined with TSP scenario. The VISSIM model for this scenario was also updated to include TSP detection extending from the stop bar to a distance of approximately 15 to 20 seconds (600 to 800 feet) upstream of each signalized intersection. For stations located on the near side of signalized intersections (including St. Clair and Kenneth), the detection distance was reduced by the stations dwell time, plus two seconds of acceleration and two seconds of deceleration time. The model also included the assumption that each rapid bus would place a call for priority at every intersection, consistent with the project goal to estimate to potential maximum benefit of TSP. In practice, conditions may be placed on when TSP calls are made (i.e. “Conditional” TSP), similar to how TSP operates on Central Avenue today. For example, calls may only be placed when a bus is more than five minutes behind schedule. 4.3 VISSIM Analysis of Potential TSP Benefit – Network Wide
The Rapid Bus Refined and Rapid Bus Refined with TSP were compared to determine the potential benefit of TSP. A primary MOE to consider when evaluating the potential benefit of TSP is travel time savings for the rapid buses. In VISSIM, this MOE can be reported directly. Table 4.2 summarizes the potential benefit of TSP, in travel time terms as reported from VISSIM, for the Snelling Avenue rapid bus corridor. Travel times were measured from the time of departure at the first station to the time of arrival at the last station. Table 4.2 – Corridor Travel Time Reduction with TSP
Scenario Name Average Travel Time (minutes:seconds)
AM Peak Hour PM Peak Hour Northbound Southbound Northbound Southbound
Rapid Bus Refined 35:08 34:29 40:25 36:37 Rapid Bus Refined with TSP 31:20 30:41 34:35 32:59
Change (3:48) (3:48) (5:50) (3:38) % Change (11%) (11%) (14%) (10%)

Snelling Avenue Rapid Bus VISSIM and TSP Benefit Evaluation Final Report July 2, 2013 Page 29
As shown in Table 4.2, the potential for reduction in travel times of between three and six minutes exists. In percentage terms, this equates to a reduction of between 10 and 14 percent. The potential benefit is weighed against the costs. For TSP, such costs include the additional delay incurred by drivers on movements that conflict with the transit route. When additional time is given to the transit movement, the time is taken away from these conflicting movements. One way to gauge the cost of TSP is to look at the amount of additional delay incurred, network-wide. Total network delay is the amount of delay, typically measured in hours, of all of the vehicles in the model for the entire hour being modeled. It is equivalent to the average delay per vehicle times the number of vehicles per hour, summed for each movement at all of the modeled intersections. This MOE is directly reported by VISSIM. Table 4.3 summarizes the change in total network delay between two TSP evaluation scenarios. Table 4.3 – Total Network Delay Increase with TSP
Scenario Name Total Network Delay (hours)
AM Peak Hour PM Peak Hour Rapid Bus Refined 503 940
Rapid Bus Refined with TSP 528 1,065 Change 25 125
% Change 5% 13% As shown in Table 4.3, implementation of TSP as assumed would result in a 5-13% increase in total network delay. To directly compare the benefits of TSP with the costs, total network person-delay is a more appropriate MOE. Total network person-delay is similar to total network delay, but accounts for the occupancy of each vehicle, thereby accounting for the additional person throughput of transit vehicles. Although a person-delay MOE is available as a built-in MOE in VISSIM, it does not accurately reflect the true amount of person-delay for this project. To compute person-delay, therefore, an indirect approach was used as follows. The Average delay per vehicle and number of vehicles per movement per hour outputs from VISSIM were multiplied to get total delay. The number of rapid buses per hour on each movement and the occupancy of each rapid bus were tallied manually and used as additional inputs. The total number of persons per movement output from VISSIM was added to the number of rapid buses times the assumed occupancy per bus to get total persons. The resulting total delay and total persons were multiplied together to get person-delay per movement. Total Network Person-Delay was calculated by summing across all movements and for all intersections. This calculation is summarized as follows:
∗ ∗
Where:
TNPD = Total Network Person-Delay ADPVi = Average Delay per Vehicle (on a given movement)

Snelling Avenue Rapid Bus VISSIM and TSP Benefit Evaluation Final Report July 2, 2013 Page 30
NPi = Number of Persons per hour (on that movement); non-Rapid Bus vehicles only RBVi = Rapid Bus Volume per hour (on that movement) RBOi = Assumed Rapid Bus Occupancy, per Metro Transit (on that movement)
Table 4.4 compares the results of the network-wide person-delay with and without TSP. Table 4.4 – TSP Impact on Network-Wide Person-Delay
Scenario Name Total Network Person-Delay (person-hours)
AM Peak Hour PM Peak Hour Rapid Bus Refined 654 1,259
Rapid Bus Refined with TSP 680 1,397 Change 26 138
% Change 4% 11% Table 4.4 shows that on a per-person basis, the use of TSP results in a smaller increase in delay. The reason for this difference is that the higher occupancy of the rapid buses on the TSP routes with reduced delay help to offset the increased delay on the other movements. The overall increase in person-delay in the a.m. peak hour is 4%, compared with a 5% increase in vehicle delay. In the p.m. peak hour the increase in person-delay is 11% vs. 13% for vehicle delay. 4.4 VISSIM Analysis of Potential TSP Benefit – By Intersection
To help better gauge the potential benefit of TSP, an intersection-by-intersection evaluation was completed. Person-delay was also the MOE used for this analysis. Table 4.5 shows the results of the analysis, providing a “TSP Benefit Score” for each intersection. This score is equal to the reduction of person-delay between the Rapid Bus Refined and Rapid Bus Refined with TSP scenarios, scaled to give the intersection with the greatest reduction in person-delay a score of 100, and a net reduction of 0 hours of person delay a score of 0. A negative TSP Benefit Score indicates an increase in person-delay with TSP. To help assess where to invest limited financial resources available for implementing TSP, Intersections with a positive TSP Benefit score were also ranked in order of most to least potential for benefit due to TSP.
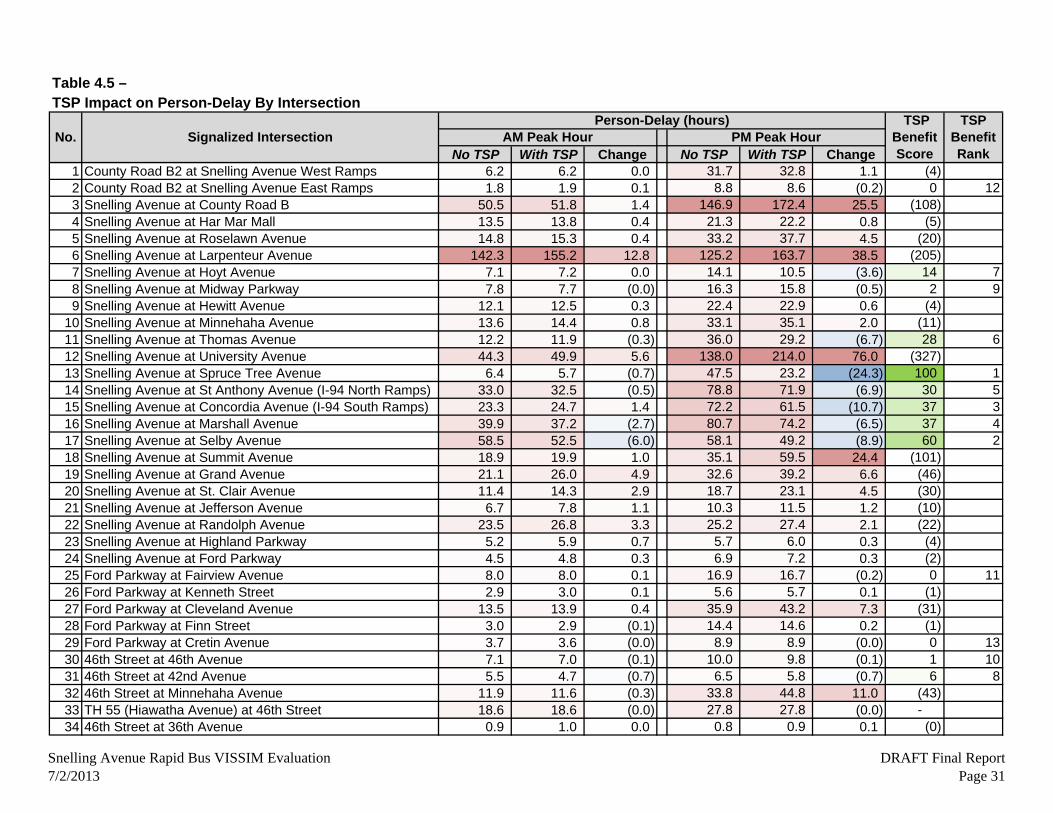
Table 4.5 –TSP Impact on Person-Delay By Intersection
No TSP With TSP Change No TSP With TSP Change 1 County Road B2 at Snelling Avenue West Ramps 6.2 6.2 0.0 31.7 32.8 1.1 (4) 2 County Road B2 at Snelling Avenue East Ramps 1.8 1.9 0.1 8.8 8.6 (0.2) 0 123 Snelling Avenue at County Road B 50.5 51.8 1.4 146.9 172.4 25.5 (108) 4 Snelling Avenue at Har Mar Mall 13.5 13.8 0.4 21.3 22.2 0.8 (5) 5 Snelling Avenue at Roselawn Avenue 14.8 15.3 0.4 33.2 37.7 4.5 (20) 6 Snelling Avenue at Larpenteur Avenue 142.3 155.2 12.8 125.2 163.7 38.5 (205) 7 Snelling Avenue at Hoyt Avenue 7.1 7.2 0.0 14.1 10.5 (3.6) 14 78 Snelling Avenue at Midway Parkway 7.8 7.7 (0.0) 16.3 15.8 (0.5) 2 99 Snelling Avenue at Hewitt Avenue 12.1 12.5 0.3 22.4 22.9 0.6 (4)
10 Snelling Avenue at Minnehaha Avenue 13.6 14.4 0.8 33.1 35.1 2.0 (11) 11 Snelling Avenue at Thomas Avenue 12.2 11.9 (0.3) 36.0 29.2 (6.7) 28 612 Snelling Avenue at University Avenue 44.3 49.9 5.6 138.0 214.0 76.0 (327) 13 Snelling Avenue at Spruce Tree Avenue 6.4 5.7 (0.7) 47.5 23.2 (24.3) 100 114 Snelling Avenue at St Anthony Avenue (I-94 North Ramps) 33.0 32.5 (0.5) 78.8 71.9 (6.9) 30 515 Snelling Avenue at Concordia Avenue (I-94 South Ramps) 23.3 24.7 1.4 72.2 61.5 (10.7) 37 316 Snelling Avenue at Marshall Avenue 39.9 37.2 (2.7) 80.7 74.2 (6.5) 37 417 Snelling Avenue at Selby Avenue 58.5 52.5 (6.0) 58.1 49.2 (8.9) 60 218 Snelling Avenue at Summit Avenue 18.9 19.9 1.0 35.1 59.5 24.4 (101) 19 Snelling Avenue at Grand Avenue 21.1 26.0 4.9 32.6 39.2 6.6 (46) 20 Snelling Avenue at St. Clair Avenue 11.4 14.3 2.9 18.7 23.1 4.5 (30) 21 Snelling Avenue at Jefferson Avenue 6.7 7.8 1.1 10.3 11.5 1.2 (10) 22 Snelling Avenue at Randolph Avenue 23.5 26.8 3.3 25.2 27.4 2.1 (22) 23 Snelling Avenue at Highland Parkway 5.2 5.9 0.7 5.7 6.0 0.3 (4) 24 Snelling Avenue at Ford Parkway 4.5 4.8 0.3 6.9 7.2 0.3 (2) 25 Ford Parkway at Fairview Avenue 8.0 8.0 0.1 16.9 16.7 (0.2) 0 1126 Ford Parkway at Kenneth Street 2.9 3.0 0.1 5.6 5.7 0.1 (1) 27 Ford Parkway at Cleveland Avenue 13.5 13.9 0.4 35.9 43.2 7.3 (31) 28 Ford Parkway at Finn Street 3.0 2.9 (0.1) 14.4 14.6 0.2 (1) 29 Ford Parkway at Cretin Avenue 3.7 3.6 (0.0) 8.9 8.9 (0.0) 0 1330 46th Street at 46th Avenue 7.1 7.0 (0.1) 10.0 9.8 (0.1) 1 1031 46th Street at 42nd Avenue 5.5 4.7 (0.7) 6.5 5.8 (0.7) 6 832 46th Street at Minnehaha Avenue 11.9 11.6 (0.3) 33.8 44.8 11.0 (43) 33 TH 55 (Hiawatha Avenue) at 46th Street 18.6 18.6 (0.0) 27.8 27.8 (0.0) - 34 46th Street at 36th Avenue 0.9 1.0 0.0 0.8 0.9 0.1 (0)
No. Signalized Intersection TSP
Benefit Score
TSP Benefit Rank
AM Peak HourPerson-Delay (hours)
PM Peak Hour
Snelling Avenue Rapid Bus VISSIM Evaluation7/2/2013
DRAFT Final ReportPage 31

Snelling Avenue Rapid Bus VISSIM and TSP Benefit Evaluation Final Report July 2, 2013 Page 32
As shown in Table 4.5, 13 of the 34 project intersections were found to have positive TSP benefit scores. Of these 16 intersections, a large majority of the benefit of TSP is incurred at a handful of project intersections:
1. Snelling Avenue at Spruce Tree Avenue 2. Snelling Avenue at Selby Avenue 3. Snelling Avenue at Marshall Avenue 4. Snelling Avenue at Thomas Avenue 5. Snelling Avenue at Hoyt Avenue 6. Snelling Avenue at St. Anthony Avenue (I-94 North Ramps) 7. Snelling Avenue at Concordia Avenue (I-94 South Ramps)
In quantitative terms, these seven intersections accounted for 98% of all of the benefit yielded by TSP. Table 4.6 compares this list of high-benefit intersections to the initial results from the slack time analysis. Table 4.6 – High Potential Benefit TSP Intersections
Signalized Intersection TSP Potential based on
Slack Time Analysis
Snelling at Spruce Tree Medium Snelling at Selby High Snelling at Marshall Low Snelling at Thomas Low Snelling at Hoyt Low Snelling at St. Anthony (I-94 N. Ramps) High Snelling at Concordia (I-94 S. Ramps) Medium As shown in Table 4.6, the slack time analysis alone was not a dependable gauge of potential TSP benefit. While two intersections ranking “high” in the slack time analysis made the list of high potential benefit intersections based on the VISSIM analysis, three intersections ranking low also made the list. This result confirms that traffic conditions must be taken into account when forecasting were TSP may be of potential benefit; an analysis of signal time alone is not sufficient. The most plausible explanation for this outcome is that although the amount of time shifted to the TSP route from the non-TSP phases was likely small for the intersections scoring “low” in the slack time analysis, the use of this extra time by rapid buses resulted in little to no adverse impact for other vehicles on conflicting approaches. Two other findings are of note. The first is that the results confirm that TSP can be of significant benefit at intersections with very little slack time. Two of the intersections (Marshall Avenue and Hoyt Avenue) had average slack times of 0 to 5% but were able to provide potential benefit equivalent to intersections with slack times of close to 100%. The second is that the two intersections with zero slack time (Snelling Avenue at Hewitt Avenue and Snelling Avenue at Highland Parkway) saw essentially no change in operations with versus without TSP. This result is a good check on the validity of the model results.

Snelling Avenue Rapid Bus VISSIM and TSP Benefit Evaluation Final Report July 2, 2013 Page 33
4.5 VISSIM Animation
To help visualize the impact of TSP on Rapid Bus operations, animations of the northbound and southbound p.m. peak hour Rapid Bus Refined with TSP scenarios were produced. The animations “follow” one Rapid Bus along its entire route during the p.m. peak hour. To aid in stakeholder review of the simulations, they were placed on SRF’s You Tube channel at the following URLs:
Northbound: http://youtu.be/od0fM3EExc8 Southbound: http://youtu.be/H196iulyFFI
To help better understand where TSP provides benefit, a table showing when calls for TSP were made and whether the call resulted in early green, extended green, or no advantage was produced. The table was divided into two parts, one each for the northbound and southbound videos, as shown on the following two pages in Tables 4.7a and 4.7b. One important item to note in Tables 4.7a and 4.7b is that while TSP is requested at each intersection, priority is not always granted. There are multiple possible reasons for this. For instance, a bus may arrive during green and priority may not be needed. Or, a priority call for a bus in the opposing direction may have just occurred and the signal controller is still in the process of returning to normal timing. Finally, at University Avenue, a priority event for the Green Line LRT may be in progress or may have only recently concluded. Another important item to note from review of Tables 4.7a and 4.7b is that the reduction in travel time for Rapid Bus, as detailed in Table 4.2, is greater than the amount of additional green time gained by the Rapid Bus with TSP. The reason this is possible is that when a Rapid Bus calls for priority and receives even a short extension of green time, it avoids having to wait for the side streets and mainline lefts to be served, eliminating a significant amount of delay. In other words, a small amount of additional green time gained through the use of TSP can translate to a large reduction in travel time.

Table 4.7a –Video Interpretation Log - Rapid Bus with TSP - Northbound PM
1 46th Street at 36th Avenue 0:03 No Priority -2 TH 55 (Hiawatha Avenue) at 46th Street - n/a - no TSP -3 46th Street at Minnehaha Avenue 0:32 Early Green 0:044 46th Street at 42nd Avenue 0:57 Extended Green 0:015 46th Street at 46th Avenue 1:12 Early Green 0:226 Ford Parkway at Cretin Avenue 2:20 No Priority - Arrived on Green -7 Ford Parkway at Finn Street 2:30 No Priority - Arrived on Green -8 Ford Parkway at Cleveland Avenue 2:51 Early Green 0:099 Ford Parkway at Kenneth Street 3:19 No Priority - Arrived on Green -
10 Ford Parkway at Fairview Avenue 3:49 No Priority - Arrived on Green -11 Snelling Avenue at Ford Parkway 4:27 No Priority -12 Snelling Avenue at Highland Parkway 4:41 Early Green 0:1113 Snelling Avenue at Randolph Avenue 5:17 Early Green 0:1514 Snelling Avenue at Jefferson Avenue 5:49 Early Green 0:0315 Snelling Avenue at St. Clair Avenue 6:05 Opposing Bus - Arrived on Green -16 Snelling Avenue at Grand Avenue 6:43 Early Green 0:0117 Snelling Avenue at Summit Avenue 7:04 Early Green 0:0818 Snelling Avenue at Selby Avenue 7:33 Early Green 0:1119 Snelling Avenue at Marshall Avenue 8:22 Early Green 0:0620 Snelling Ave. at Concordia Ave. (I-94 S. Ramps) 8:50 Early Green 0:0721 Snelling Ave. at St Anthony Ave. (I-94 N. Ramps) 9:12 Early Green 0:1122 Snelling Avenue at Spruce Tree Avenue 9:24 No Priority - Arrived on Green -23 Snelling Avenue at University Avenue 9:41 No Priority - Arrived on Green -24 Snelling Avenue at Thomas Avenue 10:09 No Priority - Arrived on Green -25 Snelling Avenue at Minnehaha Avenue 10:27 Early + Extended Green 0:0326 Snelling Avenue at Hewitt Avenue 11:06 Extended Green 0:0627 Snelling Avenue at Midway Parkway 12:27 No Priority - Arrived on Green -28 Snelling Avenue at Hoyt Avenue 12:58 No Priority - Arrived on Green -29 Snelling Avenue at Larpenteur Avenue 13:13 Early Green 0:0630 Snelling Avenue at Roselawn Avenue 14:32 No Priority - Arrived on Green -31 Snelling Avenue at Har Mar Mall 15:01 No Priority - Arrived on Green -32 Snelling Avenue at County Road B 15:23 Early Green 0:1033 County Road B2 at Snelling Avenue East Ramps 16:12 Early Green 0:0634 County Road B2 at Snelling Avenue West Ramps 16:29 Early Green 0:08
Total 2:28
Signalized IntersectionNo. ResponseAdvantage
Gained
Time of TSP
Request
Snelling Avenue Rapid Bus VISSIM Evaluation6/24/2013
DRAFT Final ReportPage 34
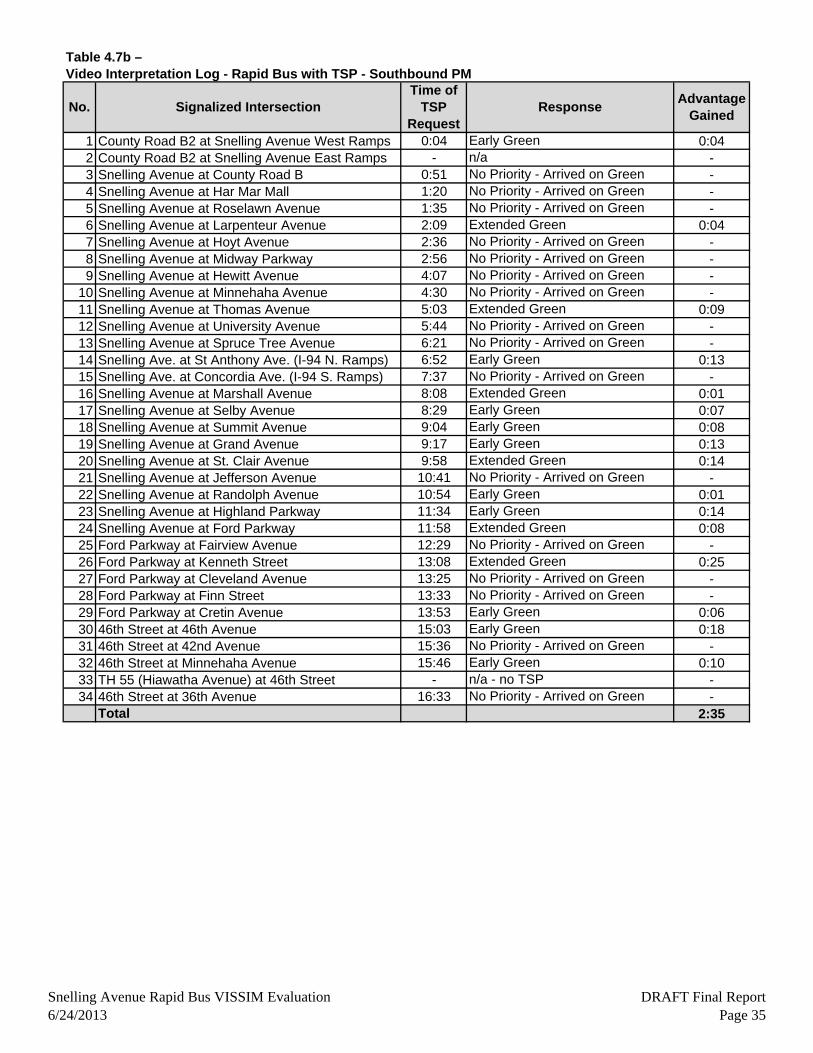
Table 4.7b –Video Interpretation Log - Rapid Bus with TSP - Southbound PM
1 County Road B2 at Snelling Avenue West Ramps 0:04 Early Green 0:042 County Road B2 at Snelling Avenue East Ramps - n/a -3 Snelling Avenue at County Road B 0:51 No Priority - Arrived on Green -4 Snelling Avenue at Har Mar Mall 1:20 No Priority - Arrived on Green -5 Snelling Avenue at Roselawn Avenue 1:35 No Priority - Arrived on Green -6 Snelling Avenue at Larpenteur Avenue 2:09 Extended Green 0:047 Snelling Avenue at Hoyt Avenue 2:36 No Priority - Arrived on Green -8 Snelling Avenue at Midway Parkway 2:56 No Priority - Arrived on Green -9 Snelling Avenue at Hewitt Avenue 4:07 No Priority - Arrived on Green -
10 Snelling Avenue at Minnehaha Avenue 4:30 No Priority - Arrived on Green -11 Snelling Avenue at Thomas Avenue 5:03 Extended Green 0:0912 Snelling Avenue at University Avenue 5:44 No Priority - Arrived on Green -13 Snelling Avenue at Spruce Tree Avenue 6:21 No Priority - Arrived on Green -14 Snelling Ave. at St Anthony Ave. (I-94 N. Ramps) 6:52 Early Green 0:1315 Snelling Ave. at Concordia Ave. (I-94 S. Ramps) 7:37 No Priority - Arrived on Green -16 Snelling Avenue at Marshall Avenue 8:08 Extended Green 0:0117 Snelling Avenue at Selby Avenue 8:29 Early Green 0:0718 Snelling Avenue at Summit Avenue 9:04 Early Green 0:0819 Snelling Avenue at Grand Avenue 9:17 Early Green 0:1320 Snelling Avenue at St. Clair Avenue 9:58 Extended Green 0:1421 Snelling Avenue at Jefferson Avenue 10:41 No Priority - Arrived on Green -22 Snelling Avenue at Randolph Avenue 10:54 Early Green 0:0123 Snelling Avenue at Highland Parkway 11:34 Early Green 0:1424 Snelling Avenue at Ford Parkway 11:58 Extended Green 0:0825 Ford Parkway at Fairview Avenue 12:29 No Priority - Arrived on Green -26 Ford Parkway at Kenneth Street 13:08 Extended Green 0:2527 Ford Parkway at Cleveland Avenue 13:25 No Priority - Arrived on Green -28 Ford Parkway at Finn Street 13:33 No Priority - Arrived on Green -29 Ford Parkway at Cretin Avenue 13:53 Early Green 0:0630 46th Street at 46th Avenue 15:03 Early Green 0:1831 46th Street at 42nd Avenue 15:36 No Priority - Arrived on Green -32 46th Street at Minnehaha Avenue 15:46 Early Green 0:1033 TH 55 (Hiawatha Avenue) at 46th Street - n/a - no TSP -34 46th Street at 36th Avenue 16:33 No Priority - Arrived on Green -
Total 2:35
Time of TSP
RequestResponse
Advantage Gained
No. Signalized Intersection
Snelling Avenue Rapid Bus VISSIM Evaluation6/24/2013
DRAFT Final ReportPage 35
Snelling Avenue Rapid Bus VISSIM and TSP Benefit Evaluation Final Report July 2, 2013 Page 36
5.0 STATION-BY-STATION SUMMARIES
This section of the report provides a detailed quantitative look at the modeling results at each of the 17 rapid bus stations analyzed in VISSIM. Each of the summaries provides information on the station configuration and a.m. and p.m. peak hour MOEs for each scenario. Station configuration information includes the station location relative to the nearest intersection, type of platform, and assumed dwell time. MOEs include northbound and southbound travel time from approximately two blocks before to two blocks after the station, average delay per vehicle at nearby intersection(s), corresponding Level of Service, and total person-delay. Total person-delay is reported only for the Rapid Bus Refined and Rapid Bus Refined with TSP scenarios. The purpose of these summaries is to provide a quick reference when making design decisions related to the location and configuration of each of the stations.

Table 5.1 –Rapid Bus MOE Summary - County Road B / Har Mar Station
Baseline Rapid Bus
Alpha Rapid Bus
Beta Rapid Bus
Refined
Rapid Bus Refined w/
TSP
Station ConfigurationStation LocationPlatform TypeDwell Time (sec.)Station LocationPlatform TypeDwell Time (sec.)
AM Peak Hour 10.6 10.6 10.6 10.7 10.5 14.9 15.0 15.0 15.0 14.7
Avg. Delay per Veh. (sec.) 33.7 33.9 33.9 33.9 34.9 Level of Service C C C C C Total Person-Delay (hr.) 50.5 51.8
PM Peak Hour 10.8 10.8 10.7 10.7 10.8 17.9 17.8 18.0 17.7 17.4
Avg. Delay per Veh. (sec.) 71.4 73.9 73.9 73.5 87.5 Level of Service E E E E F Total Person-Delay (hr.) 146.9 172.4
Table 5.2 –Rapid Bus MOE Summary - Roselawn Station
Baseline Rapid Bus
Alpha Rapid Bus
Beta Rapid Bus
Refined
Rapid Bus Refined w/
TSP
Station ConfigurationStation LocationPlatform TypeDwell Time (sec.)Station LocationPlatform TypeDwell Time (sec.)
AM Peak Hour 12.9 12.9 12.9 13.0 12.8 10.5 10.6 10.6 10.7 10.7
Avg. Delay per Veh. (sec.) 13.0 13.0 13.0 13.1 13.6 Level of Service B B B B B Total Person-Delay (hr.) 14.8 15.3
PM Peak Hour 11.3 11.3 11.4 11.4 11.7 15.6 15.1 15.2 15.4 16.4
Avg. Delay per Veh. (sec.) 24.6 24.0 23.9 23.5 26.8 Level of Service C C C C C Total Person-Delay (hr.) 33.2 37.7
Northbound Travel Time (sec.)Southbound Travel Time (sec.)
Southbound
7
7
Snelling Avenue /County Rd. B.
Snelling Avenue /County Rd. B.
farsidecurbside
farsidecurbside
Northbound Travel Time (sec.)Southbound Travel Time (sec.)
Assumption /Measure of Effectiveness
Snelling Avenue /Roselawn Avenue
Scenario
Scenario
curbsidefarside County Road B
Northbound Travel Time (sec.)Southbound Travel Time (sec.)
Northbound Travel Time (sec.)Southbound Travel Time (sec.)
curbsidemidblock
Northbound
Southbound
n/a
Assumption /Measure of Effectiveness
Snelling Avenue /Roselawn Avenue
7
7
n/a
Northbound
Snelling Avenue Rapid Bus VISSIM Evaluation7/2/2013
DRAFT Final ReportPage 37
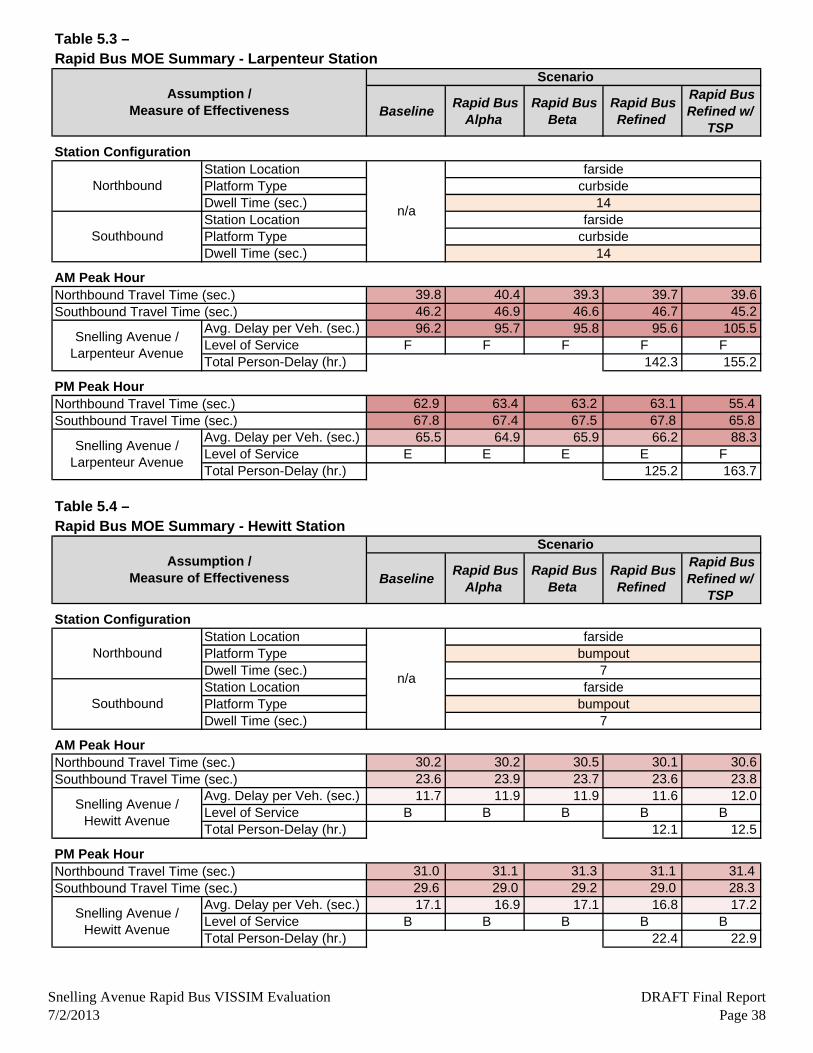
Table 5.3 –Rapid Bus MOE Summary - Larpenteur Station
Baseline Rapid Bus
Alpha Rapid Bus
Beta Rapid Bus
Refined
Rapid Bus Refined w/
TSP
Station ConfigurationStation LocationPlatform TypeDwell Time (sec.)Station LocationPlatform TypeDwell Time (sec.)
AM Peak Hour 39.8 40.4 39.3 39.7 39.6 46.2 46.9 46.6 46.7 45.2
Avg. Delay per Veh. (sec.) 96.2 95.7 95.8 95.6 105.5 Level of Service F F F F F Total Person-Delay (hr.) 142.3 155.2
PM Peak Hour 62.9 63.4 63.2 63.1 55.4 67.8 67.4 67.5 67.8 65.8
Avg. Delay per Veh. (sec.) 65.5 64.9 65.9 66.2 88.3 Level of Service E E E E F Total Person-Delay (hr.) 125.2 163.7
Table 5.4 –Rapid Bus MOE Summary - Hewitt Station
Baseline Rapid Bus
Alpha Rapid Bus
Beta Rapid Bus
Refined
Rapid Bus Refined w/
TSP
Station ConfigurationStation LocationPlatform TypeDwell Time (sec.)Station LocationPlatform TypeDwell Time (sec.)
AM Peak Hour 30.2 30.2 30.5 30.1 30.6 23.6 23.9 23.7 23.6 23.8
Avg. Delay per Veh. (sec.) 11.7 11.9 11.9 11.6 12.0 Level of Service B B B B B Total Person-Delay (hr.) 12.1 12.5
PM Peak Hour 31.0 31.1 31.3 31.1 31.4 29.6 29.0 29.2 29.0 28.3
Avg. Delay per Veh. (sec.) 17.1 16.9 17.1 16.8 17.2 Level of Service B B B B B Total Person-Delay (hr.) 22.4 22.9
Assumption /Measure of Effectiveness
Northbound Travel Time (sec.)Southbound Travel Time (sec.)
Snelling Avenue /Larpenteur Avenue
Northbound Travel Time (sec.)Southbound Travel Time (sec.)
Scenario
Northbound
n/a
farsidecurbside
14
Southboundfarside
curbside14
Northbound Travel Time (sec.)Southbound Travel Time (sec.)
Snelling Avenue /Hewitt Avenue
Northbound Travel Time (sec.)Southbound Travel Time (sec.)
Snelling Avenue /Larpenteur Avenue
Assumption /Measure of Effectiveness
Scenario
Northbound
n/a
farsidebumpout
7
Southboundfarside
bumpout7
Snelling Avenue /Hewitt Avenue
Snelling Avenue Rapid Bus VISSIM Evaluation7/2/2013
DRAFT Final ReportPage 38

Table 5.5 –Rapid Bus MOE Summary - Minnehaha Station (St. Paul)
Baseline Rapid Bus
Alpha Rapid Bus
Beta Rapid Bus
Refined
Rapid Bus Refined w/
TSP
Station ConfigurationStation LocationPlatform TypeDwell Time (sec.)Station LocationPlatform TypeDwell Time (sec.)
AM Peak Hour 23.4 23.7 23.4 23.6 23.6 24.1 24.3 24.2 24.0 24.3
Avg. Delay per Veh. (sec.) 13.1 13.3 13.1 13.1 13.9 Level of Service B B B B B Total Person-Delay (hr.) 13.6 14.4
PM Peak Hour 29.9 30.6 31.3 30.7 31.2 31.9 31.4 31.9 32.7 30.9
Avg. Delay per Veh. (sec.) 23.5 23.4 24.3 24.0 25.6 Level of Service C C C C C Total Person-Delay (hr.) 33.1 35.1
Northbound Travel Time (sec.)Southbound Travel Time (sec.)
Snelling Avenue /Minnehaha Avenue
Northbound Travel Time (sec.)Southbound Travel Time (sec.)
Assumption /Measure of Effectiveness
Scenario
Northbound
n/a
farsidebumpout
14
Southboundfarside
bumpout14
Snelling Avenue /Minnehaha Avenue
Snelling Avenue Rapid Bus VISSIM Evaluation7/2/2013
DRAFT Final ReportPage 39

Table 5.6 –Rapid Bus MOE Summary - University Station
Baseline Rapid Bus
Alpha Rapid Bus
Beta Rapid Bus
Refined
Rapid Bus Refined w/
TSP
Station Configuration
Station Location farside nearsidePlatform Type bumpout curbsideDwell Time (sec.)Station LocationPlatform TypeDwell Time (sec.)
AM Peak Hour 43.3 43.5 43.5 43.5 39.7 38.7 38.5 38.4 38.8 35.8
Avg. Delay per Veh. (sec.) 32.5 31.6 31.8 31.9 36.0 Level of Service C C C C D Total Person-Delay (hr.) 44 50 Avg. Delay per Veh. (sec.) 6.2 6.1 6.4 6.0 5.4 Level of Service A A A A A Total Person-Delay (hr.) 6.4 5.7
PM Peak Hour 79.9 89.4 78.2 89.5 53.6 68.7 70.3 71.4 71.1 53.8
Avg. Delay per Veh. (sec.) 71.9 76.2 74.3 75.1 122.5 Level of Service E E E E F Total Person-Delay (hr.) 138 214 Avg. Delay per Veh. (sec.) 29.6 34.1 29.1 35.1 17.3 Level of Service C C C D B Total Person-Delay (hr.) 47.5 23.2
Assumption /Measure of Effectiveness
Scenario
Northbound
n/a 21
Southboundfarside
curbside21
Snelling Avenue /University Avenue
Snelling Avenue /Spruce Tree Avenue
Snelling Avenue /Spruce Tree Avenue
farsidebumpout
Northbound Travel Time (sec.)Southbound Travel Time (sec.)
Snelling Avenue /University Avenue
Northbound Travel Time (sec.)Southbound Travel Time (sec.)
Snelling Avenue Rapid Bus VISSIM Evaluation7/2/2013
DRAFT Final ReportPage 40

Table 5.7 –Rapid Bus MOE Summary - Hague Station
Baseline Rapid Bus
Alpha Rapid Bus
Beta Rapid Bus
Refined
Rapid Bus Refined w/
TSP
Station Configuration
Station Locationfarside Hague
Platform TypeDwell Time (sec.)
Station Locationfarside Hague
Platform TypeDwell Time (sec.)
AM Peak Hour 65.4 65.0 71.8 76.3 59.8 41.9 42.1 41.9 42.2 41.3
Avg. Delay per Veh. (sec.) 42.4 41.5 46.1 50.5 47.0 Level of Service D D D D D Total Person-Delay (hr.) 58.5 52.5
PM Peak Hour 72.8 79.7 84.8 84.3 66.7 39.3 39.7 40.3 40.0 40.8
Avg. Delay per Veh. (sec.) 36.9 40.1 42.5 43.0 36.4 Level of Service D D D D D Total Person-Delay (hr.) 58.1 49.2
Table 5.8 –Rapid Bus MOE Summary - Grand Station
Baseline Rapid Bus
Alpha Rapid Bus
Beta Rapid Bus
Refined
Rapid Bus Refined w/
TSP
Station ConfigurationStation LocationPlatform TypeDwell Time (sec.)Station LocationPlatform TypeDwell Time (sec.)
AM Peak Hour 30.4 31.1 31.2 31.0 29.9 35.4 35.2 35.3 35.5 31.8
Avg. Delay per Veh. (sec.) 23.5 23.8 23.5 23.8 30.1 Level of Service C C C C C Total Person-Delay (hr.) 21.1 26.0
PM Peak Hour 59.5 60.0 60.1 59.6 56.7 29.8 30.3 30.3 30.3 33.8
Avg. Delay per Veh. (sec.) 27.5 27.8 27.7 27.8 33.5 Level of Service C C C C C Total Person-Delay (hr.) 32.6 39.2
Assumption /Measure of Effectiveness
Scenario
Northbound
n/a
bumpout7
Southboundbumpout
7
Snelling Avenue /Selby Avenue
farside Selby
nearside Dayton
Assumption /Measure of Effectiveness
Scenario
Northbound Travel Time (sec.)Southbound Travel Time (sec.)
Snelling Avenue /Selby Avenue
Northbound Travel Time (sec.)Southbound Travel Time (sec.)
Northbound Travel Time (sec.)Southbound Travel Time (sec.)
Snelling Avenue /Grand Avenue
Northbound Travel Time (sec.)Southbound Travel Time (sec.)
Northbound
n/a
farsidebumpout
7
Southboundfarside
bumpout7
Snelling Avenue /Grand Avenue
Snelling Avenue Rapid Bus VISSIM Evaluation7/2/2013
DRAFT Final ReportPage 41
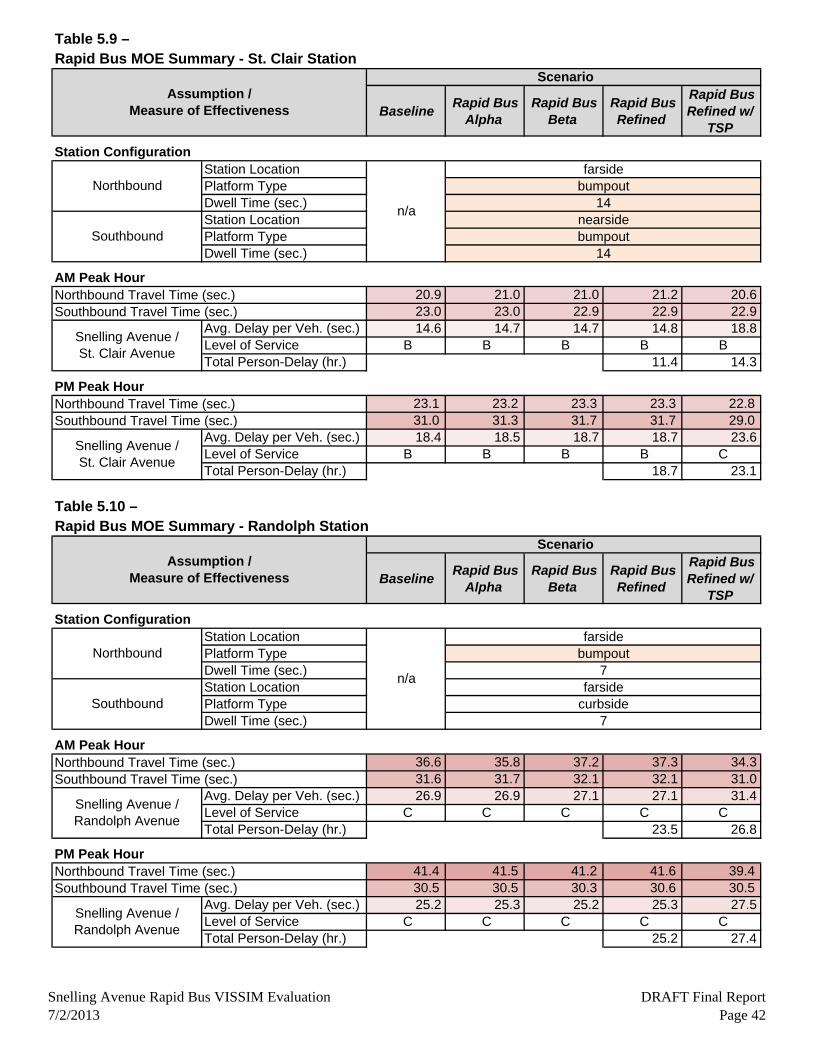
Table 5.9 –Rapid Bus MOE Summary - St. Clair Station
Baseline Rapid Bus
Alpha Rapid Bus
Beta Rapid Bus
Refined
Rapid Bus Refined w/
TSP
Station ConfigurationStation LocationPlatform TypeDwell Time (sec.)Station LocationPlatform TypeDwell Time (sec.)
AM Peak Hour 20.9 21.0 21.0 21.2 20.6 23.0 23.0 22.9 22.9 22.9
Avg. Delay per Veh. (sec.) 14.6 14.7 14.7 14.8 18.8 Level of Service B B B B B Total Person-Delay (hr.) 11.4 14.3
PM Peak Hour 23.1 23.2 23.3 23.3 22.8 31.0 31.3 31.7 31.7 29.0
Avg. Delay per Veh. (sec.) 18.4 18.5 18.7 18.7 23.6 Level of Service B B B B C Total Person-Delay (hr.) 18.7 23.1
Table 5.10 –Rapid Bus MOE Summary - Randolph Station
Baseline Rapid Bus
Alpha Rapid Bus
Beta Rapid Bus
Refined
Rapid Bus Refined w/
TSP
Station ConfigurationStation LocationPlatform TypeDwell Time (sec.)Station LocationPlatform TypeDwell Time (sec.)
AM Peak Hour 36.6 35.8 37.2 37.3 34.3 31.6 31.7 32.1 32.1 31.0
Avg. Delay per Veh. (sec.) 26.9 26.9 27.1 27.1 31.4 Level of Service C C C C C Total Person-Delay (hr.) 23.5 26.8
PM Peak Hour 41.4 41.5 41.2 41.6 39.4 30.5 30.5 30.3 30.6 30.5
Avg. Delay per Veh. (sec.) 25.2 25.3 25.2 25.3 27.5 Level of Service C C C C C Total Person-Delay (hr.) 25.2 27.4
Northbound Travel Time (sec.)Southbound Travel Time (sec.)
Snelling Avenue /St. Clair Avenue
Northbound Travel Time (sec.)Southbound Travel Time (sec.)
Assumption /Measure of Effectiveness
Scenario
Northbound
n/a
farsidebumpout
14
Southboundnearsidebumpout
14
Northbound Travel Time (sec.)Southbound Travel Time (sec.)
Snelling Avenue /Randolph Avenue
Northbound Travel Time (sec.)Southbound Travel Time (sec.)
Snelling Avenue /St. Clair Avenue
Assumption /Measure of Effectiveness
Scenario
Northbound
n/a
farsidebumpout
7
Southboundfarside
curbside7
Snelling Avenue /Randolph Avenue
Snelling Avenue Rapid Bus VISSIM Evaluation7/2/2013
DRAFT Final ReportPage 42

Table 5.11 –Rapid Bus MOE Summary - Highland Station
Baseline Rapid Bus
Alpha Rapid Bus
Beta Rapid Bus
Refined
Rapid Bus Refined w/
TSP
Station ConfigurationStation LocationPlatform TypeDwell Time (sec.)Station LocationPlatform TypeDwell Time (sec.)
AM Peak Hour 18.1 18.1 18.0 18.1 18.3 20.4 20.6 20.5 20.5 21.2
Avg. Delay per Veh. (sec.) 9.3 9.4 9.3 9.3 10.5 Level of Service A A A A B Total Person-Delay (hr.) 5.2 5.9
PM Peak Hour 17.6 17.6 17.6 17.6 17.7 21.9 22.1 22.1 21.9 21.5
Avg. Delay per Veh. (sec.) 8.7 8.8 8.8 8.7 9.2 Level of Service A A A A A Total Person-Delay (hr.) 5.7 6.0
Table 5.12 –Rapid Bus MOE Summary - Fairview Station
Baseline Rapid Bus
Alpha Rapid Bus
Beta Rapid Bus
Refined
Rapid Bus Refined w/
TSP
Station ConfigurationStation LocationPlatform TypeDwell Time (sec.)Station LocationPlatform TypeDwell Time (sec.)
AM Peak Hour 34.2 34.9 34.6 34.0 34.2 33.7 35.1 34.5 34.6 33.9
Avg. Delay per Veh. (sec.) 12.4 12.7 12.5 12.6 12.7 Level of Service B B B B B Total Person-Delay (hr.) 8.0 8.0
PM Peak Hour 37.3 38.1 38.5 38.7 37.2 37.4 38.6 38.7 38.7 37.4
Avg. Delay per Veh. (sec.) 18.7 19.6 19.5 19.6 19.4 Level of Service B B B B B Total Person-Delay (hr.) 16.9 16.7
Northbound Travel Time (sec.)Southbound Travel Time (sec.)
Snelling Avenue /Highland Parkway
Northbound Travel Time (sec.)Southbound Travel Time (sec.)
Assumption /Measure of Effectiveness
Scenario
Northbound
n/a
farsidebumpout
7
Southboundfarside
bumpout7
Northbound Travel Time (sec.)Southbound Travel Time (sec.)
Ford Parkway /Fairview Avenue
Northbound Travel Time (sec.)Southbound Travel Time (sec.)
Snelling Avenue /Highland Parkway
Assumption /Measure of Effectiveness
Scenario
Northbound(Eastbound)
n/a
farsidebumpout
7
Southbound(Westbound)
farsidebumpout
7
Ford Parkway /Fairview Avenue
Snelling Avenue Rapid Bus VISSIM Evaluation7/2/2013
DRAFT Final ReportPage 43
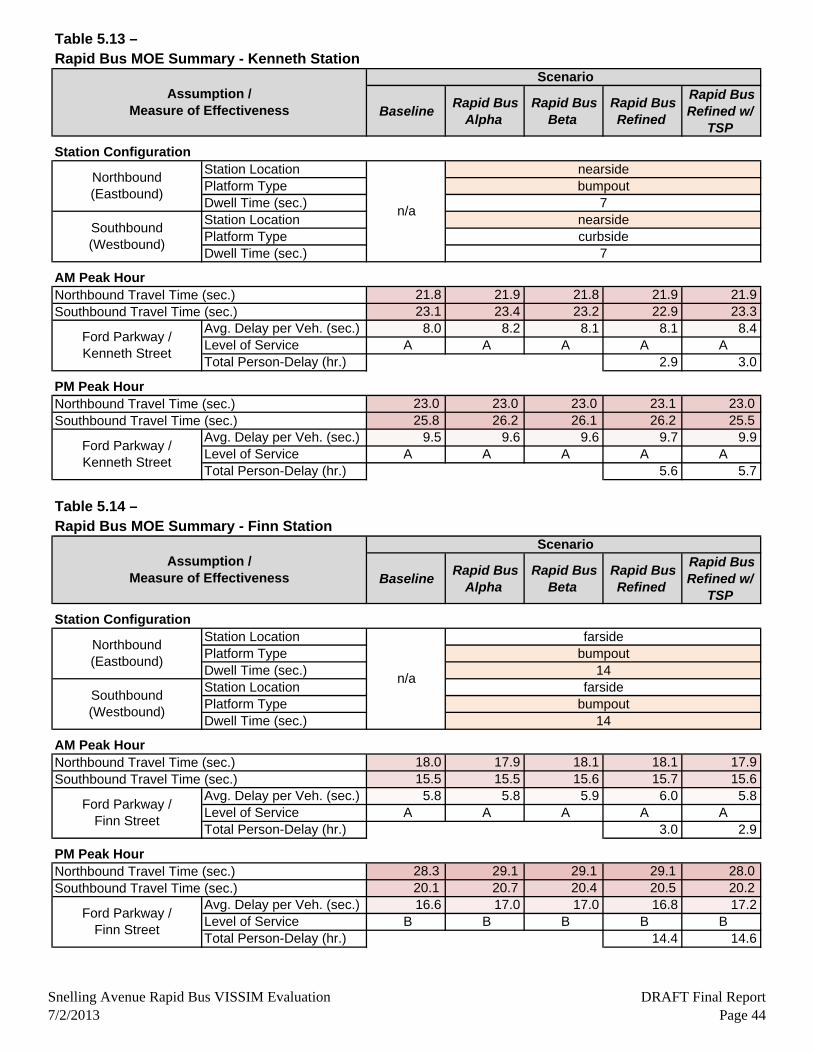
Table 5.13 –Rapid Bus MOE Summary - Kenneth Station
Baseline Rapid Bus
Alpha Rapid Bus
Beta Rapid Bus
Refined
Rapid Bus Refined w/
TSP
Station ConfigurationStation LocationPlatform TypeDwell Time (sec.)Station LocationPlatform TypeDwell Time (sec.)
AM Peak Hour 21.8 21.9 21.8 21.9 21.9 23.1 23.4 23.2 22.9 23.3
Avg. Delay per Veh. (sec.) 8.0 8.2 8.1 8.1 8.4 Level of Service A A A A A Total Person-Delay (hr.) 2.9 3.0
PM Peak Hour 23.0 23.0 23.0 23.1 23.0 25.8 26.2 26.1 26.2 25.5
Avg. Delay per Veh. (sec.) 9.5 9.6 9.6 9.7 9.9 Level of Service A A A A A Total Person-Delay (hr.) 5.6 5.7
Table 5.14 –Rapid Bus MOE Summary - Finn Station
Baseline Rapid Bus
Alpha Rapid Bus
Beta Rapid Bus
Refined
Rapid Bus Refined w/
TSP
Station ConfigurationStation LocationPlatform TypeDwell Time (sec.)Station LocationPlatform TypeDwell Time (sec.)
AM Peak Hour 18.0 17.9 18.1 18.1 17.9 15.5 15.5 15.6 15.7 15.6
Avg. Delay per Veh. (sec.) 5.8 5.8 5.9 6.0 5.8 Level of Service A A A A A Total Person-Delay (hr.) 3.0 2.9
PM Peak Hour 28.3 29.1 29.1 29.1 28.0 20.1 20.7 20.4 20.5 20.2
Avg. Delay per Veh. (sec.) 16.6 17.0 17.0 16.8 17.2 Level of Service B B B B B Total Person-Delay (hr.) 14.4 14.6
Northbound Travel Time (sec.)Southbound Travel Time (sec.)
Ford Parkway /Kenneth Street
Northbound Travel Time (sec.)Southbound Travel Time (sec.)
Assumption /Measure of Effectiveness
Scenario
Northbound(Eastbound)
n/a
nearsidebumpout
7
Southbound(Westbound)
nearsidecurbside
7
Northbound Travel Time (sec.)Southbound Travel Time (sec.)
Ford Parkway /Finn Street
Northbound Travel Time (sec.)Southbound Travel Time (sec.)
Ford Parkway /Kenneth Street
Assumption /Measure of Effectiveness
Scenario
Northbound(Eastbound)
n/a
farsidebumpout
14
Southbound(Westbound)
farsidebumpout
14
Ford Parkway /Finn Street
Snelling Avenue Rapid Bus VISSIM Evaluation7/2/2013
DRAFT Final ReportPage 44

Table 5.15 –Rapid Bus MOE Summary - Woodlawn Station
Baseline Rapid Bus
Alpha Rapid Bus
Beta Rapid Bus
Refined
Rapid Bus Refined w/
TSP
Station ConfigurationStation LocationPlatform TypeDwell Time (sec.)Station LocationPlatform TypeDwell Time (sec.)
AM Peak Hour 20.7 20.7 20.7 20.7 20.7 20.5 20.6 20.6 20.6 20.6
PM Peak Hour 21.0 21.1 21.1 21.1 21.1 21.2 21.5 21.5 21.5 21.5
Table 5.16 –Rapid Bus MOE Summary - 45th/46th Station
Baseline Rapid Bus
Alpha Rapid Bus
Beta Rapid Bus
Refined
Rapid Bus Refined w/
TSP
Station ConfigurationStation LocationPlatform TypeDwell Time (sec.)Station LocationPlatform TypeDwell Time (sec.)
AM Peak Hour 42.0 42.0 41.9 41.3 38.5 28.9 28.1 28.2 28.4 28.1
Avg. Delay per Veh. (sec.) 16.4 16.3 16.3 16.2 16.1 Level of Service B B B B B Total Person-Delay (hr.) 7.1 7.0
PM Peak Hour 30.5 31.1 31.2 30.8 30.5 28.7 28.8 28.7 28.7 28.8
Avg. Delay per Veh. (sec.) 14.2 14.4 14.5 14.4 14.2 Level of Service B B B B B Total Person-Delay (hr.) 10.0 9.8
Northbound Travel Time (sec.)Southbound Travel Time (sec.)
Northbound Travel Time (sec.)Southbound Travel Time (sec.)
Assumption /Measure of Effectiveness
Scenario
Northbound(Eastbound)
n/a
midblockbumpout
14
Southbound(Westbound)
nearsidebumpout
14
Northbound Travel Time (sec.)Southbound Travel Time (sec.)
46th Street /46th Avenue
Northbound Travel Time (sec.)Southbound Travel Time (sec.)
Assumption /Measure of Effectiveness
Scenario
Northbound(Eastbound)
n/a
nearside 46thcurbside
7
Southbound(Westbound)
nearside 45thcurbside
7
46th Street /46th Avenue
Snelling Avenue Rapid Bus VISSIM Evaluation7/2/2013
DRAFT Final ReportPage 45
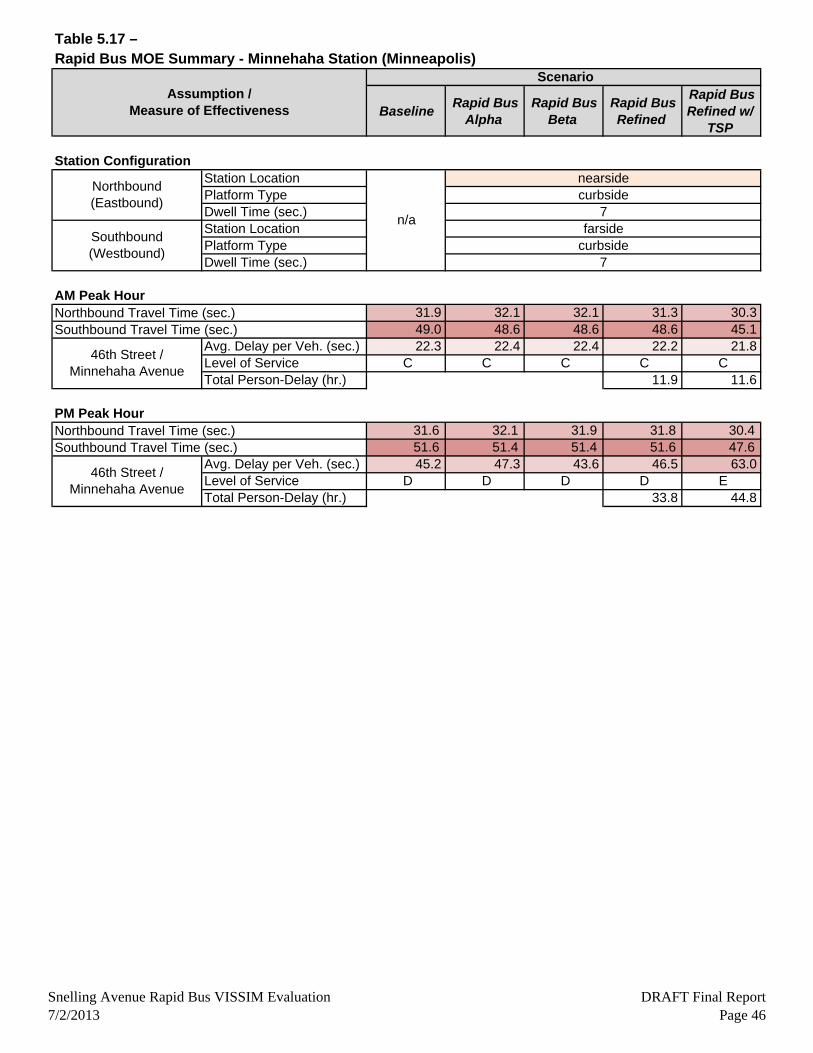
Table 5.17 –Rapid Bus MOE Summary - Minnehaha Station (Minneapolis)
Baseline Rapid Bus
Alpha Rapid Bus
Beta Rapid Bus
Refined
Rapid Bus Refined w/
TSP
Station ConfigurationStation LocationPlatform TypeDwell Time (sec.)Station LocationPlatform TypeDwell Time (sec.)
AM Peak Hour 31.9 32.1 32.1 31.3 30.3 49.0 48.6 48.6 48.6 45.1
Avg. Delay per Veh. (sec.) 22.3 22.4 22.4 22.2 21.8 Level of Service C C C C C Total Person-Delay (hr.) 11.9 11.6
PM Peak Hour 31.6 32.1 31.9 31.8 30.4 51.6 51.4 51.4 51.6 47.6
Avg. Delay per Veh. (sec.) 45.2 47.3 43.6 46.5 63.0 Level of Service D D D D E Total Person-Delay (hr.) 33.8 44.8
46th Street /Minnehaha Avenue
Northbound Travel Time (sec.)Southbound Travel Time (sec.)
46th Street /Minnehaha Avenue
Northbound Travel Time (sec.)Southbound Travel Time (sec.)
Assumption /Measure of Effectiveness
Scenario
Northbound(Eastbound)
n/a
nearsidecurbside
7
Southbound(Westbound)
farsidecurbside
7
Snelling Avenue Rapid Bus VISSIM Evaluation7/2/2013
DRAFT Final ReportPage 46
Snelling Avenue Rapid Bus VISSIM and TSP Benefit Evaluation Final Report July 2, 2013 Page 47
6.0 CONCLUSIONS AND RECOMMENDATIONS
6.1 Conclusions
Major conclusions drawn by SRF analysis described above include:
During the a.m. peak hour, proposed rapid bus operations with have very little, if any, discernible impact on traffic operations. In quantitative terms, average delay per vehicle for general traffic is expected to increase by less than 2 seconds near each of the proposed stations.
During the p.m. peak hour, proposed rapid bus operations with have very little impact (less than 2 seconds of added delay per vehicle) at 15 of the 17 stations modeled.
During the p.m. peak hour, the northbound University Avenue rapid bus station, as initially proposed in the Alpha scenario, is likely to have an impact on traffic operations of approximately 5 seconds of added delay per vehicle.
An analysis of an alternate location for the Northbound University Avenue station was completed. The analysis looked at an alternative location/configuration at Spruce Tree Avenue, as suggested by Metro Transit. The new configuration of the station moved the stop out of the travel lane and into a right turn lane. The results showed that average delay could be improved by 2 to 5 seconds in the p.m. peak hour under this alternative.
During the p.m. peak hour, the northbound Hague Avenue rapid bus station, as initially proposed in the Alpha scenario, is likely to have an impact on traffic operations of approximately 7 seconds of additional delay per vehicle.
The southbound Hague Avenue rapid bus station appears to have a slight impact to traffic operations of approximately 2 seconds per vehicle in the p.m. peak hour.
An analysis of alternate locations for the Northbound and Southbound Hague Avenue stations were completed, examining a northbound station at Selby and a southbound station at Dayton. The results showed that moving the stations further north would result in slightly increased delay (around 2 seconds in the p.m. peak hour) for general traffic.
A basic TSP slack time analysis that considered only signal timing and not traffic volumes found that transit operations at all but two of the project intersections could potentially benefit from the use of TSP.
A more detailed VISSIM model analysis results indicate that TSP could reduce travel time for rapid buses by 3 to 5 minutes (10 to 14%). The analysis showed that rapid bus running time during peak periods is expected to vary between 35 and 40 minutes per one-way run without TSP.
98% percent of the potential benefit of TSP came from its use at seven project intersections. 13 project intersections in total saw a net benefit from TSP use, while the potential disbenefit outweighed the potential benefit at the remaining 20 project intersections where TSP use was analyzed.
Snelling Avenue Rapid Bus VISSIM and TSP Benefit Evaluation Final Report July 2, 2013 Page 48
6.2 Recommendations
Based on the conclusions above, SRF offers the following recommendations:
Consider traffic impacts as the northbound University Avenue station location is finalized. The northbound nearside Spruce Tree Avenue with curbside (non-bumpout) configuration would slightly reduce impacts to general traffic.
Consider traffic impacts as the Hague/Selby/Dayton station location is finalized. Locating both Hague Avenue stations as proposed in the baseline scenario (at Hague Avenue and not one or two blocks north at Selby or Dayton Avenues) would reduce impacts to general traffic.
Consider analysis of additional transit priority measures, such as a queue jump signal, at the northbound University Avenue station to further improve rapid bus operations in this congested area.
Explore an additional scenario with no TSP or a less aggressive Maximum Green Time Reduction practice at intersections where the potential disbenefit due to TSP outweighed the potential benefit to gauge the amount of rapid bus travel time savings under a more realistic set of assumptions. The intersections showing a potential net benefit due to TSP are as follows (listed geographically from north to south):
1. County Road B2 at Snelling Avenue at East Ramps 2. Snelling Avenue at Hoyt Avenue 3. Snelling Avenue at Midway Parkway 4. Snelling Avenue at Thomas Avenue 5. Snelling Avenue at Spruce Tree Avenue 6. Snelling Avenue at St. Anthony Avenue (I-94 North Ramps) 7. Snelling Avenue at Concordia Avenue (I-94 South Ramps) 8. Snelling Avenue at Marshall Avenue 9. Snelling Avenue at Selby Avenue 10. Ford Parkway at Fairview Avenue 11. Ford Parkway at Cretin Avenue 12. 46th Street at 46th Avenue 13. 46th Street at 42nd Avenue
Concurrent with the development/implementation of Rapid Bus service, prioritize implementation of TSP at the 7 project intersections showing the most potential benefit (listed from most potential benefit to least potential benefit):
1. Snelling Avenue at Spruce Tree Avenue 2. Snelling Avenue at Selby Avenue 3. Snelling Avenue at Marshall Avenue 4. Snelling Avenue at Thomas Avenue 5. Snelling Avenue at Hoyt Avenue 6. Snelling Avenue at St. Anthony Avenue (I-94 North Ramps) 7. Snelling Avenue at Concordia Avenue (I-94 South Ramps)

Snelling Avenue Rapid Bus VISSIM and TSP Benefit Evaluation Final Report July 2, 2013 Page 49
As funding sources allow, consider implementing TSP at the remaining 6 intersections showing the potential for net benefit due to TSP (listed from most potential benefit to least potential benefit):
1. 46th Street at 42nd Avenue 2. Snelling Avenue at Midway Parkway 3. 46th Street at 46th Avenue 4. Ford Parkway at Fairview Avenue 5. County Road B2 at Snelling Avenue at East Ramps 6. Ford Parkway at Cretin Avenue
As development of other Arterial BRT corridors proceeds, repeat the VISSIM analysis
process used in this study to assess the potential traffic impacts of the proposed stations and potential benefit of the use of TSP.
In addition to the use of TSP, consider the addition of vehicle and pedestrian detection to improve traffic flow along the Snelling Avenue Rapid Bus corridor. The addition of vehicle and pedestrian detection helps to improve traffic flow by minimizing the amount of green time given to phases with light traffic or pedestrian demand. Extra detection added as part of the Central Avenue TSP project, in combination with implementation of optimized signal timing plans, resulted in a significant improvement in bus travel times on that corridor.

Snelling Avenue Rapid Bus VISSIM and TSP Benefit Evaluation Final Report July 2, 2013 Page 50
7.0 APPENDIX
A. Meeting Minutes – December 5, 2012 Stakeholder Kickoff Meeting B. Detailed Slack Time Analysis Results C. Detailed VISSIM Modeling Output D. VISSIM Station Placement Aerial Images – Rapid Bus Refined Scenarios

APPENDIX A
MEETING MINUTES DECEMBER 5, 2012 STAKEHOLDER KICKOFF MEETING
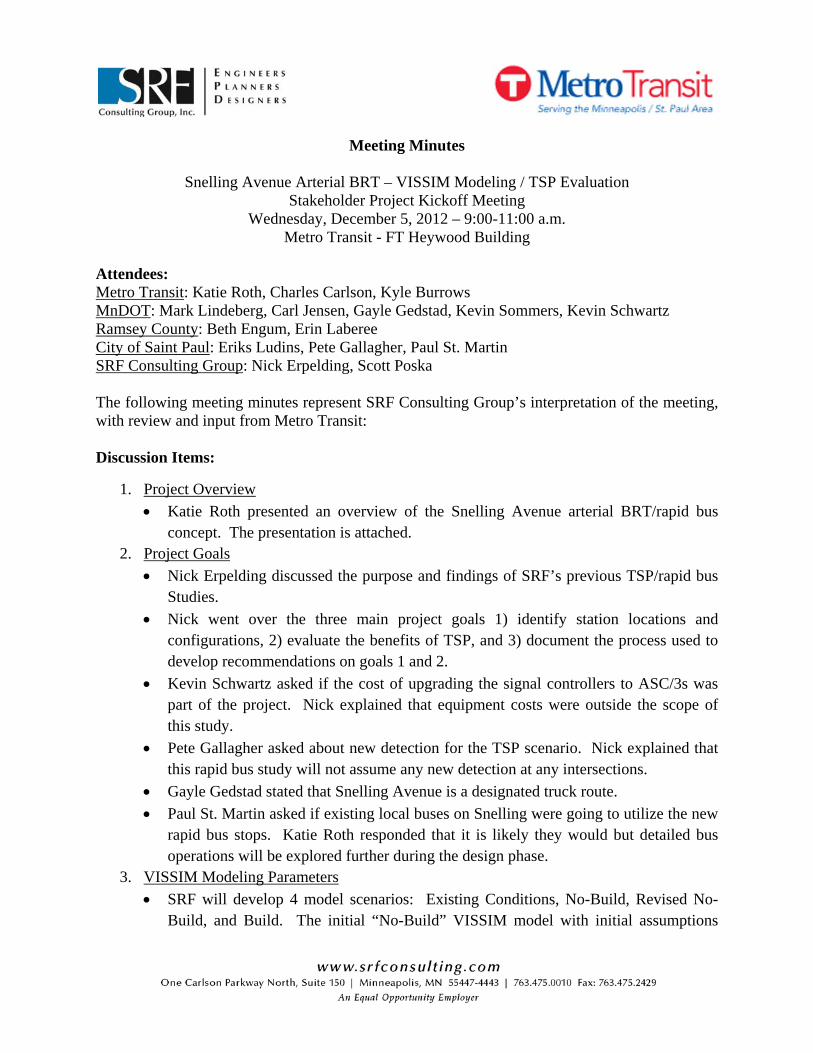
Meeting Minutes
Snelling Avenue Arterial BRT – VISSIM Modeling / TSP Evaluation Stakeholder Project Kickoff Meeting
Wednesday, December 5, 2012 – 9:00-11:00 a.m. Metro Transit - FT Heywood Building
Attendees: Metro Transit: Katie Roth, Charles Carlson, Kyle Burrows MnDOT: Mark Lindeberg, Carl Jensen, Gayle Gedstad, Kevin Sommers, Kevin Schwartz Ramsey County: Beth Engum, Erin Laberee City of Saint Paul: Eriks Ludins, Pete Gallagher, Paul St. Martin SRF Consulting Group: Nick Erpelding, Scott Poska The following meeting minutes represent SRF Consulting Group’s interpretation of the meeting, with review and input from Metro Transit: Discussion Items:
1. Project Overview
Katie Roth presented an overview of the Snelling Avenue arterial BRT/rapid bus concept. The presentation is attached.
2. Project Goals
Nick Erpelding discussed the purpose and findings of SRF’s previous TSP/rapid bus Studies.
Nick went over the three main project goals 1) identify station locations and configurations, 2) evaluate the benefits of TSP, and 3) document the process used to develop recommendations on goals 1 and 2.
Kevin Schwartz asked if the cost of upgrading the signal controllers to ASC/3s was part of the project. Nick explained that equipment costs were outside the scope of this study.
Pete Gallagher asked about new detection for the TSP scenario. Nick explained that this rapid bus study will not assume any new detection at any intersections.
Gayle Gedstad stated that Snelling Avenue is a designated truck route.
Paul St. Martin asked if existing local buses on Snelling were going to utilize the new rapid bus stops. Katie Roth responded that it is likely they would but detailed bus operations will be explored further during the design phase.
3. VISSIM Modeling Parameters
SRF will develop 4 model scenarios: Existing Conditions, No-Build, Revised No-Build, and Build. The initial “No-Build” VISSIM model with initial assumptions

Snelling TSP Evaluation Project Meeting Minutes December 5, 2012
Page 2
from Metro Transit on location and type of station (in travel lane/“bumpout” or not in travel lane). One of the goals for the mid-project progress meeting will be to identify where bumpout stations may present operational challenges and what alternatives may be available. SRF will incorporate these and other comments into the revised “No-Build” VISSIM models.
VISSIM MOEs will include intersection delay, LOS, queues, and rapid bus travel times.
Kevin Sommers would like the model to have four 15-minute input intervals to account for the peak hour factor.
Kevin Schwartz thought the following MnDOT operated intersections had the most pedestrian activity: Snelling/Larpenteur, Snelling/Co B, and Snelling/Co C.
4. TSP Benefit Calculation Process
Nick discussed the TSP calculation methodology including slack time analysis, split reductions, and delayed calls for near side stations.
Kevin Schwartz asked if Econolite controllers had better TSP logic compared to Siemens/Eagle controllers based on SRF’s previous TSP evaluation work. Nick replied that Econolite has the preferred TSP operation logic (until forthcoming firmware updates from Siemens are proven). All signals (except signals within Minneapolis) are likely to use ASC/3 controllers to implement TSP. For these reasons, modeling of TSP with the ASC/3 in VISSIM (as opposed to the default generic VISSIM controller) is proposed.
Kevin Schwartz asked if the TSP will be changed from unconditional to conditional. Katie Roth stated that Metro Transit will work with the appropriate agencies to determine appropriate conditions for use of TSP in the future, but this study is focused on determining the maximum benefit of TSP so will assume unconditional TSP.
Kevin Schwartz said the SBL movement at Snelling/Har Mar is given extra time during the Christmas peak period so TSP may not be beneficial at this intersection during that time of the year.
Pete Gallagher said that the City operates a special timing plan along Snelling during the State Fair.
Kevin Schwartz requested that the TSP calculation results and TSP timings be shared prior to use in the VISSIM model. Nick Erpelding agreed to share the results prior to final VISSIM runs, and noted that actual TSP timings to be used in the field will be reviewed by all appropriate stakeholders prior to turn-on.
Next Meeting: The next meeting will be a mid-project progress meeting, tentatively planned for early February 2013. SCP, NJE

Snelling TSP Evaluation Project Meeting Minutes December 5, 2012
Page 3
Attachments
1. Stakeholder Meeting #1 Sign-In sheet 2. Stakeholder Meeting #1 Agenda 3. Snelling Avenue Arterial BRT/Rapid Bus Concept Map 4. VISSIM modeling parameters 5. TSP benefit calculation process 6. Metro Transit Snelling Rapid Bus Presentation
[H:\Projects\7939\SD\PM\Meetings\2012-12-05 Stakeholder 1\2012-12-05 Stakeholder Mtg 1 Minutes.docx
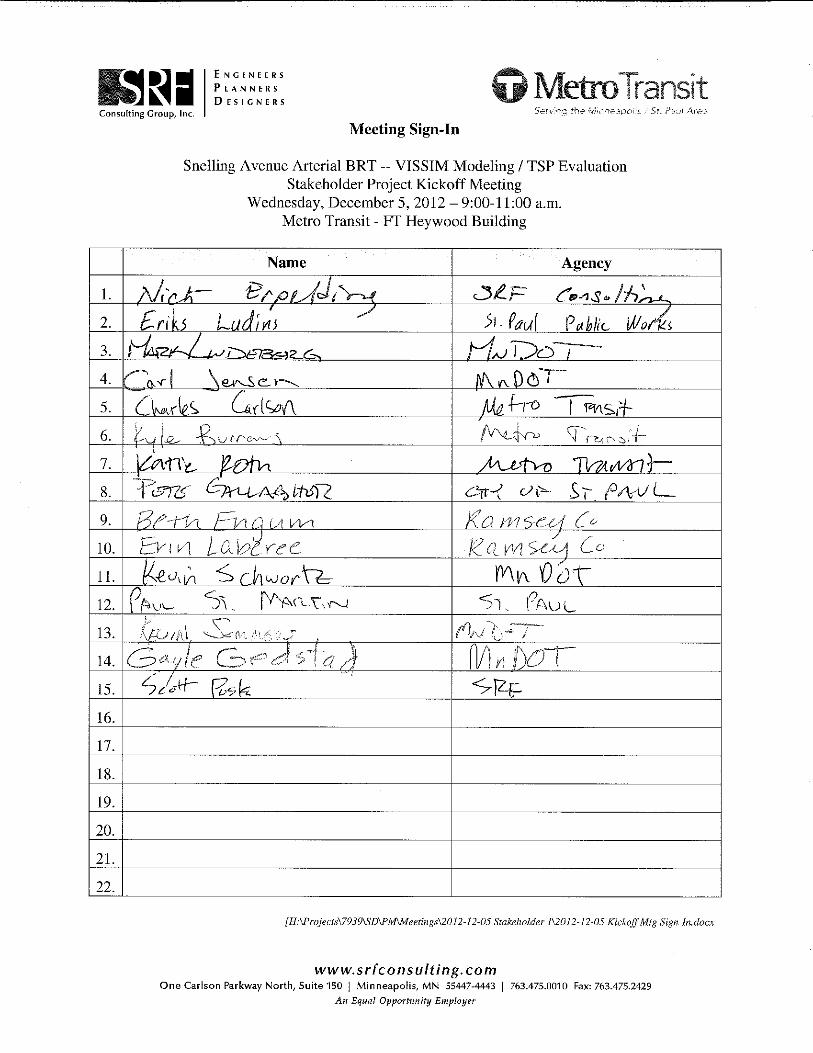

Meeting Agenda
Snelling Avenue Arterial BRT -- VISSIM Modeling / TSP Evaluation Stakeholder Project Kickoff Meeting
Wednesday, December 5, 2012 – 9:00-11:00 a.m. Metro Transit - FT Heywood Building
Attendees Invited: Metro Transit: Katie Roth, Charles Carlson, Claudius Toussaint, Kyle Burrows MnDOT: Mark Lindeberg, Brian Isaacson, Carl Jensen, Gayle Gedstad, Kevin Sommers, Kevin
Schwartz Ramsey County: Joe Lux, Beth Engum, Erin Laberee Hennepin County: Tom Johnson City of Saint Paul: Eriks Ludins, Brian Vitek, Pete Gallagher City of Minneapolis: Nick Van Gunst SRF Consulting Group: Nick Erpelding, Scott Poska Discussion Items:
1. Introductions 2. Project goals 3. VISSIM modeling parameters 4. TSP benefit calculation process 5. Other stakeholder input 6. Project schedule / Next Meeting Date
[H:\Projects\7939\SD\PM\Meetings\2012-12-05 Stakeholder 1\2012-12-05 Kickoff Mtg Agenda.docx
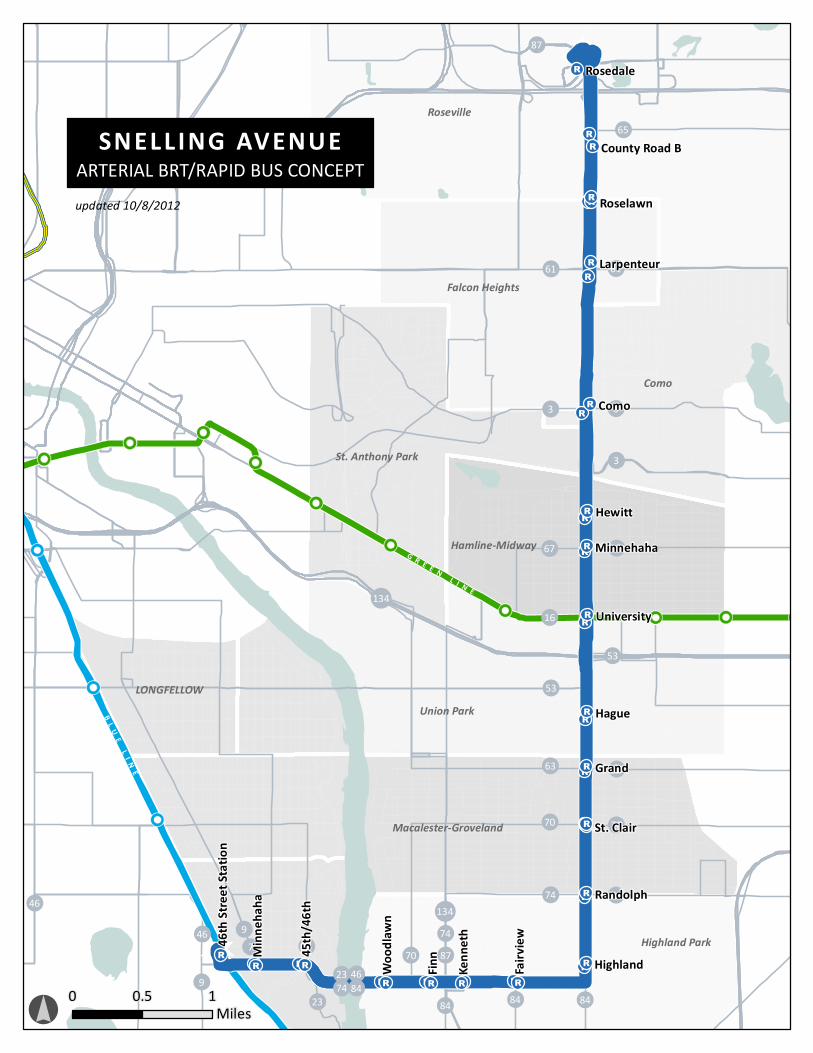
!53
!70
!16
!9
!3
!65
!63
!46
!7 !87
!134
!67!67
!70
!63
!70
!74 !74!134
!84 !84!84
!23
!23
!74
!9
!46
!3
!3!3
!61
!87
!23!74!
46!84
!65
!61
!53
R
R
R
R
R
R
R
R
R
R
R
R
RRRRR
RRR R RR R R R
R
R
RR
R
R
R
RR
R
R
R
R
R
G R E E N L I N E
B L UE L I N
E
Highland Park
Union Park
Como
St. Anthony Park
Macalester-Groveland
Hamline-Midway
LONGFELLOW
Roseville
Falcon Heights
Hague
Hewitt
Roselawn
HighlandFairvi
ew
Wood
lawn
Rosedale
University
46th
Stree
t Stat
ion
ComoFin
n
Grand
Kenn
eth
Randolph
Minnehaha
St. Clair
45th/
46th
Minn
ehah
aLarpenteur
County Road B
!°0 0.5 1
Miles
SNELLING AVENUEARTERIAL BRT/RAPID BUS CONCEPTupdated 10/8/2012

Snelling Avenue BRTVISSIM Modeling Assumptions
Scenario Existing
No‐Build
(Draft)
No‐Build
(Final) Build
Description w/Rapid Bus w/Rapid Bus
w/Rapid Bus
and TSP
Scenario Number 1‐2 3‐4 5‐6 7‐8
Design year 2013 2013 2013 2013
Roadway Geometry
Existing roadway geometry, with (1), (2) and (3)
Basic geometry (four approaches per intersection)
Signal Timing
Existing Minneapolis Signal Timing, plus (4)
Proposed St Paul SPART Signal Timing (SRF, 2013), plus (1)
Existing Ramsey County Signal Timing
Existing MnDOT Signal Timing
Existing/standard detection
Traffic Volumes
Pedestrians at heavy volume intersections ‐ 2012 counts
‐up to 8 intersections, list TBD
Vehicles ‐ 2012 counts
Heavy Vehicles (Trucks and buses) ‐ 2012 counts
Vehicle speeds per posted speed limits
Origin/Destination ‐ typical CUBE matrix estimation
Transit Operations
Existing Hiawatha LRT Operations
Proposed CC LRT Operations
‐headways
‐dwell times
‐LRT vehicle size
Proposed Snelling Rapid Bus
‐actual route origin/destination
‐headways
‐occupancy
‐station‐specific dwell times
Currently proposed Rapid Bus station configurations
‐primarily bumput‐style; bus stops in travel lane
Revised Rapid Bus station configurations
‐eliminate bumput in congested areas
Proposed TSP signal timing
MOEs / Reporting
MOEs ‐ average of 5 runs (min.)
‐Network + intersection delay / LOS
‐v/c ratio
‐maximum queues
‐Rapid Bus corridor travel time
Animations (1 per scenario)
Notes:
(1) Snelling/University: Central Corridor LRT roadway geometry (KHA) and signal timings (AECOM)
(2) Ford Parkway: reconstruction between Snelling and Howell
(3) 46th/Minnehaha: intersection reconstruction
(4) 46th/Hiawatha‐signal retiming
SRF Consulting Group Page 1 of 1 December 5, 2012
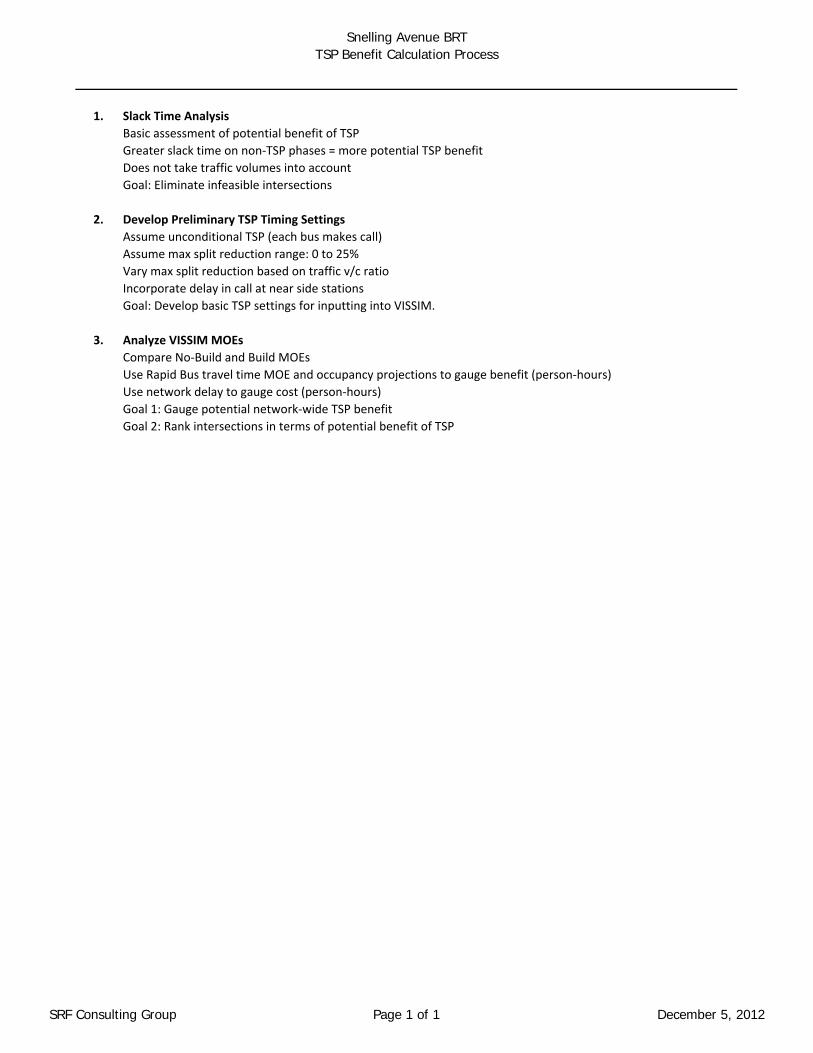
Snelling Avenue BRTTSP Benefit Calculation Process
1. Slack Time Analysis
Basic assessment of potential benefit of TSP
Greater slack time on non‐TSP phases = more potential TSP benefit
Does not take traffic volumes into account
Goal: Eliminate infeasible intersections
2. Develop Preliminary TSP Timing Settings
Assume unconditional TSP (each bus makes call)
Assume max split reduction range: 0 to 25%
Vary max split reduction based on traffic v/c ratio
Incorporate delay in call at near side stations
Goal: Develop basic TSP settings for inputting into VISSIM.
3. Analyze VISSIM MOEs
Compare No‐Build and Build MOEs
Use Rapid Bus travel time MOE and occupancy projections to gauge benefit (person‐hours)
Use network delay to gauge cost (person‐hours)
Goal 1: Gauge potential network‐wide TSP benefit
Goal 2: Rank intersections in terms of potential benefit of TSP
SRF Consulting Group Page 1 of 1 December 5, 2012
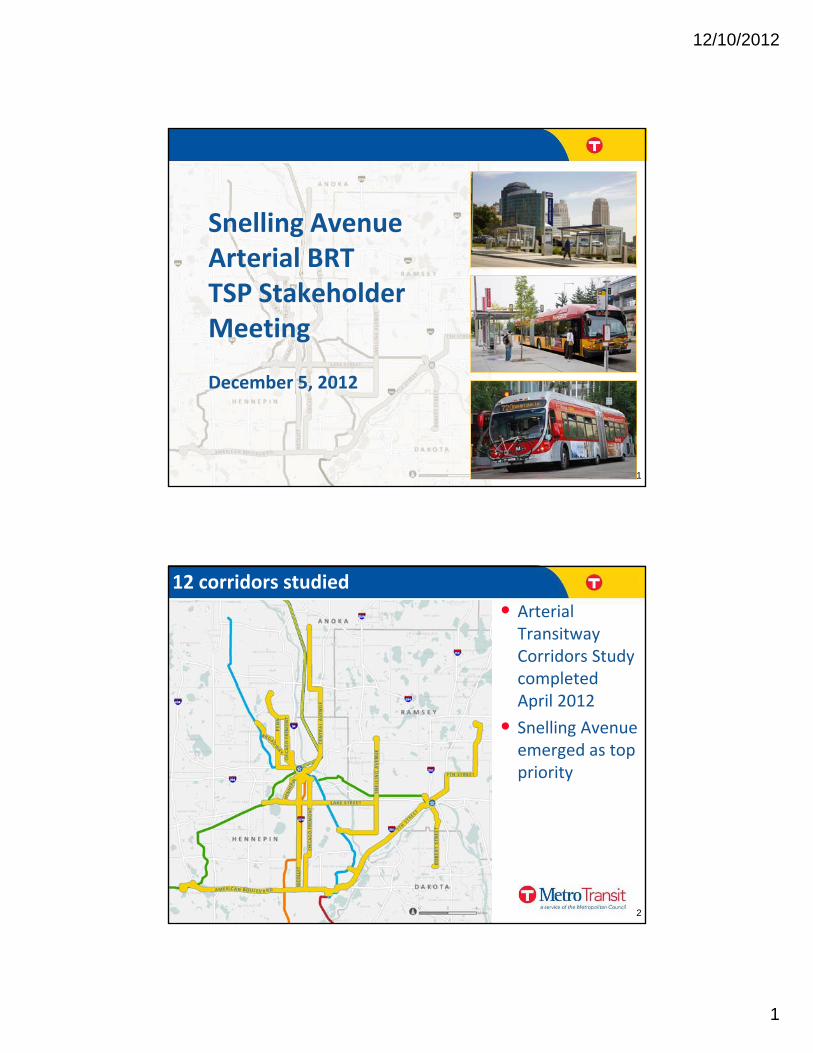
12/10/2012
1
Snelling Avenuei lArterial BRT
TSP Stakeholder Meeting
1
December 5, 2012
12 corridors studied
• Arterial Transitway Corridors Study completed pApril 2012
• Snelling Avenueemerged as top priority
2

12/10/2012
2
Snelling Avenue
• 9.6 miles
• 20 stations
• 2 METRO connections
• St. Paul, Minneapolis, Falcon Heights, Roseville
• $25 million to build (2013 dollars)
3
Key transit challenges
• Slow transit speeds caused by significant boarding and signal
• Lack of attractive, easily identified facilities
1,000
delay
42%Moving
23%Red Light
3% Traffic
,weekdayboardings
4
Moving
32%Boarding
Based on Route 18 NB observation, American Blvd to 5th/Nicollet
4,000weekdayboardings

12/10/2012
3
Transit moves people in these corridors
However, traditional roadway space allocation leads to slower transit
SouthboundSnelling Avenueat Minnehaha Avenue
speeds.
5
Narrow sidewalk with no space for transit shelter or customer
information
The rapid bus solution
Faster Service with Less Waiting
Improved Experience for More Customers
Limited stop service
Improved service frequency
Off‐board fare payment
All‐door boarding
Curb extensions/raised curbs
F id i l f
Real‐time “next bus” signage
Security cameras
Heated shelters
Trash receptacles
Station lighting
Bik k
6
Far side station platforms
Signal timing and priority
Increased snow removal
Bike racks
Wayfinding signage
Common look/identity

12/10/2012
4
Adaptable Stations, Consistent Identity
Kansas City
SeattleCONCEPTUAL DESIGNS
Marshall & Cleveland Ave
7
T
LOCALN O P A R K I N G( B U S T A P E R )
Typical Existing Condition
> >>> >
> >>> >
( B U S T A P E R )
N O P A R K I N G
>> > >>
>> > >>
8
T
LOCALN O P A R K I N G( B U S T A P E R )
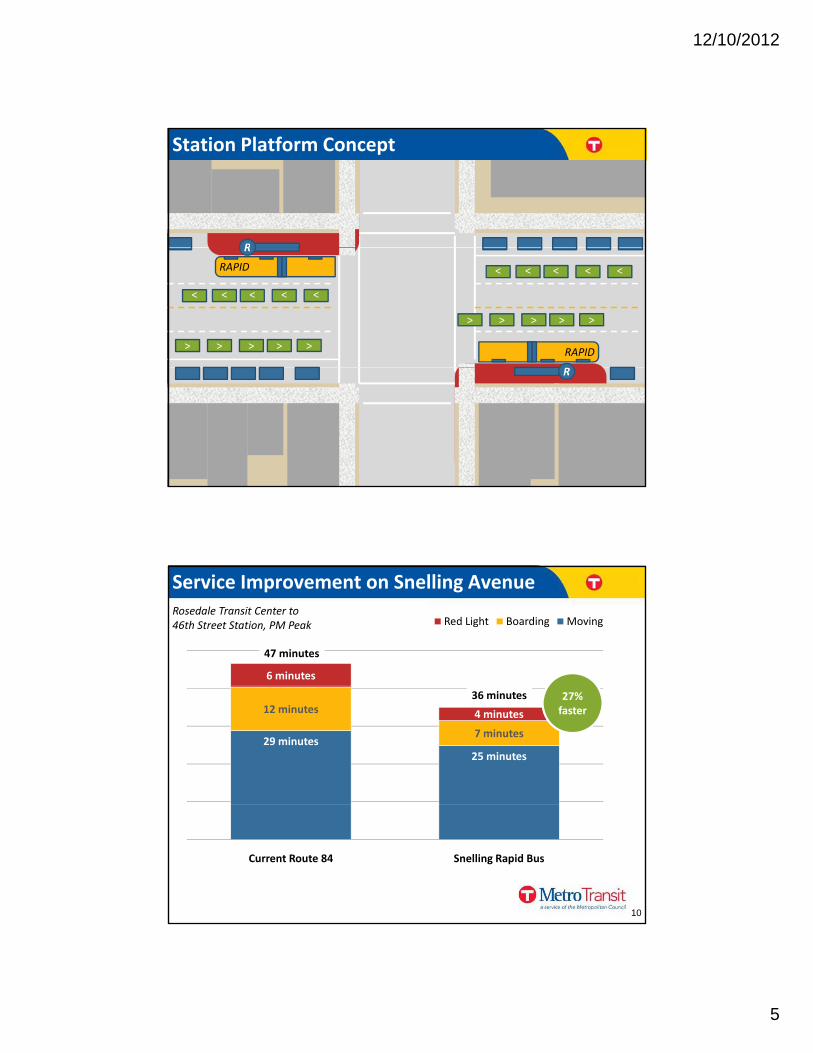
12/10/2012
5
R
Station Platform Concept
RAPID
R
RAPID
> >>> >
> >>> >
>> > >>
>> > >>
9
R
Service Improvement on Snelling Avenue
6 minutes
Red Light Boarding Moving
47 minutes
Rosedale Transit Center to 46th Street Station, PM Peak
29 minutes25 minutes
12 minutes
7 minutes
4 minutes
27% faster
36 minutes
10
Current Route 84 Snelling Rapid Bus

12/10/2012
6
Snelling Avenue Corridor Timeline
• Complete Feasibility Study
• Advance Concept Planning
• Initiate System Element Decisions
• Engage Stakeholders
• Secure Full Funding
• Design System Elements
• Complete P li i
• Complete Final Corridor Design
• Begin Construction
• Complete Construction
• Prepare for Revenue Service
• Open to Public
11
Decisions
• Pre‐Outreach
• Initiate Traffic Study
Preliminary Corridor Design
• Gain NEPA Clearance

APPENDIX B
DETAILED SLACK TIME ANALYSIS RESULTS
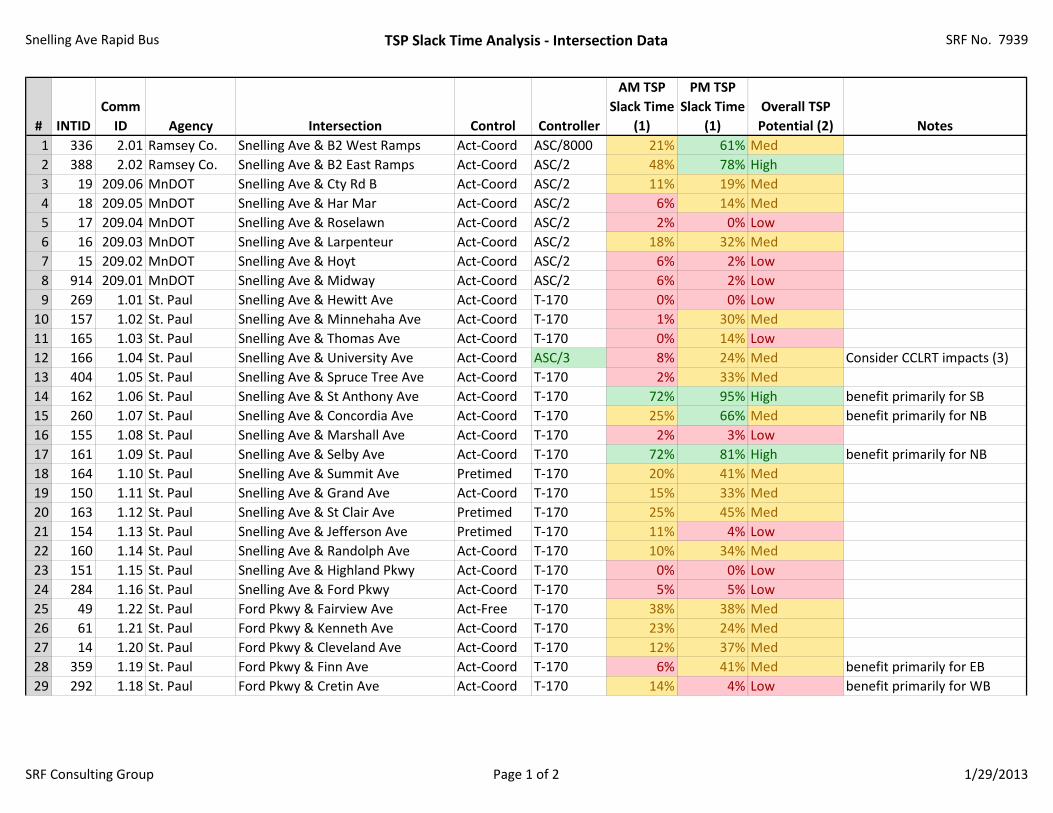
Snelling Ave Rapid Bus TSP Slack Time Analysis ‐ Intersection Data SRF No. 7939
# INTID
Comm
ID Agency Intersection Control Controller
AM TSP
Slack Time
(1)
PM TSP
Slack Time
(1)
Overall TSP
Potential (2) Notes
1 336 2.01 Ramsey Co. Snelling Ave & B2 West Ramps Act‐Coord ASC/8000 21% 61% Med
2 388 2.02 Ramsey Co. Snelling Ave & B2 East Ramps Act‐Coord ASC/2 48% 78% High
3 19 209.06 MnDOT Snelling Ave & Cty Rd B Act‐Coord ASC/2 11% 19% Med
4 18 209.05 MnDOT Snelling Ave & Har Mar Act‐Coord ASC/2 6% 14% Med
5 17 209.04 MnDOT Snelling Ave & Roselawn Act‐Coord ASC/2 2% 0% Low
6 16 209.03 MnDOT Snelling Ave & Larpenteur Act‐Coord ASC/2 18% 32% Med
7 15 209.02 MnDOT Snelling Ave & Hoyt Act‐Coord ASC/2 6% 2% Low
8 914 209.01 MnDOT Snelling Ave & Midway Act‐Coord ASC/2 6% 2% Low
9 269 1.01 St. Paul Snelling Ave & Hewitt Ave Act‐Coord T‐170 0% 0% Low
10 157 1.02 St. Paul Snelling Ave & Minnehaha Ave Act‐Coord T‐170 1% 30% Med
11 165 1.03 St. Paul Snelling Ave & Thomas Ave Act‐Coord T‐170 0% 14% Low
12 166 1.04 St. Paul Snelling Ave & University Ave Act‐Coord ASC/3 8% 24% Med Consider CCLRT impacts (3)
13 404 1.05 St. Paul Snelling Ave & Spruce Tree Ave Act‐Coord T‐170 2% 33% Med
14 162 1.06 St. Paul Snelling Ave & St Anthony Ave Act‐Coord T‐170 72% 95% High benefit primarily for SB
15 260 1.07 St. Paul Snelling Ave & Concordia Ave Act‐Coord T‐170 25% 66% Med benefit primarily for NB
16 155 1.08 St. Paul Snelling Ave & Marshall Ave Act‐Coord T‐170 2% 3% Low
17 161 1.09 St. Paul Snelling Ave & Selby Ave Act‐Coord T‐170 72% 81% High benefit primarily for NB
18 164 1.10 St. Paul Snelling Ave & Summit Ave Pretimed T‐170 20% 41% Med
19 150 1.11 St. Paul Snelling Ave & Grand Ave Act‐Coord T‐170 15% 33% Med
20 163 1.12 St. Paul Snelling Ave & St Clair Ave Pretimed T‐170 25% 45% Med
21 154 1.13 St. Paul Snelling Ave & Jefferson Ave Pretimed T‐170 11% 4% Low
22 160 1.14 St. Paul Snelling Ave & Randolph Ave Act‐Coord T‐170 10% 34% Med
23 151 1.15 St. Paul Snelling Ave & Highland Pkwy Act‐Coord T‐170 0% 0% Low
24 284 1.16 St. Paul Snelling Ave & Ford Pkwy Act‐Coord T‐170 5% 5% Low
25 49 1.22 St. Paul Ford Pkwy & Fairview Ave Act‐Free T‐170 38% 38% Med
26 61 1.21 St. Paul Ford Pkwy & Kenneth Ave Act‐Coord T‐170 23% 24% Med
27 14 1.20 St. Paul Ford Pkwy & Cleveland Ave Act‐Coord T‐170 12% 37% Med
28 359 1.19 St. Paul Ford Pkwy & Finn Ave Act‐Coord T‐170 6% 41% Med benefit primarily for EB
29 292 1.18 St. Paul Ford Pkwy & Cretin Ave Act‐Coord T‐170 14% 4% Low benefit primarily for WB
SRF Consulting Group Page 1 of 2 1/29/2013

Snelling Ave Rapid Bus TSP Slack Time Analysis ‐ Intersection Data SRF No. 7939
# INTID
Comm
ID Agency Intersection Control Controller
AM TSP
Slack Time
(1)
PM TSP
Slack Time
(1)
Overall TSP
Potential (2) Notes
30 835 3.01 Minneapolis 46th & 46th Act‐Coord EPAC 22% 31% Med
31 783 3.02 Minneapolis 46th & 42nd Pretimed EPAC 30% 31% Med
32 54 3.03 Minneapolis 46th & Minnehaha Pretimed EPAC 67% 116% High
33 23 3.04 Minneapolis Hiawatha & 46th Act‐Free NW 134% 134% High Avoid TSP ‐ LRT impacts (4)
34 179 3.05 Minneapolis 46th & 36th Act‐Free EPAC 71% 71% High
Notes:
(1) The percentage reported for "TSP Slack Time" reflects the average amount of slack time available for use by the TSP phase(s) at an intersection.
(2) Overall TSP Potential categorizes intersections by the average amount of slack time available for TSP. The ranges (0‐10%,10%‐50%,>50%) are arbitrary.
(3) Central Corridor LRT will use TSP on University Avenue. Special attention to be given to Snelling Avenue TSP impacts. See discussion in Section 2.4.
(4) Based on stakeholder input TSP to be avoided at Hiawatha/46th due to existing traffic operational issues on Hiawatha Avenue related to LRT. See Section 2.4.
SRF Consulting Group Page 2 of 2 1/29/2013

Snelling Ave Rapid Bus TSP Slack Time Analysis ‐ Timing Data SRF No. 7939
Intersection
IntID
Phase
Movement
Phasing
Min Green
Walk
Ped
Clear (FD
W)
Yellow
Red
Clear (All Red
)
Ped
Actuated
?
Min Split Incl. p
eds?
TSP phase?
Defau
lt M
in Split
Veh M
in Split
Ped
Min Split
Min Split
AM Pattern #
AM Cycle
AM Split
AM Slack Tim
e
AM TSP
Tim
e
AM TSP
Tim
e
(% of ex. Split)
PM Pattern #
PM Cycle
PM Split
PM Slack Tim
e
PM TSP
Tim
e
PM TSP
Tim
e
(% of ex. Split)
1 1 EBL Prot 7 3 1 15 12 ‐ 15 233 100 26 11 ‐ ‐ 433 100 31 16 ‐ ‐
1 2 WB Mainline 15 7 13 4 1 Yes Yes 20 21 26 26 233 100 26 0 ‐ ‐ 433 100 38 12 ‐ ‐
1 3 ‐ ‐ ‐ ‐ 233 100 ‐ ‐ ‐ 433 100 ‐ ‐ ‐
1 4 NB X‐Street 10 7 15 3 1.7 Yes Yes Yes 18 16 28 28 233 100 28 0 9 32% 433 100 31 3 26 84%
1 5 WBL Prot 7 3 1 Yes 15 12 ‐ 15 233 100 22 7 2 9% 433 100 32 17 12 38%
1 6 EB Mainline 15 7 15 4 1 Yes Yes 20 21 28 28 233 100 30 2 ‐ ‐ 433 100 37 9 ‐ ‐
1 7 NBL P/P 7 3 1 13 12 ‐ 13 233 100 12 0 ‐ ‐ 433 100 16 3 ‐ ‐
1 8 SB X‐Street 10 3.5 1.4 18 16 ‐ 18 233 100 16 0 ‐ ‐ 433 100 15 0 ‐ ‐
2 1 EBL P/P 5 3 1 13 10 ‐ 13 233 100 28 15 ‐ ‐ 433 100 38 25 ‐ ‐
2 2 WB Mainline 15 3.5 1.1 20 21 ‐ 21 233 100 21 0 ‐ ‐ 433 100 25 4 ‐ ‐
2 3 ‐ ‐ ‐ ‐ 233 100 ‐ ‐ ‐ 433 100 ‐ ‐ ‐
2 4 ‐ ‐ ‐ ‐ 233 100 ‐ ‐ ‐ 433 100 ‐ ‐ ‐
2 5 ‐ ‐ ‐ ‐ 233 100 ‐ ‐ ‐ 433 100 ‐ ‐ ‐
2 6 EB Mainline 15 3.5 1.1 20 21 ‐ 21 233 100 49 28 ‐ ‐ 433 100 63 42 ‐ ‐
2 7 ‐ ‐ ‐ ‐ 233 100 ‐ ‐ ‐ 433 100 ‐ ‐ ‐
2 8 SB X‐Street 7 8 25 3 1.6 Yes Yes Yes 18 13 39 39 233 100 31 0 15 48% 433 100 37 0 29 78%
3 1 SBL Prot 7 3 2 15 13 ‐ 15 5 180 21 6 ‐ ‐ 6 180 29 14 ‐ ‐
3 2 NB Mainline 15 7 23 4.5 1.5 Yes Yes Yes 20 22 37 37 5 180 120 83 11 9% 6 180 100 63 20 20%
3 3 WBL P/P 5 3 2 13 11 ‐ 13 5 180 18 5 ‐ ‐ 6 180 19 6 ‐ ‐
3 4 EB X‐Street 10 7 30 4 3 Yes Yes 18 18 45 45 5 180 21 0 ‐ ‐ 6 180 32 0 ‐ ‐
3 5 NBL Prot 7 3 2 15 13 ‐ 15 5 180 25 10 ‐ ‐ 6 180 27 12 ‐ ‐
3 6 SB Mainline 15 7 23 5 1.5 Yes Yes Yes 20 22 37 37 5 180 116 79 15 13% 6 180 102 65 18 18%
3 7 EBL P/P 5 3 2 13 11 ‐ 13 5 180 18 5 ‐ ‐ 6 180 19 6 ‐ ‐
3 8 WB X‐Street 10 7 30 4 3 Yes Yes 18 18 45 45 5 180 21 0 ‐ ‐ 6 180 32 0 ‐ ‐
4 1 SBL Prot 7 3 2 15 13 ‐ 15 5 180 21 6 ‐ ‐ 6 180 34 19 ‐ ‐
4 2 NB Mainline 20 7 13 4.5 1.5 Yes Yes Yes 20 27 27 27 5 180 127 100 6 5% 6 180 97 70 19 20%
4 3 WB X‐Street 8 7 24 3.5 2 Yes Yes 18 14 37 37 5 180 16 0 ‐ ‐ 6 180 24 0 ‐ ‐
4 4 EB X‐Street 11 7 22 3.5 2 Yes Yes 18 17 35 35 5 180 16 0 ‐ ‐ 6 180 25 0 ‐ ‐
4 5 NBL Prot 7 3 2 15 13 ‐ 15 5 180 25 10 ‐ ‐ 6 180 24 9 ‐ ‐
4 6 SB Mainline 20 7 18 4.5 1.5 Yes Yes Yes 20 27 32 32 5 180 123 91 10 8% 6 180 107 75 9 8%
4 7 ‐ ‐ ‐ ‐ 5 180 ‐ ‐ ‐ 6 180 ‐ ‐ ‐
4 8 ‐ ‐ ‐ ‐ 5 180 ‐ ‐ ‐ 6 180 ‐ ‐ ‐
Snelling Ave & B2 W
est
Ram
ps
Snelling Ave & B2 East
Ram
ps
Snelling Ave & Cty Rd B
Snelling Ave & Har M
ar
SRF Consulting Group Page 1 of 9 1/28/2013
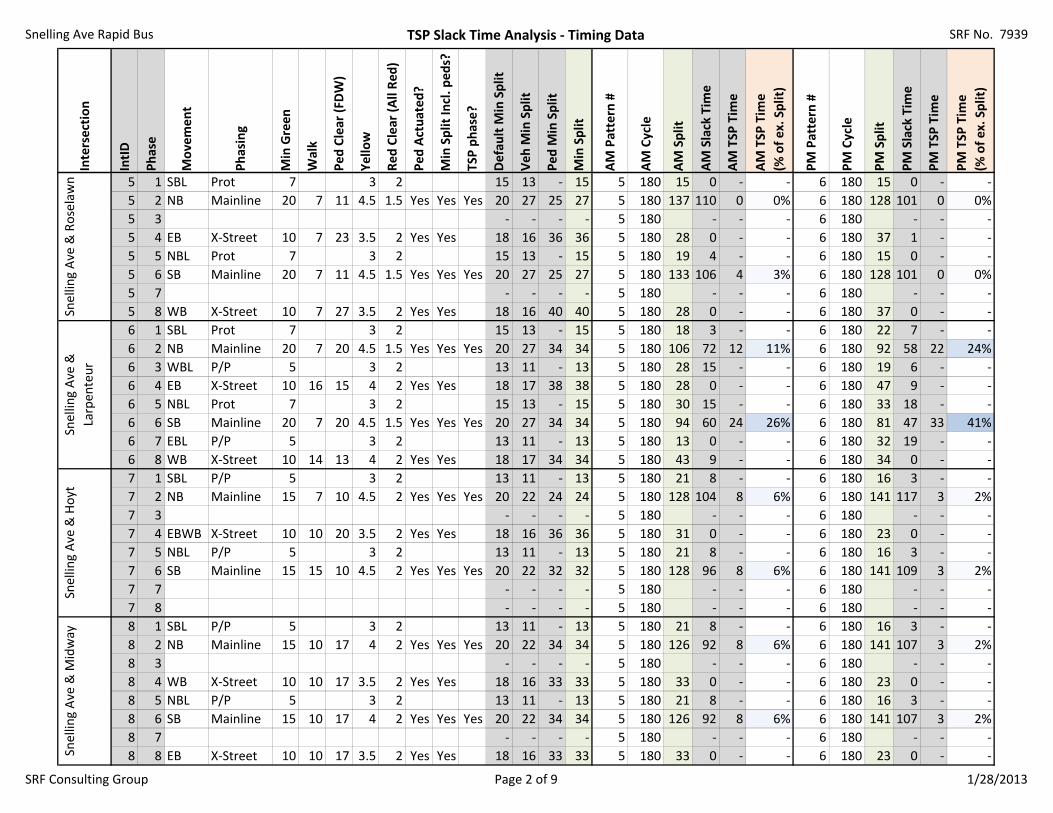
Snelling Ave Rapid Bus TSP Slack Time Analysis ‐ Timing Data SRF No. 7939
Intersection
IntID
Phase
Movement
Phasing
Min Green
Walk
Ped
Clear (FD
W)
Yellow
Red
Clear (All Red
)
Ped
Actuated
?
Min Split Incl. p
eds?
TSP phase?
Defau
lt M
in Split
Veh M
in Split
Ped
Min Split
Min Split
AM Pattern #
AM Cycle
AM Split
AM Slack Tim
e
AM TSP
Tim
e
AM TSP
Tim
e
(% of ex. Split)
PM Pattern #
PM Cycle
PM Split
PM Slack Tim
e
PM TSP
Tim
e
PM TSP
Tim
e
(% of ex. Split)
5 1 SBL Prot 7 3 2 15 13 ‐ 15 5 180 15 0 ‐ ‐ 6 180 15 0 ‐ ‐
5 2 NB Mainline 20 7 11 4.5 1.5 Yes Yes Yes 20 27 25 27 5 180 137 110 0 0% 6 180 128 101 0 0%
5 3 ‐ ‐ ‐ ‐ 5 180 ‐ ‐ ‐ 6 180 ‐ ‐ ‐
5 4 EB X‐Street 10 7 23 3.5 2 Yes Yes 18 16 36 36 5 180 28 0 ‐ ‐ 6 180 37 1 ‐ ‐
5 5 NBL Prot 7 3 2 15 13 ‐ 15 5 180 19 4 ‐ ‐ 6 180 15 0 ‐ ‐
5 6 SB Mainline 20 7 11 4.5 1.5 Yes Yes Yes 20 27 25 27 5 180 133 106 4 3% 6 180 128 101 0 0%
5 7 ‐ ‐ ‐ ‐ 5 180 ‐ ‐ ‐ 6 180 ‐ ‐ ‐
5 8 WB X‐Street 10 7 27 3.5 2 Yes Yes 18 16 40 40 5 180 28 0 ‐ ‐ 6 180 37 0 ‐ ‐
6 1 SBL Prot 7 3 2 15 13 ‐ 15 5 180 18 3 ‐ ‐ 6 180 22 7 ‐ ‐
6 2 NB Mainline 20 7 20 4.5 1.5 Yes Yes Yes 20 27 34 34 5 180 106 72 12 11% 6 180 92 58 22 24%
6 3 WBL P/P 5 3 2 13 11 ‐ 13 5 180 28 15 ‐ ‐ 6 180 19 6 ‐ ‐
6 4 EB X‐Street 10 16 15 4 2 Yes Yes 18 17 38 38 5 180 28 0 ‐ ‐ 6 180 47 9 ‐ ‐
6 5 NBL Prot 7 3 2 15 13 ‐ 15 5 180 30 15 ‐ ‐ 6 180 33 18 ‐ ‐
6 6 SB Mainline 20 7 20 4.5 1.5 Yes Yes Yes 20 27 34 34 5 180 94 60 24 26% 6 180 81 47 33 41%
6 7 EBL P/P 5 3 2 13 11 ‐ 13 5 180 13 0 ‐ ‐ 6 180 32 19 ‐ ‐
6 8 WB X‐Street 10 14 13 4 2 Yes Yes 18 17 34 34 5 180 43 9 ‐ ‐ 6 180 34 0 ‐ ‐
7 1 SBL P/P 5 3 2 13 11 ‐ 13 5 180 21 8 ‐ ‐ 6 180 16 3 ‐ ‐
7 2 NB Mainline 15 7 10 4.5 2 Yes Yes Yes 20 22 24 24 5 180 128 104 8 6% 6 180 141 117 3 2%
7 3 ‐ ‐ ‐ ‐ 5 180 ‐ ‐ ‐ 6 180 ‐ ‐ ‐
7 4 EBWB X‐Street 10 10 20 3.5 2 Yes Yes 18 16 36 36 5 180 31 0 ‐ ‐ 6 180 23 0 ‐ ‐
7 5 NBL P/P 5 3 2 13 11 ‐ 13 5 180 21 8 ‐ ‐ 6 180 16 3 ‐ ‐
7 6 SB Mainline 15 15 10 4.5 2 Yes Yes Yes 20 22 32 32 5 180 128 96 8 6% 6 180 141 109 3 2%
7 7 ‐ ‐ ‐ ‐ 5 180 ‐ ‐ ‐ 6 180 ‐ ‐ ‐
7 8 ‐ ‐ ‐ ‐ 5 180 ‐ ‐ ‐ 6 180 ‐ ‐ ‐
8 1 SBL P/P 5 3 2 13 11 ‐ 13 5 180 21 8 ‐ ‐ 6 180 16 3 ‐ ‐
8 2 NB Mainline 15 10 17 4 2 Yes Yes Yes 20 22 34 34 5 180 126 92 8 6% 6 180 141 107 3 2%
8 3 ‐ ‐ ‐ ‐ 5 180 ‐ ‐ ‐ 6 180 ‐ ‐ ‐
8 4 WB X‐Street 10 10 17 3.5 2 Yes Yes 18 16 33 33 5 180 33 0 ‐ ‐ 6 180 23 0 ‐ ‐
8 5 NBL P/P 5 3 2 13 11 ‐ 13 5 180 21 8 ‐ ‐ 6 180 16 3 ‐ ‐
8 6 SB Mainline 15 10 17 4 2 Yes Yes Yes 20 22 34 34 5 180 126 92 8 6% 6 180 141 107 3 2%
8 7 ‐ ‐ ‐ ‐ 5 180 ‐ ‐ ‐ 6 180 ‐ ‐ ‐
8 8 EB X‐Street 10 10 17 3.5 2 Yes Yes 18 16 33 33 5 180 33 0 ‐ ‐ 6 180 23 0 ‐ ‐
Snelling Ave & Roselawn
Snelling Ave &
Larpen
teur
Snelling Ave & Hoyt
Snelling Ave & M
idway
SRF Consulting Group Page 2 of 9 1/28/2013

Snelling Ave Rapid Bus TSP Slack Time Analysis ‐ Timing Data SRF No. 7939
Intersection
IntID
Phase
Movement
Phasing
Min Green
Walk
Ped
Clear (FD
W)
Yellow
Red
Clear (All Red
)
Ped
Actuated
?
Min Split Incl. p
eds?
TSP phase?
Defau
lt M
in Split
Veh M
in Split
Ped
Min Split
Min Split
AM Pattern #
AM Cycle
AM Split
AM Slack Tim
e
AM TSP
Tim
e
AM TSP
Tim
e
(% of ex. Split)
PM Pattern #
PM Cycle
PM Split
PM Slack Tim
e
PM TSP
Tim
e
PM TSP
Tim
e
(% of ex. Split)
9 1 SBL P/P 7 3 1 13 12 ‐ 13 AM 80 12 0 ‐ ‐ PM 90 13 0 ‐ ‐
9 2 NB Mainline 15 7 8 4 1 Yes Yes 20 21 21 21 AM 80 33 12 0 0% PM 90 42 21 0 0%
9 3 ‐ ‐ ‐ ‐ AM 80 ‐ ‐ ‐ PM 90 ‐ ‐ ‐
9 4 EBWB X‐Street 10 7 22 4 1 Yes 18 16 35 35 AM 80 35 0 ‐ ‐ PM 90 35 0 ‐ ‐
9 5 NBL P/P 7 3 1 13 12 ‐ 13 AM 80 12 0 ‐ ‐ PM 90 12 0 ‐ ‐
9 6 SB Mainline 15 7 8 4 1 Yes Yes 20 21 21 21 AM 80 33 12 0 0% PM 90 43 22 0 0%
9 7 ‐ ‐ ‐ ‐ AM 80 ‐ ‐ ‐ PM 90 ‐ ‐ ‐
9 8 ‐ ‐ ‐ ‐ AM 80 ‐ ‐ ‐ PM 90 ‐ ‐ ‐
10 1 SBL P/P 7 3 1 13 12 ‐ 13 AM 80 14 1 ‐ ‐ PM 90 13 0 ‐ ‐
10 2 NB Mainline 15 7 9 4 1 Yes Yes 20 21 22 22 AM 80 36 14 1 3% PM 90 36 14 11 31%
10 3 ‐ ‐ ‐ ‐ AM 80 ‐ ‐ ‐ PM 90 ‐ ‐ ‐
10 4 EBWB X‐Street 10 7 17 4 1 Yes 18 16 30 30 AM 80 30 0 ‐ ‐ PM 90 41 11 ‐ ‐
10 5 NBL P/P 7 3 1 13 12 ‐ 13 AM 80 12 0 ‐ ‐ PM 90 12 0 ‐ ‐
10 6 SB Mainline 15 7 10 4 1 Yes Yes 20 21 23 23 AM 80 38 15 0 0% PM 90 37 14 11 30%
10 7 ‐ ‐ ‐ ‐ AM 80 ‐ ‐ ‐ PM 90 ‐ ‐ ‐
10 8 ‐ ‐ ‐ ‐ AM 80 ‐ ‐ ‐ PM 90 ‐ ‐ ‐
11 1 SBL P/P 7 3 1 13 12 ‐ 13 AM 80 12 0 ‐ ‐ PM 90 14 1 ‐ ‐
11 2 NB Mainline 15 7 7 4 1 Yes Yes 20 21 20 21 AM 80 36 15 0 0% PM 90 39 18 6 15%
11 3 ‐ ‐ ‐ ‐ AM 80 ‐ ‐ ‐ PM 90 ‐ ‐ ‐
11 4 EBWB X‐Street 12 7 19 4 1 Yes 18 18 32 32 AM 80 32 0 ‐ ‐ PM 90 37 5 ‐ ‐
11 5 NBL P/P 7 3 1 13 12 ‐ 13 AM 80 13 0 ‐ ‐ PM 90 12 0 ‐ ‐
11 6 SB Mainline 15 7 8 4 1 Yes Yes 20 21 21 21 AM 80 35 14 0 0% PM 90 41 20 5 12%
11 7 ‐ ‐ ‐ ‐ AM 80 ‐ ‐ ‐ PM 90 ‐ ‐ ‐
11 8 ‐ ‐ ‐ ‐ AM 80 ‐ ‐ ‐ PM 90 ‐ ‐ ‐
12 1 SBL P/P 7 4 1 13 13 ‐ 13 AM 105 14 1 ‐ ‐ PM 130 19 6 ‐ ‐
12 2 NB Mainline 17 7 6 4 1 Yes Yes 20 23 19 23 AM 105 51 28 1 2% PM 130 55 32 16 29%
12 3 EBL Prot 7 4 1 15 13 ‐ 15 AM 105 13 0 ‐ ‐ PM 130 29 14 ‐ ‐
12 4 WB X‐Street 20 7 20 4 1 Yes 18 26 33 33 AM 105 27 0 ‐ ‐ PM 130 27 0 ‐ ‐
12 5 NBL P/P 7 4 1 13 13 ‐ 13 AM 105 19 6 ‐ ‐ PM 130 14 1 ‐ ‐
12 6 SB Mainline 17 7 6 4 1 Yes Yes 20 23 19 23 AM 105 46 23 6 13% PM 130 60 37 11 18%
12 7 WBL Prot 7 4 1 15 13 ‐ 15 AM 105 17 2 ‐ ‐ PM 130 25 10 ‐ ‐
12 8 EB X‐Street 20 7 19 4 1 Yes 18 26 32 32 AM 105 23 0 ‐ ‐ PM 130 31 0 ‐ ‐Snelling Ave & University
Ave
Snelling Ave & Hewitt
Ave
Snelling Ave &
Minnehaha Ave
Snelling Ave & Thomas
Ave
SRF Consulting Group Page 3 of 9 1/28/2013
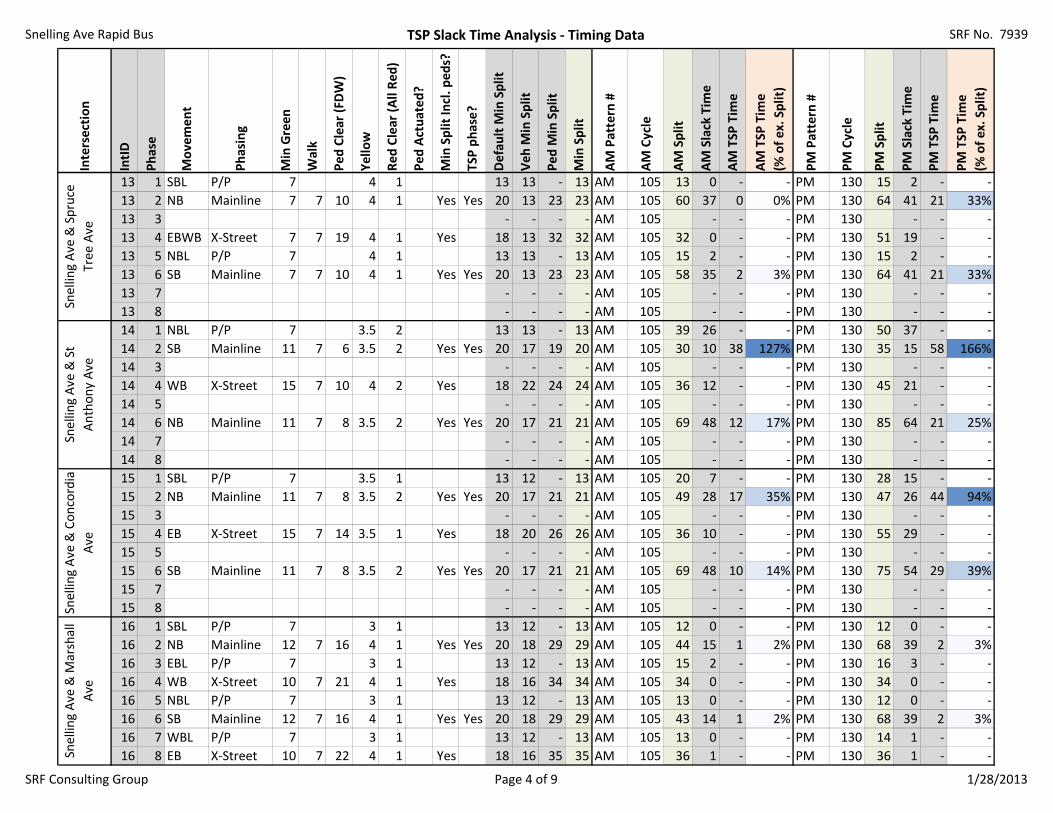
Snelling Ave Rapid Bus TSP Slack Time Analysis ‐ Timing Data SRF No. 7939
Intersection
IntID
Phase
Movement
Phasing
Min Green
Walk
Ped
Clear (FD
W)
Yellow
Red
Clear (All Red
)
Ped
Actuated
?
Min Split Incl. p
eds?
TSP phase?
Defau
lt M
in Split
Veh M
in Split
Ped
Min Split
Min Split
AM Pattern #
AM Cycle
AM Split
AM Slack Tim
e
AM TSP
Tim
e
AM TSP
Tim
e
(% of ex. Split)
PM Pattern #
PM Cycle
PM Split
PM Slack Tim
e
PM TSP
Tim
e
PM TSP
Tim
e
(% of ex. Split)
13 1 SBL P/P 7 4 1 13 13 ‐ 13 AM 105 13 0 ‐ ‐ PM 130 15 2 ‐ ‐
13 2 NB Mainline 7 7 10 4 1 Yes Yes 20 13 23 23 AM 105 60 37 0 0% PM 130 64 41 21 33%
13 3 ‐ ‐ ‐ ‐ AM 105 ‐ ‐ ‐ PM 130 ‐ ‐ ‐
13 4 EBWB X‐Street 7 7 19 4 1 Yes 18 13 32 32 AM 105 32 0 ‐ ‐ PM 130 51 19 ‐ ‐
13 5 NBL P/P 7 4 1 13 13 ‐ 13 AM 105 15 2 ‐ ‐ PM 130 15 2 ‐ ‐
13 6 SB Mainline 7 7 10 4 1 Yes Yes 20 13 23 23 AM 105 58 35 2 3% PM 130 64 41 21 33%
13 7 ‐ ‐ ‐ ‐ AM 105 ‐ ‐ ‐ PM 130 ‐ ‐ ‐
13 8 ‐ ‐ ‐ ‐ AM 105 ‐ ‐ ‐ PM 130 ‐ ‐ ‐
14 1 NBL P/P 7 3.5 2 13 13 ‐ 13 AM 105 39 26 ‐ ‐ PM 130 50 37 ‐ ‐
14 2 SB Mainline 11 7 6 3.5 2 Yes Yes 20 17 19 20 AM 105 30 10 38 127% PM 130 35 15 58 166%
14 3 ‐ ‐ ‐ ‐ AM 105 ‐ ‐ ‐ PM 130 ‐ ‐ ‐
14 4 WB X‐Street 15 7 10 4 2 Yes 18 22 24 24 AM 105 36 12 ‐ ‐ PM 130 45 21 ‐ ‐
14 5 ‐ ‐ ‐ ‐ AM 105 ‐ ‐ ‐ PM 130 ‐ ‐ ‐
14 6 NB Mainline 11 7 8 3.5 2 Yes Yes 20 17 21 21 AM 105 69 48 12 17% PM 130 85 64 21 25%
14 7 ‐ ‐ ‐ ‐ AM 105 ‐ ‐ ‐ PM 130 ‐ ‐ ‐
14 8 ‐ ‐ ‐ ‐ AM 105 ‐ ‐ ‐ PM 130 ‐ ‐ ‐
15 1 SBL P/P 7 3.5 1 13 12 ‐ 13 AM 105 20 7 ‐ ‐ PM 130 28 15 ‐ ‐
15 2 NB Mainline 11 7 8 3.5 2 Yes Yes 20 17 21 21 AM 105 49 28 17 35% PM 130 47 26 44 94%
15 3 ‐ ‐ ‐ ‐ AM 105 ‐ ‐ ‐ PM 130 ‐ ‐ ‐
15 4 EB X‐Street 15 7 14 3.5 1 Yes 18 20 26 26 AM 105 36 10 ‐ ‐ PM 130 55 29 ‐ ‐
15 5 ‐ ‐ ‐ ‐ AM 105 ‐ ‐ ‐ PM 130 ‐ ‐ ‐
15 6 SB Mainline 11 7 8 3.5 2 Yes Yes 20 17 21 21 AM 105 69 48 10 14% PM 130 75 54 29 39%
15 7 ‐ ‐ ‐ ‐ AM 105 ‐ ‐ ‐ PM 130 ‐ ‐ ‐
15 8 ‐ ‐ ‐ ‐ AM 105 ‐ ‐ ‐ PM 130 ‐ ‐ ‐
16 1 SBL P/P 7 3 1 13 12 ‐ 13 AM 105 12 0 ‐ ‐ PM 130 12 0 ‐ ‐
16 2 NB Mainline 12 7 16 4 1 Yes Yes 20 18 29 29 AM 105 44 15 1 2% PM 130 68 39 2 3%
16 3 EBL P/P 7 3 1 13 12 ‐ 13 AM 105 15 2 ‐ ‐ PM 130 16 3 ‐ ‐
16 4 WB X‐Street 10 7 21 4 1 Yes 18 16 34 34 AM 105 34 0 ‐ ‐ PM 130 34 0 ‐ ‐
16 5 NBL P/P 7 3 1 13 12 ‐ 13 AM 105 13 0 ‐ ‐ PM 130 12 0 ‐ ‐
16 6 SB Mainline 12 7 16 4 1 Yes Yes 20 18 29 29 AM 105 43 14 1 2% PM 130 68 39 2 3%
16 7 WBL P/P 7 3 1 13 12 ‐ 13 AM 105 13 0 ‐ ‐ PM 130 14 1 ‐ ‐
16 8 EB X‐Street 10 7 22 4 1 Yes 18 16 35 35 AM 105 36 1 ‐ ‐ PM 130 36 1 ‐ ‐
Snelling Ave & Spruce
Tree Ave
Snelling Ave & St
Anthony Ave
Snelling Ave & Concordia
Ave
Snelling Ave & M
arshall
Ave
SRF Consulting Group Page 4 of 9 1/28/2013

Snelling Ave Rapid Bus TSP Slack Time Analysis ‐ Timing Data SRF No. 7939
Intersection
IntID
Phase
Movement
Phasing
Min Green
Walk
Ped
Clear (FD
W)
Yellow
Red
Clear (All Red
)
Ped
Actuated
?
Min Split Incl. p
eds?
TSP phase?
Defau
lt M
in Split
Veh M
in Split
Ped
Min Split
Min Split
AM Pattern #
AM Cycle
AM Split
AM Slack Tim
e
AM TSP
Tim
e
AM TSP
Tim
e
(% of ex. Split)
PM Pattern #
PM Cycle
PM Split
PM Slack Tim
e
PM TSP
Tim
e
PM TSP
Tim
e
(% of ex. Split)
17 1 SBL P/P 7 4 1 13 13 ‐ 13 AM 105 20 7 ‐ ‐ PM 130 39 26 ‐ ‐
17 2 NB Mainline 15 7 10 4 1 Yes Yes 20 21 23 23 AM 105 32 9 31 97% PM 130 38 15 50 132%
17 3 ‐ ‐ ‐ ‐ AM 105 ‐ ‐ ‐ PM 130 ‐ ‐ ‐
17 4 EBWB X‐Street 12 7 16 4 1 Yes 18 18 29 29 AM 105 53 24 ‐ ‐ PM 130 53 24 ‐ ‐
17 5 ‐ ‐ ‐ ‐ AM 105 ‐ ‐ ‐ PM 130 ‐ ‐ ‐
17 6 SB Mainline 15 7 13 4 1 Yes Yes 20 21 26 26 AM 105 52 26 24 46% PM 130 77 51 24 31%
17 7 ‐ ‐ ‐ ‐ AM 105 ‐ ‐ ‐ PM 130 ‐ ‐ ‐
17 8 ‐ ‐ ‐ ‐ AM 105 ‐ ‐ ‐ PM 130 ‐ ‐ ‐
18 1 ‐ ‐ ‐ ‐ AM 105 ‐ ‐ ‐ PM 110 ‐ ‐ ‐
18 2 NBSB Mainline 10 7 10 4.5 1.5 Yes Yes 20 17 24 24 AM 105 65 41 13 20% PM 110 59 35 24 41%
18 3 ‐ ‐ ‐ ‐ AM 105 ‐ ‐ ‐ PM 110 ‐ ‐ ‐
18 4 EBWB X‐Street 10 7 14 4 1 Yes 18 16 27 27 AM 105 40 13 ‐ ‐ PM 110 51 24 ‐ ‐
18 5 ‐ ‐ ‐ ‐ AM 105 ‐ ‐ ‐ PM 110 ‐ ‐ ‐
18 6 ‐ ‐ ‐ ‐ AM 105 ‐ ‐ ‐ PM 110 ‐ ‐ ‐
18 7 ‐ ‐ ‐ ‐ AM 105 ‐ ‐ ‐ PM 110 ‐ ‐ ‐
18 8 ‐ ‐ ‐ ‐ AM 105 ‐ ‐ ‐ PM 110 ‐ ‐ ‐
19 1 NBL P/P 7 3 1 13 12 ‐ 13 AM 105 13 0 ‐ ‐ PM 110 13 0 ‐ ‐
19 2 SB Mainline 10 7 12 3.5 1.5 Yes Yes 20 16 25 25 AM 105 44 19 6 14% PM 110 43 18 12 28%
19 3 EBL P/P 7 3 1 13 12 ‐ 13 AM 105 13 0 ‐ ‐ PM 110 13 0 ‐ ‐
19 4 WB X‐Street 12 7 16 3.5 1.5 Yes 18 18 29 29 AM 105 35 6 ‐ ‐ PM 110 41 12 ‐ ‐
19 5 SBL P/P 7 3 1 13 12 ‐ 13 AM 105 14 1 ‐ ‐ PM 110 16 3 ‐ ‐
19 6 NB Mainline 10 7 12 3.5 1.5 Yes Yes 20 16 25 25 AM 105 43 18 7 16% PM 110 40 15 15 38%
19 7 WBL P/P 7 3 1 13 12 ‐ 13 AM 105 13 0 ‐ ‐ PM 110 15 2 ‐ ‐
19 8 EB X‐Street 12 7 16 3.5 1.5 Yes 18 18 29 29 AM 105 35 6 ‐ ‐ PM 110 39 10 ‐ ‐
20 1 ‐ ‐ ‐ ‐ AM 105 ‐ ‐ ‐ PM 110 ‐ ‐ ‐
20 2 NBSB Mainline 10 7 10 4 1 Yes Yes 20 16 23 23 AM 105 60 37 15 25% PM 110 55 32 25 45%
20 3 ‐ ‐ ‐ ‐ AM 105 ‐ ‐ ‐ PM 110 ‐ ‐ ‐
20 4 EBWB X‐Street 10 7 17 4 1 Yes 18 16 30 30 AM 105 45 15 ‐ ‐ PM 110 55 25 ‐ ‐
20 5 ‐ ‐ ‐ ‐ AM 105 ‐ ‐ ‐ PM 110 ‐ ‐ ‐
20 6 ‐ ‐ ‐ ‐ AM 105 ‐ ‐ ‐ PM 110 ‐ ‐ ‐
20 7 ‐ ‐ ‐ ‐ AM 105 ‐ ‐ ‐ PM 110 ‐ ‐ ‐
20 8 ‐ ‐ ‐ ‐ AM 105 ‐ ‐ ‐ PM 110 ‐ ‐ ‐
Snelling Ave & Selby Ave
Snelling Ave & Summit
Ave
Snelling Ave & Grand
Ave
Snelling Ave & St Clair
Ave
SRF Consulting Group Page 5 of 9 1/28/2013

Snelling Ave Rapid Bus TSP Slack Time Analysis ‐ Timing Data SRF No. 7939
Intersection
IntID
Phase
Movement
Phasing
Min Green
Walk
Ped
Clear (FD
W)
Yellow
Red
Clear (All Red
)
Ped
Actuated
?
Min Split Incl. p
eds?
TSP phase?
Defau
lt M
in Split
Veh M
in Split
Ped
Min Split
Min Split
AM Pattern #
AM Cycle
AM Split
AM Slack Tim
e
AM TSP
Tim
e
AM TSP
Tim
e
(% of ex. Split)
PM Pattern #
PM Cycle
PM Split
PM Slack Tim
e
PM TSP
Tim
e
PM TSP
Tim
e
(% of ex. Split)
21 1 ‐ ‐ ‐ ‐ AM 105 ‐ ‐ ‐ PM 110 ‐ ‐ ‐
21 2 NBSB Mainline 12 7 5 4 1 Yes Yes 20 18 18 20 AM 105 70 50 8 11% PM 110 80 60 3 4%
21 3 ‐ ‐ ‐ ‐ AM 105 ‐ ‐ ‐ PM 110 ‐ ‐ ‐
21 4 EBWB X‐Street 10 7 14 4 1 Yes 18 16 27 27 AM 105 35 8 ‐ ‐ PM 110 30 3 ‐ ‐
21 5 ‐ ‐ ‐ ‐ AM 105 ‐ ‐ ‐ PM 110 ‐ ‐ ‐
21 6 ‐ ‐ ‐ ‐ AM 105 ‐ ‐ ‐ PM 110 ‐ ‐ ‐
21 7 ‐ ‐ ‐ ‐ AM 105 ‐ ‐ ‐ PM 110 ‐ ‐ ‐
21 8 ‐ ‐ ‐ ‐ AM 105 ‐ ‐ ‐ PM 110 ‐ ‐ ‐
22 1 SBL P/P 7 3.5 1 13 12 ‐ 13 AM 105 14 1 ‐ ‐ PM 110 16 3 ‐ ‐
22 2 NB Mainline 10 7 11 4 1 Yes Yes 20 16 24 24 AM 105 43 19 5 12% PM 110 38 14 15 39%
22 3 EBL P/P 7 3.5 1 13 12 ‐ 13 AM 105 13 0 ‐ ‐ PM 110 14 1 ‐ ‐
22 4 WB X‐Street 10 7 18 4 1 Yes 18 16 31 31 AM 105 35 4 ‐ ‐ PM 110 42 11 ‐ ‐
22 5 NBL P/P 7 3.5 1 13 12 ‐ 13 AM 105 13 0 ‐ ‐ PM 110 12 0 ‐ ‐
22 6 SB Mainline 10 7 11 4 1 Yes Yes 20 16 24 24 AM 105 44 20 4 9% PM 110 42 18 12 29%
22 7 WBL P/P 7 3.5 1 13 12 ‐ 13 AM 105 13 0 ‐ ‐ PM 110 14 1 ‐ ‐
22 8 EB X‐Street 10 7 18 4 1 Yes 18 16 31 31 AM 105 35 4 ‐ ‐ PM 110 42 11 ‐ ‐
23 1 ‐ ‐ ‐ ‐ AM 60 ‐ ‐ ‐ PM 60 ‐ ‐ ‐
23 2 NBSB Mainline 10 4 1 Yes 20 16 ‐ 20 AM 60 31 11 0 0% PM 60 31 11 0 0%
23 3 ‐ ‐ ‐ ‐ AM 60 ‐ ‐ ‐ PM 60 ‐ ‐ ‐
23 4 EBWB X‐Street 10 7 16 4 1 Yes 18 16 29 29 AM 60 29 0 ‐ ‐ PM 60 29 0 ‐ ‐
23 5 ‐ ‐ ‐ ‐ AM 60 ‐ ‐ ‐ PM 60 ‐ ‐ ‐
23 6 ‐ ‐ ‐ ‐ AM 60 ‐ ‐ ‐ PM 60 ‐ ‐ ‐
23 7 ‐ ‐ ‐ ‐ AM 60 ‐ ‐ ‐ PM 60 ‐ ‐ ‐
23 8 ‐ ‐ ‐ ‐ AM 60 ‐ ‐ ‐ PM 60 ‐ ‐ ‐
24 1 ‐ ‐ ‐ ‐ AM 60 ‐ ‐ ‐ PM 60 ‐ ‐ ‐
24 2 NBSB Mainline 10 7 14 4 1 Yes Yes 20 16 27 27 AM 60 30 3 0 0% PM 60 30 3 0 0%
24 3 ‐ ‐ ‐ ‐ AM 60 ‐ ‐ ‐ PM 60 ‐ ‐ ‐
24 4 EBWB X‐Street 10 7 17 4 1 Yes Yes 18 16 30 30 AM 60 30 0 3 10% PM 60 30 0 3 10%
24 5 ‐ ‐ ‐ ‐ AM 60 ‐ ‐ ‐ PM 60 ‐ ‐ ‐
24 6 ‐ ‐ ‐ ‐ AM 60 ‐ ‐ ‐ PM 60 ‐ ‐ ‐
24 7 ‐ ‐ ‐ ‐ AM 60 ‐ ‐ ‐ PM 60 ‐ ‐ ‐
24 8 ‐ ‐ ‐ ‐ AM 60 ‐ ‐ ‐ PM 60 ‐ ‐ ‐
Snelling Ave & Ford
Pkw
y
Snelling Ave & Jefferson
Ave
Snelling Ave & Randolph
Ave
Snelling Ave & Highland
Pkw
y
SRF Consulting Group Page 6 of 9 1/28/2013

Snelling Ave Rapid Bus TSP Slack Time Analysis ‐ Timing Data SRF No. 7939
Intersection
IntID
Phase
Movement
Phasing
Min Green
Walk
Ped
Clear (FD
W)
Yellow
Red
Clear (All Red
)
Ped
Actuated
?
Min Split Incl. p
eds?
TSP phase?
Defau
lt M
in Split
Veh M
in Split
Ped
Min Split
Min Split
AM Pattern #
AM Cycle
AM Split
AM Slack Tim
e
AM TSP
Tim
e
AM TSP
Tim
e
(% of ex. Split)
PM Pattern #
PM Cycle
PM Split
PM Slack Tim
e
PM TSP
Tim
e
PM TSP
Tim
e
(% of ex. Split)
25 1 ‐ ‐ ‐ ‐ Free Free ‐ ‐ ‐ Free Free ‐ ‐ ‐
25 2 EBWB Mainline 12 7 17 4 1.5 Yes Yes 20 18 30 30 Free Free 45 15 17 38% Free Free 45 15 17 38%
25 3 ‐ ‐ ‐ ‐ Free Free ‐ ‐ ‐ Free Free ‐ ‐ ‐
25 4 NBSB X‐Street 14 7 15 4 1.5 Yes 18 20 28 28 Free Free 45 17 ‐ ‐ Free Free 45 17 ‐ ‐
25 5 ‐ ‐ ‐ ‐ Free Free ‐ ‐ ‐ Free Free ‐ ‐ ‐
25 6 ‐ ‐ ‐ ‐ Free Free ‐ ‐ ‐ Free Free ‐ ‐ ‐
25 7 ‐ ‐ ‐ ‐ Free Free ‐ ‐ ‐ Free Free ‐ ‐ ‐
25 8 ‐ ‐ ‐ ‐ Free Free ‐ ‐ ‐ Free Free ‐ ‐ ‐
26 1 ‐ ‐ ‐ ‐ AM 80 ‐ ‐ ‐ PM 110 ‐ ‐ ‐
26 2 EBWB Mainline 15 7 7 4 1 Yes Yes 20 21 20 21 AM 80 39 18 9 23% PM 110 63 42 15 24%
26 3 ‐ ‐ ‐ ‐ AM 80 ‐ ‐ ‐ PM 110 ‐ ‐ ‐
26 4 NBSB X‐Street 7 7 20 3.5 1 Yes 18 12 32 32 AM 80 41 9 ‐ ‐ PM 110 47 15 ‐ ‐
26 5 ‐ ‐ ‐ ‐ AM 80 ‐ ‐ ‐ PM 110 ‐ ‐ ‐
26 6 ‐ ‐ ‐ ‐ AM 80 ‐ ‐ ‐ PM 110 ‐ ‐ ‐
26 7 ‐ ‐ ‐ ‐ AM 80 ‐ ‐ ‐ PM 110 ‐ ‐ ‐
26 8 ‐ ‐ ‐ ‐ AM 80 ‐ ‐ ‐ PM 110 ‐ ‐ ‐
27 1 EBL P/P 7 3 1 13 12 ‐ 13 AM 80 ‐ ‐ ‐ ‐ PM 110 13 0 ‐ ‐
27 2 WB Mainline 10 7 15 3.5 1 Yes Yes 20 15 27 27 AM 80 34 7 4 12% PM 110 40 13 15 38%
27 3 SBL P/P 7 3 1 13 12 ‐ 13 AM 80 12 0 ‐ ‐ PM 110 12 0 ‐ ‐
27 4 NB X‐Street 10 7 17 3.5 1 Yes 18 15 29 29 AM 80 34 5 ‐ ‐ PM 110 45 16 ‐ ‐
27 5 WBL P/P 7 3 1 13 12 ‐ 13 AM 80 ‐ ‐ ‐ ‐ PM 110 12 0 ‐ ‐
27 6 EB Mainline 10 7 20 3.5 1 Yes Yes 20 15 32 32 AM 80 34 2 4 12% PM 110 41 9 15 37%
27 7 NBL P/P 7 3 1 13 12 ‐ 13 AM 80 15 2 ‐ ‐ PM 110 19 6 ‐ ‐
27 8 SB X‐Street 10 7 17 3.5 1 Yes 18 15 29 29 AM 80 31 2 ‐ ‐ PM 110 38 9 ‐ ‐
28 1 WBL P/P 7 3 1 13 12 ‐ 13 AM 80 14 1 ‐ ‐ PM 110 23 10 ‐ ‐
28 2 EB Mainline 16 7 15 3.5 1 Yes Yes 20 21 27 27 AM 80 34 7 3 9% PM 110 42 15 25 60%
28 3 ‐ ‐ ‐ ‐ AM 80 ‐ ‐ ‐ PM 110 ‐ ‐ ‐
28 4 NBSB X‐Street 8 7 17 4 1 Yes 18 14 30 30 AM 80 32 2 ‐ ‐ PM 110 45 15 ‐ ‐
28 5 ‐ ‐ ‐ ‐ AM 80 ‐ ‐ ‐ PM 110 ‐ ‐ ‐
28 6 WB Mainline 16 7 9 3.5 1 Yes Yes 20 21 21 21 AM 80 48 27 2 4% PM 110 65 44 15 23%
28 7 ‐ ‐ ‐ ‐ AM 80 ‐ ‐ ‐ PM 110 ‐ ‐ ‐
28 8 ‐ ‐ ‐ ‐ AM 80 ‐ ‐ ‐ PM 110 ‐ ‐ ‐
Ford Pkw
y & Fairview
Ave
Ford Pkw
y & Kenneth
Ave
Ford Pkw
y & Cleveland
Ave
Ford Pkw
y & Finn Ave
SRF Consulting Group Page 7 of 9 1/28/2013

Snelling Ave Rapid Bus TSP Slack Time Analysis ‐ Timing Data SRF No. 7939
Intersection
IntID
Phase
Movement
Phasing
Min Green
Walk
Ped
Clear (FD
W)
Yellow
Red
Clear (All Red
)
Ped
Actuated
?
Min Split Incl. p
eds?
TSP phase?
Defau
lt M
in Split
Veh M
in Split
Ped
Min Split
Min Split
AM Pattern #
AM Cycle
AM Split
AM Slack Tim
e
AM TSP
Tim
e
AM TSP
Tim
e
(% of ex. Split)
PM Pattern #
PM Cycle
PM Split
PM Slack Tim
e
PM TSP
Tim
e
PM TSP
Tim
e
(% of ex. Split)
29 1 EBL P/P 8 3 1 13 13 ‐ 13 AM 80 15 2 ‐ ‐ PM 110 16 3 ‐ ‐
29 2 WB Mainline 10 7 9 4 1 Yes Yes 20 16 22 22 AM 80 32 10 6 19% PM 110 64 42 4 6%
29 3 ‐ ‐ ‐ ‐ AM 80 ‐ ‐ ‐ PM 110 ‐ ‐ ‐
29 4 NBSB X‐Street 10 7 17 3.5 1 Yes 18 15 29 29 AM 80 33 4 ‐ ‐ PM 110 30 1 ‐ ‐
29 5 ‐ ‐ ‐ ‐ AM 80 ‐ ‐ ‐ PM 110 ‐ ‐ ‐
29 6 EB Mainline 10 7 7 4 1 Yes Yes 20 16 20 20 AM 80 47 27 4 9% PM 110 80 60 1 1%
29 7 ‐ ‐ ‐ ‐ AM 80 ‐ ‐ ‐ PM 110 ‐ ‐ ‐
29 8 ‐ ‐ ‐ ‐ AM 80 ‐ ‐ ‐ PM 110 ‐ ‐ ‐
30 1 WBL P/P 7 3.5 2.2 13 14 ‐ 14 * 110 24 10 ‐ ‐ * 120 29 15 ‐ ‐
30 2 EB Mainline 15 8 9 3.5 3.2 Yes Yes 20 23 25 25 * 110 37 12 13 35% * 120 41 16 21 51%
30 3 SWB X‐Street 10 3.5 2.2 18 17 ‐ 18 * 110 18 0 ‐ ‐ * 120 16 0 ‐ ‐
30 4 SB X‐Street 10 9 12 3.5 2.6 Yes 18 17 28 28 * 110 31 3 ‐ ‐ * 120 34 6 ‐ ‐
30 5 EBL P/P 7 3.5 2.2 13 14 ‐ 14 * 110 15 1 ‐ ‐ * 120 13 0 ‐ ‐
30 6 WB Mainline 15 8 9 3.5 3.2 Yes Yes 20 23 25 25 * 110 46 21 4 9% * 120 57 32 6 11%
30 7 ‐ ‐ ‐ ‐ * 110 ‐ ‐ ‐ * 120 ‐ ‐ ‐
30 8 NB X‐Street 10 3.5 2.6 18 17 ‐ 18 * 110 31 13 ‐ ‐ * 120 34 16 ‐ ‐
31 1 ‐ ‐ ‐ ‐ * 110 ‐ ‐ ‐ * 120 ‐ ‐ ‐
31 2 EBWB Mainline 15 7 11 3.6 0 Yes Yes 20 20 23 23 * 110 67 44 20 30% * 120 74 51 23 31%
31 3 ‐ ‐ ‐ ‐ * 110 ‐ ‐ ‐ * 120 ‐ ‐ ‐
31 4 NBSB X‐Street 10 7 11 3.6 0 Yes 18 15 23 23 * 110 43 20 ‐ ‐ * 120 46 23 ‐ ‐
31 5 ‐ ‐ ‐ ‐ * 110 ‐ ‐ ‐ * 120 ‐ ‐ ‐
31 6 ‐ ‐ ‐ ‐ * 110 ‐ ‐ ‐ * 120 ‐ ‐ ‐
31 7 ‐ ‐ ‐ ‐ * 110 ‐ ‐ ‐ * 120 ‐ ‐ ‐
31 8 ‐ ‐ ‐ ‐ * 110 ‐ ‐ ‐ * 120 ‐ ‐ ‐
32 1 ‐ ‐ ‐ ‐ * 110 ‐ ‐ ‐ * 120 ‐ ‐ ‐
32 2 NBSB X‐Street 10 7 12 3.2 1.6 Yes 18 16 25 25 * 110 59 34 ‐ ‐ * 120 76 51 ‐ ‐
32 3 ‐ ‐ ‐ ‐ * 110 ‐ ‐ ‐ * 120 ‐ ‐ ‐
32 4 EBWB Mainline 15 7 11 3.2 1.6 Yes Yes 20 21 24 24 * 110 51 27 34 67% * 120 44 20 51 116%
32 5 ‐ ‐ ‐ ‐ * 110 ‐ ‐ ‐ * 120 ‐ ‐ ‐
32 6 ‐ ‐ ‐ ‐ * 110 ‐ ‐ ‐ * 120 ‐ ‐ ‐
32 7 ‐ ‐ ‐ ‐ * 110 ‐ ‐ ‐ * 120 ‐ ‐ ‐
32 8 ‐ ‐ ‐ ‐ * 110 ‐ ‐ ‐ * 120 ‐ ‐ ‐
46th & 42nd
46th & M
innehaha
Ford Pkw
y & Cretin Ave
46th & 46th
SRF Consulting Group Page 8 of 9 1/28/2013
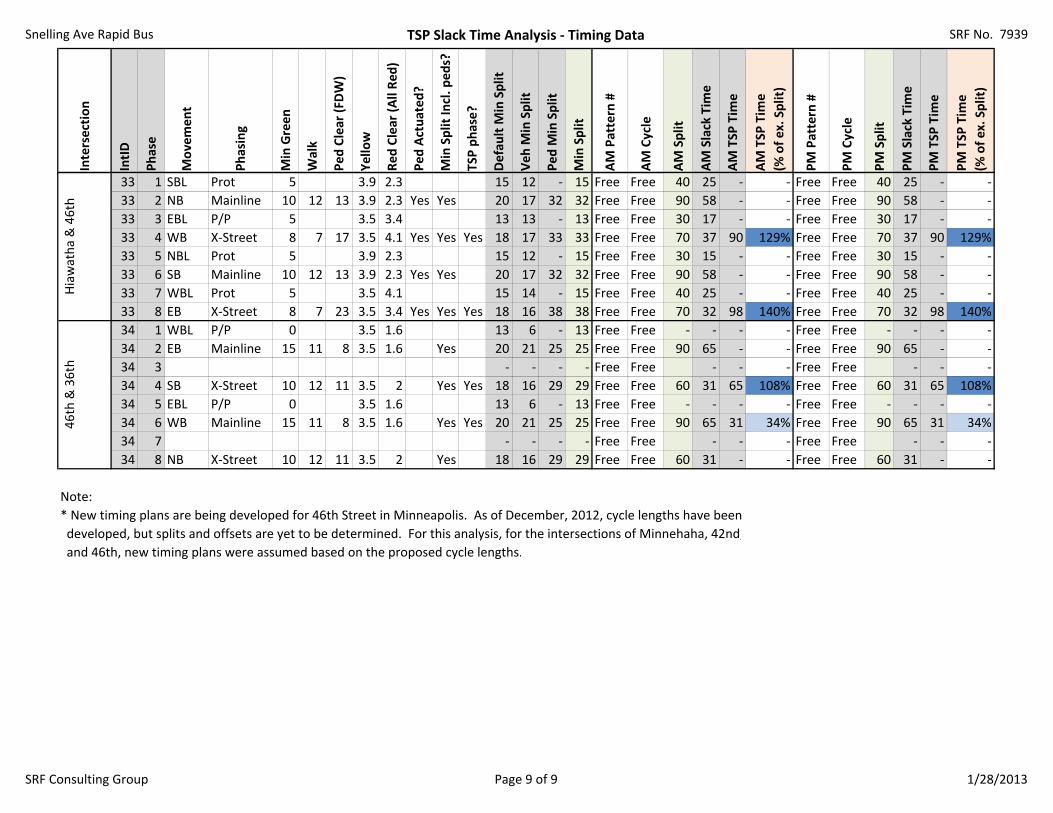
Snelling Ave Rapid Bus TSP Slack Time Analysis ‐ Timing Data SRF No. 7939
Intersection
IntID
Phase
Movement
Phasing
Min Green
Walk
Ped
Clear (FD
W)
Yellow
Red
Clear (All Red
)
Ped
Actuated
?
Min Split Incl. p
eds?
TSP phase?
Defau
lt M
in Split
Veh M
in Split
Ped
Min Split
Min Split
AM Pattern #
AM Cycle
AM Split
AM Slack Tim
e
AM TSP
Tim
e
AM TSP
Tim
e
(% of ex. Split)
PM Pattern #
PM Cycle
PM Split
PM Slack Tim
e
PM TSP
Tim
e
PM TSP
Tim
e
(% of ex. Split)
33 1 SBL Prot 5 3.9 2.3 15 12 ‐ 15 Free Free 40 25 ‐ ‐ Free Free 40 25 ‐ ‐
33 2 NB Mainline 10 12 13 3.9 2.3 Yes Yes 20 17 32 32 Free Free 90 58 ‐ ‐ Free Free 90 58 ‐ ‐
33 3 EBL P/P 5 3.5 3.4 13 13 ‐ 13 Free Free 30 17 ‐ ‐ Free Free 30 17 ‐ ‐
33 4 WB X‐Street 8 7 17 3.5 4.1 Yes Yes Yes 18 17 33 33 Free Free 70 37 90 129% Free Free 70 37 90 129%
33 5 NBL Prot 5 3.9 2.3 15 12 ‐ 15 Free Free 30 15 ‐ ‐ Free Free 30 15 ‐ ‐
33 6 SB Mainline 10 12 13 3.9 2.3 Yes Yes 20 17 32 32 Free Free 90 58 ‐ ‐ Free Free 90 58 ‐ ‐
33 7 WBL Prot 5 3.5 4.1 15 14 ‐ 15 Free Free 40 25 ‐ ‐ Free Free 40 25 ‐ ‐
33 8 EB X‐Street 8 7 23 3.5 3.4 Yes Yes Yes 18 16 38 38 Free Free 70 32 98 140% Free Free 70 32 98 140%
34 1 WBL P/P 0 3.5 1.6 13 6 ‐ 13 Free Free ‐ ‐ ‐ ‐ Free Free ‐ ‐ ‐ ‐
34 2 EB Mainline 15 11 8 3.5 1.6 Yes 20 21 25 25 Free Free 90 65 ‐ ‐ Free Free 90 65 ‐ ‐
34 3 ‐ ‐ ‐ ‐ Free Free ‐ ‐ ‐ Free Free ‐ ‐ ‐
34 4 SB X‐Street 10 12 11 3.5 2 Yes Yes 18 16 29 29 Free Free 60 31 65 108% Free Free 60 31 65 108%
34 5 EBL P/P 0 3.5 1.6 13 6 ‐ 13 Free Free ‐ ‐ ‐ ‐ Free Free ‐ ‐ ‐ ‐
34 6 WB Mainline 15 11 8 3.5 1.6 Yes Yes 20 21 25 25 Free Free 90 65 31 34% Free Free 90 65 31 34%
34 7 ‐ ‐ ‐ ‐ Free Free ‐ ‐ ‐ Free Free ‐ ‐ ‐
34 8 NB X‐Street 10 12 11 3.5 2 Yes 18 16 29 29 Free Free 60 31 ‐ ‐ Free Free 60 31 ‐ ‐
Note:
* New timing plans are being developed for 46th Street in Minneapolis. As of December, 2012, cycle lengths have been
developed, but splits and offsets are yet to be determined. For this analysis, for the intersections of Minnehaha, 42nd,
and 46th, new timing plans were assumed based on the proposed cycle lengths.
Hiawatha & 46th
46th & 36th
SRF Consulting Group Page 9 of 9 1/28/2013

APPENDIX C
DETAILED VISSIM MODELING OUTPUT

Baseline Conditions VISSIM Model
Snelling Avenue Rapid Bus VISSIM Evaluation
Arterial MOEs (A.M. Peak Hour 7:30 - 8:30)
Co B2 at Snelling W Ramps
(vph) (ft) (ft) (sec/veh) (sec/veh) (sec/veh)
Left 11 7 87 30.0 C
Thru 23 7 86 34.0 C
Right 6 0 0 1.5 A
Left 20 9 90 37.3 D
Thru 33 9 89 38.0 D
Right 37 0 0 2.6 A
Left 22 4 56 36.8 D
Thru 101 2 51 6.9 A
Right 14 0 0 3.3 A
Left 120 32 232 43.9 D
Thru 447 8 128 5.8 A
Right 78 0 0 1.2 A
Co B2 at Snelling E Ramps
(vph) (ft) (ft) (sec/veh) (sec/veh) (sec/veh)
Left 50 10 114 31.8 C
Right 150 0 45 9.0 A
Left 13 0 34 3.5 A
Thru 115 0 34 1.3 A
Thru 492 2 95 2.4 A
Right 30 0 0 1.4 A
Snelling at Co B
(vph) (ft) (ft) (sec/veh) (sec/veh) (sec/veh)
Left 134 74 301 87.0 F
Thru 883 11 211 5.5 A
Right 83 0 0 1.6 A
Left 154 85 693 87.2 F
Thru 1,542 143 762 24.7 C
Right 333 61 711 18.6 B
Left 103 54 310 77.9 E
Thru 237 83 333 85.4 F
Right 46 2 91 12.5 B
Left 137 56 280 67.4 E
Thru 270 83 312 81.3 F
Right 129 6 145 14.6 B
Snelling at HarMar
(vph) (ft) (ft) (sec/veh) (sec/veh) (sec/veh)
Left 56 30 170 85.2 F
Thru 956 16 246 9.0 A
Right 57 0 0 1.7 A
Left 58 25 170 68.4 E
Thru 1,600 6 131 2.3 A
Right 69 0 46 2.3 A
Left 63 37 143 82.9 F
Thru 31 37 143 83.5 F
Right 114 40 146 14.1 B
Left 39 26 130 88.4 F
Thru 18 26 130 85.9 F
Right 78 7 116 8.2 A
11.3 B
Westbound 12.3 B
Northbound 27.9 C
14.0 B
Southbound 23.4 C
Eastbound
Approach
LOS
Overall
DelayOverall
LOSApproach
Simulated
Volume
Average
Queue
Maximum
Queue
Movement
DelayMovement
LOS
Approach
DelayMovement
Approach Movement
Simulated
Volume
Average
Queue
Maximum
Queue
Movement
DelayMovement
LOS
Approach
Delay
5.1 A
Southbound 14.7 B
Eastbound
Approach
LOS
Overall
DelayOverall
LOS
1.5 A
Westbound 2.3 A
Approach Movement
Simulated
Volume
Average
Queue
Maximum
Queue
Movement
DelayMovement
LOS
Approach
DelayApproach
LOS
Overall
DelayOverall
LOS
Northbound 15.1 B
33.7 C
Southbound 28.4 C
Eastbound 74.8 E
Westbound 61.7 E
Approach Movement
Simulated
Volume
Average
Queue
Maximum
Queue
Movement
DelayMovement
LOS
Approach
DelayApproach
LOS
Overall
DelayOverall
LOS
Northbound 12.6 B
11.5 B
Southbound 4.5 A
Eastbound 45.2 D
Westbound 41.8 D
* Results shown are the average of 5 model runs.
** Results shown are from all vehicles except transit vehicles.
H:\Projects\7939\SD\VISSIM\1_Baseline\11 MOEs\7939_1_Baseline_AM Arterial MOEs.xls 5/3/2013

Baseline Conditions VISSIM Model
Snelling Avenue Rapid Bus VISSIM Evaluation
Arterial MOEs (A.M. Peak Hour 7:30 - 8:30)
Snelling at Roselawn
(vph) (ft) (ft) (sec/veh) (sec/veh) (sec/veh)
Left 10 4 57 74.6 E
Thru 943 9 280 4.9 A
Right 10 0 31 2.6 A
Left 32 24 111 117.5 F
Thru 1,673 5 113 2.5 A
Right 47 0 27 2.6 A
Left 24 50 219 123.8 F
Thru 42 47 211 112.1 F
Right 76 3 67 10.8 B
Left 47 113 513 104.1 F
Thru 114 113 514 105.5 F
Right 103 4 90 15.0 B
Snelling at Larpenteur
(vph) (ft) (ft) (sec/veh) (sec/veh) (sec/veh)
Left 182 90 398 75.5 E
Thru 790 42 382 17.2 B
Right 40 1 73 4.5 A
Left 48 38 159 127.4 F
Thru 1,625 140 1,143 25.6 C
Right 121 3 83 13.1 B
Left 83 39 184 78.0 E
Thru 192 52 228 66.6 E
Right 21 64 242 55.2 E
Left 222 1,321 1,701 286.0 F
Thru 711 1,362 1,702 293.8 F
Right 90 1,371 1,705 301.8 F
Snelling at Hoyt
(vph) (ft) (ft) (sec/veh) (sec/veh) (sec/veh)
Left 14 0 31 19.1 B
Thru 923 10 259 5.1 A
Right 30 0 0 2.7 A
Left 16 0 14 6.5 A
Thru 1,839 2 107 2.0 A
Right 14 0 0 3.1 A
Left 10 4 45 73.1 E
Thru 7 4 67 88.5 F
Right 8 3 93 17.1 B
Left 73 39 212 87.2 F
Thru 9 10 140 75.3 E
Right 77 11 157 16.2 B
Snelling at Midway
(vph) (ft) (ft) (sec/veh) (sec/veh) (sec/veh)
Left 44 1 57 19.3 B
Thru 942 12 266 5.6 A
Right 21 0 51 3.4 A
Left 43 0 14 7.3 A
Thru 1,824 5 246 4.1 A
Right 52 8 282 4.9 A
Left 0 - - - A
Thru 13 6 71 80.9 F
Right 3 0 37 13.5 B
Left 45 35 175 78.6 E
Thru 26 35 172 84.5 F
Right 23 1 58 6.6 A
Approach Movement
Simulated
Volume
Average
Queue
Maximum
Queue
Movement
DelayMovement
LOS
Approach
DelayApproach
LOS
Overall
DelayOverall
LOS
Northbound 5.6 A
13.0 B
Southbound 4.7 A
Eastbound 59.9 E
Westbound 70.0 E
Approach Movement
Simulated
Volume
Average
Queue
Maximum
Queue
Movement
DelayMovement
LOS
Approach
DelayApproach
LOS
Overall
DelayOverall
LOS
Northbound 27.2 C
96.2 F
Southbound 27.5 C
Eastbound 69.0 E
Westbound 292.8 F
Approach Movement
Simulated
Volume
Average
Queue
Maximum
Queue
Movement
DelayMovement
LOS
Approach
DelayApproach
LOS
Overall
DelayOverall
LOS
Northbound 5.3 A
6.2 A
Southbound 2.0 A
Eastbound 59.5 E
Westbound 52.1 D
Approach Movement
Simulated
Volume
Average
Queue
Maximum
Queue
Movement
DelayMovement
LOS
Approach
DelayApproach
LOS
Overall
DelayOverall
LOS
Northbound 6.1 A
7.0 A
Southbound 4.2 A
Eastbound 68.6 E
Westbound 62.4 E
* Results shown are the average of 5 model runs.
** Results shown are from all vehicles except transit vehicles.
H:\Projects\7939\SD\VISSIM\1_Baseline\11 MOEs\7939_1_Baseline_AM Arterial MOEs.xls 5/3/2013
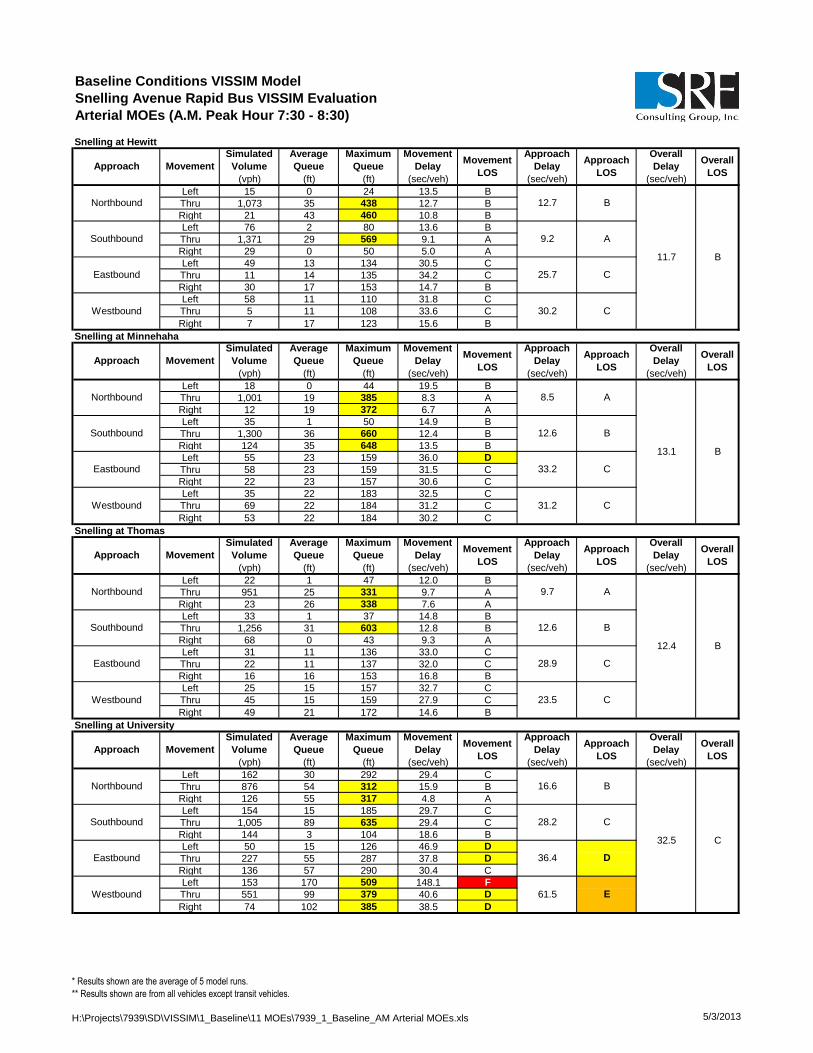
Baseline Conditions VISSIM Model
Snelling Avenue Rapid Bus VISSIM Evaluation
Arterial MOEs (A.M. Peak Hour 7:30 - 8:30)
Snelling at Hewitt
(vph) (ft) (ft) (sec/veh) (sec/veh) (sec/veh)
Left 15 0 24 13.5 B
Thru 1,073 35 438 12.7 B
Right 21 43 460 10.8 B
Left 76 2 80 13.6 B
Thru 1,371 29 569 9.1 A
Right 29 0 50 5.0 A
Left 49 13 134 30.5 C
Thru 11 14 135 34.2 C
Right 30 17 153 14.7 B
Left 58 11 110 31.8 C
Thru 5 11 108 33.6 C
Right 7 17 123 15.6 B
Snelling at Minnehaha
(vph) (ft) (ft) (sec/veh) (sec/veh) (sec/veh)
Left 18 0 44 19.5 B
Thru 1,001 19 385 8.3 A
Right 12 19 372 6.7 A
Left 35 1 50 14.9 B
Thru 1,300 36 660 12.4 B
Right 124 35 648 13.5 B
Left 55 23 159 36.0 D
Thru 58 23 159 31.5 C
Right 22 23 157 30.6 C
Left 35 22 183 32.5 C
Thru 69 22 184 31.2 C
Right 53 22 184 30.2 C
Snelling at Thomas
(vph) (ft) (ft) (sec/veh) (sec/veh) (sec/veh)
Left 22 1 47 12.0 B
Thru 951 25 331 9.7 A
Right 23 26 338 7.6 A
Left 33 1 37 14.8 B
Thru 1,256 31 603 12.8 B
Right 68 0 43 9.3 A
Left 31 11 136 33.0 C
Thru 22 11 137 32.0 C
Right 16 16 153 16.8 B
Left 25 15 157 32.7 C
Thru 45 15 159 27.9 C
Right 49 21 172 14.6 B
Snelling at University
(vph) (ft) (ft) (sec/veh) (sec/veh) (sec/veh)
Left 162 30 292 29.4 C
Thru 876 54 312 15.9 B
Right 126 55 317 4.8 A
Left 154 15 185 29.7 C
Thru 1,005 89 635 29.4 C
Right 144 3 104 18.6 B
Left 50 15 126 46.9 D
Thru 227 55 287 37.8 D
Right 136 57 290 30.4 C
Left 153 170 509 148.1 F
Thru 551 99 379 40.6 D
Right 74 102 385 38.5 D
Approach Movement
Simulated
Volume
Average
Queue
Maximum
Queue
Movement
DelayMovement
LOS
Approach
DelayApproach
LOS
Overall
DelayOverall
LOS
Northbound 12.7 B
11.7 B
Southbound 9.2 A
Eastbound 25.7 C
Westbound 30.2 C
Approach Movement
Simulated
Volume
Average
Queue
Maximum
Queue
Movement
DelayMovement
LOS
Approach
DelayApproach
LOS
Overall
DelayOverall
LOS
Northbound 8.5 A
13.1 B
Southbound 12.6 B
Eastbound 33.2 C
Westbound 31.2 C
Approach Movement
Simulated
Volume
Average
Queue
Maximum
Queue
Movement
DelayMovement
LOS
Approach
DelayApproach
LOS
Overall
DelayOverall
LOS
Northbound 9.7 A
12.4 B
Southbound 12.6 B
Eastbound 28.9 C
Westbound 23.5 C
Approach Movement
Simulated
Volume
Average
Queue
Maximum
Queue
Movement
DelayMovement
LOS
Approach
DelayApproach
LOS
Overall
DelayOverall
LOS
Northbound 16.6 B
32.5 C
Southbound 28.2 C
Eastbound 36.4 D
Westbound 61.5 E
* Results shown are the average of 5 model runs.
** Results shown are from all vehicles except transit vehicles.
H:\Projects\7939\SD\VISSIM\1_Baseline\11 MOEs\7939_1_Baseline_AM Arterial MOEs.xls 5/3/2013
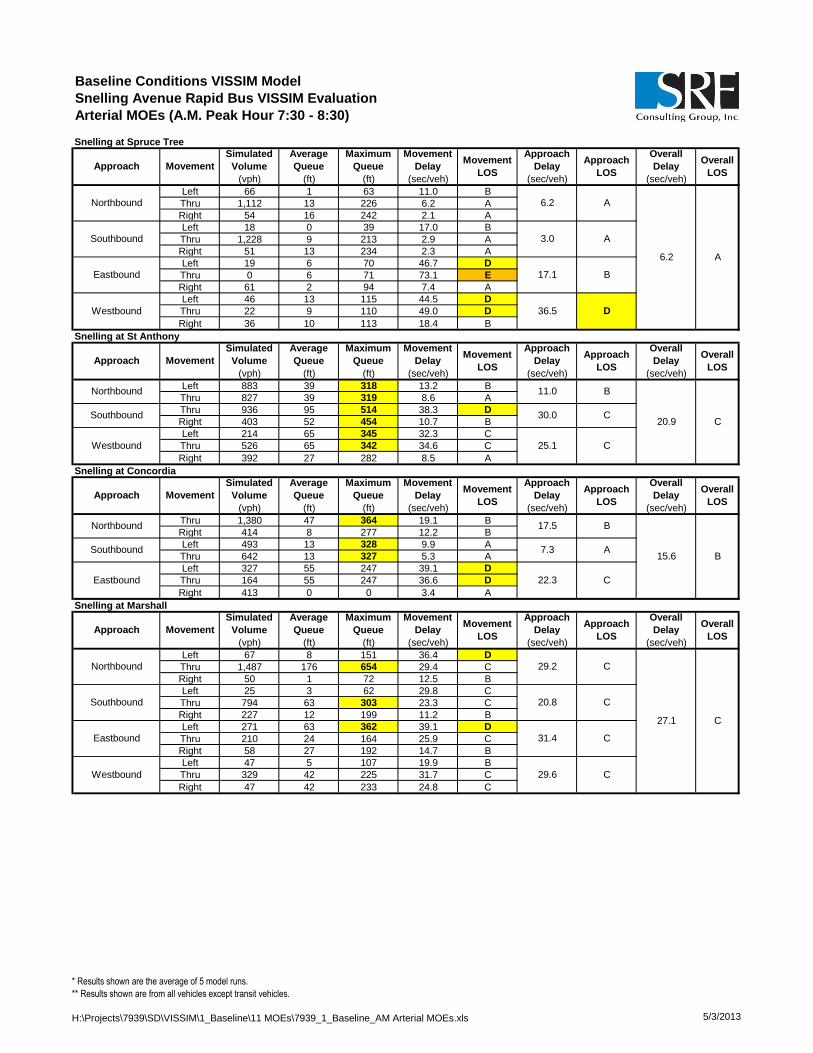
Baseline Conditions VISSIM Model
Snelling Avenue Rapid Bus VISSIM Evaluation
Arterial MOEs (A.M. Peak Hour 7:30 - 8:30)
Snelling at Spruce Tree
(vph) (ft) (ft) (sec/veh) (sec/veh) (sec/veh)
Left 66 1 63 11.0 B
Thru 1,112 13 226 6.2 A
Right 54 16 242 2.1 A
Left 18 0 39 17.0 B
Thru 1,228 9 213 2.9 A
Right 51 13 234 2.3 A
Left 19 6 70 46.7 D
Thru 0 6 71 73.1 E
Right 61 2 94 7.4 A
Left 46 13 115 44.5 D
Thru 22 9 110 49.0 D
Right 36 10 113 18.4 B
Snelling at St Anthony
(vph) (ft) (ft) (sec/veh) (sec/veh) (sec/veh)
Left 883 39 318 13.2 B
Thru 827 39 319 8.6 A
Thru 936 95 514 38.3 D
Right 403 52 454 10.7 B
Left 214 65 345 32.3 C
Thru 526 65 342 34.6 C
Right 392 27 282 8.5 A
Snelling at Concordia
(vph) (ft) (ft) (sec/veh) (sec/veh) (sec/veh)
Thru 1,380 47 364 19.1 B
Right 414 8 277 12.2 B
Left 493 13 328 9.9 A
Thru 642 13 327 5.3 A
Left 327 55 247 39.1 D
Thru 164 55 247 36.6 D
Right 413 0 0 3.4 A
Snelling at Marshall
(vph) (ft) (ft) (sec/veh) (sec/veh) (sec/veh)
Left 67 8 151 36.4 D
Thru 1,487 176 654 29.4 C
Right 50 1 72 12.5 B
Left 25 3 62 29.8 C
Thru 794 63 303 23.3 C
Right 227 12 199 11.2 B
Left 271 63 362 39.1 D
Thru 210 24 164 25.9 C
Right 58 27 192 14.7 B
Left 47 5 107 19.9 B
Thru 329 42 225 31.7 C
Right 47 42 233 24.8 C
Approach Movement
Simulated
Volume
Average
Queue
Maximum
Queue
Movement
DelayMovement
LOS
Approach
DelayApproach
LOS
Overall
DelayOverall
LOS
Northbound 6.2 A
6.2 A
Southbound 3.0 A
Eastbound 17.1 B
Westbound 36.5 D
Approach
DelayApproach Movement
Overall
DelayOverall
LOS
Simulated
Volume
Average
Queue
Maximum
Queue
Movement
DelayMovement
LOS
Northbound 11.0 B
20.9 CSouthbound 30.0 C
Approach
LOS
Westbound 25.1 C
Approach MovementOverall
LOS
Simulated
Volume
Average
Queue
Maximum
Queue
Movement
DelayMovement
LOS
Southbound 7.3 A
Approach
DelayApproach
LOS
Overall
Delay
Eastbound 22.3 C
Northbound 17.5 B
15.6 B
Approach Movement
Simulated
Volume
Average
Queue
Maximum
Queue
Movement
DelayMovement
LOS
Approach
DelayApproach
LOS
Overall
DelayOverall
LOS
Northbound 29.2 C
27.1 C
Southbound 20.8 C
Eastbound 31.4 C
Westbound 29.6 C
* Results shown are the average of 5 model runs.
** Results shown are from all vehicles except transit vehicles.
H:\Projects\7939\SD\VISSIM\1_Baseline\11 MOEs\7939_1_Baseline_AM Arterial MOEs.xls 5/3/2013

Baseline Conditions VISSIM Model
Snelling Avenue Rapid Bus VISSIM Evaluation
Arterial MOEs (A.M. Peak Hour 7:30 - 8:30)
Snelling at Selby
(vph) (ft) (ft) (sec/veh) (sec/veh) (sec/veh)
Left 12 2 47 53.8 D
Thru 1,079 244 733 55.0 D
Right 21 246 722 48.3 D
Left 230 101 417 68.4 E
Thru 645 33 233 14.2 B
Right 28 35 237 11.8 B
Left 68 79 341 148.3 F
Thru 149 39 335 38.5 D
Right 13 37 327 23.4 C
Left 31 3 45 31.8 C
Thru 175 126 523 37.4 D
Right 452 129 528 29.4 C
Snelling at Summit
(vph) (ft) (ft) (sec/veh) (sec/veh) (sec/veh)
Left 41 1 44 9.6 A
Thru 924 15 153 5.1 A
Right 32 15 152 5.9 A
Left 40 13 114 27.9 C
Thru 551 47 288 21.4 C
Right 101 48 287 21.8 C
Left 49 14 195 54.8 D
Thru 178 28 262 25.1 C
Right 13 38 286 19.5 B
Left 64 7 218 39.2 D
Thru 357 138 598 41.3 D
Right 146 152 616 35.1 D
Snelling at Grand
(vph) (ft) (ft) (sec/veh) (sec/veh) (sec/veh)
Left 44 2 65 13.0 B
Thru 771 33 253 13.8 B
Right 55 34 263 13.3 B
Left 98 13 124 28.8 C
Thru 423 31 204 17.2 B
Right 102 35 219 12.0 B
Left 46 6 80 26.4 C
Thru 184 34 282 27.6 C
Right 23 36 299 21.0 C
Left 82 12 280 39.3 D
Thru 299 154 607 46.4 D
Right 176 158 623 40.1 D
Snelling at St Clair
(vph) (ft) (ft) (sec/veh) (sec/veh) (sec/veh)
Left 39 1 37 11.3 B
Thru 651 11 116 6.3 A
Right 44 0 49 3.7 A
Left 46 2 71 13.7 B
Thru 450 9 163 7.4 A
Right 30 12 178 6.0 A
Left 47 34 281 33.6 C
Thru 217 34 278 25.3 C
Right 39 42 297 12.9 B
Left 68 62 462 36.9 D
Thru 256 62 465 29.9 C
Right 179 73 485 20.4 C
Approach Movement
Simulated
Volume
Average
Queue
Maximum
Queue
Movement
DelayMovement
LOS
Approach
DelayApproach
LOS
Overall
DelayOverall
LOS
Northbound 54.9 D
42.4 D
Southbound 27.9 C
Eastbound 70.3 E
Westbound 31.7 C
Approach Movement
Simulated
Volume
Average
Queue
Maximum
Queue
Movement
DelayMovement
LOS
Approach
DelayApproach
LOS
Overall
DelayOverall
LOS
Northbound 5.3 A
20.1 C
Southbound 21.9 C
Eastbound 30.8 C
Westbound 39.4 D
Approach Movement
Simulated
Volume
Average
Queue
Maximum
Queue
Movement
DelayMovement
LOS
Approach
DelayApproach
LOS
Overall
DelayOverall
LOS
Northbound 13.7 B
23.5 C
Southbound 18.2 B
Eastbound 26.8 C
Westbound 43.4 D
Approach Movement
Simulated
Volume
Average
Queue
Maximum
Queue
Movement
DelayMovement
LOS
Approach
DelayApproach
LOS
Overall
DelayOverall
LOS
Northbound 6.4 A
14.6 B
Southbound 7.9 A
Eastbound 25.0 C
Westbound 27.5 C
* Results shown are the average of 5 model runs.
** Results shown are from all vehicles except transit vehicles.
H:\Projects\7939\SD\VISSIM\1_Baseline\11 MOEs\7939_1_Baseline_AM Arterial MOEs.xls 5/3/2013

Baseline Conditions VISSIM Model
Snelling Avenue Rapid Bus VISSIM Evaluation
Arterial MOEs (A.M. Peak Hour 7:30 - 8:30)
Snelling at Jefferson
(vph) (ft) (ft) (sec/veh) (sec/veh) (sec/veh)
Left 5 17 250 18.0 B
Thru 651 17 251 10.7 B
Right 24 21 263 9.2 A
Left 16 5 81 5.4 A
Thru 546 5 82 3.5 A
Right 4 8 98 3.3 A
Left 19 13 117 32.5 C
Thru 59 13 114 28.6 C
Right 7 21 137 13.6 B
Left 62 29 218 31.1 C
Thru 66 30 222 34.1 C
Right 54 37 234 21.1 C
Snelling at Randolph
(vph) (ft) (ft) (sec/veh) (sec/veh) (sec/veh)
Left 65 5 88 17.4 B
Thru 491 39 207 23.5 C
Right 33 1 67 9.3 A
Left 98 5 125 16.5 B
Thru 353 22 255 18.9 B
Right 155 7 184 11.7 B
Left 101 33 417 44.3 D
Thru 364 98 517 35.9 D
Right 44 1 66 18.2 B
Left 60 8 90 36.1 D
Thru 407 117 584 37.8 D
Right 88 9 401 21.3 C
Snelling at Highland
(vph) (ft) (ft) (sec/veh) (sec/veh) (sec/veh)
Left 3 5 107 8.6 A
Thru 494 6 110 3.7 A
Right 153 8 121 3.4 A
Left 20 7 194 11.4 B
Thru 426 7 197 6.1 A
Right 12 8 205 5.3 A
Left 37 16 147 22.6 C
Thru 93 16 146 23.1 C
Right 9 0 35 6.7 A
Left 124 19 114 30.6 C
Thru 61 8 114 21.6 C
Right 61 12 127 8.7 A
Snelling at Ford
(vph) (ft) (ft) (sec/veh) (sec/veh) (sec/veh)
Left 75 7 108 12.1 B
Thru 443 8 109 4.7 A
Right 5 11 127 2.7 A
Left 2 2 83 8.9 A
Thru 391 2 77 2.6 A
Right 171 1 81 2.9 A
Left 206 21 174 24.6 C
Thru 3 21 174 22.1 C
Right 76 3 104 7.9 A
Left 8 1 43 23.0 C
Thru 5 1 46 15.9 B
Right 2 0 61 7.1 A
Approach Movement
Simulated
Volume
Average
Queue
Maximum
Queue
Movement
DelayMovement
LOS
Approach
DelayApproach
LOS
Overall
DelayOverall
LOS
Northbound 10.7 B
11.2 B
Southbound 3.5 A
Eastbound 28.2 C
Westbound 29.2 C
Approach Movement
Simulated
Volume
Average
Queue
Maximum
Queue
Movement
DelayMovement
LOS
Approach
DelayApproach
LOS
Overall
DelayOverall
LOS
Northbound 22.0 C
26.9 C
Southbound 16.7 B
Eastbound 36.0 D
Westbound 35.0 C
Approach Movement
Simulated
Volume
Average
Queue
Maximum
Queue
Movement
DelayMovement
LOS
Approach
DelayApproach
LOS
Overall
DelayOverall
LOS
Northbound 3.6 A
9.3 A
Southbound 6.3 A
Eastbound 21.9 C
Westbound 22.9 C
Approach Movement
Simulated
Volume
Average
Queue
Maximum
Queue
Movement
DelayMovement
LOS
Approach
DelayApproach
LOS
Overall
DelayOverall
LOS
Northbound 5.8 A
7.6 A
Southbound 2.7 A
Eastbound 20.1 C
Westbound 18.4 B
* Results shown are the average of 5 model runs.
** Results shown are from all vehicles except transit vehicles.
H:\Projects\7939\SD\VISSIM\1_Baseline\11 MOEs\7939_1_Baseline_AM Arterial MOEs.xls 5/3/2013

Baseline Conditions VISSIM Model
Snelling Avenue Rapid Bus VISSIM Evaluation
Arterial MOEs (A.M. Peak Hour 7:30 - 8:30)
Ford at Fairview
(vph) (ft) (ft) (sec/veh) (sec/veh) (sec/veh)
Left 42 3 65 22.0 C
Thru 436 20 254 10.7 B
Right 49 20 271 9.1 A
Left 22 1 42 19.9 B
Thru 429 20 257 10.8 B
Right 66 23 273 8.9 A
Left 89 8 100 21.6 C
Thru 216 13 183 13.8 B
Right 29 1 89 8.5 A
Left 28 2 66 15.8 B
Thru 216 12 171 12.9 B
Right 7 0 47 5.7 A
Ford at Kenneth
(vph) (ft) (ft) (sec/veh) (sec/veh) (sec/veh)
Left 38 16 160 35.5 D
Thru 27 16 157 31.5 C
Right 32 13 155 15.1 B
Left 11 11 120 33.5 C
Thru 44 11 120 30.2 C
Right 38 7 114 10.8 B
Left 30 0 30 4.1 A
Thru 294 2 81 1.9 A
Right 20 2 92 1.2 A
Left 15 0 19 4.4 A
Thru 301 3 79 4.2 A
Right 8 3 82 1.8 A
Ford at Cleveland
(vph) (ft) (ft) (sec/veh) (sec/veh) (sec/veh)
Left 296 24 266 17.1 B
Thru 389 42 345 17.1 B
Right 56 39 347 19.1 B
Left 28 2 61 15.6 B
Thru 274 29 295 19.5 B
Right 86 27 292 22.0 C
Left 91 9 110 20.9 C
Thru 260 18 144 12.4 B
Right 124 16 144 13.9 B
Left 50 7 98 28.7 C
Thru 290 17 128 14.4 B
Right 36 14 128 12.1 B
Ford at Finn
(vph) (ft) (ft) (sec/veh) (sec/veh) (sec/veh)
Left 48 10 98 33.1 C
Thru 1 6 89 41.0 D
Right 42 6 101 5.1 A
Left 31 7 99 32.3 C
Thru 1 7 91 17.0 B
Right 29 4 95 10.7 B
Left 20 0 39 8.1 A
Thru 403 6 113 4.9 A
Right 20 4 121 3.7 A
Left 125 1 70 5.0 A
Thru 489 2 97 2.5 A
Right 59 2 101 2.2 A
Approach Movement
Simulated
Volume
Average
Queue
Maximum
Queue
Movement
DelayMovement
LOS
Approach
DelayApproach
LOS
Overall
DelayOverall
LOS
Northbound 11.5 B
12.4 B
Southbound 10.9 B
Eastbound 15.4 B
Westbound 13.1 B
Approach Movement
Simulated
Volume
Average
Queue
Maximum
Queue
Movement
DelayMovement
LOS
Approach
DelayApproach
LOS
Overall
DelayOverall
LOS
Northbound 27.7 C
8.0 A
Southbound 22.6 C
Eastbound 2.0 A
Westbound 4.2 A
Approach Movement
Simulated
Volume
Average
Queue
Maximum
Queue
Movement
DelayMovement
LOS
Approach
DelayApproach
LOS
Overall
DelayOverall
LOS
Northbound 17.2 B
16.8 B
Southbound 19.8 B
Eastbound 14.4 B
Westbound 16.0 B
Approach Movement
Simulated
Volume
Average
Queue
Maximum
Queue
Movement
DelayMovement
LOS
Approach
DelayApproach
LOS
Overall
DelayOverall
LOS
Northbound 20.3 C
5.8 A
Southbound 21.9 C
Eastbound 5.0 A
Westbound 2.9 A
* Results shown are the average of 5 model runs.
** Results shown are from all vehicles except transit vehicles.
H:\Projects\7939\SD\VISSIM\1_Baseline\11 MOEs\7939_1_Baseline_AM Arterial MOEs.xls 5/3/2013

Baseline Conditions VISSIM Model
Snelling Avenue Rapid Bus VISSIM Evaluation
Arterial MOEs (A.M. Peak Hour 7:30 - 8:30)
Ford at Cretin
(vph) (ft) (ft) (sec/veh) (sec/veh) (sec/veh)
Left 117 23 148 32.4 C
Right 65 1 75 3.9 A
Left 112 2 80 7.9 A
Thru 323 3 115 3.8 A
Thru 382 7 121 4.6 A
Right 182 6 127 5.3 A
46th at 46th
(vph) (ft) (ft) (sec/veh) (sec/veh) (sec/veh)
Left 28 18 170 55.1 E
Thru 33 18 162 49.2 D
Right 217 0 4 2.4 A
Left 50 11 135 39.3 D
Thru 16 15 157 52.8 D
Right 42 17 150 51.0 D
Left 25 2 85 16.0 B
Thru 171 15 142 22.5 C
Right 34 20 159 15.2 B
Left 142 5 127 9.6 A
Thru 221 7 118 8.8 A
Right 81 3 90 8.7 A
46th at 42nd
(vph) (ft) (ft) (sec/veh) (sec/veh) (sec/veh)
Left 5 1 41 24.7 C
Thru 5 1 48 21.5 C
Right 4 1 48 3.7 A
Left 28 6 88 21.3 C
Thru 4 5 87 26.2 C
Right 84 5 90 7.3 A
Left 49 7 105 27.2 C
Thru 192 17 131 22.9 C
Right 14 21 143 17.8 B
Left 4 1 39 21.4 C
Thru 272 18 175 16.8 B
Right 14 21 183 9.2 A
46th at Minnehaha
(vph) (ft) (ft) (sec/veh) (sec/veh) (sec/veh)
Left 22 31 252 26.3 C
Thru 274 32 260 22.5 C
Right 13 29 260 13.9 B
Left 38 23 258 29.7 C
Thru 166 23 255 21.0 C
Right 109 20 245 9.9 A
Left 127 14 163 23.0 C
Thru 208 14 164 15.4 B
Right 25 18 177 13.6 B
Left 74 15 122 36.7 D
Thru 181 33 194 32.8 C
Right 114 34 197 21.6 C
Approach MovementOverall
LOS
Simulated
Volume
Average
Queue
Maximum
Queue
Movement
DelayMovement
LOS
7.5 A
Southbound 22.3 C
Approach
DelayApproach
LOS
Overall
Delay
Eastbound 4.9 A
Westbound 4.8 A
Approach Movement
Simulated
Volume
Average
Queue
Maximum
Queue
Movement
DelayMovement
LOS
Approach
DelayApproach
LOS
Overall
DelayOverall
LOS
Northbound 13.2 B
16.4 B
Southbound 45.9 D
Eastbound 20.7 C
Westbound 9.0 A
Approach Movement
Simulated
Volume
Average
Queue
Maximum
Queue
Movement
DelayMovement
LOS
Approach
DelayApproach
LOS
Overall
DelayOverall
LOS
Northbound 17.4 B
18.2 B
Southbound 11.3 B
Eastbound 23.4 C
Westbound 16.5 B
Approach Movement
Simulated
Volume
Average
Queue
Maximum
Queue
Movement
DelayMovement
LOS
Approach
DelayApproach
LOS
Overall
DelayOverall
LOS
Northbound 22.4 C
22.3 C
Southbound 18.2 B
Eastbound 17.9 B
Westbound 30.1 C
* Results shown are the average of 5 model runs.
** Results shown are from all vehicles except transit vehicles.
H:\Projects\7939\SD\VISSIM\1_Baseline\11 MOEs\7939_1_Baseline_AM Arterial MOEs.xls 5/3/2013
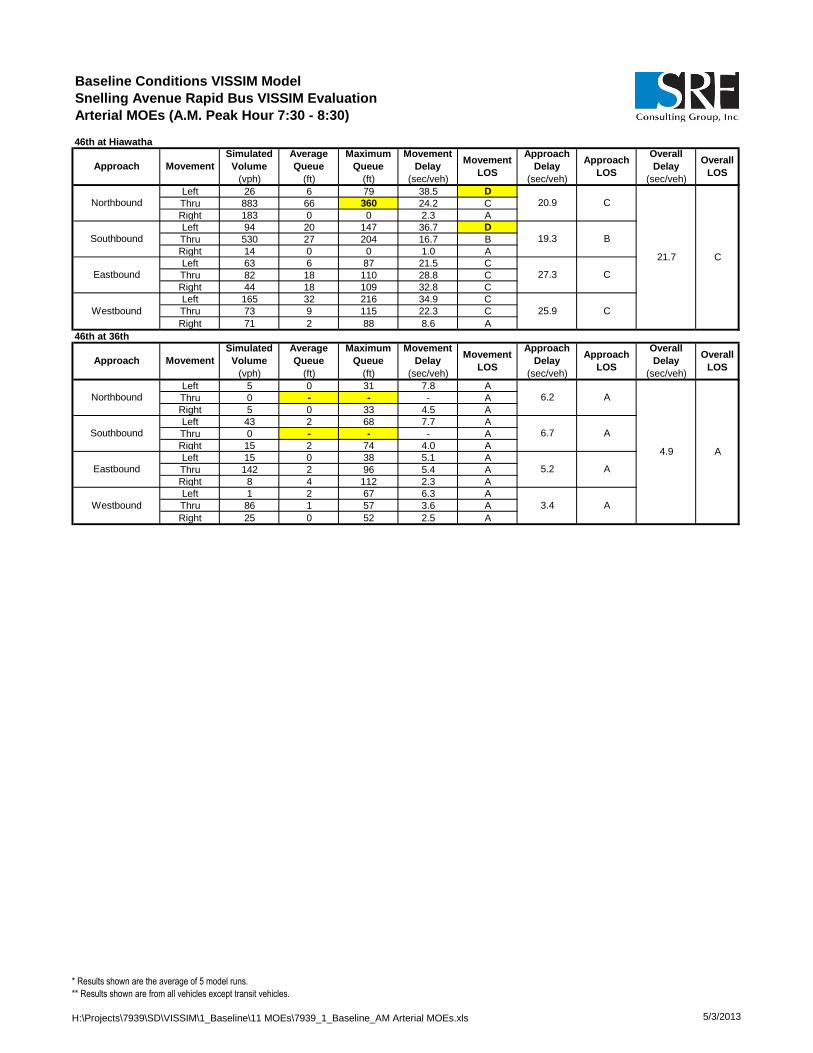
Baseline Conditions VISSIM Model
Snelling Avenue Rapid Bus VISSIM Evaluation
Arterial MOEs (A.M. Peak Hour 7:30 - 8:30)
46th at Hiawatha
(vph) (ft) (ft) (sec/veh) (sec/veh) (sec/veh)
Left 26 6 79 38.5 D
Thru 883 66 360 24.2 C
Right 183 0 0 2.3 A
Left 94 20 147 36.7 D
Thru 530 27 204 16.7 B
Right 14 0 0 1.0 A
Left 63 6 87 21.5 C
Thru 82 18 110 28.8 C
Right 44 18 109 32.8 C
Left 165 32 216 34.9 C
Thru 73 9 115 22.3 C
Right 71 2 88 8.6 A
46th at 36th
(vph) (ft) (ft) (sec/veh) (sec/veh) (sec/veh)
Left 5 0 31 7.8 A
Thru 0 - - - A
Right 5 0 33 4.5 A
Left 43 2 68 7.7 A
Thru 0 - - - A
Right 15 2 74 4.0 A
Left 15 0 38 5.1 A
Thru 142 2 96 5.4 A
Right 8 4 112 2.3 A
Left 1 2 67 6.3 A
Thru 86 1 57 3.6 A
Right 25 0 52 2.5 A
Approach Movement
Simulated
Volume
Average
Queue
Maximum
Queue
Movement
DelayMovement
LOS
B
Approach
DelayApproach
LOS
Overall
DelayOverall
LOS
C
C
Northbound 20.9 C
21.7 C
Southbound 19.3
Movement
Eastbound 27.3
25.9Westbound
Simulated
Volume
Average
Queue
Maximum
Queue
Movement
DelayMovement
LOS
Approach
Delay
A
Southbound 6.7 A
Eastbound
Approach
LOS
Overall
DelayOverall
LOSApproach
5.2 A
Westbound 3.4 A
Northbound 6.2 A
4.9
* Results shown are the average of 5 model runs.
** Results shown are from all vehicles except transit vehicles.
H:\Projects\7939\SD\VISSIM\1_Baseline\11 MOEs\7939_1_Baseline_AM Arterial MOEs.xls 5/3/2013
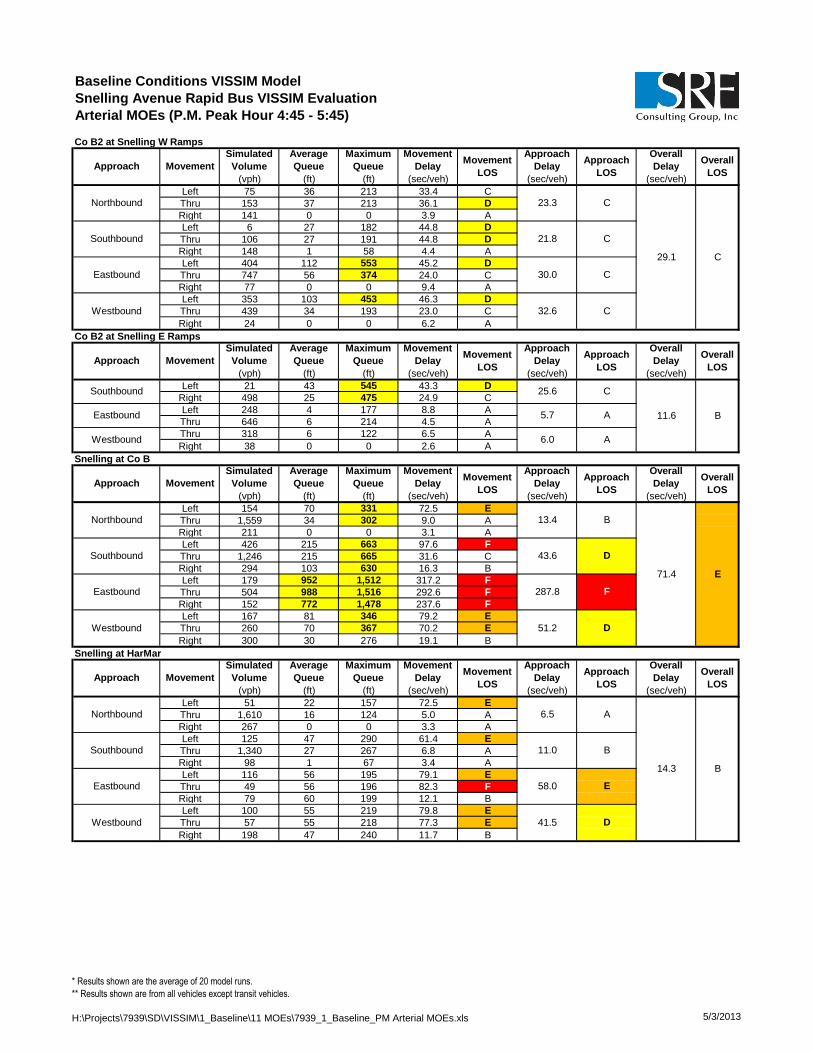
Baseline Conditions VISSIM Model
Snelling Avenue Rapid Bus VISSIM Evaluation
Arterial MOEs (P.M. Peak Hour 4:45 - 5:45)
Co B2 at Snelling W Ramps
(vph) (ft) (ft) (sec/veh) (sec/veh) (sec/veh)
Left 75 36 213 33.4 C
Thru 153 37 213 36.1 D
Right 141 0 0 3.9 A
Left 6 27 182 44.8 D
Thru 106 27 191 44.8 D
Right 148 1 58 4.4 A
Left 404 112 553 45.2 D
Thru 747 56 374 24.0 C
Right 77 0 0 9.4 A
Left 353 103 453 46.3 D
Thru 439 34 193 23.0 C
Right 24 0 0 6.2 A
Co B2 at Snelling E Ramps
(vph) (ft) (ft) (sec/veh) (sec/veh) (sec/veh)
Left 21 43 545 43.3 D
Right 498 25 475 24.9 C
Left 248 4 177 8.8 A
Thru 646 6 214 4.5 A
Thru 318 6 122 6.5 A
Right 38 0 0 2.6 A
Snelling at Co B
(vph) (ft) (ft) (sec/veh) (sec/veh) (sec/veh)
Left 154 70 331 72.5 E
Thru 1,559 34 302 9.0 A
Right 211 0 0 3.1 A
Left 426 215 663 97.6 F
Thru 1,246 215 665 31.6 C
Right 294 103 630 16.3 B
Left 179 952 1,512 317.2 F
Thru 504 988 1,516 292.6 F
Right 152 772 1,478 237.6 F
Left 167 81 346 79.2 E
Thru 260 70 367 70.2 E
Right 300 30 276 19.1 B
Snelling at HarMar
(vph) (ft) (ft) (sec/veh) (sec/veh) (sec/veh)
Left 51 22 157 72.5 E
Thru 1,610 16 124 5.0 A
Right 267 0 0 3.3 A
Left 125 47 290 61.4 E
Thru 1,340 27 267 6.8 A
Right 98 1 67 3.4 A
Left 116 56 195 79.1 E
Thru 49 56 196 82.3 F
Right 79 60 199 12.1 B
Left 100 55 219 79.8 E
Thru 57 55 218 77.3 E
Right 198 47 240 11.7 B
58.0 E
Westbound 41.5 D
Northbound 6.5 A
14.3 B
Southbound 11.0 B
Eastbound
Approach
LOS
Overall
DelayOverall
LOS
Simulated
Volume
Average
Queue
Maximum
Queue
Movement
DelayMovement
LOS
Approach
DelayApproach Movement
Eastbound 287.8 F
Westbound 51.2 D
Northbound 13.4 B
71.4 E
Southbound 43.6 D
Approach
DelayApproach
LOS
Overall
DelayOverall
LOS
Simulated
Volume
Average
Queue
Maximum
Queue
Movement
DelayMovement
LOS
5.7 A
Westbound 6.0 A
Approach Movement
11.6 B
Southbound 25.6 C
Eastbound
Approach
LOS
Overall
DelayOverall
LOS
Simulated
Volume
Average
Queue
Maximum
Queue
Movement
DelayMovement
LOS
Approach
Delay
Movement
Approach Movement
Simulated
Volume
Average
Queue
Maximum
Queue
Movement
DelayMovement
LOS
Approach
Delay
C
Southbound 21.8 C
Eastbound
Approach
LOS
Overall
DelayOverall
LOSApproach
30.0 C
Westbound 32.6 C
Northbound 23.3 C
29.1
* Results shown are the average of 20 model runs.
** Results shown are from all vehicles except transit vehicles.
H:\Projects\7939\SD\VISSIM\1_Baseline\11 MOEs\7939_1_Baseline_PM Arterial MOEs.xls 5/3/2013

Baseline Conditions VISSIM Model
Snelling Avenue Rapid Bus VISSIM Evaluation
Arterial MOEs (P.M. Peak Hour 4:45 - 5:45)
Snelling at Roselawn
(vph) (ft) (ft) (sec/veh) (sec/veh) (sec/veh)
Left 15 12 74 125.6 F
Thru 1,835 11 141 3.5 A
Right 27 0 16 3.4 A
Left 96 192 562 234.3 F
Thru 1,311 45 421 10.7 B
Right 102 1 57 6.3 A
Left 51 236 710 133.4 F
Thru 193 230 710 123.7 F
Right 70 5 140 50.8 D
Left 21 98 412 136.0 F
Thru 93 94 399 118.7 F
Right 45 2 78 28.5 C
Snelling at Larpenteur
(vph) (ft) (ft) (sec/veh) (sec/veh) (sec/veh)
Left 221 122 468 95.2 F
Thru 1,699 419 1,343 50.6 D
Right 185 5 129 29.9 C
Left 175 391 1,270 218.9 F
Thru 1,052 311 1,270 53.6 D
Right 174 6 130 28.0 C
Left 27 8 74 75.7 E
Thru 699 318 866 92.2 F
Right 196 342 893 94.6 F
Left 153 73 313 79.3 E
Thru 352 87 392 49.7 D
Right 151 101 416 41.9 D
Snelling at Hoyt
(vph) (ft) (ft) (sec/veh) (sec/veh) (sec/veh)
Left 7 0 13 16.8 B
Thru 2,067 47 706 10.2 B
Right 124 0 7 6.6 A
Left 45 2 75 30.1 C
Thru 1,345 4 106 2.5 A
Right 9 0 0 2.6 A
Left 23 11 86 83.2 F
Thru 6 3 58 79.0 E
Right 1 1 68 13.6 B
Left 41 21 130 86.0 F
Thru 10 7 85 80.3 F
Right 29 8 102 26.6 C
Snelling at Midway
(vph) (ft) (ft) (sec/veh) (sec/veh) (sec/veh)
Left 53 1 66 16.2 B
Thru 2,102 80 804 11.9 B
Right 66 0 55 10.2 B
Left 76 1 72 17.8 B
Thru 1,266 9 218 4.5 A
Right 49 13 252 5.4 A
Left 46 24 133 87.1 F
Thru 30 14 96 80.7 F
Right 39 2 66 8.5 A
Left 19 17 112 87.4 F
Thru 15 17 110 80.0 F
Right 51 2 66 13.0 B
58.8 E
Westbound 41.7 D
Northbound 11.9 B
11.6 B
Southbound 5.3 A
Eastbound
Approach
LOS
Overall
DelayOverall
LOS
Simulated
Volume
Average
Queue
Maximum
Queue
Movement
DelayMovement
LOS
Approach
DelayApproach Movement
Eastbound 79.5 E
Westbound 63.6 E
Northbound 10.1 B
9.3 A
Southbound 3.4 A
Approach
DelayApproach
LOS
Overall
DelayOverall
LOS
Simulated
Volume
Average
Queue
Maximum
Queue
Movement
DelayMovement
LOS
92.2 F
Westbound 54.8 D
Approach Movement
Northbound 53.4 D
65.5 E
Southbound 71.2 E
Eastbound
Approach
LOS
Overall
DelayOverall
LOS
Simulated
Volume
Average
Queue
Maximum
Queue
Movement
DelayMovement
LOS
Approach
DelayApproach Movement
Eastbound 109.0 F
Westbound 95.6 F
Northbound 4.5 A
24.6 C
Southbound 24.6 C
Approach
DelayApproach
LOS
Overall
DelayOverall
LOS
Simulated
Volume
Average
Queue
Maximum
Queue
Movement
DelayMovement
LOSApproach Movement
* Results shown are the average of 20 model runs.
** Results shown are from all vehicles except transit vehicles.
H:\Projects\7939\SD\VISSIM\1_Baseline\11 MOEs\7939_1_Baseline_PM Arterial MOEs.xls 5/3/2013
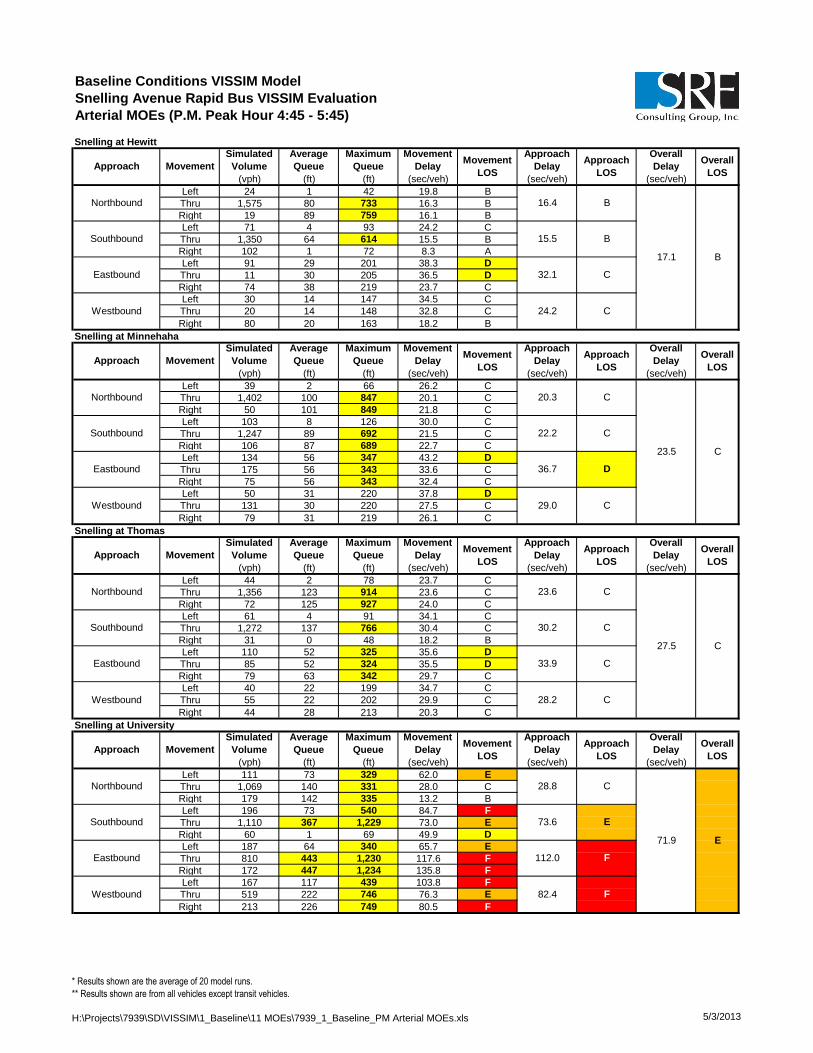
Baseline Conditions VISSIM Model
Snelling Avenue Rapid Bus VISSIM Evaluation
Arterial MOEs (P.M. Peak Hour 4:45 - 5:45)
Snelling at Hewitt
(vph) (ft) (ft) (sec/veh) (sec/veh) (sec/veh)
Left 24 1 42 19.8 B
Thru 1,575 80 733 16.3 B
Right 19 89 759 16.1 B
Left 71 4 93 24.2 C
Thru 1,350 64 614 15.5 B
Right 102 1 72 8.3 A
Left 91 29 201 38.3 D
Thru 11 30 205 36.5 D
Right 74 38 219 23.7 C
Left 30 14 147 34.5 C
Thru 20 14 148 32.8 C
Right 80 20 163 18.2 B
Snelling at Minnehaha
(vph) (ft) (ft) (sec/veh) (sec/veh) (sec/veh)
Left 39 2 66 26.2 C
Thru 1,402 100 847 20.1 C
Right 50 101 849 21.8 C
Left 103 8 126 30.0 C
Thru 1,247 89 692 21.5 C
Right 106 87 689 22.7 C
Left 134 56 347 43.2 D
Thru 175 56 343 33.6 C
Right 75 56 343 32.4 C
Left 50 31 220 37.8 D
Thru 131 30 220 27.5 C
Right 79 31 219 26.1 C
Snelling at Thomas
(vph) (ft) (ft) (sec/veh) (sec/veh) (sec/veh)
Left 44 2 78 23.7 C
Thru 1,356 123 914 23.6 C
Right 72 125 927 24.0 C
Left 61 4 91 34.1 C
Thru 1,272 137 766 30.4 C
Right 31 0 48 18.2 B
Left 110 52 325 35.6 D
Thru 85 52 324 35.5 D
Right 79 63 342 29.7 C
Left 40 22 199 34.7 C
Thru 55 22 202 29.9 C
Right 44 28 213 20.3 C
Snelling at University
(vph) (ft) (ft) (sec/veh) (sec/veh) (sec/veh)
Left 111 73 329 62.0 E
Thru 1,069 140 331 28.0 C
Right 179 142 335 13.2 B
Left 196 73 540 84.7 F
Thru 1,110 367 1,229 73.0 E
Right 60 1 69 49.9 D
Left 187 64 340 65.7 E
Thru 810 443 1,230 117.6 F
Right 172 447 1,234 135.8 F
Left 167 117 439 103.8 F
Thru 519 222 746 76.3 E
Right 213 226 749 80.5 F
112.0 F
Westbound 82.4 F
Northbound 28.8 C
71.9 E
Southbound 73.6 E
Eastbound
Approach
LOS
Overall
DelayOverall
LOS
Simulated
Volume
Average
Queue
Maximum
Queue
Movement
DelayMovement
LOS
Approach
DelayApproach Movement
Eastbound 33.9 C
Westbound 28.2 C
Northbound 23.6 C
27.5 C
Southbound 30.2 C
Approach
DelayApproach
LOS
Overall
DelayOverall
LOS
Simulated
Volume
Average
Queue
Maximum
Queue
Movement
DelayMovement
LOS
36.7 D
Westbound 29.0 C
Approach Movement
Northbound 20.3 C
23.5 C
Southbound 22.2 C
Eastbound
Approach
LOS
Overall
DelayOverall
LOS
Simulated
Volume
Average
Queue
Maximum
Queue
Movement
DelayMovement
LOS
Approach
DelayApproach Movement
Eastbound 32.1 C
Westbound 24.2 C
Northbound 16.4 B
17.1 B
Southbound 15.5 B
Approach
DelayApproach
LOS
Overall
DelayOverall
LOS
Simulated
Volume
Average
Queue
Maximum
Queue
Movement
DelayMovement
LOSApproach Movement
* Results shown are the average of 20 model runs.
** Results shown are from all vehicles except transit vehicles.
H:\Projects\7939\SD\VISSIM\1_Baseline\11 MOEs\7939_1_Baseline_PM Arterial MOEs.xls 5/3/2013
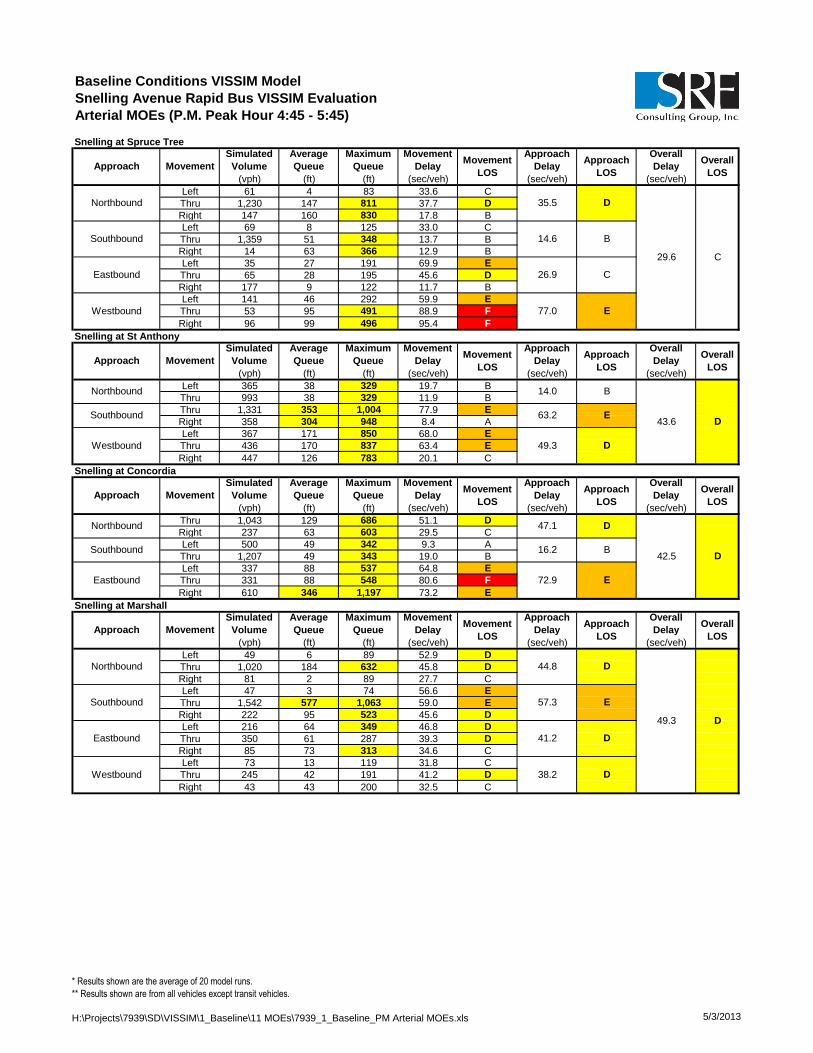
Baseline Conditions VISSIM Model
Snelling Avenue Rapid Bus VISSIM Evaluation
Arterial MOEs (P.M. Peak Hour 4:45 - 5:45)
Snelling at Spruce Tree
(vph) (ft) (ft) (sec/veh) (sec/veh) (sec/veh)
Left 61 4 83 33.6 C
Thru 1,230 147 811 37.7 D
Right 147 160 830 17.8 B
Left 69 8 125 33.0 C
Thru 1,359 51 348 13.7 B
Right 14 63 366 12.9 B
Left 35 27 191 69.9 E
Thru 65 28 195 45.6 D
Right 177 9 122 11.7 B
Left 141 46 292 59.9 E
Thru 53 95 491 88.9 F
Right 96 99 496 95.4 F
Snelling at St Anthony
(vph) (ft) (ft) (sec/veh) (sec/veh) (sec/veh)
Left 365 38 329 19.7 B
Thru 993 38 329 11.9 B
Thru 1,331 353 1,004 77.9 E
Right 358 304 948 8.4 A
Left 367 171 850 68.0 E
Thru 436 170 837 63.4 E
Right 447 126 783 20.1 C
Snelling at Concordia
(vph) (ft) (ft) (sec/veh) (sec/veh) (sec/veh)
Thru 1,043 129 686 51.1 D
Right 237 63 603 29.5 C
Left 500 49 342 9.3 A
Thru 1,207 49 343 19.0 B
Left 337 88 537 64.8 E
Thru 331 88 548 80.6 F
Right 610 346 1,197 73.2 E
Snelling at Marshall
(vph) (ft) (ft) (sec/veh) (sec/veh) (sec/veh)
Left 49 6 89 52.9 D
Thru 1,020 184 632 45.8 D
Right 81 2 89 27.7 C
Left 47 3 74 56.6 E
Thru 1,542 577 1,063 59.0 E
Right 222 95 523 45.6 D
Left 216 64 349 46.8 D
Thru 350 61 287 39.3 D
Right 85 73 313 34.6 C
Left 73 13 119 31.8 C
Thru 245 42 191 41.2 D
Right 43 43 200 32.5 C
41.2 D
Westbound 38.2 D
Northbound 44.8 D
49.3 D
Southbound 57.3 E
Eastbound
Approach
LOS
Overall
DelayOverall
LOS
Simulated
Volume
Average
Queue
Maximum
Queue
Movement
DelayMovement
LOS
Approach
DelayApproach Movement
Eastbound 72.9 E
Northbound 47.1 D
42.5 DSouthbound 16.2 B
Approach
DelayApproach
LOS
Overall
DelayOverall
LOS
Simulated
Volume
Average
Queue
Maximum
Queue
Movement
DelayMovement
LOS
Westbound 49.3 D
Approach Movement
Northbound 14.0 B
43.6 DSouthbound 63.2 E
Approach
LOS
Overall
DelayOverall
LOS
Simulated
Volume
Average
Queue
Maximum
Queue
Movement
DelayMovement
LOS
Approach
DelayApproach Movement
Eastbound 26.9 C
Westbound 77.0 E
Northbound 35.5 D
29.6 C
Southbound 14.6 B
Approach
DelayApproach
LOS
Overall
DelayOverall
LOS
Simulated
Volume
Average
Queue
Maximum
Queue
Movement
DelayMovement
LOSApproach Movement
* Results shown are the average of 20 model runs.
** Results shown are from all vehicles except transit vehicles.
H:\Projects\7939\SD\VISSIM\1_Baseline\11 MOEs\7939_1_Baseline_PM Arterial MOEs.xls 5/3/2013

Baseline Conditions VISSIM Model
Snelling Avenue Rapid Bus VISSIM Evaluation
Arterial MOEs (P.M. Peak Hour 4:45 - 5:45)
Snelling at Selby
(vph) (ft) (ft) (sec/veh) (sec/veh) (sec/veh)
Left 25 16 122 122.5 F
Thru 871 201 682 57.0 E
Right 54 211 698 56.6 E
Left 388 226 688 79.1 E
Thru 1,118 35 613 11.5 B
Right 185 37 618 9.1 A
Left 53 12 151 51.4 D
Thru 285 64 408 31.9 C
Right 38 67 416 25.4 C
Left 43 8 89 44.3 D
Thru 204 76 474 34.0 C
Right 210 80 482 26.5 C
Snelling at Summit
(vph) (ft) (ft) (sec/veh) (sec/veh) (sec/veh)
Left 32 3 57 33.6 C
Thru 724 52 296 19.4 B
Right 70 52 294 23.6 C
Left 93 22 253 34.9 C
Thru 986 101 648 27.2 C
Right 128 101 651 27.2 C
Left 75 37 408 64.3 E
Thru 419 79 501 28.6 C
Right 18 89 518 26.3 C
Left 60 8 219 42.1 D
Thru 424 124 596 32.8 C
Right 166 137 615 29.0 C
Snelling at Grand
(vph) (ft) (ft) (sec/veh) (sec/veh) (sec/veh)
Left 71 7 130 28.5 C
Thru 597 79 434 31.6 C
Right 138 82 443 29.3 C
Left 186 24 222 26.6 C
Thru 748 32 478 11.9 B
Right 130 33 495 10.9 B
Left 76 13 242 40.7 D
Thru 423 118 596 35.3 D
Right 64 127 613 30.8 C
Left 95 19 329 45.3 D
Thru 346 129 594 39.4 D
Right 149 138 610 33.8 C
Snelling at St Clair
(vph) (ft) (ft) (sec/veh) (sec/veh) (sec/veh)
Left 55 11 103 43.5 D
Thru 566 14 99 8.5 A
Right 87 1 56 4.9 A
Left 104 15 162 31.1 C
Thru 671 37 257 16.1 B
Right 118 44 271 14.6 B
Left 75 48 380 35.0 D
Thru 310 47 382 24.1 C
Right 42 57 404 15.6 B
Left 77 58 456 34.1 C
Thru 316 56 451 25.3 C
Right 151 66 469 17.4 B
25.1 C
Westbound 24.3 C
Northbound 10.8 B
18.4 B
Southbound 17.7 B
Eastbound
Approach
LOS
Overall
DelayOverall
LOS
Simulated
Volume
Average
Queue
Maximum
Queue
Movement
DelayMovement
LOS
Approach
DelayApproach Movement
Eastbound 35.5 D
Westbound 38.9 D
Northbound 30.9 C
27.5 C
Southbound 14.3 B
Approach
DelayApproach
LOS
Overall
DelayOverall
LOS
Simulated
Volume
Average
Queue
Maximum
Queue
Movement
DelayMovement
LOS
33.7 C
Westbound 32.7 C
Approach Movement
Northbound 20.3 C
27.8 C
Southbound 27.8 C
Eastbound
Approach
LOS
Overall
DelayOverall
LOS
Simulated
Volume
Average
Queue
Maximum
Queue
Movement
DelayMovement
LOS
Approach
DelayApproach Movement
Eastbound 34.0 C
Westbound 31.5 C
Northbound 58.7 E
36.9 D
Southbound 26.7 C
Approach
DelayApproach
LOS
Overall
DelayOverall
LOS
Simulated
Volume
Average
Queue
Maximum
Queue
Movement
DelayMovement
LOSApproach Movement
* Results shown are the average of 20 model runs.
** Results shown are from all vehicles except transit vehicles.
H:\Projects\7939\SD\VISSIM\1_Baseline\11 MOEs\7939_1_Baseline_PM Arterial MOEs.xls 5/3/2013

Baseline Conditions VISSIM Model
Snelling Avenue Rapid Bus VISSIM Evaluation
Arterial MOEs (P.M. Peak Hour 4:45 - 5:45)
Snelling at Jefferson
(vph) (ft) (ft) (sec/veh) (sec/veh) (sec/veh)
Left 7 24 318 16.0 B
Thru 673 24 318 12.7 B
Right 44 28 332 12.2 B
Left 38 20 187 15.9 B
Thru 754 20 187 8.7 A
Right 1 24 197 14.8 B
Left 11 20 156 39.2 D
Thru 82 20 153 36.1 D
Right 8 29 177 23.7 C
Left 40 34 226 42.1 D
Thru 85 34 227 39.3 D
Right 37 42 242 26.4 C
Snelling at Randolph
(vph) (ft) (ft) (sec/veh) (sec/veh) (sec/veh)
Left 53 5 89 23.2 C
Thru 498 48 288 28.6 C
Right 105 5 180 13.1 B
Left 147 13 180 21.2 C
Thru 545 31 265 17.9 B
Right 117 3 137 9.3 A
Left 123 33 495 39.1 D
Thru 422 108 601 33.5 C
Right 41 1 60 19.3 B
Left 88 11 126 28.9 C
Thru 346 77 545 30.1 C
Right 103 8 310 16.1 B
Snelling at Highland
(vph) (ft) (ft) (sec/veh) (sec/veh) (sec/veh)
Left 8 5 101 8.1 A
Thru 608 5 102 3.2 A
Right 100 7 116 3.0 A
Left 33 12 251 14.2 B
Thru 603 12 253 7.7 A
Right 36 14 262 7.4 A
Left 23 11 109 21.2 C
Thru 75 11 111 21.4 C
Right 18 1 41 6.3 A
Left 110 17 137 29.4 C
Thru 68 8 108 21.4 C
Right 21 10 120 8.9 A
Snelling at Ford
(vph) (ft) (ft) (sec/veh) (sec/veh) (sec/veh)
Left 124 13 147 16.7 B
Thru 448 13 146 5.6 A
Right 5 18 163 4.0 A
Left 13 5 113 7.3 A
Thru 461 5 112 4.1 A
Right 254 3 131 4.6 A
Left 266 23 170 24.6 C
Thru 8 23 167 26.7 C
Right 144 6 136 10.8 B
Left 8 1 42 21.4 C
Thru 5 1 38 18.6 B
Right 3 0 57 6.3 A
19.9 B
Westbound 17.7 B
Northbound 8.0 A
9.4 A
Southbound 4.3 A
Eastbound
Approach
LOS
Overall
DelayOverall
LOS
Simulated
Volume
Average
Queue
Maximum
Queue
Movement
DelayMovement
LOS
Approach
DelayApproach Movement
Eastbound 19.0 B
Westbound 24.5 C
Northbound 3.2 A
8.7 A
Southbound 8.0 A
Approach
DelayApproach
LOS
Overall
DelayOverall
LOS
Simulated
Volume
Average
Queue
Maximum
Queue
Movement
DelayMovement
LOS
33.7 C
Westbound 27.2 C
Approach Movement
Northbound 25.7 C
25.2 C
Southbound 17.2 B
Eastbound
Approach
LOS
Overall
DelayOverall
LOS
Simulated
Volume
Average
Queue
Maximum
Queue
Movement
DelayMovement
LOS
Approach
DelayApproach Movement
Eastbound 35.4 D
Westbound 37.1 D
Northbound 12.7 B
14.6 B
Southbound 9.0 A
Approach
DelayApproach
LOS
Overall
DelayOverall
LOS
Simulated
Volume
Average
Queue
Maximum
Queue
Movement
DelayMovement
LOSApproach Movement
* Results shown are the average of 20 model runs.
** Results shown are from all vehicles except transit vehicles.
H:\Projects\7939\SD\VISSIM\1_Baseline\11 MOEs\7939_1_Baseline_PM Arterial MOEs.xls 5/3/2013

Baseline Conditions VISSIM Model
Snelling Avenue Rapid Bus VISSIM Evaluation
Arterial MOEs (P.M. Peak Hour 4:45 - 5:45)
Ford at Fairview
(vph) (ft) (ft) (sec/veh) (sec/veh) (sec/veh)
Left 73 13 132 40.4 D
Thru 498 30 358 12.8 B
Right 25 31 371 10.8 B
Left 26 1 47 21.6 C
Thru 464 41 464 15.8 B
Right 181 47 482 14.2 B
Left 144 41 225 54.2 D
Thru 367 29 351 18.0 B
Right 69 2 94 11.6 B
Left 18 1 57 22.9 C
Thru 350 29 274 16.8 B
Right 16 0 58 9.0 A
Ford at Kenneth
(vph) (ft) (ft) (sec/veh) (sec/veh) (sec/veh)
Left 55 30 228 51.6 D
Thru 21 30 227 48.7 D
Right 37 24 224 26.5 C
Left 29 18 150 46.1 D
Thru 26 18 154 46.3 D
Right 43 15 151 19.7 B
Left 46 1 52 7.5 A
Thru 506 4 97 2.5 A
Right 48 5 107 1.3 A
Left 14 0 29 9.2 A
Thru 568 7 141 5.8 A
Right 21 7 142 4.3 A
Ford at Cleveland
(vph) (ft) (ft) (sec/veh) (sec/veh) (sec/veh)
Left 247 45 301 33.0 C
Thru 352 63 390 27.0 C
Right 38 61 387 27.2 C
Left 79 10 240 35.8 D
Thru 404 138 757 41.5 D
Right 170 138 758 46.0 D
Left 159 29 316 33.3 C
Thru 489 73 410 22.8 C
Right 270 74 411 34.2 C
Left 84 14 137 33.2 C
Thru 498 55 301 26.4 C
Right 82 55 302 27.3 C
Ford at Finn
(vph) (ft) (ft) (sec/veh) (sec/veh) (sec/veh)
Left 200 61 280 50.0 D
Thru 10 60 287 32.1 C
Right 176 63 286 10.0 A
Left 114 38 250 41.1 D
Thru 16 38 254 35.7 D
Right 66 38 255 25.7 C
Left 52 3 142 17.5 B
Thru 638 32 306 14.2 B
Right 44 33 315 10.6 B
Left 195 10 154 13.6 B
Thru 660 14 170 6.9 A
Right 52 14 175 5.3 A
14.2 B
Westbound 8.2 A
Northbound 31.3 C
16.6 B
Southbound 35.5 D
Eastbound
Approach
LOS
Overall
DelayOverall
LOS
Simulated
Volume
Average
Queue
Maximum
Queue
Movement
DelayMovement
LOS
Approach
DelayApproach Movement
Eastbound 28.0 C
Westbound 27.4 C
Northbound 29.3 C
31.3 C
Southbound 42.0 D
Approach
DelayApproach
LOS
Overall
DelayOverall
LOS
Simulated
Volume
Average
Queue
Maximum
Queue
Movement
DelayMovement
LOS
2.8 A
Westbound 5.8 A
Approach Movement
Northbound 42.8 D
9.5 A
Southbound 34.4 C
Eastbound
Approach
LOS
Overall
DelayOverall
LOS
Simulated
Volume
Average
Queue
Maximum
Queue
Movement
DelayMovement
LOS
Approach
DelayApproach Movement
Eastbound 26.3 C
Westbound 16.8 B
Northbound 16.1 B
18.7 B
Southbound 15.6 B
Approach
DelayApproach
LOS
Overall
DelayOverall
LOS
Simulated
Volume
Average
Queue
Maximum
Queue
Movement
DelayMovement
LOSApproach Movement
* Results shown are the average of 20 model runs.
** Results shown are from all vehicles except transit vehicles.
H:\Projects\7939\SD\VISSIM\1_Baseline\11 MOEs\7939_1_Baseline_PM Arterial MOEs.xls 5/3/2013
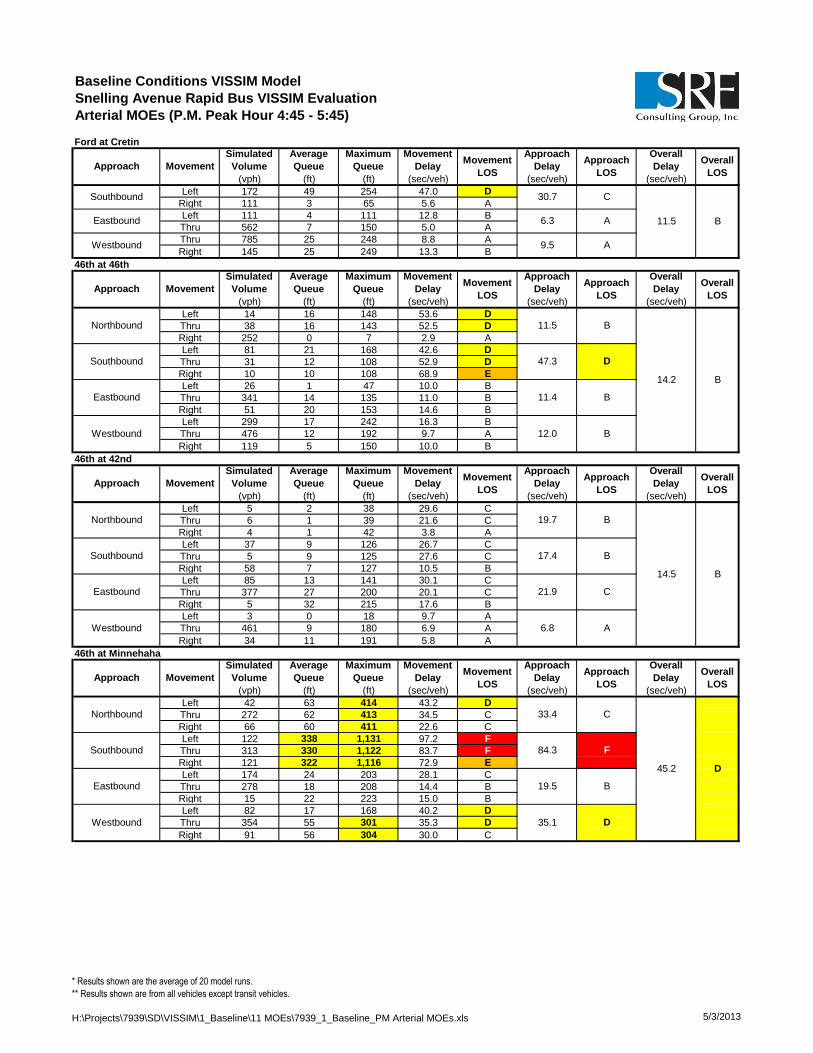
Baseline Conditions VISSIM Model
Snelling Avenue Rapid Bus VISSIM Evaluation
Arterial MOEs (P.M. Peak Hour 4:45 - 5:45)
Ford at Cretin
(vph) (ft) (ft) (sec/veh) (sec/veh) (sec/veh)
Left 172 49 254 47.0 D
Right 111 3 65 5.6 A
Left 111 4 111 12.8 B
Thru 562 7 150 5.0 A
Thru 785 25 248 8.8 A
Right 145 25 249 13.3 B
46th at 46th
(vph) (ft) (ft) (sec/veh) (sec/veh) (sec/veh)
Left 14 16 148 53.6 D
Thru 38 16 143 52.5 D
Right 252 0 7 2.9 A
Left 81 21 168 42.6 D
Thru 31 12 108 52.9 D
Right 10 10 108 68.9 E
Left 26 1 47 10.0 B
Thru 341 14 135 11.0 B
Right 51 20 153 14.6 B
Left 299 17 242 16.3 B
Thru 476 12 192 9.7 A
Right 119 5 150 10.0 B
46th at 42nd
(vph) (ft) (ft) (sec/veh) (sec/veh) (sec/veh)
Left 5 2 38 29.6 C
Thru 6 1 39 21.6 C
Right 4 1 42 3.8 A
Left 37 9 126 26.7 C
Thru 5 9 125 27.6 C
Right 58 7 127 10.5 B
Left 85 13 141 30.1 C
Thru 377 27 200 20.1 C
Right 5 32 215 17.6 B
Left 3 0 18 9.7 A
Thru 461 9 180 6.9 A
Right 34 11 191 5.8 A
46th at Minnehaha
(vph) (ft) (ft) (sec/veh) (sec/veh) (sec/veh)
Left 42 63 414 43.2 D
Thru 272 62 413 34.5 C
Right 66 60 411 22.6 C
Left 122 338 1,131 97.2 F
Thru 313 330 1,122 83.7 F
Right 121 322 1,116 72.9 E
Left 174 24 203 28.1 C
Thru 278 18 208 14.4 B
Right 15 22 223 15.0 B
Left 82 17 168 40.2 D
Thru 354 55 301 35.3 D
Right 91 56 304 30.0 C
19.5 B
Westbound 35.1 D
Northbound 33.4 C
45.2 D
Southbound 84.3 F
Eastbound
Approach
LOS
Overall
DelayOverall
LOS
Simulated
Volume
Average
Queue
Maximum
Queue
Movement
DelayMovement
LOS
Approach
DelayApproach Movement
Eastbound 21.9 C
Westbound 6.8 A
Northbound 19.7 B
14.5 B
Southbound 17.4 B
Approach
DelayApproach
LOS
Overall
DelayOverall
LOS
Simulated
Volume
Average
Queue
Maximum
Queue
Movement
DelayMovement
LOS
11.4 B
Westbound 12.0 B
Approach Movement
Northbound 11.5 B
14.2 B
Southbound 47.3 D
Eastbound
Approach
LOS
Overall
DelayOverall
LOS
Simulated
Volume
Average
Queue
Maximum
Queue
Movement
DelayMovement
LOS
Approach
DelayApproach Movement
Eastbound 6.3 A
Westbound 9.5 A
11.5 B
Southbound 30.7 C
Approach
DelayApproach
LOS
Overall
DelayOverall
LOS
Simulated
Volume
Average
Queue
Maximum
Queue
Movement
DelayMovement
LOSApproach Movement
* Results shown are the average of 20 model runs.
** Results shown are from all vehicles except transit vehicles.
H:\Projects\7939\SD\VISSIM\1_Baseline\11 MOEs\7939_1_Baseline_PM Arterial MOEs.xls 5/3/2013

Baseline Conditions VISSIM Model
Snelling Avenue Rapid Bus VISSIM Evaluation
Arterial MOEs (P.M. Peak Hour 4:45 - 5:45)
46th at Hiawatha
(vph) (ft) (ft) (sec/veh) (sec/veh) (sec/veh)
Left 84 20 142 42.0 D
Thru 806 71 362 27.9 C
Right 243 0 2 2.7 A
Left 145 33 197 40.2 D
Thru 858 64 353 24.2 C
Right 40 0 0 2.2 A
Left 52 7 91 25.8 C
Thru 79 17 105 34.5 C
Right 22 17 104 33.6 C
Left 201 52 357 43.3 D
Thru 148 20 248 26.8 C
Right 167 6 195 12.5 B
46th at 36th
(vph) (ft) (ft) (sec/veh) (sec/veh) (sec/veh)
Left 1 0 29 9.6 A
Thru 2 0 26 10.4 B
Right 0 - - - A
Left 38 1 55 6.1 A
Thru 1 1 60 6.9 A
Right 5 1 63 4.0 A
Left 5 0 20 4.8 A
Thru 115 1 66 4.4 A
Right 1 2 88 1.8 A
Left 0 - - - A
Thru 241 3 142 2.8 A
Right 30 0 56 2.0 A
4.4 A
Westbound 2.7 A
Northbound 10.0 A
3.5 A
Southbound 5.9 A
Eastbound
Approach
LOS
Overall
DelayOverall
LOSApproach
Simulated
Volume
Average
Queue
Maximum
Queue
Movement
DelayMovement
LOS
Approach
DelayMovement
Eastbound 31.4
28.6Westbound C
Northbound 23.5 C
25.6 C
Southbound 25.6 C
Approach
DelayApproach
LOS
Overall
DelayOverall
LOS
C
Simulated
Volume
Average
Queue
Maximum
Queue
Movement
DelayMovement
LOSApproach Movement
* Results shown are the average of 20 model runs.
** Results shown are from all vehicles except transit vehicles.
H:\Projects\7939\SD\VISSIM\1_Baseline\11 MOEs\7939_1_Baseline_PM Arterial MOEs.xls 5/3/2013

Year 2013 Preliminary Rapid Bus Conditions VISSIM Model
Snelling Avenue Rapid Bus VISSIM Evaluation
Arterial MOEs (A.M. Peak Hour 7:30 - 8:30)
Co B2 at Snelling W Ramps
(vph) (ft) (ft) (sec/veh) (sec/veh) (sec/veh)
Left 11 8 93 29.9 C
Thru 21 8 91 32.9 C
Right 6 0 0 1.6 A
Left 20 8 79 37.3 D
Thru 33 8 79 34.9 C
Right 37 0 0 2.6 A
Left 22 4 56 36.8 D
Thru 101 2 51 7.1 A
Right 14 0 0 3.6 A
Left 118 34 244 43.4 D
Thru 446 8 141 6.2 A
Right 78 0 0 1.3 A
Co B2 at Snelling E Ramps
(vph) (ft) (ft) (sec/veh) (sec/veh) (sec/veh)
Left 50 10 113 31.9 C
Right 148 0 39 9.3 A
Left 13 0 34 3.8 A
Thru 114 0 29 1.3 A
Thru 492 2 87 2.4 A
Right 30 0 0 1.4 A
Snelling at Co B
(vph) (ft) (ft) (sec/veh) (sec/veh) (sec/veh)
Left 134 76 316 88.0 F
Thru 882 11 188 5.4 A
Right 83 0 0 1.9 A
Left 153 85 680 87.7 F
Thru 1,538 145 769 25.2 C
Right 332 70 738 19.0 B
Left 103 55 326 79.0 E
Thru 237 82 315 85.6 F
Right 46 2 91 13.3 B
Left 137 57 278 67.8 E
Thru 271 82 315 81.1 F
Right 129 5 129 12.5 B
Snelling at HarMar
(vph) (ft) (ft) (sec/veh) (sec/veh) (sec/veh)
Left 55 28 163 81.3 F
Thru 954 17 238 9.2 A
Right 57 0 0 1.7 A
Left 58 25 169 68.7 E
Thru 1,596 6 129 2.3 A
Right 69 0 43 2.3 A
Left 64 37 153 82.1 F
Thru 31 37 152 80.4 F
Right 114 40 156 14.7 B
Left 39 26 130 88.4 F
Thru 18 26 130 85.9 F
Right 78 7 116 8.1 A
44.9 D
Westbound 41.7 D
Northbound 12.5 B
11.6 B
Southbound 4.6 A
Eastbound
Approach
LOS
Overall
DelayOverall
LOS
Simulated
Volume
Average
Queue
Maximum
Queue
Movement
DelayMovement
LOS
Approach
DelayApproach Movement
Eastbound 75.2 E
Westbound 61.2 E
Northbound 15.3 B
33.9 C
Southbound 28.9 C
Approach
DelayApproach
LOS
Overall
DelayOverall
LOS
Simulated
Volume
Average
Queue
Maximum
Queue
Movement
DelayMovement
LOS
1.5 A
Westbound 2.3 A
Approach Movement
5.2 A
Southbound 15.0 B
Eastbound
Approach
LOS
Overall
DelayOverall
LOS
Simulated
Volume
Average
Queue
Maximum
Queue
Movement
DelayMovement
LOS
Approach
Delay
Movement
Approach Movement
Simulated
Volume
Average
Queue
Maximum
Queue
Movement
DelayMovement
LOS
Approach
Delay
B
Southbound 22.3 C
Eastbound
Approach
LOS
Overall
DelayOverall
LOSApproach
11.5 B
Westbound 12.4 B
Northbound 27.0 C
13.9
* Results shown are the average of 5 model runs.
** Results shown are from all vehicles except transit vehicles.
H:\Projects\7939\SD\VISSIM\2_RB_Prelim\11 MOEs\7939_Prelim_RB_AM Arterial MOEs.xls 4/8/2013

Year 2013 Preliminary Rapid Bus Conditions VISSIM Model
Snelling Avenue Rapid Bus VISSIM Evaluation
Arterial MOEs (A.M. Peak Hour 7:30 - 8:30)
Snelling at Roselawn
(vph) (ft) (ft) (sec/veh) (sec/veh) (sec/veh)
Left 10 4 60 73.0 E
Thru 940 9 243 4.8 A
Right 10 0 31 2.7 A
Left 33 24 112 114.7 F
Thru 1,672 5 115 2.4 A
Right 47 0 24 2.4 A
Left 24 50 214 122.6 F
Thru 42 47 207 112.1 F
Right 76 4 82 13.4 B
Left 47 112 513 104.1 F
Thru 113 112 514 105.4 F
Right 103 4 90 15.6 B
Snelling at Larpenteur
(vph) (ft) (ft) (sec/veh) (sec/veh) (sec/veh)
Left 181 90 401 75.6 E
Thru 787 45 411 17.9 B
Right 40 1 68 4.6 A
Left 48 40 367 127.6 F
Thru 1,625 155 1,279 26.7 C
Right 122 3 93 14.3 B
Left 84 39 186 76.2 E
Thru 192 52 224 66.6 E
Right 21 64 242 55.4 E
Left 221 1,120 1,701 283.5 F
Thru 710 1,329 1,702 290.3 F
Right 89 1,340 1,702 292.0 F
Snelling at Hoyt
(vph) (ft) (ft) (sec/veh) (sec/veh) (sec/veh)
Left 14 0 33 17.4 B
Thru 920 11 253 5.1 A
Right 30 0 0 3.1 A
Left 16 0 13 7.0 A
Thru 1,837 2 118 2.0 A
Right 14 0 0 2.3 A
Left 10 4 45 73.1 E
Thru 7 4 67 88.5 F
Right 8 3 93 17.4 B
Left 73 39 212 87.2 F
Thru 9 10 140 75.3 E
Right 77 11 157 16.5 B
Snelling at Midway
(vph) (ft) (ft) (sec/veh) (sec/veh) (sec/veh)
Left 44 1 62 20.9 C
Thru 940 12 275 5.5 A
Right 21 0 51 3.1 A
Left 43 0 29 8.3 A
Thru 1,823 4 131 3.9 A
Right 52 7 163 4.5 A
Left 0 - - - A
Thru 13 6 71 80.9 F
Right 3 0 37 7.5 A
Left 45 35 175 78.6 E
Thru 26 35 172 84.5 F
Right 23 1 58 6.8 A
67.5 E
Westbound 62.5 E
Northbound 6.1 A
6.9 A
Southbound 4.0 A
Eastbound
Approach
LOS
Overall
DelayOverall
LOS
Simulated
Volume
Average
Queue
Maximum
Queue
Movement
DelayMovement
LOS
Approach
DelayApproach Movement
Eastbound 59.6 E
Westbound 52.2 D
Northbound 5.3 A
6.2 A
Southbound 2.1 A
Approach
DelayApproach
LOS
Overall
DelayOverall
LOS
Simulated
Volume
Average
Queue
Maximum
Queue
Movement
DelayMovement
LOS
68.5 E
Westbound 289.0 F
Approach Movement
Northbound 27.7 C
95.7 F
Southbound 28.5 C
Eastbound
Approach
LOS
Overall
DelayOverall
LOS
Simulated
Volume
Average
Queue
Maximum
Queue
Movement
DelayMovement
LOS
Approach
DelayApproach Movement
Eastbound 61.1 E
Westbound 70.2 E
Northbound 5.5 A
13.0 B
Southbound 4.5 A
Approach
DelayApproach
LOS
Overall
DelayOverall
LOS
Simulated
Volume
Average
Queue
Maximum
Queue
Movement
DelayMovement
LOSApproach Movement
* Results shown are the average of 5 model runs.
** Results shown are from all vehicles except transit vehicles.
H:\Projects\7939\SD\VISSIM\2_RB_Prelim\11 MOEs\7939_Prelim_RB_AM Arterial MOEs.xls 4/8/2013

Year 2013 Preliminary Rapid Bus Conditions VISSIM Model
Snelling Avenue Rapid Bus VISSIM Evaluation
Arterial MOEs (A.M. Peak Hour 7:30 - 8:30)
Snelling at Hewitt
(vph) (ft) (ft) (sec/veh) (sec/veh) (sec/veh)
Left 14 0 29 14.0 B
Thru 1,073 35 430 12.8 B
Right 21 43 451 10.2 B
Left 77 2 78 13.6 B
Thru 1,370 30 490 9.4 A
Right 29 0 48 4.7 A
Left 49 14 134 30.5 C
Thru 11 14 135 34.2 C
Right 30 17 153 15.2 B
Left 58 11 110 31.9 C
Thru 5 11 108 33.6 C
Right 7 17 123 16.7 B
Snelling at Minnehaha
(vph) (ft) (ft) (sec/veh) (sec/veh) (sec/veh)
Left 18 1 51 20.8 C
Thru 997 19 408 8.7 A
Right 12 20 401 6.4 A
Left 35 0 46 13.9 B
Thru 1,298 35 620 12.6 B
Right 124 35 621 13.9 B
Left 55 23 159 36.0 D
Thru 58 23 159 31.5 C
Right 22 23 156 30.1 C
Left 35 22 183 32.5 C
Thru 69 22 184 31.0 C
Right 53 22 184 30.3 C
Snelling at Thomas
(vph) (ft) (ft) (sec/veh) (sec/veh) (sec/veh)
Left 22 1 47 12.2 B
Thru 946 26 360 10.1 B
Right 23 27 374 7.9 A
Left 33 1 42 14.6 B
Thru 1,257 33 595 12.9 B
Right 67 0 41 8.7 A
Left 31 11 136 33.0 C
Thru 22 11 137 31.3 C
Right 16 16 153 16.5 B
Left 25 15 160 32.7 C
Thru 45 15 161 27.7 C
Right 49 20 175 14.0 B
Snelling at University
(vph) (ft) (ft) (sec/veh) (sec/veh) (sec/veh)
Left 162 29 301 28.8 C
Thru 871 54 304 16.1 B
Right 126 55 308 4.6 A
Left 154 15 168 30.6 C
Thru 1,005 87 608 28.9 C
Right 144 3 92 17.9 B
Left 50 15 126 46.8 D
Thru 227 55 287 37.8 D
Right 136 57 290 30.4 C
Left 153 143 444 128.0 F
Thru 551 100 398 41.3 D
Right 74 103 400 36.3 D
36.4 D
Westbound 57.9 E
Northbound 16.6 B
31.6 C
Southbound 27.8 C
Eastbound
Approach
LOS
Overall
DelayOverall
LOS
Simulated
Volume
Average
Queue
Maximum
Queue
Movement
DelayMovement
LOS
Approach
DelayApproach Movement
Eastbound 28.6 C
Westbound 23.2 C
Northbound 10.1 B
12.7 B
Southbound 12.8 B
Approach
DelayApproach
LOS
Overall
DelayOverall
LOS
Simulated
Volume
Average
Queue
Maximum
Queue
Movement
DelayMovement
LOS
33.1 C
Westbound 31.1 C
Approach Movement
Northbound 8.9 A
13.3 B
Southbound 12.7 B
Eastbound
Approach
LOS
Overall
DelayOverall
LOS
Simulated
Volume
Average
Queue
Maximum
Queue
Movement
DelayMovement
LOS
Approach
DelayApproach Movement
Eastbound 25.9 C
Westbound 30.4 C
Northbound 12.8 B
11.9 B
Southbound 9.5 A
Approach
DelayApproach
LOS
Overall
DelayOverall
LOS
Simulated
Volume
Average
Queue
Maximum
Queue
Movement
DelayMovement
LOSApproach Movement
* Results shown are the average of 5 model runs.
** Results shown are from all vehicles except transit vehicles.
H:\Projects\7939\SD\VISSIM\2_RB_Prelim\11 MOEs\7939_Prelim_RB_AM Arterial MOEs.xls 4/8/2013

Year 2013 Preliminary Rapid Bus Conditions VISSIM Model
Snelling Avenue Rapid Bus VISSIM Evaluation
Arterial MOEs (A.M. Peak Hour 7:30 - 8:30)
Snelling at Spruce Tree
(vph) (ft) (ft) (sec/veh) (sec/veh) (sec/veh)
Left 66 1 56 10.9 B
Thru 1,106 14 234 6.1 A
Right 54 17 248 2.7 A
Left 18 0 28 13.9 B
Thru 1,228 9 233 2.9 A
Right 51 13 254 2.5 A
Left 19 6 70 47.9 D
Thru 0 6 72 73.1 E
Right 61 2 95 7.1 A
Left 46 13 115 44.5 D
Thru 22 8 112 47.4 D
Right 36 9 112 16.8 B
Snelling at St Anthony
(vph) (ft) (ft) (sec/veh) (sec/veh) (sec/veh)
Left 877 39 320 13.4 B
Thru 823 39 319 8.7 A
Thru 936 95 510 37.9 D
Right 404 52 452 10.5 B
Left 214 64 281 31.9 C
Thru 526 64 280 34.5 C
Right 392 26 221 8.5 A
Snelling at Concordia
(vph) (ft) (ft) (sec/veh) (sec/veh) (sec/veh)
Thru 1,370 46 356 19.0 B
Right 413 7 274 11.3 B
Left 494 12 322 10.2 B
Thru 641 12 323 5.2 A
Left 327 55 247 39.0 D
Thru 164 55 247 36.6 D
Right 413 0 0 3.4 A
Snelling at Marshall
(vph) (ft) (ft) (sec/veh) (sec/veh) (sec/veh)
Left 67 7 96 34.5 C
Thru 1,471 169 635 28.4 C
Right 50 1 75 12.5 B
Left 26 3 64 29.1 C
Thru 793 65 290 23.9 C
Right 228 12 216 11.8 B
Left 272 65 374 40.2 D
Thru 210 24 169 25.7 C
Right 58 28 197 14.6 B
Left 47 5 107 19.9 B
Thru 329 42 225 31.7 C
Right 47 42 233 24.6 C
31.8 C
Westbound 29.6 C
Northbound 28.1 C
26.9 C
Southbound 21.4 C
Eastbound
Approach
LOS
Overall
DelayOverall
LOS
Simulated
Volume
Average
Queue
Maximum
Queue
Movement
DelayMovement
LOS
Approach
DelayApproach Movement
Eastbound 22.3 C
Northbound 17.2 B
15.5 BSouthbound 7.4 A
Approach
DelayApproach
LOS
Overall
DelayOverall
LOS
Simulated
Volume
Average
Queue
Maximum
Queue
Movement
DelayMovement
LOS
Westbound 25.0 C
Approach Movement
Northbound 11.1 B
20.8 CSouthbound 29.6 C
Approach
LOS
Overall
DelayOverall
LOS
Simulated
Volume
Average
Queue
Maximum
Queue
Movement
DelayMovement
LOS
Approach
DelayApproach Movement
Eastbound 17.2 B
Westbound 35.5 D
Northbound 6.2 A
6.1 A
Southbound 3.0 A
Approach
DelayApproach
LOS
Overall
DelayOverall
LOS
Simulated
Volume
Average
Queue
Maximum
Queue
Movement
DelayMovement
LOSApproach Movement
* Results shown are the average of 5 model runs.
** Results shown are from all vehicles except transit vehicles.
H:\Projects\7939\SD\VISSIM\2_RB_Prelim\11 MOEs\7939_Prelim_RB_AM Arterial MOEs.xls 4/8/2013

Year 2013 Preliminary Rapid Bus Conditions VISSIM Model
Snelling Avenue Rapid Bus VISSIM Evaluation
Arterial MOEs (A.M. Peak Hour 7:30 - 8:30)
Snelling at Selby
(vph) (ft) (ft) (sec/veh) (sec/veh) (sec/veh)
Left 12 2 40 49.9 D
Thru 1,071 228 743 52.7 D
Right 21 234 745 49.4 D
Left 230 100 408 67.6 E
Thru 644 33 232 14.2 B
Right 28 35 232 10.5 B
Left 68 78 350 149.7 F
Thru 148 31 334 37.1 D
Right 13 30 327 19.2 B
Left 31 3 45 32.6 C
Thru 174 127 523 37.7 D
Right 452 130 529 29.6 C
Snelling at Summit
(vph) (ft) (ft) (sec/veh) (sec/veh) (sec/veh)
Left 41 1 46 10.7 B
Thru 915 15 161 5.1 A
Right 32 15 160 5.8 A
Left 40 13 124 28.8 C
Thru 548 49 319 21.8 C
Right 100 49 316 21.9 C
Left 49 14 195 54.9 D
Thru 178 28 262 25.1 C
Right 13 38 286 19.6 B
Left 64 8 219 39.2 D
Thru 357 138 599 41.3 D
Right 146 152 618 35.1 D
Snelling at Grand
(vph) (ft) (ft) (sec/veh) (sec/veh) (sec/veh)
Left 44 2 51 12.5 B
Thru 763 34 244 14.4 B
Right 55 36 254 13.2 B
Left 99 14 126 29.3 C
Thru 422 30 184 17.1 B
Right 102 34 199 11.8 B
Left 46 6 83 26.7 C
Thru 184 34 282 27.6 C
Right 23 36 299 21.0 C
Left 82 12 286 39.2 D
Thru 299 154 607 46.5 D
Right 176 157 623 40.2 D
Snelling at St Clair
(vph) (ft) (ft) (sec/veh) (sec/veh) (sec/veh)
Left 40 1 37 12.2 B
Thru 646 12 126 6.4 A
Right 44 0 52 3.7 A
Left 46 2 78 13.5 B
Thru 450 12 159 7.4 A
Right 30 17 172 7.4 A
Left 47 34 281 33.7 C
Thru 217 34 278 25.3 C
Right 39 43 297 13.0 B
Left 68 62 431 37.5 D
Thru 256 62 435 29.9 C
Right 179 73 455 20.1 C
25.0 C
Westbound 27.5 C
Northbound 6.6 A
14.7 B
Southbound 7.9 A
Eastbound
Approach
LOS
Overall
DelayOverall
LOS
Simulated
Volume
Average
Queue
Maximum
Queue
Movement
DelayMovement
LOS
Approach
DelayApproach Movement
Eastbound 26.8 C
Westbound 43.4 D
Northbound 14.2 B
23.8 C
Southbound 18.2 B
Approach
DelayApproach
LOS
Overall
DelayOverall
LOS
Simulated
Volume
Average
Queue
Maximum
Queue
Movement
DelayMovement
LOS
30.9 C
Westbound 39.5 D
Approach Movement
Northbound 5.4 A
20.3 C
Southbound 22.3 C
Eastbound
Approach
LOS
Overall
DelayOverall
LOS
Simulated
Volume
Average
Queue
Maximum
Queue
Movement
DelayMovement
LOS
Approach
DelayApproach Movement
Eastbound 69.5 E
Westbound 31.9 C
Northbound 52.6 D
41.5 D
Southbound 27.7 C
Approach
DelayApproach
LOS
Overall
DelayOverall
LOS
Simulated
Volume
Average
Queue
Maximum
Queue
Movement
DelayMovement
LOSApproach Movement
* Results shown are the average of 5 model runs.
** Results shown are from all vehicles except transit vehicles.
H:\Projects\7939\SD\VISSIM\2_RB_Prelim\11 MOEs\7939_Prelim_RB_AM Arterial MOEs.xls 4/8/2013
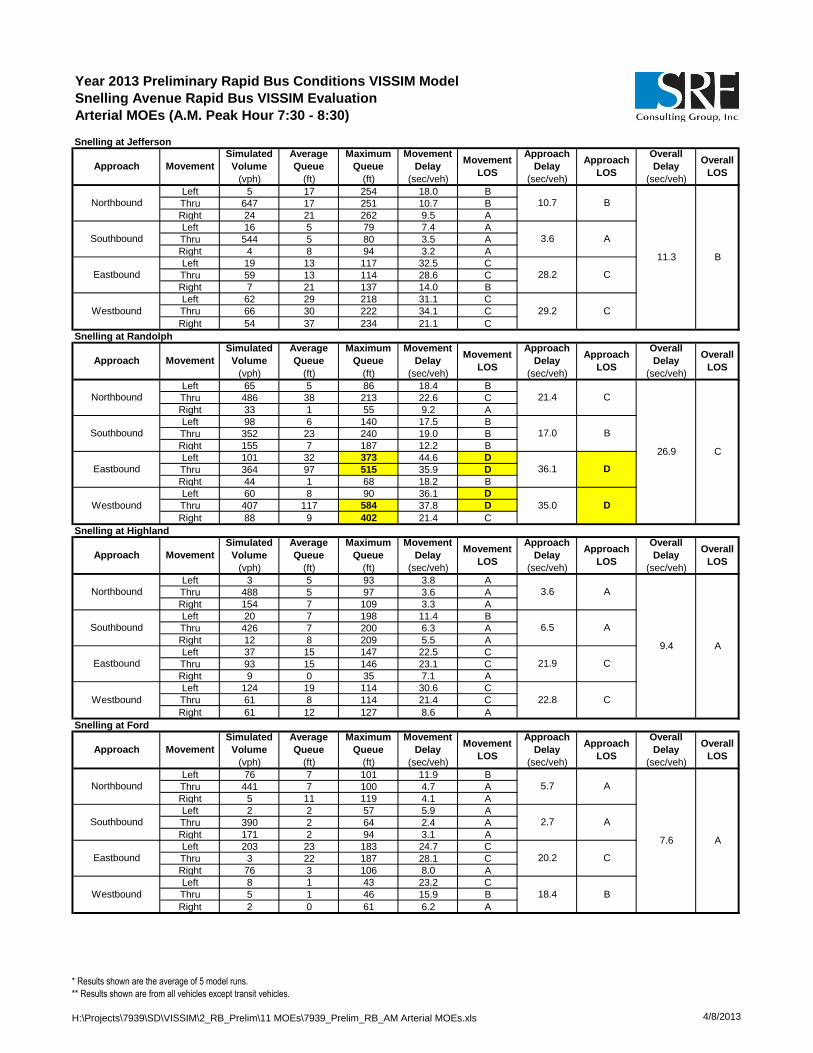
Year 2013 Preliminary Rapid Bus Conditions VISSIM Model
Snelling Avenue Rapid Bus VISSIM Evaluation
Arterial MOEs (A.M. Peak Hour 7:30 - 8:30)
Snelling at Jefferson
(vph) (ft) (ft) (sec/veh) (sec/veh) (sec/veh)
Left 5 17 254 18.0 B
Thru 647 17 251 10.7 B
Right 24 21 262 9.5 A
Left 16 5 79 7.4 A
Thru 544 5 80 3.5 A
Right 4 8 94 3.2 A
Left 19 13 117 32.5 C
Thru 59 13 114 28.6 C
Right 7 21 137 14.0 B
Left 62 29 218 31.1 C
Thru 66 30 222 34.1 C
Right 54 37 234 21.1 C
Snelling at Randolph
(vph) (ft) (ft) (sec/veh) (sec/veh) (sec/veh)
Left 65 5 86 18.4 B
Thru 486 38 213 22.6 C
Right 33 1 55 9.2 A
Left 98 6 140 17.5 B
Thru 352 23 240 19.0 B
Right 155 7 187 12.2 B
Left 101 32 373 44.6 D
Thru 364 97 515 35.9 D
Right 44 1 68 18.2 B
Left 60 8 90 36.1 D
Thru 407 117 584 37.8 D
Right 88 9 402 21.4 C
Snelling at Highland
(vph) (ft) (ft) (sec/veh) (sec/veh) (sec/veh)
Left 3 5 93 3.8 A
Thru 488 5 97 3.6 A
Right 154 7 109 3.3 A
Left 20 7 198 11.4 B
Thru 426 7 200 6.3 A
Right 12 8 209 5.5 A
Left 37 15 147 22.5 C
Thru 93 15 146 23.1 C
Right 9 0 35 7.1 A
Left 124 19 114 30.6 C
Thru 61 8 114 21.4 C
Right 61 12 127 8.6 A
Snelling at Ford
(vph) (ft) (ft) (sec/veh) (sec/veh) (sec/veh)
Left 76 7 101 11.9 B
Thru 441 7 100 4.7 A
Right 5 11 119 4.1 A
Left 2 2 57 5.9 A
Thru 390 2 64 2.4 A
Right 171 2 94 3.1 A
Left 203 23 183 24.7 C
Thru 3 22 187 28.1 C
Right 76 3 106 8.0 A
Left 8 1 43 23.2 C
Thru 5 1 46 15.9 B
Right 2 0 61 6.2 A
20.2 C
Westbound 18.4 B
Northbound 5.7 A
7.6 A
Southbound 2.7 A
Eastbound
Approach
LOS
Overall
DelayOverall
LOS
Simulated
Volume
Average
Queue
Maximum
Queue
Movement
DelayMovement
LOS
Approach
DelayApproach Movement
Eastbound 21.9 C
Westbound 22.8 C
Northbound 3.6 A
9.4 A
Southbound 6.5 A
Approach
DelayApproach
LOS
Overall
DelayOverall
LOS
Simulated
Volume
Average
Queue
Maximum
Queue
Movement
DelayMovement
LOS
36.1 D
Westbound 35.0 D
Approach Movement
Northbound 21.4 C
26.9 C
Southbound 17.0 B
Eastbound
Approach
LOS
Overall
DelayOverall
LOS
Simulated
Volume
Average
Queue
Maximum
Queue
Movement
DelayMovement
LOS
Approach
DelayApproach Movement
Eastbound 28.2 C
Westbound 29.2 C
Northbound 10.7 B
11.3 B
Southbound 3.6 A
Approach
DelayApproach
LOS
Overall
DelayOverall
LOS
Simulated
Volume
Average
Queue
Maximum
Queue
Movement
DelayMovement
LOSApproach Movement
* Results shown are the average of 5 model runs.
** Results shown are from all vehicles except transit vehicles.
H:\Projects\7939\SD\VISSIM\2_RB_Prelim\11 MOEs\7939_Prelim_RB_AM Arterial MOEs.xls 4/8/2013

Year 2013 Preliminary Rapid Bus Conditions VISSIM Model
Snelling Avenue Rapid Bus VISSIM Evaluation
Arterial MOEs (A.M. Peak Hour 7:30 - 8:30)
Ford at Fairview
(vph) (ft) (ft) (sec/veh) (sec/veh) (sec/veh)
Left 40 2 64 20.3 C
Thru 436 19 249 10.4 B
Right 45 19 262 9.1 A
Left 22 1 48 20.3 C
Thru 429 20 268 10.8 B
Right 66 24 282 9.3 A
Left 89 10 115 26.1 C
Thru 216 14 164 14.2 B
Right 27 1 68 7.8 A
Left 28 2 74 16.6 B
Thru 216 14 178 13.9 B
Right 7 0 56 6.3 A
Ford at Kenneth
(vph) (ft) (ft) (sec/veh) (sec/veh) (sec/veh)
Left 38 17 160 36.0 D
Thru 27 16 157 31.5 C
Right 32 13 155 15.1 B
Left 11 11 120 33.4 C
Thru 44 11 120 30.2 C
Right 38 7 114 10.9 B
Left 30 0 33 4.2 A
Thru 291 3 101 1.9 A
Right 20 3 110 2.1 A
Left 15 0 28 5.3 A
Thru 300 4 99 4.6 A
Right 8 4 102 3.1 A
Ford at Cleveland
(vph) (ft) (ft) (sec/veh) (sec/veh) (sec/veh)
Left 296 24 266 17.2 B
Thru 389 42 345 17.0 B
Right 56 39 347 19.1 B
Left 28 2 61 15.5 B
Thru 274 29 295 19.5 B
Right 86 27 292 22.0 C
Left 91 9 96 19.8 B
Thru 258 19 137 12.3 B
Right 123 17 136 14.3 B
Left 50 7 89 28.8 C
Thru 288 18 139 15.3 B
Right 37 15 135 13.1 B
Ford at Finn
(vph) (ft) (ft) (sec/veh) (sec/veh) (sec/veh)
Left 48 10 100 34.1 C
Thru 1 6 90 41.0 D
Right 42 6 103 5.1 A
Left 31 7 100 33.2 C
Thru 1 7 92 17.0 B
Right 29 4 95 11.2 B
Left 20 0 36 8.3 A
Thru 400 6 123 4.8 A
Right 20 4 131 3.1 A
Left 125 1 61 5.0 A
Thru 487 2 80 2.5 A
Right 59 2 83 2.2 A
4.8 A
Westbound 2.9 A
Northbound 20.7 C
5.8 A
Southbound 22.5 C
Eastbound
Approach
LOS
Overall
DelayOverall
LOS
Simulated
Volume
Average
Queue
Maximum
Queue
Movement
DelayMovement
LOS
Approach
DelayApproach Movement
Eastbound 14.3 B
Westbound 16.9 B
Northbound 17.2 B
17.0 B
Southbound 19.8 B
Approach
DelayApproach
LOS
Overall
DelayOverall
LOS
Simulated
Volume
Average
Queue
Maximum
Queue
Movement
DelayMovement
LOS
2.1 A
Westbound 4.6 A
Approach Movement
Northbound 27.9 C
8.2 A
Southbound 22.6 C
Eastbound
Approach
LOS
Overall
DelayOverall
LOS
Simulated
Volume
Average
Queue
Maximum
Queue
Movement
DelayMovement
LOS
Approach
DelayApproach Movement
Eastbound 16.9 B
Westbound 14.0 B
Northbound 11.1 B
12.7 B
Southbound 11.0 B
Approach
DelayApproach
LOS
Overall
DelayOverall
LOS
Simulated
Volume
Average
Queue
Maximum
Queue
Movement
DelayMovement
LOSApproach Movement
* Results shown are the average of 5 model runs.
** Results shown are from all vehicles except transit vehicles.
H:\Projects\7939\SD\VISSIM\2_RB_Prelim\11 MOEs\7939_Prelim_RB_AM Arterial MOEs.xls 4/8/2013

Year 2013 Preliminary Rapid Bus Conditions VISSIM Model
Snelling Avenue Rapid Bus VISSIM Evaluation
Arterial MOEs (A.M. Peak Hour 7:30 - 8:30)
Ford at Cretin
(vph) (ft) (ft) (sec/veh) (sec/veh) (sec/veh)
Left 117 23 148 32.4 C
Right 65 1 78 4.0 A
Left 112 2 83 7.8 A
Thru 321 3 109 3.8 A
Thru 380 7 136 4.6 A
Right 182 6 152 5.6 A
46th at 46th
(vph) (ft) (ft) (sec/veh) (sec/veh) (sec/veh)
Left 28 18 170 55.1 E
Thru 33 18 162 49.2 D
Right 217 0 7 2.4 A
Left 50 11 135 39.3 D
Thru 16 15 157 52.8 D
Right 42 17 150 51.0 D
Left 25 2 79 16.4 B
Thru 169 18 162 22.5 C
Right 34 23 184 17.2 B
Left 142 5 125 9.6 A
Thru 219 6 118 8.1 A
Right 82 3 109 8.1 A
46th at 42nd
(vph) (ft) (ft) (sec/veh) (sec/veh) (sec/veh)
Left 5 1 41 24.8 C
Thru 5 1 48 21.5 C
Right 4 1 48 3.8 A
Left 28 6 88 21.4 C
Thru 4 5 87 26.2 C
Right 84 5 90 7.3 A
Left 49 7 104 26.4 C
Thru 191 18 149 23.2 C
Right 14 22 163 17.6 B
Left 4 0 39 20.9 C
Thru 270 18 162 16.7 B
Right 13 21 171 10.2 B
46th at Minnehaha
(vph) (ft) (ft) (sec/veh) (sec/veh) (sec/veh)
Left 22 31 252 26.3 C
Thru 274 32 260 22.5 C
Right 13 29 260 13.9 B
Left 38 23 258 29.8 C
Thru 166 23 255 20.9 C
Right 109 19 245 10.1 B
Left 127 15 166 23.6 C
Thru 206 16 186 15.5 B
Right 25 20 198 14.0 B
Left 74 15 123 36.5 D
Thru 179 34 197 32.4 C
Right 114 35 201 21.7 C
18.3 B
Westbound 29.9 C
Northbound 22.4 C
22.4 C
Southbound 18.2 B
Eastbound
Approach
LOS
Overall
DelayOverall
LOS
Simulated
Volume
Average
Queue
Maximum
Queue
Movement
DelayMovement
LOS
Approach
DelayApproach Movement
Eastbound 23.5 C
Westbound 16.4 B
Northbound 17.5 B
18.2 B
Southbound 11.3 B
Approach
DelayApproach
LOS
Overall
DelayOverall
LOS
Simulated
Volume
Average
Queue
Maximum
Queue
Movement
DelayMovement
LOS
21.0 C
Westbound 8.6 A
Approach Movement
Northbound 13.2 B
16.3 B
Southbound 45.9 D
Eastbound
Approach
LOS
Overall
DelayOverall
LOS
Simulated
Volume
Average
Queue
Maximum
Queue
Movement
DelayMovement
LOS
Approach
DelayApproach Movement
Eastbound 4.8 A
Westbound 4.9 A
7.6 A
Southbound 22.3 C
Approach
DelayApproach
LOS
Overall
DelayOverall
LOS
Simulated
Volume
Average
Queue
Maximum
Queue
Movement
DelayMovement
LOSApproach Movement
* Results shown are the average of 5 model runs.
** Results shown are from all vehicles except transit vehicles.
H:\Projects\7939\SD\VISSIM\2_RB_Prelim\11 MOEs\7939_Prelim_RB_AM Arterial MOEs.xls 4/8/2013
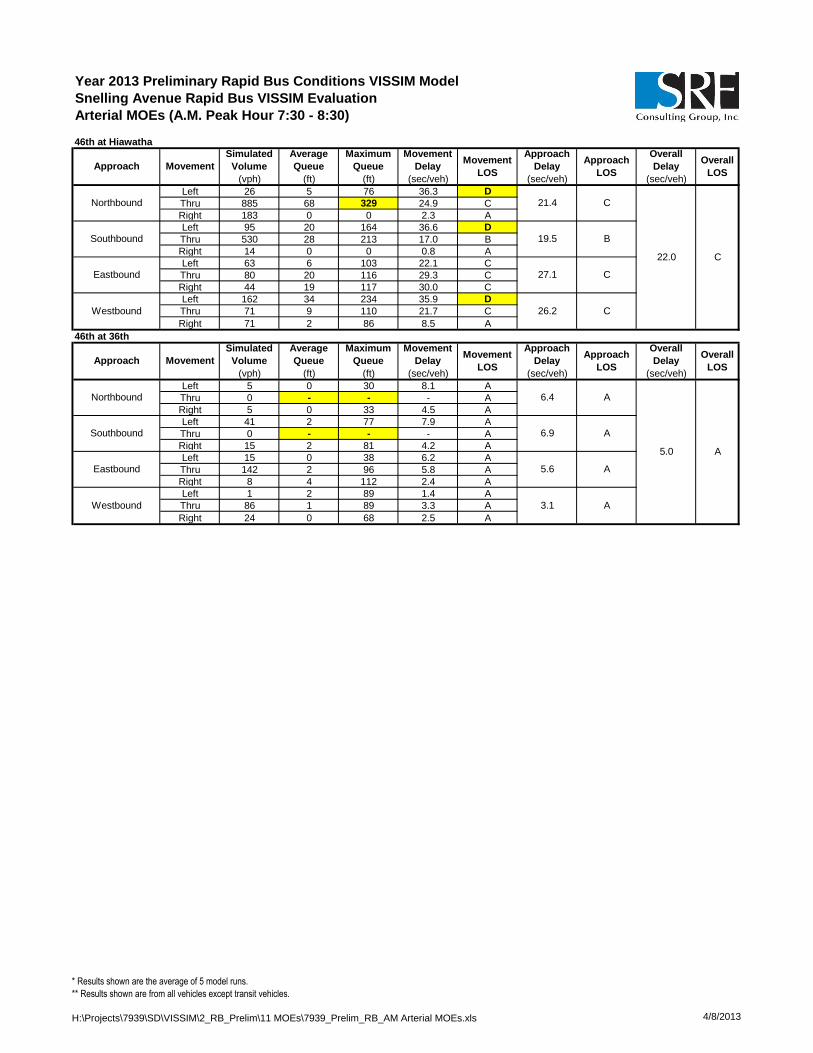
Year 2013 Preliminary Rapid Bus Conditions VISSIM Model
Snelling Avenue Rapid Bus VISSIM Evaluation
Arterial MOEs (A.M. Peak Hour 7:30 - 8:30)
46th at Hiawatha
(vph) (ft) (ft) (sec/veh) (sec/veh) (sec/veh)
Left 26 5 76 36.3 D
Thru 885 68 329 24.9 C
Right 183 0 0 2.3 A
Left 95 20 164 36.6 D
Thru 530 28 213 17.0 B
Right 14 0 0 0.8 A
Left 63 6 103 22.1 C
Thru 80 20 116 29.3 C
Right 44 19 117 30.0 C
Left 162 34 234 35.9 D
Thru 71 9 110 21.7 C
Right 71 2 86 8.5 A
46th at 36th
(vph) (ft) (ft) (sec/veh) (sec/veh) (sec/veh)
Left 5 0 30 8.1 A
Thru 0 - - - A
Right 5 0 33 4.5 A
Left 41 2 77 7.9 A
Thru 0 - - - A
Right 15 2 81 4.2 A
Left 15 0 38 6.2 A
Thru 142 2 96 5.8 A
Right 8 4 112 2.4 A
Left 1 2 89 1.4 A
Thru 86 1 89 3.3 A
Right 24 0 68 2.5 A
5.6 A
Westbound 3.1 A
Northbound 6.4 A
5.0 A
Southbound 6.9 A
Eastbound
Approach
LOS
Overall
DelayOverall
LOSApproach
Simulated
Volume
Average
Queue
Maximum
Queue
Movement
DelayMovement
LOS
Approach
DelayMovement
Eastbound 27.1
26.2Westbound C
Northbound 21.4 C
22.0 C
Southbound 19.5 B
Approach
DelayApproach
LOS
Overall
DelayOverall
LOS
C
Simulated
Volume
Average
Queue
Maximum
Queue
Movement
DelayMovement
LOSApproach Movement
* Results shown are the average of 5 model runs.
** Results shown are from all vehicles except transit vehicles.
H:\Projects\7939\SD\VISSIM\2_RB_Prelim\11 MOEs\7939_Prelim_RB_AM Arterial MOEs.xls 4/8/2013

Year 2013 Preliminary Rapid Bus Conditions VISSIM Model
Snelling Avenue Rapid Bus VISSIM Evaluation
Arterial MOEs (P.M. Peak Hour 4:45 - 5:45)
Co B2 at Snelling W Ramps
(vph) (ft) (ft) (sec/veh) (sec/veh) (sec/veh)
Left 75 36 217 33.0 C
Thru 152 36 218 35.3 D
Right 142 0 0 4.0 A
Left 6 27 202 43.2 D
Thru 106 27 211 45.0 D
Right 148 1 79 4.5 A
Left 403 114 585 45.5 D
Thru 746 57 333 24.5 C
Right 77 0 0 9.7 A
Left 351 107 460 47.1 D
Thru 440 35 192 23.6 C
Right 24 0 0 6.2 A
Co B2 at Snelling E Ramps
(vph) (ft) (ft) (sec/veh) (sec/veh) (sec/veh)
Left 21 47 587 42.6 D
Right 497 29 524 25.8 C
Left 247 5 180 8.8 A
Thru 647 6 202 4.6 A
Thru 318 7 123 6.6 A
Right 38 0 0 3.0 A
Snelling at Co B
(vph) (ft) (ft) (sec/veh) (sec/veh) (sec/veh)
Left 154 69 319 71.6 E
Thru 1,558 36 291 9.3 A
Right 212 0 0 3.3 A
Left 426 213 667 96.8 F
Thru 1,244 213 668 31.5 C
Right 294 93 632 15.9 B
Left 178 1,022 1,577 331.7 F
Thru 502 1,060 1,580 310.4 F
Right 152 901 1,591 254.0 F
Left 167 81 364 78.3 E
Thru 260 71 368 70.7 E
Right 300 36 324 20.8 C
Snelling at HarMar
(vph) (ft) (ft) (sec/veh) (sec/veh) (sec/veh)
Left 51 22 155 72.6 E
Thru 1,609 17 133 5.0 A
Right 267 0 0 3.2 A
Left 125 47 293 61.4 E
Thru 1,337 27 304 6.9 A
Right 98 1 65 3.2 A
Left 116 56 191 79.6 E
Thru 49 57 192 82.6 F
Right 80 60 195 12.0 B
Left 100 56 221 80.1 F
Thru 57 55 219 77.6 E
Right 198 47 244 11.7 B
58.1 E
Westbound 41.6 D
Northbound 6.5 A
14.4 B
Southbound 11.0 B
Eastbound
Approach
LOS
Overall
DelayOverall
LOS
Simulated
Volume
Average
Queue
Maximum
Queue
Movement
DelayMovement
LOS
Approach
DelayApproach Movement
Eastbound 304.6 F
Westbound 51.9 D
Northbound 13.6 B
73.9 E
Southbound 43.4 D
Approach
DelayApproach
LOS
Overall
DelayOverall
LOS
Simulated
Volume
Average
Queue
Maximum
Queue
Movement
DelayMovement
LOS
5.8 A
Westbound 6.2 A
Approach Movement
11.9 B
Southbound 26.5 C
Eastbound
Approach
LOS
Overall
DelayOverall
LOS
Simulated
Volume
Average
Queue
Maximum
Queue
Movement
DelayMovement
LOS
Approach
Delay
Movement
Approach Movement
Simulated
Volume
Average
Queue
Maximum
Queue
Movement
DelayMovement
LOS
Approach
Delay
C
Southbound 21.9 C
Eastbound
Approach
LOS
Overall
DelayOverall
LOSApproach
30.5 C
Westbound 33.2 C
Northbound 22.8 C
29.4
* Results shown are the average of 20 model runs.
** Results shown are from all vehicles except transit vehicles.
H:\Projects\7939\SD\VISSIM\2_RB_Prelim\11 MOEs\7939_Prelim_RB_PM Arterial MOEs.xls 4/8/2013
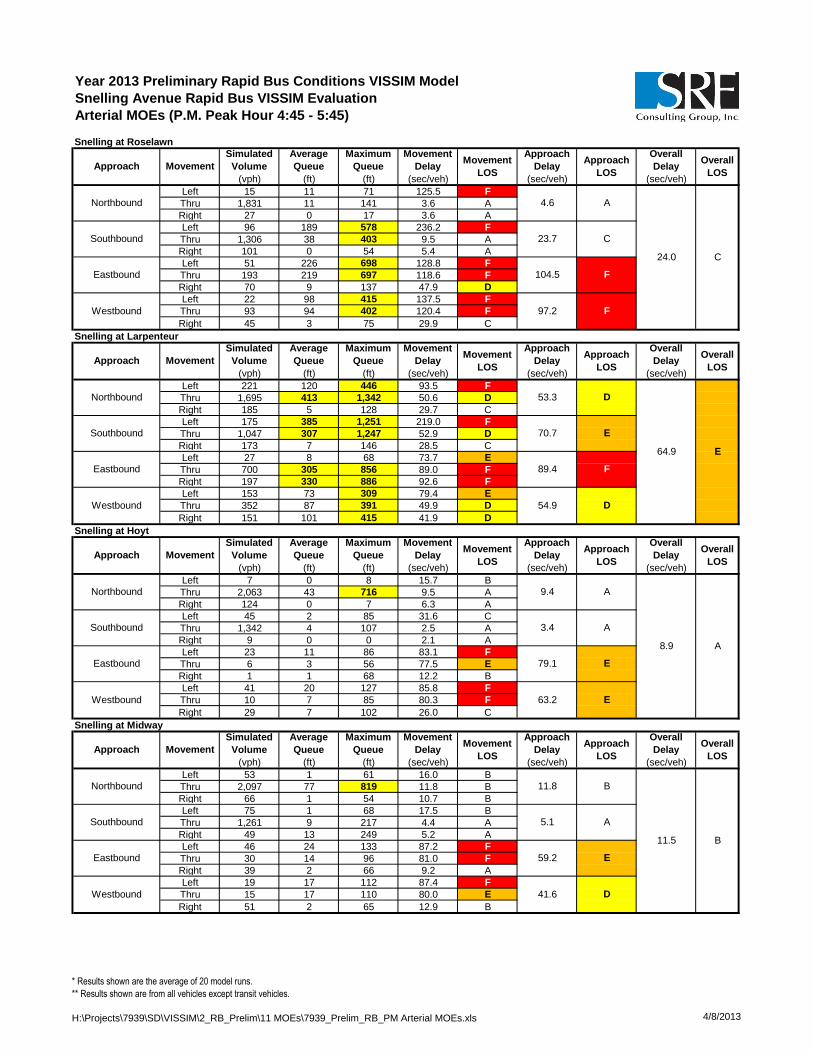
Year 2013 Preliminary Rapid Bus Conditions VISSIM Model
Snelling Avenue Rapid Bus VISSIM Evaluation
Arterial MOEs (P.M. Peak Hour 4:45 - 5:45)
Snelling at Roselawn
(vph) (ft) (ft) (sec/veh) (sec/veh) (sec/veh)
Left 15 11 71 125.5 F
Thru 1,831 11 141 3.6 A
Right 27 0 17 3.6 A
Left 96 189 578 236.2 F
Thru 1,306 38 403 9.5 A
Right 101 0 54 5.4 A
Left 51 226 698 128.8 F
Thru 193 219 697 118.6 F
Right 70 9 137 47.9 D
Left 22 98 415 137.5 F
Thru 93 94 402 120.4 F
Right 45 3 75 29.9 C
Snelling at Larpenteur
(vph) (ft) (ft) (sec/veh) (sec/veh) (sec/veh)
Left 221 120 446 93.5 F
Thru 1,695 413 1,342 50.6 D
Right 185 5 128 29.7 C
Left 175 385 1,251 219.0 F
Thru 1,047 307 1,247 52.9 D
Right 173 7 146 28.5 C
Left 27 8 68 73.7 E
Thru 700 305 856 89.0 F
Right 197 330 886 92.6 F
Left 153 73 309 79.4 E
Thru 352 87 391 49.9 D
Right 151 101 415 41.9 D
Snelling at Hoyt
(vph) (ft) (ft) (sec/veh) (sec/veh) (sec/veh)
Left 7 0 8 15.7 B
Thru 2,063 43 716 9.5 A
Right 124 0 7 6.3 A
Left 45 2 85 31.6 C
Thru 1,342 4 107 2.5 A
Right 9 0 0 2.1 A
Left 23 11 86 83.1 F
Thru 6 3 56 77.5 E
Right 1 1 68 12.2 B
Left 41 20 127 85.8 F
Thru 10 7 85 80.3 F
Right 29 7 102 26.0 C
Snelling at Midway
(vph) (ft) (ft) (sec/veh) (sec/veh) (sec/veh)
Left 53 1 61 16.0 B
Thru 2,097 77 819 11.8 B
Right 66 1 54 10.7 B
Left 75 1 68 17.5 B
Thru 1,261 9 217 4.4 A
Right 49 13 249 5.2 A
Left 46 24 133 87.2 F
Thru 30 14 96 81.0 F
Right 39 2 66 9.2 A
Left 19 17 112 87.4 F
Thru 15 17 110 80.0 E
Right 51 2 65 12.9 B
59.2 E
Westbound 41.6 D
Northbound 11.8 B
11.5 B
Southbound 5.1 A
Eastbound
Approach
LOS
Overall
DelayOverall
LOS
Simulated
Volume
Average
Queue
Maximum
Queue
Movement
DelayMovement
LOS
Approach
DelayApproach Movement
Eastbound 79.1 E
Westbound 63.2 E
Northbound 9.4 A
8.9 A
Southbound 3.4 A
Approach
DelayApproach
LOS
Overall
DelayOverall
LOS
Simulated
Volume
Average
Queue
Maximum
Queue
Movement
DelayMovement
LOS
89.4 F
Westbound 54.9 D
Approach Movement
Northbound 53.3 D
64.9 E
Southbound 70.7 E
Eastbound
Approach
LOS
Overall
DelayOverall
LOS
Simulated
Volume
Average
Queue
Maximum
Queue
Movement
DelayMovement
LOS
Approach
DelayApproach Movement
Eastbound 104.5 F
Westbound 97.2 F
Northbound 4.6 A
24.0 C
Southbound 23.7 C
Approach
DelayApproach
LOS
Overall
DelayOverall
LOS
Simulated
Volume
Average
Queue
Maximum
Queue
Movement
DelayMovement
LOSApproach Movement
* Results shown are the average of 20 model runs.
** Results shown are from all vehicles except transit vehicles.
H:\Projects\7939\SD\VISSIM\2_RB_Prelim\11 MOEs\7939_Prelim_RB_PM Arterial MOEs.xls 4/8/2013

Year 2013 Preliminary Rapid Bus Conditions VISSIM Model
Snelling Avenue Rapid Bus VISSIM Evaluation
Arterial MOEs (P.M. Peak Hour 4:45 - 5:45)
Snelling at Hewitt
(vph) (ft) (ft) (sec/veh) (sec/veh) (sec/veh)
Left 24 1 43 19.6 B
Thru 1,572 80 744 16.3 B
Right 19 89 770 16.2 B
Left 72 4 92 23.9 C
Thru 1,350 61 571 15.1 B
Right 102 1 73 8.1 A
Left 91 29 202 38.0 D
Thru 11 29 206 36.6 D
Right 74 38 220 23.6 C
Left 30 14 143 34.4 C
Thru 20 14 144 32.9 C
Right 80 20 159 18.5 B
Snelling at Minnehaha
(vph) (ft) (ft) (sec/veh) (sec/veh) (sec/veh)
Left 39 2 66 27.0 C
Thru 1,400 103 858 20.8 C
Right 50 104 860 23.5 C
Left 103 8 122 30.5 C
Thru 1,245 80 684 20.4 C
Right 106 80 685 22.2 C
Left 134 56 349 43.1 D
Thru 175 56 345 33.3 C
Right 75 56 345 31.9 C
Left 49 31 220 36.7 D
Thru 131 30 220 27.8 C
Right 79 30 220 26.3 C
Snelling at Thomas
(vph) (ft) (ft) (sec/veh) (sec/veh) (sec/veh)
Left 45 3 73 24.9 C
Thru 1,352 119 883 23.3 C
Right 71 121 887 23.2 C
Left 61 4 92 33.0 C
Thru 1,273 126 739 29.2 C
Right 32 0 53 17.4 B
Left 110 51 326 35.1 D
Thru 85 51 325 34.7 C
Right 79 62 345 29.5 C
Left 40 21 196 33.6 C
Thru 55 21 198 29.5 C
Right 44 28 211 19.9 B
Snelling at University
(vph) (ft) (ft) (sec/veh) (sec/veh) (sec/veh)
Left 110 78 334 65.0 E
Thru 1,063 143 342 30.0 C
Right 178 145 346 13.6 B
Left 196 72 663 89.4 F
Thru 1,114 401 1,270 77.6 E
Right 60 1 66 52.7 D
Left 187 65 388 69.0 E
Thru 810 499 1,280 128.2 F
Right 172 505 1,290 149.8 F
Left 166 109 462 96.7 F
Thru 517 225 752 77.0 E
Right 213 229 757 84.3 F
121.9 F
Westbound 82.4 F
Northbound 30.7 C
76.2 E
Southbound 78.2 E
Eastbound
Approach
LOS
Overall
DelayOverall
LOS
Simulated
Volume
Average
Queue
Maximum
Queue
Movement
DelayMovement
LOS
Approach
DelayApproach Movement
Eastbound 33.4 C
Westbound 27.6 C
Northbound 23.3 C
26.8 C
Southbound 29.1 C
Approach
DelayApproach
LOS
Overall
DelayOverall
LOS
Simulated
Volume
Average
Queue
Maximum
Queue
Movement
DelayMovement
LOS
36.5 D
Westbound 29.0 C
Approach Movement
Northbound 21.0 C
23.4 C
Southbound 21.3 C
Eastbound
Approach
LOS
Overall
DelayOverall
LOS
Simulated
Volume
Average
Queue
Maximum
Queue
Movement
DelayMovement
LOS
Approach
DelayApproach Movement
Eastbound 31.9 C
Westbound 24.4 C
Northbound 16.4 B
16.9 B
Southbound 15.0 B
Approach
DelayApproach
LOS
Overall
DelayOverall
LOS
Simulated
Volume
Average
Queue
Maximum
Queue
Movement
DelayMovement
LOSApproach Movement
* Results shown are the average of 20 model runs.
** Results shown are from all vehicles except transit vehicles.
H:\Projects\7939\SD\VISSIM\2_RB_Prelim\11 MOEs\7939_Prelim_RB_PM Arterial MOEs.xls 4/8/2013

Year 2013 Preliminary Rapid Bus Conditions VISSIM Model
Snelling Avenue Rapid Bus VISSIM Evaluation
Arterial MOEs (P.M. Peak Hour 4:45 - 5:45)
Snelling at Spruce Tree
(vph) (ft) (ft) (sec/veh) (sec/veh) (sec/veh)
Left 61 4 82 41.7 D
Thru 1,221 210 857 51.1 D
Right 145 225 876 27.8 C
Left 70 8 136 32.3 C
Thru 1,363 52 353 13.5 B
Right 14 62 373 14.2 B
Left 35 25 155 66.5 E
Thru 64 25 156 41.9 D
Right 177 9 132 10.8 B
Left 141 40 249 54.6 D
Thru 54 82 433 83.5 F
Right 97 86 436 86.8 F
Snelling at St Anthony
(vph) (ft) (ft) (sec/veh) (sec/veh) (sec/veh)
Left 362 39 321 19.8 B
Thru 981 39 321 12.8 B
Thru 1,337 346 996 75.8 E
Right 359 297 941 8.1 A
Left 363 185 924 73.2 E
Thru 432 182 917 67.0 E
Right 444 138 861 21.3 C
Snelling at Concordia
(vph) (ft) (ft) (sec/veh) (sec/veh) (sec/veh)
Thru 1,034 145 694 54.3 D
Right 237 78 604 31.1 C
Left 500 52 340 8.9 A
Thru 1,209 52 339 20.8 C
Left 330 91 650 67.5 E
Thru 323 91 665 87.6 F
Right 593 421 1,282 83.1 F
Snelling at Marshall
(vph) (ft) (ft) (sec/veh) (sec/veh) (sec/veh)
Left 49 6 91 53.6 D
Thru 1,018 190 635 47.0 D
Right 81 2 102 28.3 C
Left 47 3 69 62.8 E
Thru 1,530 650 1,062 63.7 E
Right 222 97 573 50.6 D
Left 215 73 380 51.6 D
Thru 350 61 303 39.7 D
Right 85 73 327 34.9 C
Left 73 13 119 31.9 C
Thru 245 42 193 41.2 D
Right 43 43 201 32.6 C
43.0 D
Westbound 38.3 D
Northbound 46.0 D
52.1 D
Southbound 62.1 E
Eastbound
Approach
LOS
Overall
DelayOverall
LOS
Simulated
Volume
Average
Queue
Maximum
Queue
Movement
DelayMovement
LOS
Approach
DelayApproach Movement
Eastbound 80.1 F
Northbound 50.0 D
45.7 DSouthbound 17.3 B
Approach
DelayApproach
LOS
Overall
DelayOverall
LOS
Simulated
Volume
Average
Queue
Maximum
Queue
Movement
DelayMovement
LOS
Westbound 52.4 D
Approach Movement
Northbound 14.7 B
44.2 DSouthbound 61.5 E
Approach
LOS
Overall
DelayOverall
LOS
Simulated
Volume
Average
Queue
Maximum
Queue
Movement
DelayMovement
LOS
Approach
DelayApproach Movement
Eastbound 25.1 C
Westbound 70.6 E
Northbound 48.4 D
34.1 C
Southbound 14.4 B
Approach
DelayApproach
LOS
Overall
DelayOverall
LOS
Simulated
Volume
Average
Queue
Maximum
Queue
Movement
DelayMovement
LOSApproach Movement
* Results shown are the average of 20 model runs.
** Results shown are from all vehicles except transit vehicles.
H:\Projects\7939\SD\VISSIM\2_RB_Prelim\11 MOEs\7939_Prelim_RB_PM Arterial MOEs.xls 4/8/2013

Year 2013 Preliminary Rapid Bus Conditions VISSIM Model
Snelling Avenue Rapid Bus VISSIM Evaluation
Arterial MOEs (P.M. Peak Hour 4:45 - 5:45)
Snelling at Selby
(vph) (ft) (ft) (sec/veh) (sec/veh) (sec/veh)
Left 25 15 126 120.5 F
Thru 870 249 796 66.8 E
Right 54 262 819 67.9 E
Left 387 232 692 81.7 F
Thru 1,106 35 633 11.7 B
Right 184 37 635 9.0 A
Left 53 12 148 53.5 D
Thru 285 64 409 32.0 C
Right 38 67 417 25.5 C
Left 43 8 89 44.7 D
Thru 204 78 471 34.7 C
Right 210 82 479 27.2 C
Snelling at Summit
(vph) (ft) (ft) (sec/veh) (sec/veh) (sec/veh)
Left 33 3 55 32.5 C
Thru 721 54 287 19.7 B
Right 70 54 287 23.0 C
Left 92 22 180 35.1 D
Thru 974 100 662 27.2 C
Right 127 100 662 27.3 C
Left 75 36 407 65.0 E
Thru 419 75 496 28.4 C
Right 18 86 515 26.0 C
Left 60 8 211 42.6 D
Thru 424 125 598 32.9 C
Right 166 137 616 29.1 C
Snelling at Grand
(vph) (ft) (ft) (sec/veh) (sec/veh) (sec/veh)
Left 71 7 133 28.4 C
Thru 596 80 439 31.8 C
Right 138 83 448 29.7 C
Left 186 24 230 27.0 C
Thru 737 33 474 12.4 B
Right 129 34 491 11.1 B
Left 76 13 225 40.6 D
Thru 423 118 597 35.3 D
Right 64 126 614 30.8 C
Left 95 19 336 45.4 D
Thru 346 129 593 39.4 D
Right 149 139 610 33.8 C
Snelling at St Clair
(vph) (ft) (ft) (sec/veh) (sec/veh) (sec/veh)
Left 56 12 112 44.0 D
Thru 565 14 104 8.5 A
Right 87 1 54 4.8 A
Left 103 15 183 31.2 C
Thru 664 40 264 16.3 B
Right 117 48 278 15.7 B
Left 75 47 371 34.7 C
Thru 310 46 372 23.8 C
Right 42 55 394 15.4 B
Left 77 57 456 34.0 C
Thru 316 56 450 25.1 C
Right 151 66 469 17.4 B
24.9 C
Westbound 24.2 C
Northbound 10.8 B
18.5 B
Southbound 17.9 B
Eastbound
Approach
LOS
Overall
DelayOverall
LOS
Simulated
Volume
Average
Queue
Maximum
Queue
Movement
DelayMovement
LOS
Approach
DelayApproach Movement
Eastbound 35.5 D
Westbound 38.9 D
Northbound 31.1 C
27.8 C
Southbound 14.8 B
Approach
DelayApproach
LOS
Overall
DelayOverall
LOS
Simulated
Volume
Average
Queue
Maximum
Queue
Movement
DelayMovement
LOS
33.7 C
Westbound 32.8 C
Approach Movement
Northbound 20.5 C
27.9 C
Southbound 27.8 C
Eastbound
Approach
LOS
Overall
DelayOverall
LOS
Simulated
Volume
Average
Queue
Maximum
Queue
Movement
DelayMovement
LOS
Approach
DelayApproach Movement
Eastbound 34.4 C
Westbound 32.2 C
Northbound 68.3 E
40.1 D
Southbound 27.5 C
Approach
DelayApproach
LOS
Overall
DelayOverall
LOS
Simulated
Volume
Average
Queue
Maximum
Queue
Movement
DelayMovement
LOSApproach Movement
* Results shown are the average of 20 model runs.
** Results shown are from all vehicles except transit vehicles.
H:\Projects\7939\SD\VISSIM\2_RB_Prelim\11 MOEs\7939_Prelim_RB_PM Arterial MOEs.xls 4/8/2013

Year 2013 Preliminary Rapid Bus Conditions VISSIM Model
Snelling Avenue Rapid Bus VISSIM Evaluation
Arterial MOEs (P.M. Peak Hour 4:45 - 5:45)
Snelling at Jefferson
(vph) (ft) (ft) (sec/veh) (sec/veh) (sec/veh)
Left 7 24 310 15.7 B
Thru 670 24 311 12.5 B
Right 44 27 323 12.1 B
Left 38 20 188 15.2 B
Thru 747 20 188 8.5 A
Right 1 23 201 16.7 B
Left 11 20 156 39.2 D
Thru 82 20 153 36.1 D
Right 8 29 177 23.6 C
Left 40 34 226 42.1 D
Thru 85 34 227 39.3 D
Right 37 42 242 26.3 C
Snelling at Randolph
(vph) (ft) (ft) (sec/veh) (sec/veh) (sec/veh)
Left 53 5 91 23.7 C
Thru 495 50 292 28.6 C
Right 106 5 169 13.6 B
Left 146 13 174 21.8 C
Thru 539 30 267 17.8 B
Right 116 3 123 9.4 A
Left 123 33 493 38.7 D
Thru 422 107 601 33.5 C
Right 41 1 62 19.2 B
Left 88 11 122 29.0 C
Thru 346 77 547 30.2 C
Right 103 8 313 16.4 B
Snelling at Highland
(vph) (ft) (ft) (sec/veh) (sec/veh) (sec/veh)
Left 8 5 105 8.6 A
Thru 606 5 106 3.2 A
Right 101 7 118 3.2 A
Left 33 12 255 15.8 B
Thru 597 12 255 7.9 A
Right 36 14 264 7.2 A
Left 23 11 109 21.2 C
Thru 75 10 111 21.3 C
Right 18 1 40 5.9 A
Left 110 17 135 29.4 C
Thru 68 8 108 21.4 C
Right 21 10 120 9.0 A
Snelling at Ford
(vph) (ft) (ft) (sec/veh) (sec/veh) (sec/veh)
Left 124 13 156 17.3 B
Thru 446 13 156 5.7 A
Right 5 18 170 3.5 A
Left 13 5 132 8.8 A
Thru 458 5 134 4.2 A
Right 251 3 138 4.6 A
Left 266 25 185 24.7 C
Thru 8 25 181 25.9 C
Right 144 7 148 11.6 B
Left 8 1 41 19.6 B
Thru 5 1 37 19.2 B
Right 3 0 58 6.0 A
20.2 C
Westbound 16.9 B
Northbound 8.2 A
9.6 A
Southbound 4.4 A
Eastbound
Approach
LOS
Overall
DelayOverall
LOS
Simulated
Volume
Average
Queue
Maximum
Queue
Movement
DelayMovement
LOS
Approach
DelayApproach Movement
Eastbound 18.9 B
Westbound 24.5 C
Northbound 3.2 A
8.8 A
Southbound 8.3 A
Approach
DelayApproach
LOS
Overall
DelayOverall
LOS
Simulated
Volume
Average
Queue
Maximum
Queue
Movement
DelayMovement
LOS
33.6 C
Westbound 27.3 C
Approach Movement
Northbound 25.8 C
25.3 C
Southbound 17.3 B
Eastbound
Approach
LOS
Overall
DelayOverall
LOS
Simulated
Volume
Average
Queue
Maximum
Queue
Movement
DelayMovement
LOS
Approach
DelayApproach Movement
Eastbound 35.5 D
Westbound 37.1 D
Northbound 12.5 B
14.4 B
Southbound 8.9 A
Approach
DelayApproach
LOS
Overall
DelayOverall
LOS
Simulated
Volume
Average
Queue
Maximum
Queue
Movement
DelayMovement
LOSApproach Movement
* Results shown are the average of 20 model runs.
** Results shown are from all vehicles except transit vehicles.
H:\Projects\7939\SD\VISSIM\2_RB_Prelim\11 MOEs\7939_Prelim_RB_PM Arterial MOEs.xls 4/8/2013

Year 2013 Preliminary Rapid Bus Conditions VISSIM Model
Snelling Avenue Rapid Bus VISSIM Evaluation
Arterial MOEs (P.M. Peak Hour 4:45 - 5:45)
Ford at Fairview
(vph) (ft) (ft) (sec/veh) (sec/veh) (sec/veh)
Left 71 13 141 42.3 D
Thru 497 32 347 13.3 B
Right 25 34 362 11.6 B
Left 26 1 50 23.1 C
Thru 464 46 468 16.7 B
Right 181 52 483 15.5 B
Left 143 44 297 56.3 E
Thru 367 32 416 18.6 B
Right 66 2 86 12.1 B
Left 15 1 42 22.3 C
Thru 351 31 276 17.8 B
Right 16 0 53 8.5 A
Ford at Kenneth
(vph) (ft) (ft) (sec/veh) (sec/veh) (sec/veh)
Left 55 30 226 51.3 D
Thru 21 29 225 48.2 D
Right 37 24 223 26.7 C
Left 29 18 150 45.6 D
Thru 26 18 154 46.4 D
Right 43 15 151 19.6 B
Left 47 1 51 7.9 A
Thru 505 6 122 2.6 A
Right 49 7 134 2.6 A
Left 14 0 30 9.2 A
Thru 568 8 153 6.0 A
Right 21 9 157 4.8 A
Ford at Cleveland
(vph) (ft) (ft) (sec/veh) (sec/veh) (sec/veh)
Left 247 45 310 33.2 C
Thru 352 63 390 26.9 C
Right 38 61 387 28.2 C
Left 79 10 240 36.0 D
Thru 403 139 760 41.6 D
Right 170 138 759 46.0 D
Left 160 33 333 36.6 D
Thru 487 79 439 23.8 C
Right 268 80 439 36.0 D
Left 84 14 139 33.7 C
Thru 497 56 311 26.7 C
Right 82 56 312 28.5 C
Ford at Finn
(vph) (ft) (ft) (sec/veh) (sec/veh) (sec/veh)
Left 200 59 285 48.3 D
Thru 10 58 294 31.4 C
Right 176 61 291 10.4 B
Left 114 39 244 41.2 D
Thru 16 39 248 36.5 D
Right 67 39 250 26.4 C
Left 52 4 128 18.5 B
Thru 636 34 311 14.8 B
Right 44 34 320 11.0 B
Left 196 11 160 14.2 B
Thru 660 15 179 7.4 A
Right 52 16 186 5.8 A
14.8 B
Westbound 8.8 A
Northbound 30.6 C
17.0 B
Southbound 35.8 D
Eastbound
Approach
LOS
Overall
DelayOverall
LOS
Simulated
Volume
Average
Queue
Maximum
Queue
Movement
DelayMovement
LOS
Approach
DelayApproach Movement
Eastbound 29.6 C
Westbound 27.8 C
Northbound 29.4 C
32.0 C
Southbound 42.1 D
Approach
DelayApproach
LOS
Overall
DelayOverall
LOS
Simulated
Volume
Average
Queue
Maximum
Queue
Movement
DelayMovement
LOS
3.0 A
Westbound 6.1 A
Approach Movement
Northbound 42.6 D
9.6 A
Southbound 34.3 C
Eastbound
Approach
LOS
Overall
DelayOverall
LOS
Simulated
Volume
Average
Queue
Maximum
Queue
Movement
DelayMovement
LOS
Approach
DelayApproach Movement
Eastbound 27.2 C
Westbound 17.5 B
Northbound 16.7 B
19.6 B
Southbound 16.6 B
Approach
DelayApproach
LOS
Overall
DelayOverall
LOS
Simulated
Volume
Average
Queue
Maximum
Queue
Movement
DelayMovement
LOSApproach Movement
* Results shown are the average of 20 model runs.
** Results shown are from all vehicles except transit vehicles.
H:\Projects\7939\SD\VISSIM\2_RB_Prelim\11 MOEs\7939_Prelim_RB_PM Arterial MOEs.xls 4/8/2013

Year 2013 Preliminary Rapid Bus Conditions VISSIM Model
Snelling Avenue Rapid Bus VISSIM Evaluation
Arterial MOEs (P.M. Peak Hour 4:45 - 5:45)
Ford at Cretin
(vph) (ft) (ft) (sec/veh) (sec/veh) (sec/veh)
Left 172 49 255 47.0 D
Right 111 3 70 5.7 A
Left 111 4 121 13.1 B
Thru 560 7 145 5.0 A
Thru 783 27 264 8.9 A
Right 146 27 266 14.3 B
46th at 46th
(vph) (ft) (ft) (sec/veh) (sec/veh) (sec/veh)
Left 14 16 148 53.5 D
Thru 38 16 143 52.5 D
Right 252 0 12 2.8 A
Left 81 21 168 42.3 D
Thru 31 12 110 53.1 D
Right 10 10 110 68.9 E
Left 26 1 47 9.9 A
Thru 340 20 161 11.7 B
Right 51 27 178 19.3 B
Left 299 17 252 16.3 B
Thru 473 12 217 9.6 A
Right 119 5 161 9.7 A
46th at 42nd
(vph) (ft) (ft) (sec/veh) (sec/veh) (sec/veh)
Left 5 2 38 29.5 C
Thru 6 1 39 21.6 C
Right 4 1 42 3.8 A
Left 37 9 126 26.6 C
Thru 5 9 125 27.6 C
Right 58 7 127 10.6 B
Left 85 13 151 30.6 C
Thru 375 28 198 20.4 C
Right 5 33 212 18.4 B
Left 3 0 18 10.4 B
Thru 458 9 172 6.8 A
Right 34 11 182 5.8 A
46th at Minnehaha
(vph) (ft) (ft) (sec/veh) (sec/veh) (sec/veh)
Left 42 65 423 44.2 D
Thru 272 63 418 35.0 C
Right 66 61 416 22.4 C
Left 122 374 1,132 103.7 F
Thru 314 363 1,122 90.0 F
Right 121 364 1,125 81.4 F
Left 173 23 199 27.3 C
Thru 277 20 206 14.9 B
Right 15 25 220 15.8 B
Left 82 18 179 40.9 D
Thru 351 55 307 35.0 D
Right 91 56 311 29.6 C
19.5 B
Westbound 35.0 C
Northbound 33.8 C
47.3 D
Southbound 91.1 F
Eastbound
Approach
LOS
Overall
DelayOverall
LOS
Simulated
Volume
Average
Queue
Maximum
Queue
Movement
DelayMovement
LOS
Approach
DelayApproach Movement
Eastbound 22.2 C
Westbound 6.7 A
Northbound 19.7 B
14.6 B
Southbound 17.4 B
Approach
DelayApproach
LOS
Overall
DelayOverall
LOS
Simulated
Volume
Average
Queue
Maximum
Queue
Movement
DelayMovement
LOS
12.5 B
Westbound 11.9 B
Approach Movement
Northbound 11.4 B
14.4 B
Southbound 47.2 D
Eastbound
Approach
LOS
Overall
DelayOverall
LOS
Simulated
Volume
Average
Queue
Maximum
Queue
Movement
DelayMovement
LOS
Approach
DelayApproach Movement
Eastbound 6.3 A
Westbound 9.8 A
11.7 B
Southbound 30.8 C
Approach
DelayApproach
LOS
Overall
DelayOverall
LOS
Simulated
Volume
Average
Queue
Maximum
Queue
Movement
DelayMovement
LOSApproach Movement
* Results shown are the average of 20 model runs.
** Results shown are from all vehicles except transit vehicles.
H:\Projects\7939\SD\VISSIM\2_RB_Prelim\11 MOEs\7939_Prelim_RB_PM Arterial MOEs.xls 4/8/2013

Year 2013 Preliminary Rapid Bus Conditions VISSIM Model
Snelling Avenue Rapid Bus VISSIM Evaluation
Arterial MOEs (P.M. Peak Hour 4:45 - 5:45)
46th at Hiawatha
(vph) (ft) (ft) (sec/veh) (sec/veh) (sec/veh)
Left 84 20 140 42.9 D
Thru 808 71 365 27.9 C
Right 243 0 2 2.7 A
Left 145 34 207 40.9 D
Thru 858 64 369 24.3 C
Right 40 0 0 2.2 A
Left 52 7 88 25.5 C
Thru 77 18 115 33.1 C
Right 22 18 115 36.2 D
Left 202 52 377 43.3 D
Thru 146 20 240 25.6 C
Right 168 6 198 12.0 B
46th at 36th
(vph) (ft) (ft) (sec/veh) (sec/veh) (sec/veh)
Left 1 0 29 9.1 A
Thru 2 0 27 11.2 B
Right 0 - - - A
Left 36 1 58 6.2 A
Thru 1 1 61 7.8 A
Right 5 1 65 4.0 A
Left 5 0 21 5.1 A
Thru 115 1 71 4.6 A
Right 1 2 96 1.8 A
Left 0 - - - A
Thru 241 3 159 3.2 A
Right 28 0 56 2.0 A
4.6 A
Westbound 3.1 A
Northbound 10.2 B
3.8 A
Southbound 6.0 A
Eastbound
Approach
LOS
Overall
DelayOverall
LOSApproach
Simulated
Volume
Average
Queue
Maximum
Queue
Movement
DelayMovement
LOS
Approach
DelayMovement
Eastbound 30.9
28.1Westbound C
Northbound 23.6 C
25.6 C
Southbound 25.7 C
Approach
DelayApproach
LOS
Overall
DelayOverall
LOS
C
Simulated
Volume
Average
Queue
Maximum
Queue
Movement
DelayMovement
LOSApproach Movement
* Results shown are the average of 20 model runs.
** Results shown are from all vehicles except transit vehicles.
H:\Projects\7939\SD\VISSIM\2_RB_Prelim\11 MOEs\7939_Prelim_RB_PM Arterial MOEs.xls 4/8/2013
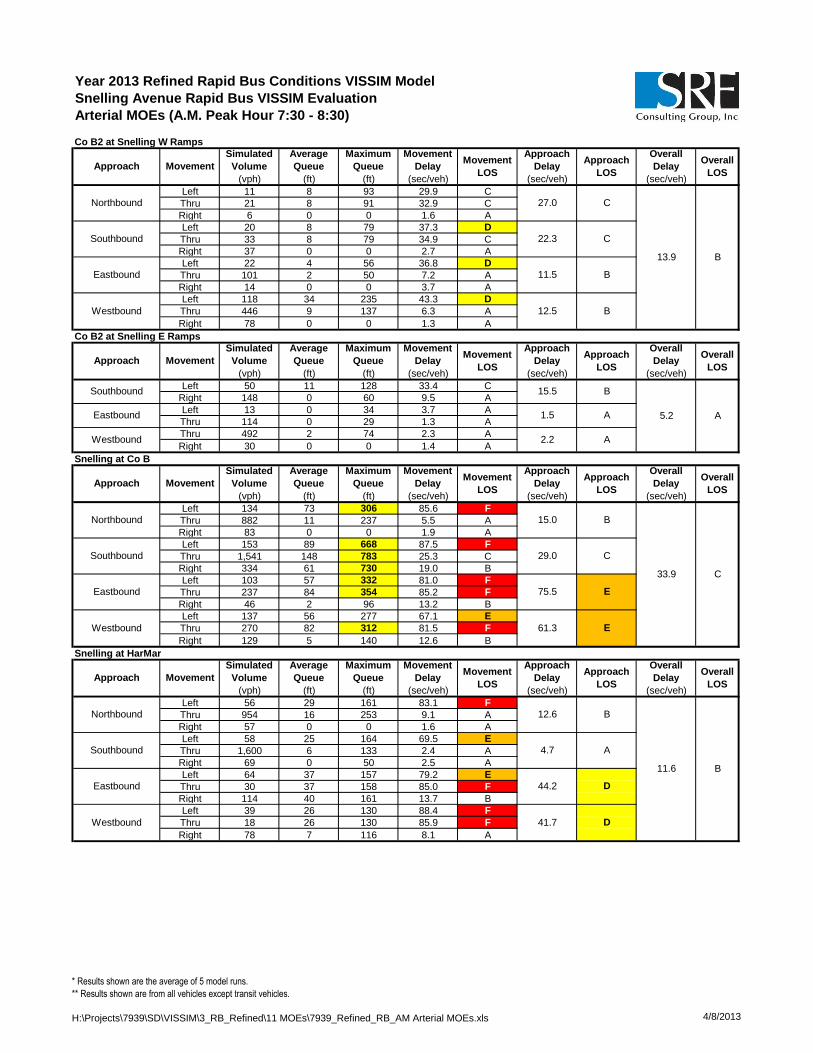
Year 2013 Refined Rapid Bus Conditions VISSIM Model
Snelling Avenue Rapid Bus VISSIM Evaluation
Arterial MOEs (A.M. Peak Hour 7:30 - 8:30)
Co B2 at Snelling W Ramps
(vph) (ft) (ft) (sec/veh) (sec/veh) (sec/veh)
Left 11 8 93 29.9 C
Thru 21 8 91 32.9 C
Right 6 0 0 1.6 A
Left 20 8 79 37.3 D
Thru 33 8 79 34.9 C
Right 37 0 0 2.7 A
Left 22 4 56 36.8 D
Thru 101 2 50 7.2 A
Right 14 0 0 3.7 A
Left 118 34 235 43.3 D
Thru 446 9 137 6.3 A
Right 78 0 0 1.3 A
Co B2 at Snelling E Ramps
(vph) (ft) (ft) (sec/veh) (sec/veh) (sec/veh)
Left 50 11 128 33.4 C
Right 148 0 60 9.5 A
Left 13 0 34 3.7 A
Thru 114 0 29 1.3 A
Thru 492 2 74 2.3 A
Right 30 0 0 1.4 A
Snelling at Co B
(vph) (ft) (ft) (sec/veh) (sec/veh) (sec/veh)
Left 134 73 306 85.6 F
Thru 882 11 237 5.5 A
Right 83 0 0 1.9 A
Left 153 89 668 87.5 F
Thru 1,541 148 783 25.3 C
Right 334 61 730 19.0 B
Left 103 57 332 81.0 F
Thru 237 84 354 85.2 F
Right 46 2 96 13.2 B
Left 137 56 277 67.1 E
Thru 270 82 312 81.5 F
Right 129 5 140 12.6 B
Snelling at HarMar
(vph) (ft) (ft) (sec/veh) (sec/veh) (sec/veh)
Left 56 29 161 83.1 F
Thru 954 16 253 9.1 A
Right 57 0 0 1.6 A
Left 58 25 164 69.5 E
Thru 1,600 6 133 2.4 A
Right 69 0 50 2.5 A
Left 64 37 157 79.2 E
Thru 30 37 158 85.0 F
Right 114 40 161 13.7 B
Left 39 26 130 88.4 F
Thru 18 26 130 85.9 F
Right 78 7 116 8.1 A
11.5 B
Westbound 12.5 B
Northbound 27.0 C
13.9 B
Southbound 22.3 C
Eastbound
Approach
LOS
Overall
DelayOverall
LOSApproach
Simulated
Volume
Average
Queue
Maximum
Queue
Movement
DelayMovement
LOS
Approach
DelayMovement
Approach Movement
Simulated
Volume
Average
Queue
Maximum
Queue
Movement
DelayMovement
LOS
Approach
Delay
5.2 A
Southbound 15.5 B
Eastbound
Approach
LOS
Overall
DelayOverall
LOS
1.5 A
Westbound 2.2 A
Approach Movement
Simulated
Volume
Average
Queue
Maximum
Queue
Movement
DelayMovement
LOS
Approach
DelayApproach
LOS
Overall
DelayOverall
LOS
Northbound 15.0 B
33.9 C
Southbound 29.0 C
Eastbound 75.5 E
Westbound 61.3 E
Approach Movement
Simulated
Volume
Average
Queue
Maximum
Queue
Movement
DelayMovement
LOS
Approach
DelayApproach
LOS
Overall
DelayOverall
LOS
Northbound 12.6 B
11.6 B
Southbound 4.7 A
Eastbound 44.2 D
Westbound 41.7 D
* Results shown are the average of 5 model runs.
** Results shown are from all vehicles except transit vehicles.
H:\Projects\7939\SD\VISSIM\3_RB_Refined\11 MOEs\7939_Refined_RB_AM Arterial MOEs.xls 4/8/2013

Year 2013 Refined Rapid Bus Conditions VISSIM Model
Snelling Avenue Rapid Bus VISSIM Evaluation
Arterial MOEs (A.M. Peak Hour 7:30 - 8:30)
Snelling at Roselawn
(vph) (ft) (ft) (sec/veh) (sec/veh) (sec/veh)
Left 10 4 63 71.8 E
Thru 941 9 263 4.8 A
Right 10 0 31 2.5 A
Left 32 24 112 115.4 F
Thru 1,675 6 145 2.6 A
Right 47 0 27 2.4 A
Left 24 51 222 126.4 F
Thru 42 48 214 112.4 F
Right 76 3 85 12.5 B
Left 47 112 513 104.1 F
Thru 113 112 514 105.4 F
Right 103 4 90 15.5 B
Snelling at Larpenteur
(vph) (ft) (ft) (sec/veh) (sec/veh) (sec/veh)
Left 181 90 399 76.1 E
Thru 788 41 354 16.7 B
Right 40 1 62 4.4 A
Left 48 38 161 128.2 F
Thru 1,626 147 1,156 26.2 C
Right 121 3 94 13.6 B
Left 83 38 183 75.3 E
Thru 192 52 224 66.8 E
Right 21 64 242 55.8 E
Left 222 1,103 1,701 286.2 F
Thru 711 1,335 1,701 291.7 F
Right 89 1,348 1,702 295.6 F
Snelling at Hoyt
(vph) (ft) (ft) (sec/veh) (sec/veh) (sec/veh)
Left 15 0 36 20.7 C
Thru 923 11 256 5.3 A
Right 30 0 0 2.6 A
Left 16 0 13 7.0 A
Thru 1,836 2 117 2.1 A
Right 14 0 0 3.6 A
Left 10 4 45 73.1 E
Thru 7 4 67 88.5 F
Right 8 3 93 17.3 B
Left 73 39 212 87.2 F
Thru 9 10 140 75.3 E
Right 77 11 157 16.3 B
Snelling at Midway
(vph) (ft) (ft) (sec/veh) (sec/veh) (sec/veh)
Left 44 1 62 21.4 C
Thru 941 12 241 5.5 A
Right 21 0 42 2.7 A
Left 43 0 18 7.9 A
Thru 1,826 4 175 3.9 A
Right 52 7 211 5.2 A
Left 0 - - - A
Thru 13 6 71 80.9 F
Right 3 0 37 7.5 A
Left 45 35 175 78.6 E
Thru 26 35 172 84.5 F
Right 23 1 58 6.9 A
Approach Movement
Simulated
Volume
Average
Queue
Maximum
Queue
Movement
DelayMovement
LOS
Approach
DelayApproach
LOS
Overall
DelayOverall
LOS
Northbound 5.5 A
13.0 B
Southbound 4.6 A
Eastbound 61.2 E
Westbound 70.2 E
Approach Movement
Simulated
Volume
Average
Queue
Maximum
Queue
Movement
DelayMovement
LOS
Approach
DelayApproach
LOS
Overall
DelayOverall
LOS
Northbound 26.9 C
95.8 F
Southbound 28.0 C
Eastbound 68.4 E
Westbound 290.8 F
Approach Movement
Simulated
Volume
Average
Queue
Maximum
Queue
Movement
DelayMovement
LOS
Approach
DelayApproach
LOS
Overall
DelayOverall
LOS
Northbound 5.5 A
6.3 A
Southbound 2.2 A
Eastbound 59.5 E
Westbound 52.1 D
Approach Movement
Simulated
Volume
Average
Queue
Maximum
Queue
Movement
DelayMovement
LOS
Approach
DelayApproach
LOS
Overall
DelayOverall
LOS
Northbound 6.1 A
6.9 A
Southbound 4.0 A
Eastbound 67.5 E
Westbound 62.5 E
* Results shown are the average of 5 model runs.
** Results shown are from all vehicles except transit vehicles.
H:\Projects\7939\SD\VISSIM\3_RB_Refined\11 MOEs\7939_Refined_RB_AM Arterial MOEs.xls 4/8/2013
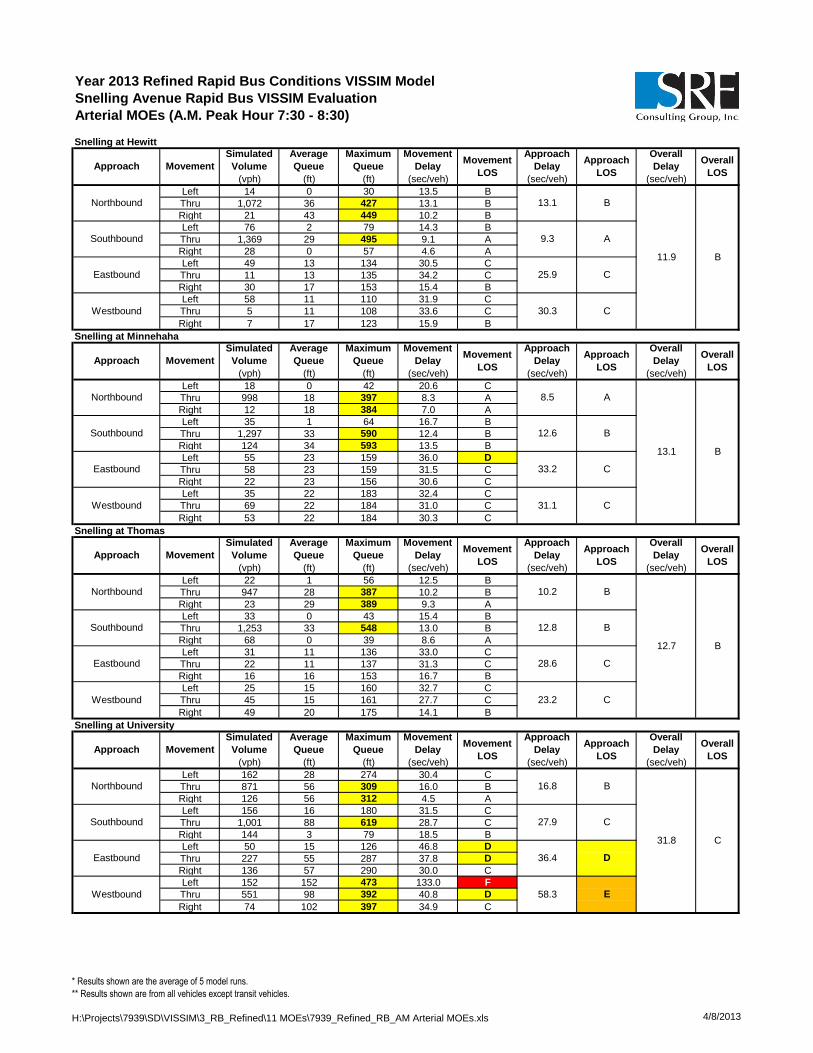
Year 2013 Refined Rapid Bus Conditions VISSIM Model
Snelling Avenue Rapid Bus VISSIM Evaluation
Arterial MOEs (A.M. Peak Hour 7:30 - 8:30)
Snelling at Hewitt
(vph) (ft) (ft) (sec/veh) (sec/veh) (sec/veh)
Left 14 0 30 13.5 B
Thru 1,072 36 427 13.1 B
Right 21 43 449 10.2 B
Left 76 2 79 14.3 B
Thru 1,369 29 495 9.1 A
Right 28 0 57 4.6 A
Left 49 13 134 30.5 C
Thru 11 13 135 34.2 C
Right 30 17 153 15.4 B
Left 58 11 110 31.9 C
Thru 5 11 108 33.6 C
Right 7 17 123 15.9 B
Snelling at Minnehaha
(vph) (ft) (ft) (sec/veh) (sec/veh) (sec/veh)
Left 18 0 42 20.6 C
Thru 998 18 397 8.3 A
Right 12 18 384 7.0 A
Left 35 1 64 16.7 B
Thru 1,297 33 590 12.4 B
Right 124 34 593 13.5 B
Left 55 23 159 36.0 D
Thru 58 23 159 31.5 C
Right 22 23 156 30.6 C
Left 35 22 183 32.4 C
Thru 69 22 184 31.0 C
Right 53 22 184 30.3 C
Snelling at Thomas
(vph) (ft) (ft) (sec/veh) (sec/veh) (sec/veh)
Left 22 1 56 12.5 B
Thru 947 28 387 10.2 B
Right 23 29 389 9.3 A
Left 33 0 43 15.4 B
Thru 1,253 33 548 13.0 B
Right 68 0 39 8.6 A
Left 31 11 136 33.0 C
Thru 22 11 137 31.3 C
Right 16 16 153 16.7 B
Left 25 15 160 32.7 C
Thru 45 15 161 27.7 C
Right 49 20 175 14.1 B
Snelling at University
(vph) (ft) (ft) (sec/veh) (sec/veh) (sec/veh)
Left 162 28 274 30.4 C
Thru 871 56 309 16.0 B
Right 126 56 312 4.5 A
Left 156 16 180 31.5 C
Thru 1,001 88 619 28.7 C
Right 144 3 79 18.5 B
Left 50 15 126 46.8 D
Thru 227 55 287 37.8 D
Right 136 57 290 30.0 C
Left 152 152 473 133.0 F
Thru 551 98 392 40.8 D
Right 74 102 397 34.9 C
Approach Movement
Simulated
Volume
Average
Queue
Maximum
Queue
Movement
DelayMovement
LOS
Approach
DelayApproach
LOS
Overall
DelayOverall
LOS
Northbound 13.1 B
11.9 B
Southbound 9.3 A
Eastbound 25.9 C
Westbound 30.3 C
Approach Movement
Simulated
Volume
Average
Queue
Maximum
Queue
Movement
DelayMovement
LOS
Approach
DelayApproach
LOS
Overall
DelayOverall
LOS
Northbound 8.5 A
13.1 B
Southbound 12.6 B
Eastbound 33.2 C
Westbound 31.1 C
Approach Movement
Simulated
Volume
Average
Queue
Maximum
Queue
Movement
DelayMovement
LOS
Approach
DelayApproach
LOS
Overall
DelayOverall
LOS
Northbound 10.2 B
12.7 B
Southbound 12.8 B
Eastbound 28.6 C
Westbound 23.2 C
Approach Movement
Simulated
Volume
Average
Queue
Maximum
Queue
Movement
DelayMovement
LOS
Approach
DelayApproach
LOS
Overall
DelayOverall
LOS
Northbound 16.8 B
31.8 C
Southbound 27.9 C
Eastbound 36.4 D
Westbound 58.3 E
* Results shown are the average of 5 model runs.
** Results shown are from all vehicles except transit vehicles.
H:\Projects\7939\SD\VISSIM\3_RB_Refined\11 MOEs\7939_Refined_RB_AM Arterial MOEs.xls 4/8/2013

Year 2013 Refined Rapid Bus Conditions VISSIM Model
Snelling Avenue Rapid Bus VISSIM Evaluation
Arterial MOEs (A.M. Peak Hour 7:30 - 8:30)
Snelling at Spruce Tree
(vph) (ft) (ft) (sec/veh) (sec/veh) (sec/veh)
Left 66 1 56 10.2 B
Thru 1,107 17 229 6.3 A
Right 54 21 241 5.0 A
Left 18 0 21 12.6 B
Thru 1,225 10 247 3.0 A
Right 51 13 266 2.5 A
Left 19 6 70 49.8 D
Thru 0 7 72 73.1 E
Right 61 2 90 7.7 A
Left 46 13 115 45.0 D
Thru 22 9 110 49.0 D
Right 36 10 113 18.1 B
Snelling at St Anthony
(vph) (ft) (ft) (sec/veh) (sec/veh) (sec/veh)
Left 876 39 312 13.3 B
Thru 824 39 312 8.7 A
Thru 934 98 552 39.0 D
Right 404 54 492 10.4 B
Left 214 65 349 32.1 C
Thru 526 65 345 34.6 C
Right 392 27 285 8.5 A
Snelling at Concordia
(vph) (ft) (ft) (sec/veh) (sec/veh) (sec/veh)
Thru 1,370 46 325 19.2 B
Right 414 7 239 11.6 B
Left 492 12 328 9.8 A
Thru 640 12 329 5.2 A
Left 327 55 247 39.1 D
Thru 164 55 247 36.7 D
Right 413 0 0 3.4 A
Snelling at Marshall
(vph) (ft) (ft) (sec/veh) (sec/veh) (sec/veh)
Left 67 7 78 35.1 D
Thru 1,474 178 649 29.6 C
Right 50 1 69 13.7 B
Left 26 3 56 29.1 C
Thru 793 66 292 24.3 C
Right 227 12 191 11.4 B
Left 271 70 390 42.1 D
Thru 210 24 169 25.7 C
Right 58 27 197 14.4 B
Left 47 5 107 19.9 B
Thru 329 42 225 31.7 C
Right 47 42 233 24.2 C
Approach Movement
Simulated
Volume
Average
Queue
Maximum
Queue
Movement
DelayMovement
LOS
Approach
DelayApproach
LOS
Overall
DelayOverall
LOS
Northbound 6.5 A
6.4 A
Southbound 3.1 A
Eastbound 18.1 B
Westbound 36.6 D
Approach
DelayApproach Movement
Overall
DelayOverall
LOS
Simulated
Volume
Average
Queue
Maximum
Queue
Movement
DelayMovement
LOS
Northbound 11.1 B
21.1 CSouthbound 30.4 C
Approach
LOS
Westbound 25.1 C
Approach MovementOverall
LOS
Simulated
Volume
Average
Queue
Maximum
Queue
Movement
DelayMovement
LOS
Southbound 7.2 A
Approach
DelayApproach
LOS
Overall
Delay
Eastbound 22.3 C
Northbound 17.4 B
15.6 B
Approach Movement
Simulated
Volume
Average
Queue
Maximum
Queue
Movement
DelayMovement
LOS
Approach
DelayApproach
LOS
Overall
DelayOverall
LOS
Northbound 29.4 C
27.6 C
Southbound 21.6 C
Eastbound 32.8 C
Westbound 29.5 C
* Results shown are the average of 5 model runs.
** Results shown are from all vehicles except transit vehicles.
H:\Projects\7939\SD\VISSIM\3_RB_Refined\11 MOEs\7939_Refined_RB_AM Arterial MOEs.xls 4/8/2013

Year 2013 Refined Rapid Bus Conditions VISSIM Model
Snelling Avenue Rapid Bus VISSIM Evaluation
Arterial MOEs (A.M. Peak Hour 7:30 - 8:30)
Snelling at Selby
(vph) (ft) (ft) (sec/veh) (sec/veh) (sec/veh)
Left 12 2 52 67.1 E
Thru 1,074 295 1,019 64.3 E
Right 21 297 1,008 56.4 E
Left 230 99 438 66.3 E
Thru 645 34 311 14.2 B
Right 28 36 306 11.5 B
Left 68 82 355 153.6 F
Thru 149 28 320 38.4 D
Right 13 28 315 26.0 C
Left 31 3 45 32.3 C
Thru 174 128 523 38.3 D
Right 452 131 529 30.0 C
Snelling at Summit
(vph) (ft) (ft) (sec/veh) (sec/veh) (sec/veh)
Left 41 1 42 10.4 B
Thru 916 15 158 5.0 A
Right 32 15 157 7.2 A
Left 40 14 137 30.7 C
Thru 549 48 270 21.8 C
Right 101 48 271 22.1 C
Left 49 14 195 54.8 D
Thru 178 28 262 25.1 C
Right 13 38 286 19.7 B
Left 64 7 211 39.2 D
Thru 357 138 598 41.4 D
Right 146 152 616 35.2 D
Snelling at Grand
(vph) (ft) (ft) (sec/veh) (sec/veh) (sec/veh)
Left 44 1 47 12.3 B
Thru 763 35 278 14.5 B
Right 55 36 288 14.0 B
Left 98 13 127 29.2 C
Thru 421 33 206 17.2 B
Right 102 36 223 12.6 B
Left 46 6 83 26.3 C
Thru 184 34 282 27.7 C
Right 23 36 299 21.3 C
Left 82 12 231 38.3 D
Thru 298 147 601 45.4 D
Right 176 153 617 38.1 D
Snelling at St Clair
(vph) (ft) (ft) (sec/veh) (sec/veh) (sec/veh)
Left 39 1 49 12.2 B
Thru 645 12 120 6.4 A
Right 43 0 54 3.7 A
Left 46 2 65 13.8 B
Thru 449 11 159 7.2 A
Right 30 15 175 6.7 A
Left 47 34 276 33.2 C
Thru 217 34 272 25.3 C
Right 39 42 292 13.0 B
Left 68 62 430 37.4 D
Thru 256 63 434 30.1 C
Right 179 74 454 20.5 C
Approach Movement
Simulated
Volume
Average
Queue
Maximum
Queue
Movement
DelayMovement
LOS
Approach
DelayApproach
LOS
Overall
DelayOverall
LOS
Northbound 64.2 E
46.1 D
Southbound 27.4 C
Eastbound 71.8 E
Westbound 32.3 C
Approach Movement
Simulated
Volume
Average
Queue
Maximum
Queue
Movement
DelayMovement
LOS
Approach
DelayApproach
LOS
Overall
DelayOverall
LOS
Northbound 5.3 A
20.3 C
Southbound 22.3 C
Eastbound 30.8 C
Westbound 39.5 D
Approach Movement
Simulated
Volume
Average
Queue
Maximum
Queue
Movement
DelayMovement
LOS
Approach
DelayApproach
LOS
Overall
DelayOverall
LOS
Northbound 14.3 B
23.5 C
Southbound 18.4 B
Eastbound 26.8 C
Westbound 42.0 D
Approach Movement
Simulated
Volume
Average
Queue
Maximum
Queue
Movement
DelayMovement
LOS
Approach
DelayApproach
LOS
Overall
DelayOverall
LOS
Northbound 6.5 A
14.7 B
Southbound 7.7 A
Eastbound 24.9 C
Westbound 27.7 C
* Results shown are the average of 5 model runs.
** Results shown are from all vehicles except transit vehicles.
H:\Projects\7939\SD\VISSIM\3_RB_Refined\11 MOEs\7939_Refined_RB_AM Arterial MOEs.xls 4/8/2013

Year 2013 Refined Rapid Bus Conditions VISSIM Model
Snelling Avenue Rapid Bus VISSIM Evaluation
Arterial MOEs (A.M. Peak Hour 7:30 - 8:30)
Snelling at Jefferson
(vph) (ft) (ft) (sec/veh) (sec/veh) (sec/veh)
Left 5 17 244 17.8 B
Thru 646 17 245 10.6 B
Right 24 21 255 9.0 A
Left 16 6 100 6.3 A
Thru 545 6 101 3.4 A
Right 4 9 122 4.8 A
Left 19 13 117 32.5 C
Thru 59 13 114 28.6 C
Right 7 21 137 13.6 B
Left 62 29 218 31.1 C
Thru 66 30 222 34.1 C
Right 54 37 234 21.0 C
Snelling at Randolph
(vph) (ft) (ft) (sec/veh) (sec/veh) (sec/veh)
Left 64 5 79 16.8 B
Thru 486 40 217 24.0 C
Right 33 1 65 8.8 A
Left 98 5 133 16.6 B
Thru 352 24 262 19.3 B
Right 155 7 193 11.9 B
Left 101 33 417 44.1 D
Thru 364 98 517 35.9 D
Right 44 1 68 18.0 B
Left 60 8 90 35.8 D
Thru 407 117 584 37.9 D
Right 88 9 401 21.5 C
Snelling at Highland
(vph) (ft) (ft) (sec/veh) (sec/veh) (sec/veh)
Left 3 5 100 5.5 A
Thru 490 5 104 3.6 A
Right 153 8 116 3.4 A
Left 20 7 176 11.8 B
Thru 426 6 176 6.1 A
Right 12 8 185 5.3 A
Left 37 15 147 22.1 C
Thru 93 15 146 23.0 C
Right 9 0 35 6.5 A
Left 124 19 115 30.4 C
Thru 61 8 114 21.6 C
Right 61 12 127 8.8 A
Snelling at Ford
(vph) (ft) (ft) (sec/veh) (sec/veh) (sec/veh)
Left 76 7 105 11.3 B
Thru 441 7 105 4.8 A
Right 5 11 127 3.2 A
Left 2 2 75 10.1 B
Thru 390 2 77 2.6 A
Right 171 1 90 2.9 A
Left 203 22 172 24.3 C
Thru 3 22 171 26.9 C
Right 76 3 118 8.4 A
Left 8 1 43 24.0 C
Thru 5 1 46 15.9 B
Right 2 0 61 5.9 A
Approach Movement
Simulated
Volume
Average
Queue
Maximum
Queue
Movement
DelayMovement
LOS
Approach
DelayApproach
LOS
Overall
DelayOverall
LOS
Northbound 10.6 B
11.2 B
Southbound 3.5 A
Eastbound 28.2 C
Westbound 29.2 C
Approach Movement
Simulated
Volume
Average
Queue
Maximum
Queue
Movement
DelayMovement
LOS
Approach
DelayApproach
LOS
Overall
DelayOverall
LOS
Northbound 22.4 C
27.1 C
Southbound 16.9 B
Eastbound 35.9 D
Westbound 35.1 D
Approach Movement
Simulated
Volume
Average
Queue
Maximum
Queue
Movement
DelayMovement
LOS
Approach
DelayApproach
LOS
Overall
DelayOverall
LOS
Northbound 3.5 A
9.3 A
Southbound 6.4 A
Eastbound 21.7 C
Westbound 22.9 C
Approach Movement
Simulated
Volume
Average
Queue
Maximum
Queue
Movement
DelayMovement
LOS
Approach
DelayApproach
LOS
Overall
DelayOverall
LOS
Northbound 5.7 A
7.5 A
Southbound 2.7 A
Eastbound 20.0 C
Westbound 18.8 B
* Results shown are the average of 5 model runs.
** Results shown are from all vehicles except transit vehicles.
H:\Projects\7939\SD\VISSIM\3_RB_Refined\11 MOEs\7939_Refined_RB_AM Arterial MOEs.xls 4/8/2013
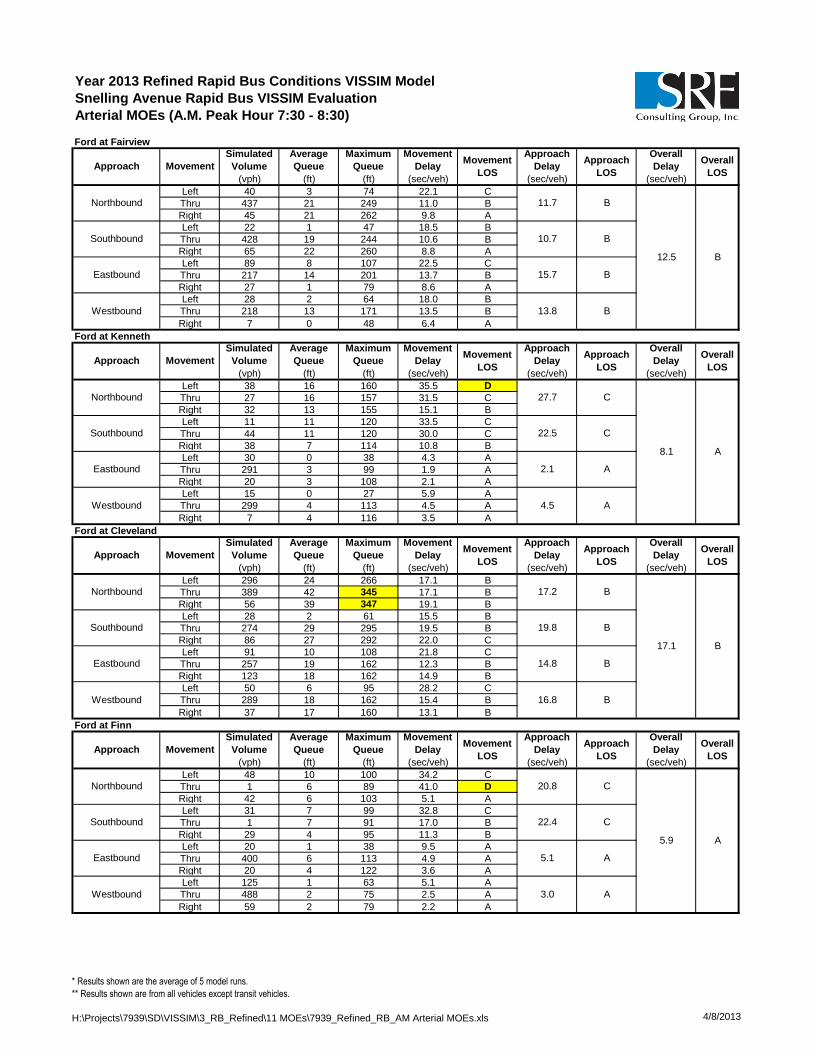
Year 2013 Refined Rapid Bus Conditions VISSIM Model
Snelling Avenue Rapid Bus VISSIM Evaluation
Arterial MOEs (A.M. Peak Hour 7:30 - 8:30)
Ford at Fairview
(vph) (ft) (ft) (sec/veh) (sec/veh) (sec/veh)
Left 40 3 74 22.1 C
Thru 437 21 249 11.0 B
Right 45 21 262 9.8 A
Left 22 1 47 18.5 B
Thru 428 19 244 10.6 B
Right 65 22 260 8.8 A
Left 89 8 107 22.5 C
Thru 217 14 201 13.7 B
Right 27 1 79 8.6 A
Left 28 2 64 18.0 B
Thru 218 13 171 13.5 B
Right 7 0 48 6.4 A
Ford at Kenneth
(vph) (ft) (ft) (sec/veh) (sec/veh) (sec/veh)
Left 38 16 160 35.5 D
Thru 27 16 157 31.5 C
Right 32 13 155 15.1 B
Left 11 11 120 33.5 C
Thru 44 11 120 30.0 C
Right 38 7 114 10.8 B
Left 30 0 38 4.3 A
Thru 291 3 99 1.9 A
Right 20 3 108 2.1 A
Left 15 0 27 5.9 A
Thru 299 4 113 4.5 A
Right 7 4 116 3.5 A
Ford at Cleveland
(vph) (ft) (ft) (sec/veh) (sec/veh) (sec/veh)
Left 296 24 266 17.1 B
Thru 389 42 345 17.1 B
Right 56 39 347 19.1 B
Left 28 2 61 15.5 B
Thru 274 29 295 19.5 B
Right 86 27 292 22.0 C
Left 91 10 108 21.8 C
Thru 257 19 162 12.3 B
Right 123 18 162 14.9 B
Left 50 6 95 28.2 C
Thru 289 18 162 15.4 B
Right 37 17 160 13.1 B
Ford at Finn
(vph) (ft) (ft) (sec/veh) (sec/veh) (sec/veh)
Left 48 10 100 34.2 C
Thru 1 6 89 41.0 D
Right 42 6 103 5.1 A
Left 31 7 99 32.8 C
Thru 1 7 91 17.0 B
Right 29 4 95 11.3 B
Left 20 1 38 9.5 A
Thru 400 6 113 4.9 A
Right 20 4 122 3.6 A
Left 125 1 63 5.1 A
Thru 488 2 75 2.5 A
Right 59 2 79 2.2 A
Approach Movement
Simulated
Volume
Average
Queue
Maximum
Queue
Movement
DelayMovement
LOS
Approach
DelayApproach
LOS
Overall
DelayOverall
LOS
Northbound 11.7 B
12.5 B
Southbound 10.7 B
Eastbound 15.7 B
Westbound 13.8 B
Approach Movement
Simulated
Volume
Average
Queue
Maximum
Queue
Movement
DelayMovement
LOS
Approach
DelayApproach
LOS
Overall
DelayOverall
LOS
Northbound 27.7 C
8.1 A
Southbound 22.5 C
Eastbound 2.1 A
Westbound 4.5 A
Approach Movement
Simulated
Volume
Average
Queue
Maximum
Queue
Movement
DelayMovement
LOS
Approach
DelayApproach
LOS
Overall
DelayOverall
LOS
Northbound 17.2 B
17.1 B
Southbound 19.8 B
Eastbound 14.8 B
Westbound 16.8 B
Approach Movement
Simulated
Volume
Average
Queue
Maximum
Queue
Movement
DelayMovement
LOS
Approach
DelayApproach
LOS
Overall
DelayOverall
LOS
Northbound 20.8 C
5.9 A
Southbound 22.4 C
Eastbound 5.1 A
Westbound 3.0 A
* Results shown are the average of 5 model runs.
** Results shown are from all vehicles except transit vehicles.
H:\Projects\7939\SD\VISSIM\3_RB_Refined\11 MOEs\7939_Refined_RB_AM Arterial MOEs.xls 4/8/2013
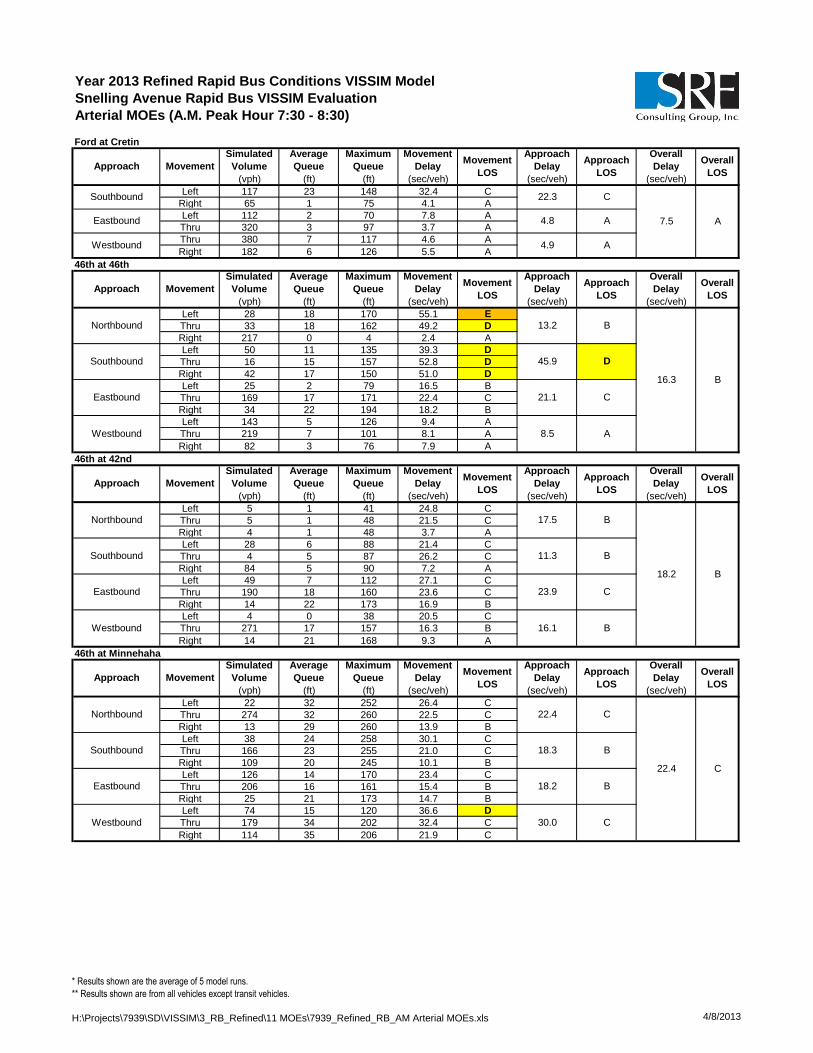
Year 2013 Refined Rapid Bus Conditions VISSIM Model
Snelling Avenue Rapid Bus VISSIM Evaluation
Arterial MOEs (A.M. Peak Hour 7:30 - 8:30)
Ford at Cretin
(vph) (ft) (ft) (sec/veh) (sec/veh) (sec/veh)
Left 117 23 148 32.4 C
Right 65 1 75 4.1 A
Left 112 2 70 7.8 A
Thru 320 3 97 3.7 A
Thru 380 7 117 4.6 A
Right 182 6 126 5.5 A
46th at 46th
(vph) (ft) (ft) (sec/veh) (sec/veh) (sec/veh)
Left 28 18 170 55.1 E
Thru 33 18 162 49.2 D
Right 217 0 4 2.4 A
Left 50 11 135 39.3 D
Thru 16 15 157 52.8 D
Right 42 17 150 51.0 D
Left 25 2 79 16.5 B
Thru 169 17 171 22.4 C
Right 34 22 194 18.2 B
Left 143 5 126 9.4 A
Thru 219 7 101 8.1 A
Right 82 3 76 7.9 A
46th at 42nd
(vph) (ft) (ft) (sec/veh) (sec/veh) (sec/veh)
Left 5 1 41 24.8 C
Thru 5 1 48 21.5 C
Right 4 1 48 3.7 A
Left 28 6 88 21.4 C
Thru 4 5 87 26.2 C
Right 84 5 90 7.2 A
Left 49 7 112 27.1 C
Thru 190 18 160 23.6 C
Right 14 22 173 16.9 B
Left 4 0 38 20.5 C
Thru 271 17 157 16.3 B
Right 14 21 168 9.3 A
46th at Minnehaha
(vph) (ft) (ft) (sec/veh) (sec/veh) (sec/veh)
Left 22 32 252 26.4 C
Thru 274 32 260 22.5 C
Right 13 29 260 13.9 B
Left 38 24 258 30.1 C
Thru 166 23 255 21.0 C
Right 109 20 245 10.1 B
Left 126 14 170 23.4 C
Thru 206 16 161 15.4 B
Right 25 21 173 14.7 B
Left 74 15 120 36.6 D
Thru 179 34 202 32.4 C
Right 114 35 206 21.9 C
Approach MovementOverall
LOS
Simulated
Volume
Average
Queue
Maximum
Queue
Movement
DelayMovement
LOS
7.5 A
Southbound 22.3 C
Approach
DelayApproach
LOS
Overall
Delay
Eastbound 4.8 A
Westbound 4.9 A
Approach Movement
Simulated
Volume
Average
Queue
Maximum
Queue
Movement
DelayMovement
LOS
Approach
DelayApproach
LOS
Overall
DelayOverall
LOS
Northbound 13.2 B
16.3 B
Southbound 45.9 D
Eastbound 21.1 C
Westbound 8.5 A
Approach Movement
Simulated
Volume
Average
Queue
Maximum
Queue
Movement
DelayMovement
LOS
Approach
DelayApproach
LOS
Overall
DelayOverall
LOS
Northbound 17.5 B
18.2 B
Southbound 11.3 B
Eastbound 23.9 C
Westbound 16.1 B
Approach Movement
Simulated
Volume
Average
Queue
Maximum
Queue
Movement
DelayMovement
LOS
Approach
DelayApproach
LOS
Overall
DelayOverall
LOS
Northbound 22.4 C
22.4 C
Southbound 18.3 B
Eastbound 18.2 B
Westbound 30.0 C
* Results shown are the average of 5 model runs.
** Results shown are from all vehicles except transit vehicles.
H:\Projects\7939\SD\VISSIM\3_RB_Refined\11 MOEs\7939_Refined_RB_AM Arterial MOEs.xls 4/8/2013

Year 2013 Refined Rapid Bus Conditions VISSIM Model
Snelling Avenue Rapid Bus VISSIM Evaluation
Arterial MOEs (A.M. Peak Hour 7:30 - 8:30)
46th at Hiawatha
(vph) (ft) (ft) (sec/veh) (sec/veh) (sec/veh)
Left 26 6 87 41.7 D
Thru 884 66 336 24.4 C
Right 183 0 0 2.3 A
Left 94 19 167 35.8 D
Thru 531 27 198 16.3 B
Right 14 0 0 1.3 A
Left 63 7 95 23.2 C
Thru 80 20 111 29.9 C
Right 44 20 110 33.4 C
Left 163 33 246 34.9 C
Thru 72 9 146 23.3 C
Right 71 1 68 7.9 A
46th at 36th
(vph) (ft) (ft) (sec/veh) (sec/veh) (sec/veh)
Left 5 0 30 8.1 A
Thru 0 - - - A
Right 5 0 33 4.5 A
Left 41 2 77 7.9 A
Thru 0 - - - A
Right 15 2 81 4.1 A
Left 15 0 38 5.8 A
Thru 142 2 96 5.8 A
Right 8 4 112 2.3 A
Left 1 2 107 0.6 A
Thru 86 1 93 3.8 A
Right 24 0 51 2.1 A
Approach Movement
Simulated
Volume
Average
Queue
Maximum
Queue
Movement
DelayMovement
LOS
B
Approach
DelayApproach
LOS
Overall
DelayOverall
LOS
C
C
Northbound 21.1 C
21.7 C
Southbound 18.8
Movement
Eastbound 28.5
25.9Westbound
Simulated
Volume
Average
Queue
Maximum
Queue
Movement
DelayMovement
LOS
Approach
Delay
A
Southbound 6.9 A
Eastbound
Approach
LOS
Overall
DelayOverall
LOSApproach
5.6 A
Westbound 3.4 A
Northbound 6.3 A
5.1
* Results shown are the average of 5 model runs.
** Results shown are from all vehicles except transit vehicles.
H:\Projects\7939\SD\VISSIM\3_RB_Refined\11 MOEs\7939_Refined_RB_AM Arterial MOEs.xls 4/8/2013

Year 2013 Refined Rapid Bus Conditions VISSIM Model
Snelling Avenue Rapid Bus VISSIM Evaluation
Arterial MOEs (P.M. Peak Hour 4:45 - 5:45)
Co B2 at Snelling W Ramps
(vph) (ft) (ft) (sec/veh) (sec/veh) (sec/veh)
Left 74 36 218 34.2 C
Thru 152 36 218 35.1 D
Right 142 0 0 4.1 A
Left 6 27 199 43.6 D
Thru 105 27 209 44.9 D
Right 148 1 76 4.5 A
Left 405 112 558 45.4 D
Thru 746 56 363 24.2 C
Right 77 0 0 10.0 B
Left 351 112 468 48.7 D
Thru 438 34 198 23.4 C
Right 24 0 0 6.2 A
Co B2 at Snelling E Ramps
(vph) (ft) (ft) (sec/veh) (sec/veh) (sec/veh)
Left 21 47 583 42.1 D
Right 496 29 517 25.7 C
Left 248 5 197 9.0 A
Thru 647 6 215 4.6 A
Thru 318 7 126 6.5 A
Right 38 0 0 2.6 A
Snelling at Co B
(vph) (ft) (ft) (sec/veh) (sec/veh) (sec/veh)
Left 153 69 323 71.9 E
Thru 1,558 35 264 8.9 A
Right 212 0 0 3.3 A
Left 426 213 667 96.0 F
Thru 1,245 212 673 31.9 C
Right 295 89 624 16.7 B
Left 178 1,049 1,579 335.4 F
Thru 500 1,065 1,585 310.7 F
Right 151 844 1,575 258.0 F
Left 169 84 366 80.8 F
Thru 259 68 322 69.1 E
Right 300 30 279 18.5 B
Snelling at HarMar
(vph) (ft) (ft) (sec/veh) (sec/veh) (sec/veh)
Left 51 22 159 72.4 E
Thru 1,609 17 133 4.9 A
Right 267 0 0 3.3 A
Left 127 47 287 61.3 E
Thru 1,339 26 298 7.0 A
Right 98 1 63 3.6 A
Left 116 57 193 79.6 E
Thru 50 57 194 83.2 F
Right 79 60 197 11.3 B
Left 100 56 221 81.0 F
Thru 58 56 219 77.0 E
Right 196 49 245 11.6 B
58.3 E
Westbound 41.9 D
Northbound 6.5 A
14.4 B
Southbound 11.2 B
Eastbound
Approach
LOS
Overall
DelayOverall
LOS
Simulated
Volume
Average
Queue
Maximum
Queue
Movement
DelayMovement
LOS
Approach
DelayApproach Movement
Eastbound 306.4 F
Westbound 50.9 D
Northbound 13.3 B
73.9 E
Southbound 43.5 D
Approach
DelayApproach
LOS
Overall
DelayOverall
LOS
Simulated
Volume
Average
Queue
Maximum
Queue
Movement
DelayMovement
LOS
5.8 A
Westbound 6.1 A
Approach Movement
11.9 B
Southbound 26.4 C
Eastbound
Approach
LOS
Overall
DelayOverall
LOS
Simulated
Volume
Average
Queue
Maximum
Queue
Movement
DelayMovement
LOS
Approach
Delay
Movement
Approach Movement
Simulated
Volume
Average
Queue
Maximum
Queue
Movement
DelayMovement
LOS
Approach
Delay
C
Southbound 21.7 C
Eastbound
Approach
LOS
Overall
DelayOverall
LOSApproach
30.3 C
Westbound 33.8 C
Northbound 22.9 C
29.5
* Results shown are the average of 20 model runs.
** Results shown are from all vehicles except transit vehicles.
H:\Projects\7939\SD\VISSIM\3_RB_Refined\11 MOEs\7939_Refined_RB_PM Arterial MOEs.xls 4/9/2013

Year 2013 Refined Rapid Bus Conditions VISSIM Model
Snelling Avenue Rapid Bus VISSIM Evaluation
Arterial MOEs (P.M. Peak Hour 4:45 - 5:45)
Snelling at Roselawn
(vph) (ft) (ft) (sec/veh) (sec/veh) (sec/veh)
Left 15 12 70 124.6 F
Thru 1,832 11 136 3.6 A
Right 27 0 16 3.5 A
Left 96 184 553 222.9 F
Thru 1,311 47 402 10.4 B
Right 101 0 52 5.3 A
Left 51 223 694 128.3 F
Thru 193 216 692 116.9 F
Right 70 4 100 45.4 D
Left 21 99 419 139.1 F
Thru 94 95 404 121.1 F
Right 45 3 79 31.0 C
Snelling at Larpenteur
(vph) (ft) (ft) (sec/veh) (sec/veh) (sec/veh)
Left 222 124 497 96.6 F
Thru 1,696 426 1,325 51.6 D
Right 185 6 133 31.4 C
Left 175 380 1,280 217.9 F
Thru 1,053 300 1,280 52.4 D
Right 173 27 226 27.9 C
Left 27 8 73 77.3 E
Thru 700 319 883 92.6 F
Right 197 344 912 96.6 F
Left 153 73 308 79.8 E
Thru 352 87 390 50.0 D
Right 151 101 414 42.0 D
Snelling at Hoyt
(vph) (ft) (ft) (sec/veh) (sec/veh) (sec/veh)
Left 7 0 8 18.7 B
Thru 2,058 71 706 12.0 B
Right 124 0 2 7.8 A
Left 45 2 70 30.6 C
Thru 1,347 4 104 2.5 A
Right 9 0 0 2.4 A
Left 23 11 87 82.4 F
Thru 6 3 58 76.1 E
Right 1 1 68 12.1 B
Left 41 21 128 85.6 F
Thru 10 7 85 78.1 E
Right 29 8 103 27.7 C
Snelling at Midway
(vph) (ft) (ft) (sec/veh) (sec/veh) (sec/veh)
Left 53 1 58 16.9 B
Thru 2,090 79 846 11.7 B
Right 67 0 51 9.9 A
Left 75 1 79 18.3 B
Thru 1,266 9 205 4.4 A
Right 49 14 240 5.3 A
Left 46 24 131 87.9 F
Thru 30 14 96 80.7 F
Right 39 2 66 9.0 A
Left 19 17 113 87.8 F
Thru 15 17 110 79.8 E
Right 51 2 66 13.5 B
59.1 E
Westbound 41.9 D
Northbound 11.8 B
11.5 B
Southbound 5.2 A
Eastbound
Approach
LOS
Overall
DelayOverall
LOS
Simulated
Volume
Average
Queue
Maximum
Queue
Movement
DelayMovement
LOS
Approach
DelayApproach Movement
Eastbound 78.1 E
Westbound 63.6 E
Northbound 11.8 B
10.3 B
Southbound 3.4 A
Approach
DelayApproach
LOS
Overall
DelayOverall
LOS
Simulated
Volume
Average
Queue
Maximum
Queue
Movement
DelayMovement
LOS
93.0 F
Westbound 55.1 E
Approach Movement
Northbound 54.6 D
65.9 E
Southbound 70.0 E
Eastbound
Approach
LOS
Overall
DelayOverall
LOS
Simulated
Volume
Average
Queue
Maximum
Queue
Movement
DelayMovement
LOS
Approach
DelayApproach Movement
Eastbound 102.8 F
Westbound 98.2 F
Northbound 4.6 A
23.9 C
Southbound 23.6 C
Approach
DelayApproach
LOS
Overall
DelayOverall
LOS
Simulated
Volume
Average
Queue
Maximum
Queue
Movement
DelayMovement
LOSApproach Movement
* Results shown are the average of 20 model runs.
** Results shown are from all vehicles except transit vehicles.
H:\Projects\7939\SD\VISSIM\3_RB_Refined\11 MOEs\7939_Refined_RB_PM Arterial MOEs.xls 4/9/2013

Year 2013 Refined Rapid Bus Conditions VISSIM Model
Snelling Avenue Rapid Bus VISSIM Evaluation
Arterial MOEs (P.M. Peak Hour 4:45 - 5:45)
Snelling at Hewitt
(vph) (ft) (ft) (sec/veh) (sec/veh) (sec/veh)
Left 23 0 36 19.1 B
Thru 1,570 84 746 16.6 B
Right 19 93 762 16.4 B
Left 72 4 90 25.2 C
Thru 1,350 61 585 15.2 B
Right 102 1 78 8.1 A
Left 91 29 203 38.1 D
Thru 11 30 207 36.9 D
Right 73 38 222 23.7 C
Left 30 14 148 34.4 C
Thru 20 15 149 33.3 C
Right 80 20 164 18.4 B
Snelling at Minnehaha
(vph) (ft) (ft) (sec/veh) (sec/veh) (sec/veh)
Left 39 2 71 28.5 C
Thru 1,398 113 868 22.4 C
Right 50 113 868 24.3 C
Left 103 8 139 31.3 C
Thru 1,248 83 706 20.9 C
Right 106 84 711 23.5 C
Left 134 56 350 43.3 D
Thru 176 56 346 33.5 C
Right 76 56 346 32.6 C
Left 50 30 222 36.6 D
Thru 131 30 222 27.7 C
Right 79 30 222 26.2 C
Snelling at Thomas
(vph) (ft) (ft) (sec/veh) (sec/veh) (sec/veh)
Left 45 2 66 23.3 C
Thru 1,346 124 890 23.7 C
Right 72 126 895 23.2 C
Left 61 4 94 37.8 D
Thru 1,275 148 817 32.2 C
Right 32 0 50 18.5 B
Left 110 51 322 35.4 D
Thru 86 51 322 34.7 C
Right 79 62 340 30.5 C
Left 40 21 197 34.5 C
Thru 55 21 200 29.5 C
Right 44 28 212 20.0 B
Snelling at University
(vph) (ft) (ft) (sec/veh) (sec/veh) (sec/veh)
Left 110 75 338 65.6 E
Thru 1,061 135 339 27.6 C
Right 178 137 343 13.0 B
Left 196 77 706 88.3 F
Thru 1,114 423 1,234 80.4 F
Right 61 1 70 56.6 E
Left 187 64 367 64.7 E
Thru 811 437 1,228 116.3 F
Right 173 439 1,227 131.7 F
Left 166 121 482 107.5 F
Thru 520 235 802 79.0 E
Right 213 240 805 86.3 F
110.3 F
Westbound 86.0 F
Northbound 28.8 C
74.3 E
Southbound 80.5 F
Eastbound
Approach
LOS
Overall
DelayOverall
LOS
Simulated
Volume
Average
Queue
Maximum
Queue
Movement
DelayMovement
LOS
Approach
DelayApproach Movement
Eastbound 33.8 C
Westbound 27.9 C
Northbound 23.7 C
28.3 C
Southbound 32.2 C
Approach
DelayApproach
LOS
Overall
DelayOverall
LOS
Simulated
Volume
Average
Queue
Maximum
Queue
Movement
DelayMovement
LOS
36.7 D
Westbound 29.0 C
Approach Movement
Northbound 22.6 C
24.3 C
Southbound 21.8 C
Eastbound
Approach
LOS
Overall
DelayOverall
LOS
Simulated
Volume
Average
Queue
Maximum
Queue
Movement
DelayMovement
LOS
Approach
DelayApproach Movement
Eastbound 32.0 C
Westbound 24.4 C
Northbound 16.7 B
17.1 B
Southbound 15.2 B
Approach
DelayApproach
LOS
Overall
DelayOverall
LOS
Simulated
Volume
Average
Queue
Maximum
Queue
Movement
DelayMovement
LOSApproach Movement
* Results shown are the average of 20 model runs.
** Results shown are from all vehicles except transit vehicles.
H:\Projects\7939\SD\VISSIM\3_RB_Refined\11 MOEs\7939_Refined_RB_PM Arterial MOEs.xls 4/9/2013
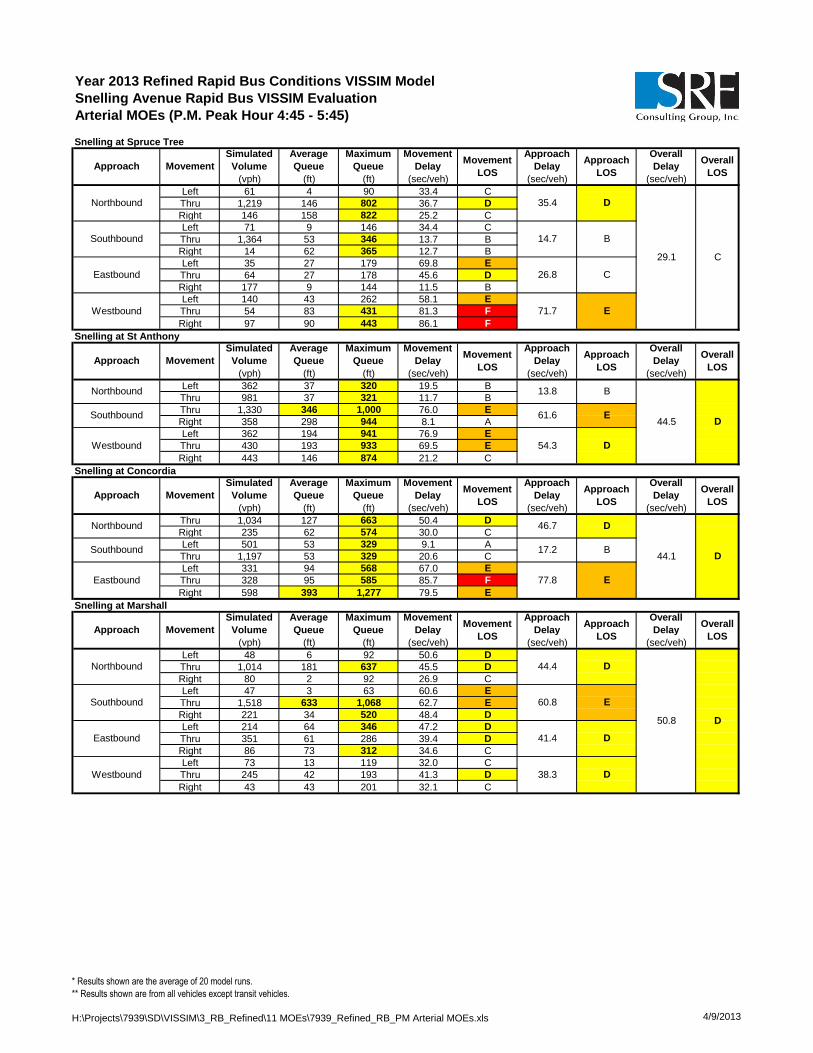
Year 2013 Refined Rapid Bus Conditions VISSIM Model
Snelling Avenue Rapid Bus VISSIM Evaluation
Arterial MOEs (P.M. Peak Hour 4:45 - 5:45)
Snelling at Spruce Tree
(vph) (ft) (ft) (sec/veh) (sec/veh) (sec/veh)
Left 61 4 90 33.4 C
Thru 1,219 146 802 36.7 D
Right 146 158 822 25.2 C
Left 71 9 146 34.4 C
Thru 1,364 53 346 13.7 B
Right 14 62 365 12.7 B
Left 35 27 179 69.8 E
Thru 64 27 178 45.6 D
Right 177 9 144 11.5 B
Left 140 43 262 58.1 E
Thru 54 83 431 81.3 F
Right 97 90 443 86.1 F
Snelling at St Anthony
(vph) (ft) (ft) (sec/veh) (sec/veh) (sec/veh)
Left 362 37 320 19.5 B
Thru 981 37 321 11.7 B
Thru 1,330 346 1,000 76.0 E
Right 358 298 944 8.1 A
Left 362 194 941 76.9 E
Thru 430 193 933 69.5 E
Right 443 146 874 21.2 C
Snelling at Concordia
(vph) (ft) (ft) (sec/veh) (sec/veh) (sec/veh)
Thru 1,034 127 663 50.4 D
Right 235 62 574 30.0 C
Left 501 53 329 9.1 A
Thru 1,197 53 329 20.6 C
Left 331 94 568 67.0 E
Thru 328 95 585 85.7 F
Right 598 393 1,277 79.5 E
Snelling at Marshall
(vph) (ft) (ft) (sec/veh) (sec/veh) (sec/veh)
Left 48 6 92 50.6 D
Thru 1,014 181 637 45.5 D
Right 80 2 92 26.9 C
Left 47 3 63 60.6 E
Thru 1,518 633 1,068 62.7 E
Right 221 34 520 48.4 D
Left 214 64 346 47.2 D
Thru 351 61 286 39.4 D
Right 86 73 312 34.6 C
Left 73 13 119 32.0 C
Thru 245 42 193 41.3 D
Right 43 43 201 32.1 C
41.4 D
Westbound 38.3 D
Northbound 44.4 D
50.8 D
Southbound 60.8 E
Eastbound
Approach
LOS
Overall
DelayOverall
LOS
Simulated
Volume
Average
Queue
Maximum
Queue
Movement
DelayMovement
LOS
Approach
DelayApproach Movement
Eastbound 77.8 E
Northbound 46.7 D
44.1 DSouthbound 17.2 B
Approach
DelayApproach
LOS
Overall
DelayOverall
LOS
Simulated
Volume
Average
Queue
Maximum
Queue
Movement
DelayMovement
LOS
Westbound 54.3 D
Approach Movement
Northbound 13.8 B
44.5 DSouthbound 61.6 E
Approach
LOS
Overall
DelayOverall
LOS
Simulated
Volume
Average
Queue
Maximum
Queue
Movement
DelayMovement
LOS
Approach
DelayApproach Movement
Eastbound 26.8 C
Westbound 71.7 E
Northbound 35.4 D
29.1 C
Southbound 14.7 B
Approach
DelayApproach
LOS
Overall
DelayOverall
LOS
Simulated
Volume
Average
Queue
Maximum
Queue
Movement
DelayMovement
LOSApproach Movement
* Results shown are the average of 20 model runs.
** Results shown are from all vehicles except transit vehicles.
H:\Projects\7939\SD\VISSIM\3_RB_Refined\11 MOEs\7939_Refined_RB_PM Arterial MOEs.xls 4/9/2013

Year 2013 Refined Rapid Bus Conditions VISSIM Model
Snelling Avenue Rapid Bus VISSIM Evaluation
Arterial MOEs (P.M. Peak Hour 4:45 - 5:45)
Snelling at Selby
(vph) (ft) (ft) (sec/veh) (sec/veh) (sec/veh)
Left 26 18 165 136.4 F
Thru 866 278 868 74.5 E
Right 54 290 882 75.0 E
Left 385 232 685 81.3 F
Thru 1,099 42 648 12.6 B
Right 183 44 654 10.8 B
Left 53 11 137 51.5 D
Thru 284 64 405 32.0 C
Right 38 67 413 25.3 C
Left 43 8 88 44.0 D
Thru 205 75 473 34.1 C
Right 209 79 481 26.3 C
Snelling at Summit
(vph) (ft) (ft) (sec/veh) (sec/veh) (sec/veh)
Left 33 3 56 33.0 C
Thru 720 55 302 20.0 B
Right 70 55 301 24.3 C
Left 92 22 197 35.3 D
Thru 975 101 653 27.5 C
Right 125 102 655 27.5 C
Left 75 37 419 64.5 E
Thru 418 75 503 28.6 C
Right 18 85 520 26.1 C
Left 60 8 212 41.9 D
Thru 423 124 597 32.7 C
Right 166 137 615 29.1 C
Snelling at Grand
(vph) (ft) (ft) (sec/veh) (sec/veh) (sec/veh)
Left 71 8 141 29.4 C
Thru 596 79 414 31.6 C
Right 137 82 423 29.3 C
Left 185 26 242 28.0 C
Thru 738 34 470 12.4 B
Right 130 35 485 11.3 B
Left 76 13 252 40.5 D
Thru 422 118 596 35.3 D
Right 65 127 613 30.9 C
Left 95 20 357 45.2 D
Thru 346 127 593 39.0 D
Right 148 137 609 33.1 C
Snelling at St Clair
(vph) (ft) (ft) (sec/veh) (sec/veh) (sec/veh)
Left 55 12 107 46.6 D
Thru 565 15 107 8.6 A
Right 85 1 54 4.5 A
Left 104 16 215 33.1 C
Thru 666 43 289 16.8 B
Right 116 50 300 16.9 B
Left 75 47 386 34.7 C
Thru 310 47 388 24.0 C
Right 43 56 408 15.5 B
Left 76 54 450 33.2 C
Thru 317 54 448 24.7 C
Right 151 63 466 16.9 B
25.1 C
Westbound 23.7 C
Northbound 11.1 B
18.7 B
Southbound 18.7 B
Eastbound
Approach
LOS
Overall
DelayOverall
LOS
Simulated
Volume
Average
Queue
Maximum
Queue
Movement
DelayMovement
LOS
Approach
DelayApproach Movement
Eastbound 35.5 D
Westbound 38.5 D
Northbound 31.0 C
27.7 C
Southbound 15.0 B
Approach
DelayApproach
LOS
Overall
DelayOverall
LOS
Simulated
Volume
Average
Queue
Maximum
Queue
Movement
DelayMovement
LOS
33.8 C
Westbound 32.6 C
Approach Movement
Northbound 20.9 C
28.1 C
Southbound 28.1 C
Eastbound
Approach
LOS
Overall
DelayOverall
LOS
Simulated
Volume
Average
Queue
Maximum
Queue
Movement
DelayMovement
LOS
Approach
DelayApproach Movement
Eastbound 34.0 C
Westbound 31.4 C
Northbound 76.2 E
42.5 D
Southbound 28.3 C
Approach
DelayApproach
LOS
Overall
DelayOverall
LOS
Simulated
Volume
Average
Queue
Maximum
Queue
Movement
DelayMovement
LOSApproach Movement
* Results shown are the average of 20 model runs.
** Results shown are from all vehicles except transit vehicles.
H:\Projects\7939\SD\VISSIM\3_RB_Refined\11 MOEs\7939_Refined_RB_PM Arterial MOEs.xls 4/9/2013
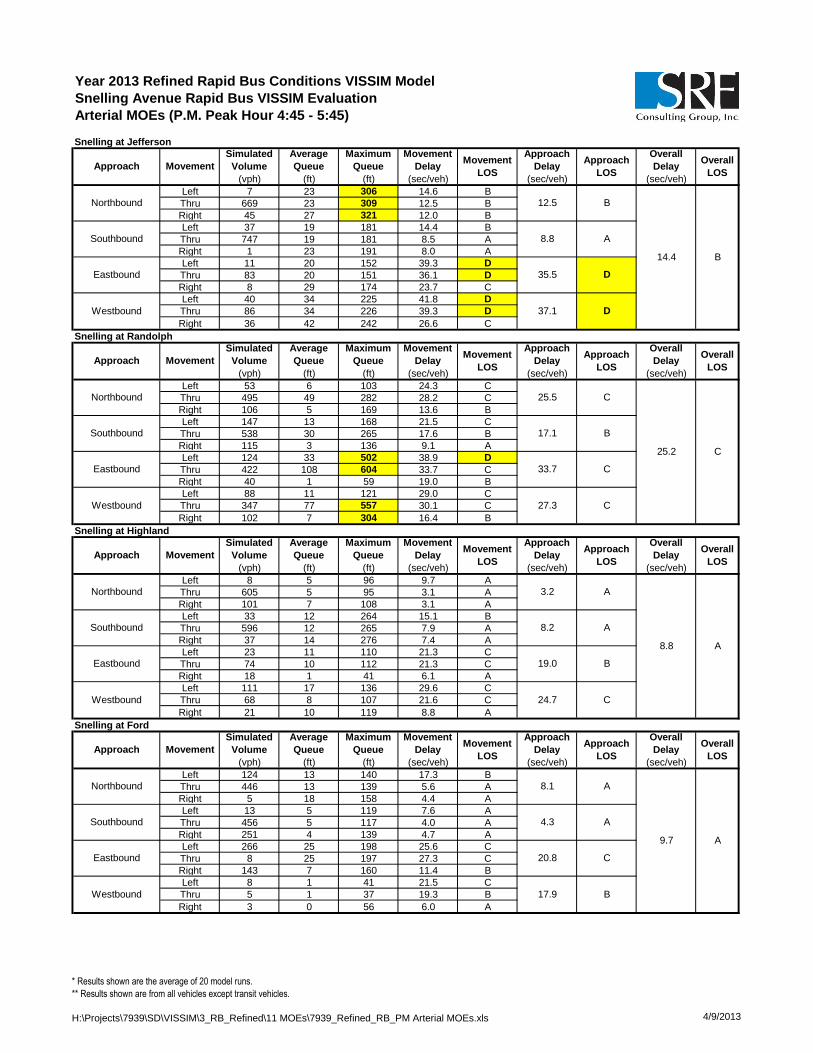
Year 2013 Refined Rapid Bus Conditions VISSIM Model
Snelling Avenue Rapid Bus VISSIM Evaluation
Arterial MOEs (P.M. Peak Hour 4:45 - 5:45)
Snelling at Jefferson
(vph) (ft) (ft) (sec/veh) (sec/veh) (sec/veh)
Left 7 23 306 14.6 B
Thru 669 23 309 12.5 B
Right 45 27 321 12.0 B
Left 37 19 181 14.4 B
Thru 747 19 181 8.5 A
Right 1 23 191 8.0 A
Left 11 20 152 39.3 D
Thru 83 20 151 36.1 D
Right 8 29 174 23.7 C
Left 40 34 225 41.8 D
Thru 86 34 226 39.3 D
Right 36 42 242 26.6 C
Snelling at Randolph
(vph) (ft) (ft) (sec/veh) (sec/veh) (sec/veh)
Left 53 6 103 24.3 C
Thru 495 49 282 28.2 C
Right 106 5 169 13.6 B
Left 147 13 168 21.5 C
Thru 538 30 265 17.6 B
Right 115 3 136 9.1 A
Left 124 33 502 38.9 D
Thru 422 108 604 33.7 C
Right 40 1 59 19.0 B
Left 88 11 121 29.0 C
Thru 347 77 557 30.1 C
Right 102 7 304 16.4 B
Snelling at Highland
(vph) (ft) (ft) (sec/veh) (sec/veh) (sec/veh)
Left 8 5 96 9.7 A
Thru 605 5 95 3.1 A
Right 101 7 108 3.1 A
Left 33 12 264 15.1 B
Thru 596 12 265 7.9 A
Right 37 14 276 7.4 A
Left 23 11 110 21.3 C
Thru 74 10 112 21.3 C
Right 18 1 41 6.1 A
Left 111 17 136 29.6 C
Thru 68 8 107 21.6 C
Right 21 10 119 8.8 A
Snelling at Ford
(vph) (ft) (ft) (sec/veh) (sec/veh) (sec/veh)
Left 124 13 140 17.3 B
Thru 446 13 139 5.6 A
Right 5 18 158 4.4 A
Left 13 5 119 7.6 A
Thru 456 5 117 4.0 A
Right 251 4 139 4.7 A
Left 266 25 198 25.6 C
Thru 8 25 197 27.3 C
Right 143 7 160 11.4 B
Left 8 1 41 21.5 C
Thru 5 1 37 19.3 B
Right 3 0 56 6.0 A
20.8 C
Westbound 17.9 B
Northbound 8.1 A
9.7 A
Southbound 4.3 A
Eastbound
Approach
LOS
Overall
DelayOverall
LOS
Simulated
Volume
Average
Queue
Maximum
Queue
Movement
DelayMovement
LOS
Approach
DelayApproach Movement
Eastbound 19.0 B
Westbound 24.7 C
Northbound 3.2 A
8.8 A
Southbound 8.2 A
Approach
DelayApproach
LOS
Overall
DelayOverall
LOS
Simulated
Volume
Average
Queue
Maximum
Queue
Movement
DelayMovement
LOS
33.7 C
Westbound 27.3 C
Approach Movement
Northbound 25.5 C
25.2 C
Southbound 17.1 B
Eastbound
Approach
LOS
Overall
DelayOverall
LOS
Simulated
Volume
Average
Queue
Maximum
Queue
Movement
DelayMovement
LOS
Approach
DelayApproach Movement
Eastbound 35.5 D
Westbound 37.1 D
Northbound 12.5 B
14.4 B
Southbound 8.8 A
Approach
DelayApproach
LOS
Overall
DelayOverall
LOS
Simulated
Volume
Average
Queue
Maximum
Queue
Movement
DelayMovement
LOSApproach Movement
* Results shown are the average of 20 model runs.
** Results shown are from all vehicles except transit vehicles.
H:\Projects\7939\SD\VISSIM\3_RB_Refined\11 MOEs\7939_Refined_RB_PM Arterial MOEs.xls 4/9/2013

Year 2013 Refined Rapid Bus Conditions VISSIM Model
Snelling Avenue Rapid Bus VISSIM Evaluation
Arterial MOEs (P.M. Peak Hour 4:45 - 5:45)
Ford at Fairview
(vph) (ft) (ft) (sec/veh) (sec/veh) (sec/veh)
Left 71 13 134 42.3 D
Thru 497 31 367 13.0 B
Right 26 33 387 11.6 B
Left 26 1 44 22.1 C
Thru 463 44 465 16.5 B
Right 182 50 480 14.8 B
Left 144 44 244 56.3 E
Thru 366 32 374 18.9 B
Right 66 2 88 11.8 B
Left 15 1 43 23.5 C
Thru 350 31 263 17.7 B
Right 16 0 60 8.8 A
Ford at Kenneth
(vph) (ft) (ft) (sec/veh) (sec/veh) (sec/veh)
Left 55 30 229 51.8 D
Thru 22 29 228 47.8 D
Right 37 24 226 26.8 C
Left 29 18 147 45.8 D
Thru 25 18 149 46.5 D
Right 44 15 148 19.5 B
Left 46 1 52 8.1 A
Thru 504 6 127 2.5 A
Right 49 7 138 2.6 A
Left 14 0 30 9.8 A
Thru 568 8 158 5.9 A
Right 21 8 164 4.8 A
Ford at Cleveland
(vph) (ft) (ft) (sec/veh) (sec/veh) (sec/veh)
Left 247 46 311 33.5 C
Thru 352 63 392 26.9 C
Right 37 60 390 27.3 C
Left 79 10 241 35.9 D
Thru 404 140 772 41.9 D
Right 170 140 772 46.4 D
Left 159 32 343 35.5 D
Thru 487 79 466 23.6 C
Right 268 79 467 36.1 D
Left 84 15 133 34.5 C
Thru 496 56 315 26.7 C
Right 83 56 316 28.9 C
Ford at Finn
(vph) (ft) (ft) (sec/veh) (sec/veh) (sec/veh)
Left 200 61 297 49.8 D
Thru 10 60 301 30.8 C
Right 176 63 303 10.3 B
Left 115 39 244 41.7 D
Thru 16 39 249 36.7 D
Right 66 39 250 26.1 C
Left 53 4 132 17.7 B
Thru 636 33 317 14.7 B
Right 44 34 324 11.3 B
Left 194 12 169 14.7 B
Thru 661 14 176 7.2 A
Right 52 15 180 6.0 A
14.7 B
Westbound 8.7 A
Northbound 31.3 C
17.0 B
Southbound 36.1 D
Eastbound
Approach
LOS
Overall
DelayOverall
LOS
Simulated
Volume
Average
Queue
Maximum
Queue
Movement
DelayMovement
LOS
Approach
DelayApproach Movement
Eastbound 29.4 C
Westbound 28.0 C
Northbound 29.5 C
32.0 C
Southbound 42.3 D
Approach
DelayApproach
LOS
Overall
DelayOverall
LOS
Simulated
Volume
Average
Queue
Maximum
Queue
Movement
DelayMovement
LOS
3.0 A
Westbound 6.0 A
Approach Movement
Northbound 42.8 D
9.6 A
Southbound 34.3 C
Eastbound
Approach
LOS
Overall
DelayOverall
LOS
Simulated
Volume
Average
Queue
Maximum
Queue
Movement
DelayMovement
LOS
Approach
DelayApproach Movement
Eastbound 27.5 C
Westbound 17.6 B
Northbound 16.5 B
19.5 B
Southbound 16.3 B
Approach
DelayApproach
LOS
Overall
DelayOverall
LOS
Simulated
Volume
Average
Queue
Maximum
Queue
Movement
DelayMovement
LOSApproach Movement
* Results shown are the average of 20 model runs.
** Results shown are from all vehicles except transit vehicles.
H:\Projects\7939\SD\VISSIM\3_RB_Refined\11 MOEs\7939_Refined_RB_PM Arterial MOEs.xls 4/9/2013

Year 2013 Refined Rapid Bus Conditions VISSIM Model
Snelling Avenue Rapid Bus VISSIM Evaluation
Arterial MOEs (P.M. Peak Hour 4:45 - 5:45)
Ford at Cretin
(vph) (ft) (ft) (sec/veh) (sec/veh) (sec/veh)
Left 172 49 261 47.1 D
Right 111 3 65 5.7 A
Left 111 4 116 13.6 B
Thru 559 7 150 5.1 A
Thru 783 28 249 9.0 A
Right 145 28 251 15.4 B
46th at 46th
(vph) (ft) (ft) (sec/veh) (sec/veh) (sec/veh)
Left 14 16 145 53.4 D
Thru 38 16 140 52.5 D
Right 252 0 6 2.8 A
Left 81 21 169 42.5 D
Thru 31 12 110 52.7 D
Right 10 10 110 70.4 E
Left 26 1 41 10.4 B
Thru 339 20 164 11.8 B
Right 51 27 181 18.7 B
Left 300 17 242 16.7 B
Thru 474 12 201 9.6 A
Right 119 5 145 9.8 A
46th at 42nd
(vph) (ft) (ft) (sec/veh) (sec/veh) (sec/veh)
Left 5 2 39 29.0 C
Thru 6 1 39 20.7 C
Right 4 1 43 3.9 A
Left 37 9 127 26.6 C
Thru 5 8 126 27.0 C
Right 58 7 127 10.6 B
Left 85 13 148 30.1 C
Thru 374 28 202 20.1 C
Right 5 33 215 17.7 B
Left 3 0 16 9.6 A
Thru 460 9 174 6.9 A
Right 34 12 184 5.9 A
46th at Minnehaha
(vph) (ft) (ft) (sec/veh) (sec/veh) (sec/veh)
Left 42 60 406 39.8 D
Thru 272 59 403 33.5 C
Right 66 57 403 21.8 C
Left 121 315 1,091 92.0 F
Thru 313 305 1,082 78.8 E
Right 122 304 1,081 69.7 E
Left 173 23 198 27.6 C
Thru 277 19 197 14.7 B
Right 15 24 208 14.1 B
Left 81 17 168 39.8 D
Thru 353 56 313 35.0 D
Right 91 57 315 29.7 C
19.5 B
Westbound 34.9 C
Northbound 32.2 C
43.6 D
Southbound 79.7 E
Eastbound
Approach
LOS
Overall
DelayOverall
LOS
Simulated
Volume
Average
Queue
Maximum
Queue
Movement
DelayMovement
LOS
Approach
DelayApproach Movement
Eastbound 21.9 C
Westbound 6.8 A
Northbound 19.3 B
14.5 B
Southbound 17.4 B
Approach
DelayApproach
LOS
Overall
DelayOverall
LOS
Simulated
Volume
Average
Queue
Maximum
Queue
Movement
DelayMovement
LOS
12.5 B
Westbound 12.0 B
Approach Movement
Northbound 11.4 B
14.5 B
Southbound 47.4 D
Eastbound
Approach
LOS
Overall
DelayOverall
LOS
Simulated
Volume
Average
Queue
Maximum
Queue
Movement
DelayMovement
LOS
Approach
DelayApproach Movement
Eastbound 6.5 A
Westbound 10.0 A
11.9 B
Southbound 30.9 C
Approach
DelayApproach
LOS
Overall
DelayOverall
LOS
Simulated
Volume
Average
Queue
Maximum
Queue
Movement
DelayMovement
LOSApproach Movement
* Results shown are the average of 20 model runs.
** Results shown are from all vehicles except transit vehicles.
H:\Projects\7939\SD\VISSIM\3_RB_Refined\11 MOEs\7939_Refined_RB_PM Arterial MOEs.xls 4/9/2013
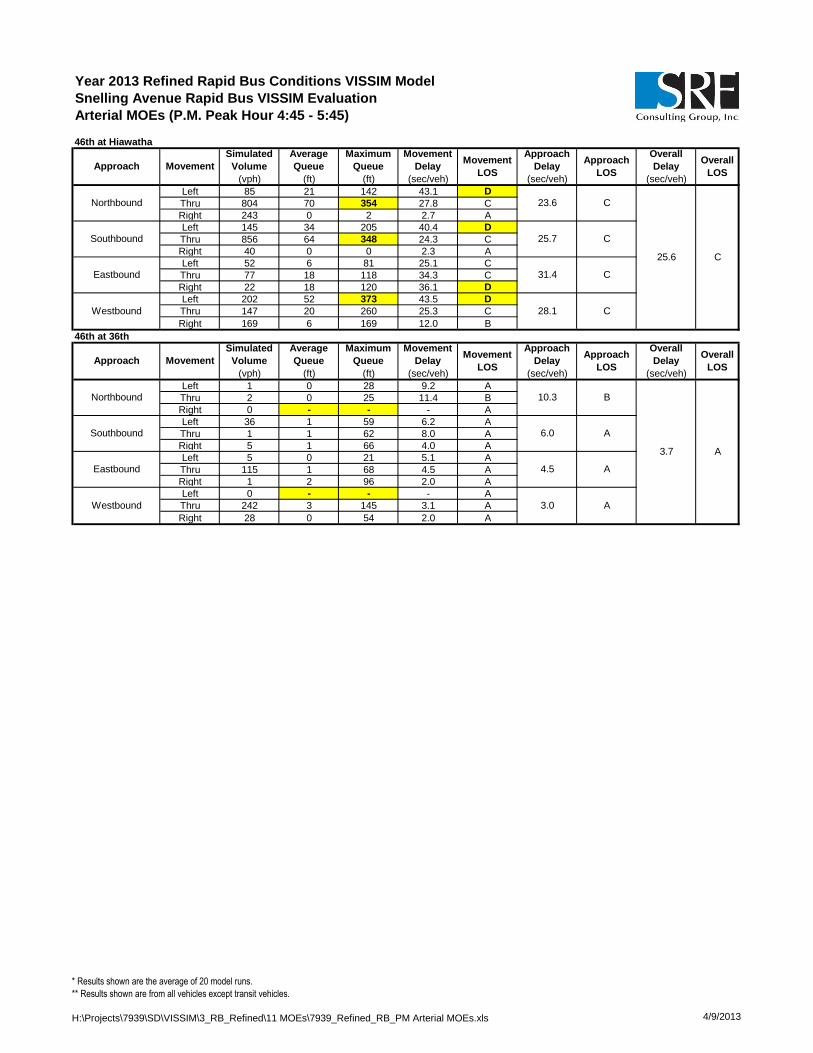
Year 2013 Refined Rapid Bus Conditions VISSIM Model
Snelling Avenue Rapid Bus VISSIM Evaluation
Arterial MOEs (P.M. Peak Hour 4:45 - 5:45)
46th at Hiawatha
(vph) (ft) (ft) (sec/veh) (sec/veh) (sec/veh)
Left 85 21 142 43.1 D
Thru 804 70 354 27.8 C
Right 243 0 2 2.7 A
Left 145 34 205 40.4 D
Thru 856 64 348 24.3 C
Right 40 0 0 2.3 A
Left 52 6 81 25.1 C
Thru 77 18 118 34.3 C
Right 22 18 120 36.1 D
Left 202 52 373 43.5 D
Thru 147 20 260 25.3 C
Right 169 6 169 12.0 B
46th at 36th
(vph) (ft) (ft) (sec/veh) (sec/veh) (sec/veh)
Left 1 0 28 9.2 A
Thru 2 0 25 11.4 B
Right 0 - - - A
Left 36 1 59 6.2 A
Thru 1 1 62 8.0 A
Right 5 1 66 4.0 A
Left 5 0 21 5.1 A
Thru 115 1 68 4.5 A
Right 1 2 96 2.0 A
Left 0 - - - A
Thru 242 3 145 3.1 A
Right 28 0 54 2.0 A
4.5 A
Westbound 3.0 A
Northbound 10.3 B
3.7 A
Southbound 6.0 A
Eastbound
Approach
LOS
Overall
DelayOverall
LOSApproach
Simulated
Volume
Average
Queue
Maximum
Queue
Movement
DelayMovement
LOS
Approach
DelayMovement
Eastbound 31.4
28.1Westbound C
Northbound 23.6 C
25.6 C
Southbound 25.7 C
Approach
DelayApproach
LOS
Overall
DelayOverall
LOS
C
Simulated
Volume
Average
Queue
Maximum
Queue
Movement
DelayMovement
LOSApproach Movement
* Results shown are the average of 20 model runs.
** Results shown are from all vehicles except transit vehicles.
H:\Projects\7939\SD\VISSIM\3_RB_Refined\11 MOEs\7939_Refined_RB_PM Arterial MOEs.xls 4/9/2013

Year 2013 Scenario 3A Refined Rapid Bus Conditions VISSIM Model
Snelling Avenue Rapid Bus VISSIM Evaluation
Arterial MOEs (A.M. Peak Hour 7:30 - 8:30)
Co B2 at Snelling W Ramps
(vph) (ft) (ft) (sec/veh) (sec/veh) (sec/veh)
Left 11 8 93 29.9 C
Thru 21 8 91 32.9 C
Right 6 0 0 1.6 A
Left 20 8 79 37.3 D
Thru 33 8 79 34.9 C
Right 37 0 0 2.5 A
Left 22 4 56 36.8 D
Thru 101 2 51 7.0 A
Right 14 0 0 3.6 A
Left 118 33 222 42.6 D
Thru 446 9 140 6.4 A
Right 78 0 0 1.3 A
Co B2 at Snelling E Ramps
(vph) (ft) (ft) (sec/veh) (sec/veh) (sec/veh)
Left 50 10 126 31.9 C
Right 148 0 57 9.1 A
Left 13 0 34 4.1 A
Thru 114 0 30 1.3 A
Thru 492 2 75 2.3 A
Right 30 0 0 1.4 A
Snelling at Co B
(vph) (ft) (ft) (sec/veh) (sec/veh) (sec/veh)
Left 134 74 304 86.9 F
Thru 881 11 230 5.5 A
Right 83 0 0 2.1 A
Left 153 90 684 87.7 F
Thru 1,539 144 772 25.2 C
Right 333 62 701 18.3 B
Left 103 59 359 82.4 F
Thru 237 84 358 85.2 F
Right 46 2 88 14.7 B
Left 137 56 285 67.3 E
Thru 270 82 312 81.5 F
Right 128 6 132 12.5 B
Snelling at HarMar
(vph) (ft) (ft) (sec/veh) (sec/veh) (sec/veh)
Left 56 29 164 83.0 F
Thru 954 17 247 9.4 A
Right 57 0 0 1.6 A
Left 58 25 168 68.9 E
Thru 1,598 6 126 2.4 A
Right 69 0 44 2.5 A
Left 64 37 147 81.3 F
Thru 31 37 147 82.5 F
Right 112 40 151 13.9 B
Left 39 26 130 88.4 F
Thru 18 26 130 85.9 F
Right 78 7 116 8.1 A
11.4 B
Westbound 12.5 B
Northbound 27.0 C
13.9 B
Southbound 22.2 C
Eastbound
Approach
LOS
Overall
DelayOverall
LOSApproach
Simulated
Volume
Average
Queue
Maximum
Queue
Movement
DelayMovement
LOS
Approach
DelayMovement
Approach Movement
Simulated
Volume
Average
Queue
Maximum
Queue
Movement
DelayMovement
LOS
Approach
Delay
5.1 A
Southbound 14.8 B
Eastbound
Approach
LOS
Overall
DelayOverall
LOS
1.6 A
Westbound 2.3 A
Approach Movement
Simulated
Volume
Average
Queue
Maximum
Queue
Movement
DelayMovement
LOS
Approach
DelayApproach
LOS
Overall
DelayOverall
LOS
Northbound 15.2 B
33.9 C
Southbound 28.8 C
Eastbound 76.1 E
Westbound 61.3 E
Approach Movement
Simulated
Volume
Average
Queue
Maximum
Queue
Movement
DelayMovement
LOS
Approach
DelayApproach
LOS
Overall
DelayOverall
LOS
Northbound 12.8 B
11.7 B
Southbound 4.6 A
Eastbound 45.1 D
Westbound 41.7 D
* Results shown are the average of 5 model runs.
** Results shown are from all vehicles except transit vehicles.
H:\Projects\7939\SD\VISSIM\3A_RB_Refined\11 MOEs\7939_3A_Refined_RB_AM Arterial MOEs.xls 5/3/2013
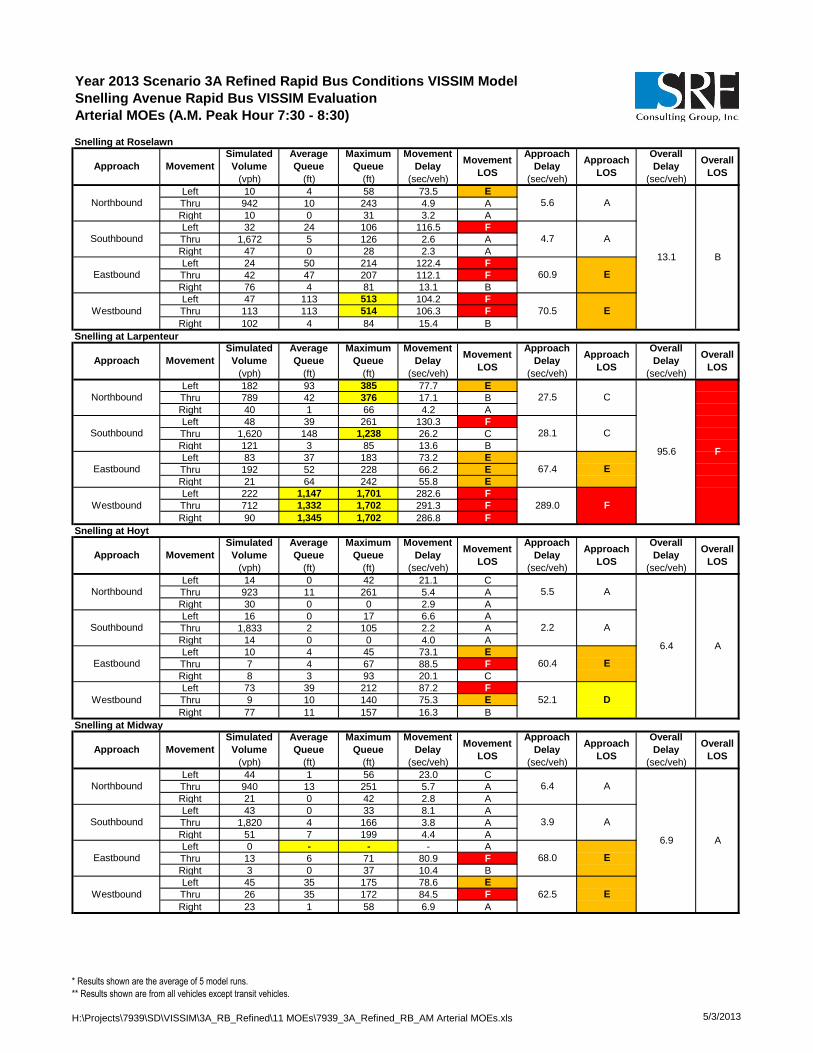
Year 2013 Scenario 3A Refined Rapid Bus Conditions VISSIM Model
Snelling Avenue Rapid Bus VISSIM Evaluation
Arterial MOEs (A.M. Peak Hour 7:30 - 8:30)
Snelling at Roselawn
(vph) (ft) (ft) (sec/veh) (sec/veh) (sec/veh)
Left 10 4 58 73.5 E
Thru 942 10 243 4.9 A
Right 10 0 31 3.2 A
Left 32 24 106 116.5 F
Thru 1,672 5 126 2.6 A
Right 47 0 28 2.3 A
Left 24 50 214 122.4 F
Thru 42 47 207 112.1 F
Right 76 4 81 13.1 B
Left 47 113 513 104.2 F
Thru 113 113 514 106.3 F
Right 102 4 84 15.4 B
Snelling at Larpenteur
(vph) (ft) (ft) (sec/veh) (sec/veh) (sec/veh)
Left 182 93 385 77.7 E
Thru 789 42 376 17.1 B
Right 40 1 66 4.2 A
Left 48 39 261 130.3 F
Thru 1,620 148 1,238 26.2 C
Right 121 3 85 13.6 B
Left 83 37 183 73.2 E
Thru 192 52 228 66.2 E
Right 21 64 242 55.8 E
Left 222 1,147 1,701 282.6 F
Thru 712 1,332 1,702 291.3 F
Right 90 1,345 1,702 286.8 F
Snelling at Hoyt
(vph) (ft) (ft) (sec/veh) (sec/veh) (sec/veh)
Left 14 0 42 21.1 C
Thru 923 11 261 5.4 A
Right 30 0 0 2.9 A
Left 16 0 17 6.6 A
Thru 1,833 2 105 2.2 A
Right 14 0 0 4.0 A
Left 10 4 45 73.1 E
Thru 7 4 67 88.5 F
Right 8 3 93 20.1 C
Left 73 39 212 87.2 F
Thru 9 10 140 75.3 E
Right 77 11 157 16.3 B
Snelling at Midway
(vph) (ft) (ft) (sec/veh) (sec/veh) (sec/veh)
Left 44 1 56 23.0 C
Thru 940 13 251 5.7 A
Right 21 0 42 2.8 A
Left 43 0 33 8.1 A
Thru 1,820 4 166 3.8 A
Right 51 7 199 4.4 A
Left 0 - - - A
Thru 13 6 71 80.9 F
Right 3 0 37 10.4 B
Left 45 35 175 78.6 E
Thru 26 35 172 84.5 F
Right 23 1 58 6.9 A
Approach Movement
Simulated
Volume
Average
Queue
Maximum
Queue
Movement
DelayMovement
LOS
Approach
DelayApproach
LOS
Overall
DelayOverall
LOS
Northbound 5.6 A
13.1 B
Southbound 4.7 A
Eastbound 60.9 E
Westbound 70.5 E
Approach Movement
Simulated
Volume
Average
Queue
Maximum
Queue
Movement
DelayMovement
LOS
Approach
DelayApproach
LOS
Overall
DelayOverall
LOS
Northbound 27.5 C
95.6 F
Southbound 28.1 C
Eastbound 67.4 E
Westbound 289.0 F
Approach Movement
Simulated
Volume
Average
Queue
Maximum
Queue
Movement
DelayMovement
LOS
Approach
DelayApproach
LOS
Overall
DelayOverall
LOS
Northbound 5.5 A
6.4 A
Southbound 2.2 A
Eastbound 60.4 E
Westbound 52.1 D
Approach Movement
Simulated
Volume
Average
Queue
Maximum
Queue
Movement
DelayMovement
LOS
Approach
DelayApproach
LOS
Overall
DelayOverall
LOS
Northbound 6.4 A
6.9 A
Southbound 3.9 A
Eastbound 68.0 E
Westbound 62.5 E
* Results shown are the average of 5 model runs.
** Results shown are from all vehicles except transit vehicles.
H:\Projects\7939\SD\VISSIM\3A_RB_Refined\11 MOEs\7939_3A_Refined_RB_AM Arterial MOEs.xls 5/3/2013
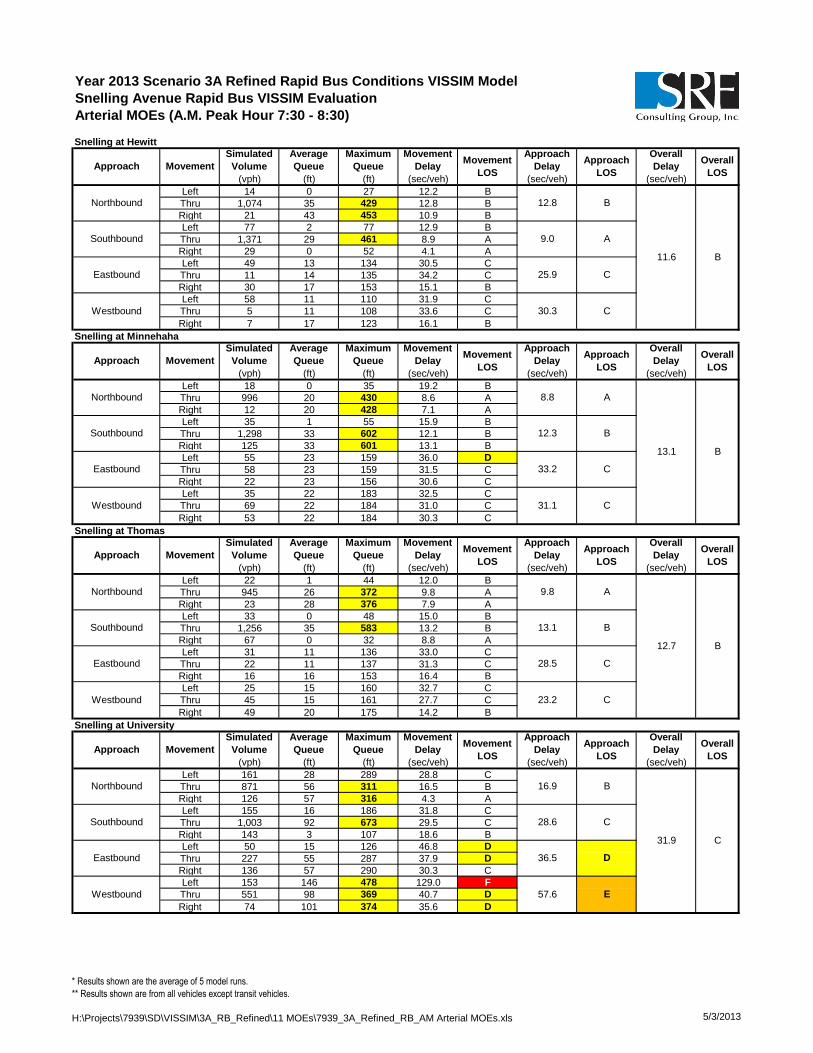
Year 2013 Scenario 3A Refined Rapid Bus Conditions VISSIM Model
Snelling Avenue Rapid Bus VISSIM Evaluation
Arterial MOEs (A.M. Peak Hour 7:30 - 8:30)
Snelling at Hewitt
(vph) (ft) (ft) (sec/veh) (sec/veh) (sec/veh)
Left 14 0 27 12.2 B
Thru 1,074 35 429 12.8 B
Right 21 43 453 10.9 B
Left 77 2 77 12.9 B
Thru 1,371 29 461 8.9 A
Right 29 0 52 4.1 A
Left 49 13 134 30.5 C
Thru 11 14 135 34.2 C
Right 30 17 153 15.1 B
Left 58 11 110 31.9 C
Thru 5 11 108 33.6 C
Right 7 17 123 16.1 B
Snelling at Minnehaha
(vph) (ft) (ft) (sec/veh) (sec/veh) (sec/veh)
Left 18 0 35 19.2 B
Thru 996 20 430 8.6 A
Right 12 20 428 7.1 A
Left 35 1 55 15.9 B
Thru 1,298 33 602 12.1 B
Right 125 33 601 13.1 B
Left 55 23 159 36.0 D
Thru 58 23 159 31.5 C
Right 22 23 156 30.6 C
Left 35 22 183 32.5 C
Thru 69 22 184 31.0 C
Right 53 22 184 30.3 C
Snelling at Thomas
(vph) (ft) (ft) (sec/veh) (sec/veh) (sec/veh)
Left 22 1 44 12.0 B
Thru 945 26 372 9.8 A
Right 23 28 376 7.9 A
Left 33 0 48 15.0 B
Thru 1,256 35 583 13.2 B
Right 67 0 32 8.8 A
Left 31 11 136 33.0 C
Thru 22 11 137 31.3 C
Right 16 16 153 16.4 B
Left 25 15 160 32.7 C
Thru 45 15 161 27.7 C
Right 49 20 175 14.2 B
Snelling at University
(vph) (ft) (ft) (sec/veh) (sec/veh) (sec/veh)
Left 161 28 289 28.8 C
Thru 871 56 311 16.5 B
Right 126 57 316 4.3 A
Left 155 16 186 31.8 C
Thru 1,003 92 673 29.5 C
Right 143 3 107 18.6 B
Left 50 15 126 46.8 D
Thru 227 55 287 37.9 D
Right 136 57 290 30.3 C
Left 153 146 478 129.0 F
Thru 551 98 369 40.7 D
Right 74 101 374 35.6 D
Approach Movement
Simulated
Volume
Average
Queue
Maximum
Queue
Movement
DelayMovement
LOS
Approach
DelayApproach
LOS
Overall
DelayOverall
LOS
Northbound 12.8 B
11.6 B
Southbound 9.0 A
Eastbound 25.9 C
Westbound 30.3 C
Approach Movement
Simulated
Volume
Average
Queue
Maximum
Queue
Movement
DelayMovement
LOS
Approach
DelayApproach
LOS
Overall
DelayOverall
LOS
Northbound 8.8 A
13.1 B
Southbound 12.3 B
Eastbound 33.2 C
Westbound 31.1 C
Approach Movement
Simulated
Volume
Average
Queue
Maximum
Queue
Movement
DelayMovement
LOS
Approach
DelayApproach
LOS
Overall
DelayOverall
LOS
Northbound 9.8 A
12.7 B
Southbound 13.1 B
Eastbound 28.5 C
Westbound 23.2 C
Approach Movement
Simulated
Volume
Average
Queue
Maximum
Queue
Movement
DelayMovement
LOS
Approach
DelayApproach
LOS
Overall
DelayOverall
LOS
Northbound 16.9 B
31.9 C
Southbound 28.6 C
Eastbound 36.5 D
Westbound 57.6 E
* Results shown are the average of 5 model runs.
** Results shown are from all vehicles except transit vehicles.
H:\Projects\7939\SD\VISSIM\3A_RB_Refined\11 MOEs\7939_3A_Refined_RB_AM Arterial MOEs.xls 5/3/2013
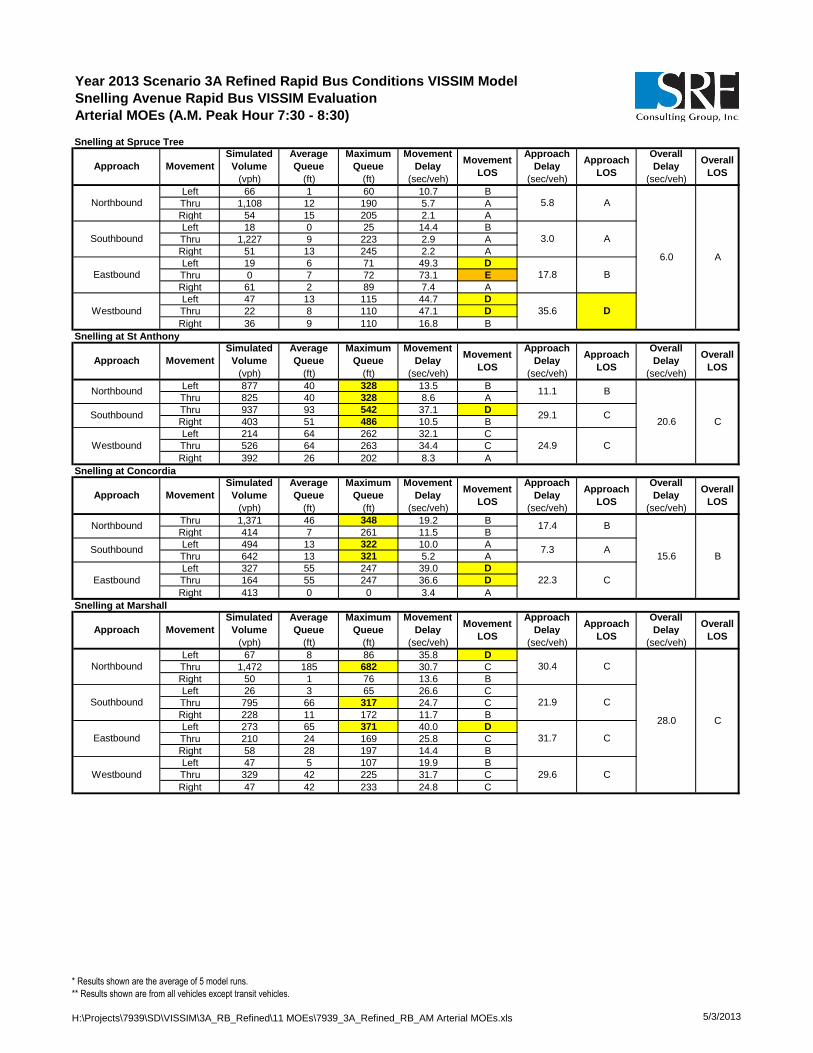
Year 2013 Scenario 3A Refined Rapid Bus Conditions VISSIM Model
Snelling Avenue Rapid Bus VISSIM Evaluation
Arterial MOEs (A.M. Peak Hour 7:30 - 8:30)
Snelling at Spruce Tree
(vph) (ft) (ft) (sec/veh) (sec/veh) (sec/veh)
Left 66 1 60 10.7 B
Thru 1,108 12 190 5.7 A
Right 54 15 205 2.1 A
Left 18 0 25 14.4 B
Thru 1,227 9 223 2.9 A
Right 51 13 245 2.2 A
Left 19 6 71 49.3 D
Thru 0 7 72 73.1 E
Right 61 2 89 7.4 A
Left 47 13 115 44.7 D
Thru 22 8 110 47.1 D
Right 36 9 110 16.8 B
Snelling at St Anthony
(vph) (ft) (ft) (sec/veh) (sec/veh) (sec/veh)
Left 877 40 328 13.5 B
Thru 825 40 328 8.6 A
Thru 937 93 542 37.1 D
Right 403 51 486 10.5 B
Left 214 64 262 32.1 C
Thru 526 64 263 34.4 C
Right 392 26 202 8.3 A
Snelling at Concordia
(vph) (ft) (ft) (sec/veh) (sec/veh) (sec/veh)
Thru 1,371 46 348 19.2 B
Right 414 7 261 11.5 B
Left 494 13 322 10.0 A
Thru 642 13 321 5.2 A
Left 327 55 247 39.0 D
Thru 164 55 247 36.6 D
Right 413 0 0 3.4 A
Snelling at Marshall
(vph) (ft) (ft) (sec/veh) (sec/veh) (sec/veh)
Left 67 8 86 35.8 D
Thru 1,472 185 682 30.7 C
Right 50 1 76 13.6 B
Left 26 3 65 26.6 C
Thru 795 66 317 24.7 C
Right 228 11 172 11.7 B
Left 273 65 371 40.0 D
Thru 210 24 169 25.8 C
Right 58 28 197 14.4 B
Left 47 5 107 19.9 B
Thru 329 42 225 31.7 C
Right 47 42 233 24.8 C
Approach Movement
Simulated
Volume
Average
Queue
Maximum
Queue
Movement
DelayMovement
LOS
Approach
DelayApproach
LOS
Overall
DelayOverall
LOS
Northbound 5.8 A
6.0 A
Southbound 3.0 A
Eastbound 17.8 B
Westbound 35.6 D
Approach
DelayApproach Movement
Overall
DelayOverall
LOS
Simulated
Volume
Average
Queue
Maximum
Queue
Movement
DelayMovement
LOS
Northbound 11.1 B
20.6 CSouthbound 29.1 C
Approach
LOS
Westbound 24.9 C
Approach MovementOverall
LOS
Simulated
Volume
Average
Queue
Maximum
Queue
Movement
DelayMovement
LOS
Southbound 7.3 A
Approach
DelayApproach
LOS
Overall
Delay
Eastbound 22.3 C
Northbound 17.4 B
15.6 B
Approach Movement
Simulated
Volume
Average
Queue
Maximum
Queue
Movement
DelayMovement
LOS
Approach
DelayApproach
LOS
Overall
DelayOverall
LOS
Northbound 30.4 C
28.0 C
Southbound 21.9 C
Eastbound 31.7 C
Westbound 29.6 C
* Results shown are the average of 5 model runs.
** Results shown are from all vehicles except transit vehicles.
H:\Projects\7939\SD\VISSIM\3A_RB_Refined\11 MOEs\7939_3A_Refined_RB_AM Arterial MOEs.xls 5/3/2013

Year 2013 Scenario 3A Refined Rapid Bus Conditions VISSIM Model
Snelling Avenue Rapid Bus VISSIM Evaluation
Arterial MOEs (A.M. Peak Hour 7:30 - 8:30)
Snelling at Selby
(vph) (ft) (ft) (sec/veh) (sec/veh) (sec/veh)
Left 12 2 39 73.3 E
Thru 1,075 351 1,050 74.8 E
Right 22 353 1,044 66.5 E
Left 229 100 436 66.5 E
Thru 646 33 237 14.6 B
Right 28 36 242 11.7 B
Left 67 85 369 161.6 F
Thru 147 35 368 42.7 D
Right 13 35 371 31.6 C
Left 31 3 45 32.4 C
Thru 174 126 525 37.6 D
Right 452 129 531 29.5 C
Snelling at Summit
(vph) (ft) (ft) (sec/veh) (sec/veh) (sec/veh)
Left 41 1 38 9.8 A
Thru 917 15 155 5.0 A
Right 32 15 153 6.4 A
Left 40 13 130 28.5 C
Thru 550 46 267 21.2 C
Right 101 47 271 21.7 C
Left 49 14 195 54.8 D
Thru 178 28 262 25.1 C
Right 13 38 286 19.6 B
Left 64 8 219 39.5 D
Thru 357 138 597 41.3 D
Right 146 152 616 35.2 D
Snelling at Grand
(vph) (ft) (ft) (sec/veh) (sec/veh) (sec/veh)
Left 44 1 62 11.6 B
Thru 764 34 256 14.2 B
Right 55 35 267 13.0 B
Left 98 14 126 29.9 C
Thru 422 33 197 17.4 B
Right 102 35 213 12.3 B
Left 46 6 89 26.8 C
Thru 184 34 282 27.7 C
Right 23 36 299 21.2 C
Left 82 13 320 39.3 D
Thru 298 153 607 46.6 D
Right 176 158 623 39.5 D
Snelling at St Clair
(vph) (ft) (ft) (sec/veh) (sec/veh) (sec/veh)
Left 39 1 39 12.0 B
Thru 646 13 127 6.7 A
Right 43 0 53 4.4 A
Left 46 2 75 13.3 B
Thru 450 11 164 7.2 A
Right 30 15 177 6.5 A
Left 47 34 281 33.2 C
Thru 217 34 278 25.4 C
Right 39 42 297 12.9 B
Left 68 62 429 37.2 D
Thru 256 62 434 29.9 C
Right 179 73 454 20.3 C
Approach Movement
Simulated
Volume
Average
Queue
Maximum
Queue
Movement
DelayMovement
LOS
Approach
DelayApproach
LOS
Overall
DelayOverall
LOS
Northbound 74.6 E
50.5 D
Southbound 27.7 C
Eastbound 77.3 E
Westbound 31.8 C
Approach Movement
Simulated
Volume
Average
Queue
Maximum
Queue
Movement
DelayMovement
LOS
Approach
DelayApproach
LOS
Overall
DelayOverall
LOS
Northbound 5.3 A
20.1 C
Southbound 21.7 C
Eastbound 30.9 C
Westbound 39.5 D
Approach Movement
Simulated
Volume
Average
Queue
Maximum
Queue
Movement
DelayMovement
LOS
Approach
DelayApproach
LOS
Overall
DelayOverall
LOS
Northbound 14.0 B
23.8 C
Southbound 18.5 B
Eastbound 26.9 C
Westbound 43.3 D
Approach Movement
Simulated
Volume
Average
Queue
Maximum
Queue
Movement
DelayMovement
LOS
Approach
DelayApproach
LOS
Overall
DelayOverall
LOS
Northbound 6.8 A
14.8 B
Southbound 7.7 A
Eastbound 25.0 C
Westbound 27.5 C
* Results shown are the average of 5 model runs.
** Results shown are from all vehicles except transit vehicles.
H:\Projects\7939\SD\VISSIM\3A_RB_Refined\11 MOEs\7939_3A_Refined_RB_AM Arterial MOEs.xls 5/3/2013
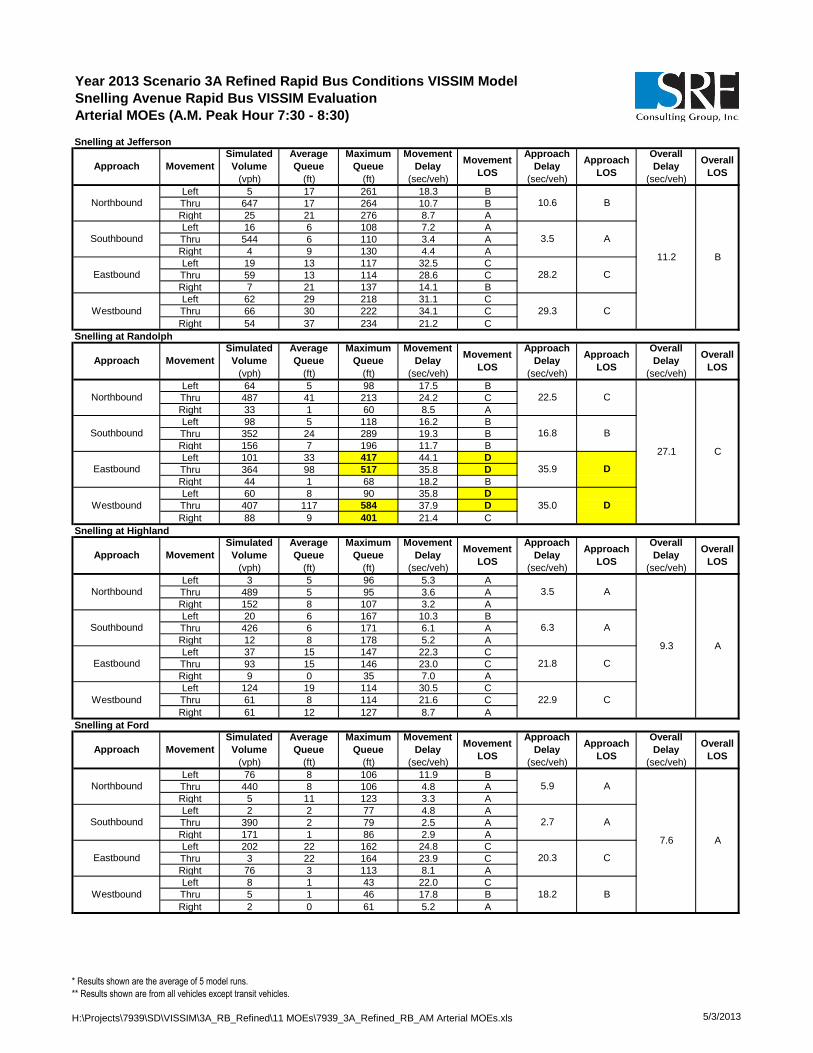
Year 2013 Scenario 3A Refined Rapid Bus Conditions VISSIM Model
Snelling Avenue Rapid Bus VISSIM Evaluation
Arterial MOEs (A.M. Peak Hour 7:30 - 8:30)
Snelling at Jefferson
(vph) (ft) (ft) (sec/veh) (sec/veh) (sec/veh)
Left 5 17 261 18.3 B
Thru 647 17 264 10.7 B
Right 25 21 276 8.7 A
Left 16 6 108 7.2 A
Thru 544 6 110 3.4 A
Right 4 9 130 4.4 A
Left 19 13 117 32.5 C
Thru 59 13 114 28.6 C
Right 7 21 137 14.1 B
Left 62 29 218 31.1 C
Thru 66 30 222 34.1 C
Right 54 37 234 21.2 C
Snelling at Randolph
(vph) (ft) (ft) (sec/veh) (sec/veh) (sec/veh)
Left 64 5 98 17.5 B
Thru 487 41 213 24.2 C
Right 33 1 60 8.5 A
Left 98 5 118 16.2 B
Thru 352 24 289 19.3 B
Right 156 7 196 11.7 B
Left 101 33 417 44.1 D
Thru 364 98 517 35.8 D
Right 44 1 68 18.2 B
Left 60 8 90 35.8 D
Thru 407 117 584 37.9 D
Right 88 9 401 21.4 C
Snelling at Highland
(vph) (ft) (ft) (sec/veh) (sec/veh) (sec/veh)
Left 3 5 96 5.3 A
Thru 489 5 95 3.6 A
Right 152 8 107 3.2 A
Left 20 6 167 10.3 B
Thru 426 6 171 6.1 A
Right 12 8 178 5.2 A
Left 37 15 147 22.3 C
Thru 93 15 146 23.0 C
Right 9 0 35 7.0 A
Left 124 19 114 30.5 C
Thru 61 8 114 21.6 C
Right 61 12 127 8.7 A
Snelling at Ford
(vph) (ft) (ft) (sec/veh) (sec/veh) (sec/veh)
Left 76 8 106 11.9 B
Thru 440 8 106 4.8 A
Right 5 11 123 3.3 A
Left 2 2 77 4.8 A
Thru 390 2 79 2.5 A
Right 171 1 86 2.9 A
Left 202 22 162 24.8 C
Thru 3 22 164 23.9 C
Right 76 3 113 8.1 A
Left 8 1 43 22.0 C
Thru 5 1 46 17.8 B
Right 2 0 61 5.2 A
Approach Movement
Simulated
Volume
Average
Queue
Maximum
Queue
Movement
DelayMovement
LOS
Approach
DelayApproach
LOS
Overall
DelayOverall
LOS
Northbound 10.6 B
11.2 B
Southbound 3.5 A
Eastbound 28.2 C
Westbound 29.3 C
Approach Movement
Simulated
Volume
Average
Queue
Maximum
Queue
Movement
DelayMovement
LOS
Approach
DelayApproach
LOS
Overall
DelayOverall
LOS
Northbound 22.5 C
27.1 C
Southbound 16.8 B
Eastbound 35.9 D
Westbound 35.0 D
Approach Movement
Simulated
Volume
Average
Queue
Maximum
Queue
Movement
DelayMovement
LOS
Approach
DelayApproach
LOS
Overall
DelayOverall
LOS
Northbound 3.5 A
9.3 A
Southbound 6.3 A
Eastbound 21.8 C
Westbound 22.9 C
Approach Movement
Simulated
Volume
Average
Queue
Maximum
Queue
Movement
DelayMovement
LOS
Approach
DelayApproach
LOS
Overall
DelayOverall
LOS
Northbound 5.9 A
7.6 A
Southbound 2.7 A
Eastbound 20.3 C
Westbound 18.2 B
* Results shown are the average of 5 model runs.
** Results shown are from all vehicles except transit vehicles.
H:\Projects\7939\SD\VISSIM\3A_RB_Refined\11 MOEs\7939_3A_Refined_RB_AM Arterial MOEs.xls 5/3/2013

Year 2013 Scenario 3A Refined Rapid Bus Conditions VISSIM Model
Snelling Avenue Rapid Bus VISSIM Evaluation
Arterial MOEs (A.M. Peak Hour 7:30 - 8:30)
Ford at Fairview
(vph) (ft) (ft) (sec/veh) (sec/veh) (sec/veh)
Left 40 3 72 21.7 C
Thru 435 21 246 11.4 B
Right 45 22 261 9.6 A
Left 22 1 47 19.9 B
Thru 428 19 283 10.7 B
Right 66 23 297 9.1 A
Left 89 8 99 22.7 C
Thru 217 13 172 13.3 B
Right 27 1 79 7.8 A
Left 28 2 63 17.6 B
Thru 217 13 196 13.7 B
Right 7 0 47 4.5 A
Ford at Kenneth
(vph) (ft) (ft) (sec/veh) (sec/veh) (sec/veh)
Left 38 16 160 35.5 D
Thru 27 16 157 31.4 C
Right 32 13 155 15.1 B
Left 11 11 120 33.5 C
Thru 44 11 120 30.0 C
Right 38 7 114 11.0 B
Left 30 0 41 4.4 A
Thru 291 3 90 1.9 A
Right 20 3 100 2.0 A
Left 15 0 19 5.1 A
Thru 302 4 97 4.2 A
Right 7 4 101 3.6 A
Ford at Cleveland
(vph) (ft) (ft) (sec/veh) (sec/veh) (sec/veh)
Left 296 24 266 17.2 B
Thru 389 42 345 17.1 B
Right 56 39 347 19.1 B
Left 28 2 61 15.5 B
Thru 274 29 295 19.5 B
Right 86 27 292 22.0 C
Left 92 9 107 21.7 C
Thru 257 19 153 12.4 B
Right 123 17 153 14.6 B
Left 50 6 91 27.3 C
Thru 288 19 147 15.0 B
Right 36 17 144 14.1 B
Ford at Finn
(vph) (ft) (ft) (sec/veh) (sec/veh) (sec/veh)
Left 48 10 100 34.1 C
Thru 1 6 89 41.0 D
Right 42 6 103 5.1 A
Left 31 7 99 32.8 C
Thru 1 7 91 17.0 B
Right 29 4 95 11.1 B
Left 20 1 44 8.9 A
Thru 400 6 121 5.0 A
Right 20 4 130 3.9 A
Left 125 1 66 4.9 A
Thru 487 2 93 2.6 A
Right 59 2 95 2.1 A
Approach Movement
Simulated
Volume
Average
Queue
Maximum
Queue
Movement
DelayMovement
LOS
Approach
DelayApproach
LOS
Overall
DelayOverall
LOS
Northbound 12.0 B
12.6 B
Southbound 10.8 B
Eastbound 15.4 B
Westbound 13.9 B
Approach Movement
Simulated
Volume
Average
Queue
Maximum
Queue
Movement
DelayMovement
LOS
Approach
DelayApproach
LOS
Overall
DelayOverall
LOS
Northbound 27.7 C
8.1 A
Southbound 22.6 C
Eastbound 2.1 A
Westbound 4.3 A
Approach Movement
Simulated
Volume
Average
Queue
Maximum
Queue
Movement
DelayMovement
LOS
Approach
DelayApproach
LOS
Overall
DelayOverall
LOS
Northbound 17.3 B
17.0 B
Southbound 19.8 B
Eastbound 14.7 B
Westbound 16.5 B
Approach Movement
Simulated
Volume
Average
Queue
Maximum
Queue
Movement
DelayMovement
LOS
Approach
DelayApproach
LOS
Overall
DelayOverall
LOS
Northbound 20.8 C
6.0 A
Southbound 22.3 C
Eastbound 5.1 A
Westbound 3.0 A
* Results shown are the average of 5 model runs.
** Results shown are from all vehicles except transit vehicles.
H:\Projects\7939\SD\VISSIM\3A_RB_Refined\11 MOEs\7939_3A_Refined_RB_AM Arterial MOEs.xls 5/3/2013

Year 2013 Scenario 3A Refined Rapid Bus Conditions VISSIM Model
Snelling Avenue Rapid Bus VISSIM Evaluation
Arterial MOEs (A.M. Peak Hour 7:30 - 8:30)
Ford at Cretin
(vph) (ft) (ft) (sec/veh) (sec/veh) (sec/veh)
Left 117 23 148 32.4 C
Right 65 1 79 4.0 A
Left 112 2 79 8.1 A
Thru 320 3 101 3.8 A
Thru 379 7 113 4.6 A
Right 182 6 127 5.7 A
46th at 46th
(vph) (ft) (ft) (sec/veh) (sec/veh) (sec/veh)
Left 28 18 170 55.1 E
Thru 33 18 162 49.2 D
Right 217 0 3 2.3 A
Left 50 11 135 39.3 D
Thru 16 15 157 52.8 D
Right 42 17 150 51.0 D
Left 25 2 80 16.4 B
Thru 168 17 152 21.8 C
Right 34 22 173 17.3 B
Left 142 5 112 9.6 A
Thru 219 7 107 8.2 A
Right 82 3 86 8.3 A
46th at 42nd
(vph) (ft) (ft) (sec/veh) (sec/veh) (sec/veh)
Left 5 1 41 24.7 C
Thru 5 1 48 21.5 C
Right 4 1 48 3.7 A
Left 28 6 88 21.4 C
Thru 4 5 87 26.2 C
Right 84 5 90 7.4 A
Left 49 7 105 27.3 C
Thru 190 18 152 23.4 C
Right 14 22 166 16.2 B
Left 4 0 38 19.1 B
Thru 270 17 166 16.5 B
Right 14 21 175 10.5 B
46th at Minnehaha
(vph) (ft) (ft) (sec/veh) (sec/veh) (sec/veh)
Left 22 31 252 26.3 C
Thru 274 32 260 22.5 C
Right 13 29 260 14.0 B
Left 38 23 258 29.8 C
Thru 166 23 255 21.0 C
Right 109 20 245 10.2 B
Left 127 14 159 22.6 C
Thru 206 15 161 14.6 B
Right 25 20 173 16.2 B
Left 74 15 120 36.3 D
Thru 179 33 201 32.4 C
Right 114 35 204 22.2 C
Approach MovementOverall
LOS
Simulated
Volume
Average
Queue
Maximum
Queue
Movement
DelayMovement
LOS
7.6 A
Southbound 22.3 C
Approach
DelayApproach
LOS
Overall
Delay
Eastbound 4.9 A
Westbound 5.0 A
Approach Movement
Simulated
Volume
Average
Queue
Maximum
Queue
Movement
DelayMovement
LOS
Approach
DelayApproach
LOS
Overall
DelayOverall
LOS
Northbound 13.1 B
16.2 B
Southbound 45.9 D
Eastbound 20.6 C
Westbound 8.7 A
Approach Movement
Simulated
Volume
Average
Queue
Maximum
Queue
Movement
DelayMovement
LOS
Approach
DelayApproach
LOS
Overall
DelayOverall
LOS
Northbound 17.5 B
18.3 B
Southbound 11.4 B
Eastbound 23.7 C
Westbound 16.3 B
Approach Movement
Simulated
Volume
Average
Queue
Maximum
Queue
Movement
DelayMovement
LOS
Approach
DelayApproach
LOS
Overall
DelayOverall
LOS
Northbound 22.4 C
22.2 C
Southbound 18.3 B
Eastbound 17.6 B
Westbound 30.0 C
* Results shown are the average of 5 model runs.
** Results shown are from all vehicles except transit vehicles.
H:\Projects\7939\SD\VISSIM\3A_RB_Refined\11 MOEs\7939_3A_Refined_RB_AM Arterial MOEs.xls 5/3/2013

Year 2013 Scenario 3A Refined Rapid Bus Conditions VISSIM Model
Snelling Avenue Rapid Bus VISSIM Evaluation
Arterial MOEs (A.M. Peak Hour 7:30 - 8:30)
46th at Hiawatha
(vph) (ft) (ft) (sec/veh) (sec/veh) (sec/veh)
Left 26 6 75 39.7 D
Thru 883 65 376 24.0 C
Right 183 0 0 2.3 A
Left 94 20 169 37.1 D
Thru 531 27 207 16.5 B
Right 14 0 0 1.2 A
Left 63 6 82 21.8 C
Thru 80 20 122 29.5 C
Right 44 20 122 33.1 C
Left 162 34 232 35.9 D
Thru 71 9 130 22.2 C
Right 71 2 85 8.5 A
46th at 36th
(vph) (ft) (ft) (sec/veh) (sec/veh) (sec/veh)
Left 5 0 30 8.1 A
Thru 0 - - - A
Right 5 0 33 4.4 A
Left 41 2 77 7.9 A
Thru 0 - - - A
Right 15 2 81 4.2 A
Left 15 0 41 6.2 A
Thru 142 2 96 5.8 A
Right 8 4 112 2.3 A
Left 1 1 101 5.2 A
Thru 86 1 92 3.4 A
Right 24 0 60 2.4 A
Approach Movement
Simulated
Volume
Average
Queue
Maximum
Queue
Movement
DelayMovement
LOS
B
Approach
DelayApproach
LOS
Overall
DelayOverall
LOS
C
C
Northbound 20.8 C
21.7 C
Southbound 19.2
Movement
Eastbound 27.8
26.3Westbound
Simulated
Volume
Average
Queue
Maximum
Queue
Movement
DelayMovement
LOS
Approach
Delay
A
Southbound 6.9 A
Eastbound
Approach
LOS
Overall
DelayOverall
LOSApproach
5.7 A
Westbound 3.2 A
Northbound 6.3 A
5.1
* Results shown are the average of 5 model runs.
** Results shown are from all vehicles except transit vehicles.
H:\Projects\7939\SD\VISSIM\3A_RB_Refined\11 MOEs\7939_3A_Refined_RB_AM Arterial MOEs.xls 5/3/2013
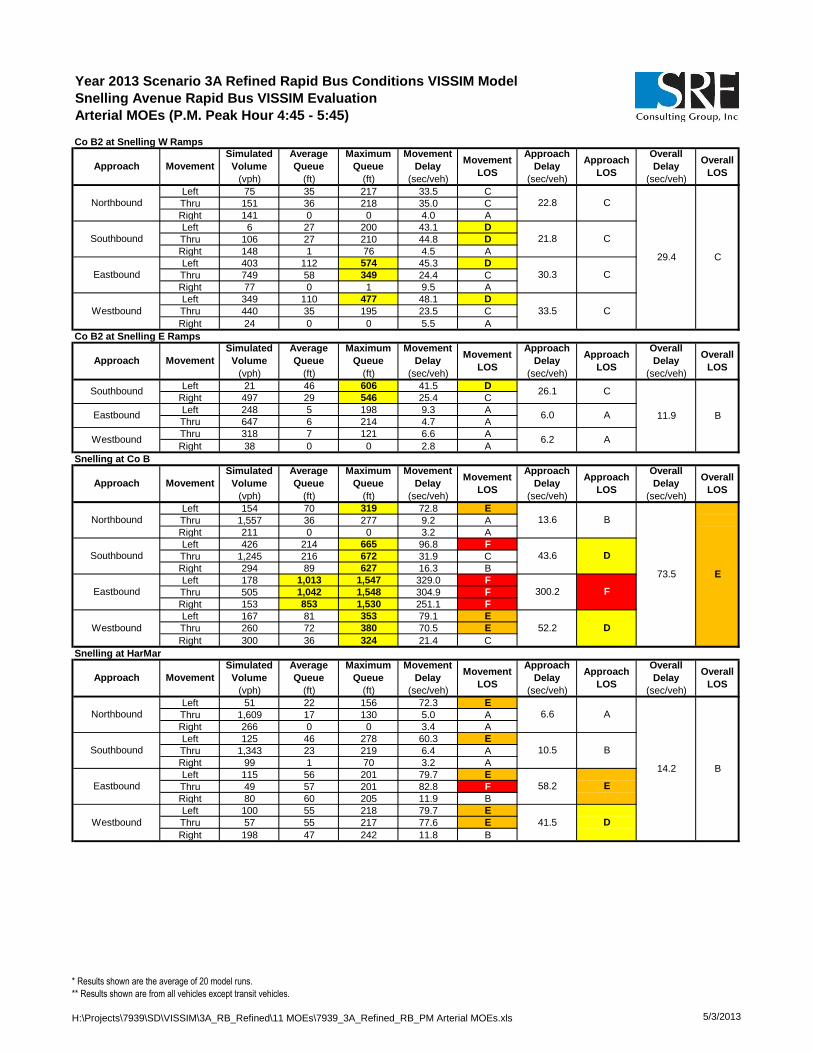
Year 2013 Scenario 3A Refined Rapid Bus Conditions VISSIM Model
Snelling Avenue Rapid Bus VISSIM Evaluation
Arterial MOEs (P.M. Peak Hour 4:45 - 5:45)
Co B2 at Snelling W Ramps
(vph) (ft) (ft) (sec/veh) (sec/veh) (sec/veh)
Left 75 35 217 33.5 C
Thru 151 36 218 35.0 C
Right 141 0 0 4.0 A
Left 6 27 200 43.1 D
Thru 106 27 210 44.8 D
Right 148 1 76 4.5 A
Left 403 112 574 45.3 D
Thru 749 58 349 24.4 C
Right 77 0 1 9.5 A
Left 349 110 477 48.1 D
Thru 440 35 195 23.5 C
Right 24 0 0 5.5 A
Co B2 at Snelling E Ramps
(vph) (ft) (ft) (sec/veh) (sec/veh) (sec/veh)
Left 21 46 606 41.5 D
Right 497 29 546 25.4 C
Left 248 5 198 9.3 A
Thru 647 6 214 4.7 A
Thru 318 7 121 6.6 A
Right 38 0 0 2.8 A
Snelling at Co B
(vph) (ft) (ft) (sec/veh) (sec/veh) (sec/veh)
Left 154 70 319 72.8 E
Thru 1,557 36 277 9.2 A
Right 211 0 0 3.2 A
Left 426 214 665 96.8 F
Thru 1,245 216 672 31.9 C
Right 294 89 627 16.3 B
Left 178 1,013 1,547 329.0 F
Thru 505 1,042 1,548 304.9 F
Right 153 853 1,530 251.1 F
Left 167 81 353 79.1 E
Thru 260 72 380 70.5 E
Right 300 36 324 21.4 C
Snelling at HarMar
(vph) (ft) (ft) (sec/veh) (sec/veh) (sec/veh)
Left 51 22 156 72.3 E
Thru 1,609 17 130 5.0 A
Right 266 0 0 3.4 A
Left 125 46 278 60.3 E
Thru 1,343 23 219 6.4 A
Right 99 1 70 3.2 A
Left 115 56 201 79.7 E
Thru 49 57 201 82.8 F
Right 80 60 205 11.9 B
Left 100 55 218 79.7 E
Thru 57 55 217 77.6 E
Right 198 47 242 11.8 B
58.2 E
Westbound 41.5 D
Northbound 6.6 A
14.2 B
Southbound 10.5 B
Eastbound
Approach
LOS
Overall
DelayOverall
LOS
Simulated
Volume
Average
Queue
Maximum
Queue
Movement
DelayMovement
LOS
Approach
DelayApproach Movement
Eastbound 300.2 F
Westbound 52.2 D
Northbound 13.6 B
73.5 E
Southbound 43.6 D
Approach
DelayApproach
LOS
Overall
DelayOverall
LOS
Simulated
Volume
Average
Queue
Maximum
Queue
Movement
DelayMovement
LOS
6.0 A
Westbound 6.2 A
Approach Movement
11.9 B
Southbound 26.1 C
Eastbound
Approach
LOS
Overall
DelayOverall
LOS
Simulated
Volume
Average
Queue
Maximum
Queue
Movement
DelayMovement
LOS
Approach
Delay
Movement
Approach Movement
Simulated
Volume
Average
Queue
Maximum
Queue
Movement
DelayMovement
LOS
Approach
Delay
C
Southbound 21.8 C
Eastbound
Approach
LOS
Overall
DelayOverall
LOSApproach
30.3 C
Westbound 33.5 C
Northbound 22.8 C
29.4
* Results shown are the average of 20 model runs.
** Results shown are from all vehicles except transit vehicles.
H:\Projects\7939\SD\VISSIM\3A_RB_Refined\11 MOEs\7939_3A_Refined_RB_PM Arterial MOEs.xls 5/3/2013

Year 2013 Scenario 3A Refined Rapid Bus Conditions VISSIM Model
Snelling Avenue Rapid Bus VISSIM Evaluation
Arterial MOEs (P.M. Peak Hour 4:45 - 5:45)
Snelling at Roselawn
(vph) (ft) (ft) (sec/veh) (sec/veh) (sec/veh)
Left 15 12 73 125.7 F
Thru 1,831 11 146 3.7 A
Right 27 0 15 3.9 A
Left 96 173 538 220.0 F
Thru 1,316 40 441 9.5 A
Right 102 0 53 4.9 A
Left 51 223 709 126.7 F
Thru 193 216 706 117.1 F
Right 70 5 147 46.7 D
Left 22 97 414 136.0 F
Thru 94 93 400 120.2 F
Right 45 3 71 28.8 C
Snelling at Larpenteur
(vph) (ft) (ft) (sec/veh) (sec/veh) (sec/veh)
Left 221 122 502 94.9 F
Thru 1,695 420 1,339 51.3 D
Right 185 6 131 30.7 C
Left 175 398 1,221 219.6 F
Thru 1,053 325 1,219 53.8 D
Right 173 31 210 28.7 C
Left 27 8 73 76.8 E
Thru 699 324 885 93.6 F
Right 196 348 914 98.0 F
Left 153 73 309 79.2 E
Thru 352 87 389 49.7 D
Right 151 101 413 41.8 D
Snelling at Hoyt
(vph) (ft) (ft) (sec/veh) (sec/veh) (sec/veh)
Left 7 0 20 18.5 B
Thru 2,063 67 740 11.7 B
Right 124 0 12 7.6 A
Left 46 2 78 31.1 C
Thru 1,347 4 107 2.5 A
Right 9 0 0 3.0 A
Left 23 11 86 83.2 F
Thru 6 3 56 77.5 E
Right 1 1 68 12.6 B
Left 41 20 127 85.8 F
Thru 10 7 85 80.3 F
Right 29 8 102 26.7 C
Snelling at Midway
(vph) (ft) (ft) (sec/veh) (sec/veh) (sec/veh)
Left 53 1 55 15.8 B
Thru 2,094 77 768 11.6 B
Right 66 0 53 10.1 B
Left 76 1 68 17.9 B
Thru 1,266 9 206 4.4 A
Right 49 13 239 5.0 A
Left 46 24 133 87.5 F
Thru 30 14 96 81.0 F
Right 39 2 65 9.0 A
Left 19 17 112 87.4 F
Thru 15 17 110 79.4 E
Right 51 2 65 13.2 B
59.2 E
Westbound 41.7 D
Northbound 11.7 B
11.4 B
Southbound 5.1 A
Eastbound
Approach
LOS
Overall
DelayOverall
LOS
Simulated
Volume
Average
Queue
Maximum
Queue
Movement
DelayMovement
LOS
Approach
DelayApproach Movement
Eastbound 79.2 E
Westbound 63.5 E
Northbound 11.5 B
10.1 B
Southbound 3.5 A
Approach
DelayApproach
LOS
Overall
DelayOverall
LOS
Simulated
Volume
Average
Queue
Maximum
Queue
Movement
DelayMovement
LOS
94.0 F
Westbound 54.8 D
Approach Movement
Northbound 54.0 D
66.2 E
Southbound 71.4 E
Eastbound
Approach
LOS
Overall
DelayOverall
LOS
Simulated
Volume
Average
Queue
Maximum
Queue
Movement
DelayMovement
LOS
Approach
DelayApproach Movement
Eastbound 102.9 F
Westbound 96.7 F
Northbound 4.7 A
23.5 C
Southbound 22.6 C
Approach
DelayApproach
LOS
Overall
DelayOverall
LOS
Simulated
Volume
Average
Queue
Maximum
Queue
Movement
DelayMovement
LOSApproach Movement
* Results shown are the average of 20 model runs.
** Results shown are from all vehicles except transit vehicles.
H:\Projects\7939\SD\VISSIM\3A_RB_Refined\11 MOEs\7939_3A_Refined_RB_PM Arterial MOEs.xls 5/3/2013
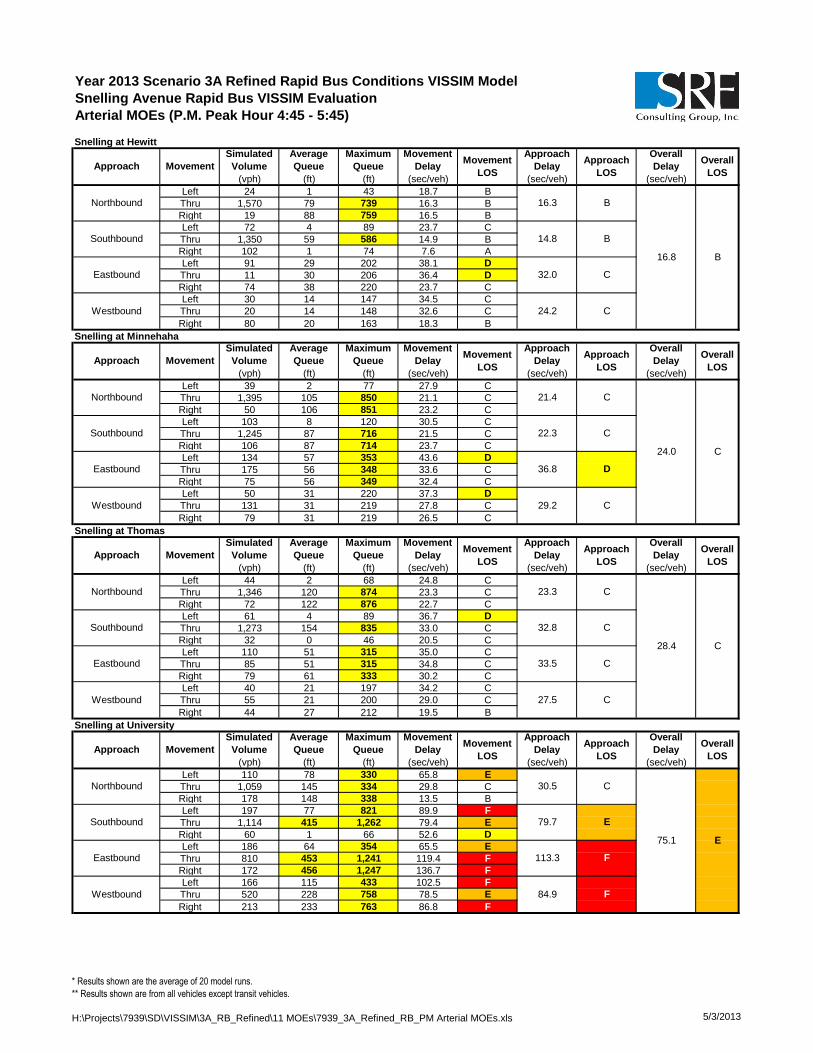
Year 2013 Scenario 3A Refined Rapid Bus Conditions VISSIM Model
Snelling Avenue Rapid Bus VISSIM Evaluation
Arterial MOEs (P.M. Peak Hour 4:45 - 5:45)
Snelling at Hewitt
(vph) (ft) (ft) (sec/veh) (sec/veh) (sec/veh)
Left 24 1 43 18.7 B
Thru 1,570 79 739 16.3 B
Right 19 88 759 16.5 B
Left 72 4 89 23.7 C
Thru 1,350 59 586 14.9 B
Right 102 1 74 7.6 A
Left 91 29 202 38.1 D
Thru 11 30 206 36.4 D
Right 74 38 220 23.7 C
Left 30 14 147 34.5 C
Thru 20 14 148 32.6 C
Right 80 20 163 18.3 B
Snelling at Minnehaha
(vph) (ft) (ft) (sec/veh) (sec/veh) (sec/veh)
Left 39 2 77 27.9 C
Thru 1,395 105 850 21.1 C
Right 50 106 851 23.2 C
Left 103 8 120 30.5 C
Thru 1,245 87 716 21.5 C
Right 106 87 714 23.7 C
Left 134 57 353 43.6 D
Thru 175 56 348 33.6 C
Right 75 56 349 32.4 C
Left 50 31 220 37.3 D
Thru 131 31 219 27.8 C
Right 79 31 219 26.5 C
Snelling at Thomas
(vph) (ft) (ft) (sec/veh) (sec/veh) (sec/veh)
Left 44 2 68 24.8 C
Thru 1,346 120 874 23.3 C
Right 72 122 876 22.7 C
Left 61 4 89 36.7 D
Thru 1,273 154 835 33.0 C
Right 32 0 46 20.5 C
Left 110 51 315 35.0 C
Thru 85 51 315 34.8 C
Right 79 61 333 30.2 C
Left 40 21 197 34.2 C
Thru 55 21 200 29.0 C
Right 44 27 212 19.5 B
Snelling at University
(vph) (ft) (ft) (sec/veh) (sec/veh) (sec/veh)
Left 110 78 330 65.8 E
Thru 1,059 145 334 29.8 C
Right 178 148 338 13.5 B
Left 197 77 821 89.9 F
Thru 1,114 415 1,262 79.4 E
Right 60 1 66 52.6 D
Left 186 64 354 65.5 E
Thru 810 453 1,241 119.4 F
Right 172 456 1,247 136.7 F
Left 166 115 433 102.5 F
Thru 520 228 758 78.5 E
Right 213 233 763 86.8 F
113.3 F
Westbound 84.9 F
Northbound 30.5 C
75.1 E
Southbound 79.7 E
Eastbound
Approach
LOS
Overall
DelayOverall
LOS
Simulated
Volume
Average
Queue
Maximum
Queue
Movement
DelayMovement
LOS
Approach
DelayApproach Movement
Eastbound 33.5 C
Westbound 27.5 C
Northbound 23.3 C
28.4 C
Southbound 32.8 C
Approach
DelayApproach
LOS
Overall
DelayOverall
LOS
Simulated
Volume
Average
Queue
Maximum
Queue
Movement
DelayMovement
LOS
36.8 D
Westbound 29.2 C
Approach Movement
Northbound 21.4 C
24.0 C
Southbound 22.3 C
Eastbound
Approach
LOS
Overall
DelayOverall
LOS
Simulated
Volume
Average
Queue
Maximum
Queue
Movement
DelayMovement
LOS
Approach
DelayApproach Movement
Eastbound 32.0 C
Westbound 24.2 C
Northbound 16.3 B
16.8 B
Southbound 14.8 B
Approach
DelayApproach
LOS
Overall
DelayOverall
LOS
Simulated
Volume
Average
Queue
Maximum
Queue
Movement
DelayMovement
LOSApproach Movement
* Results shown are the average of 20 model runs.
** Results shown are from all vehicles except transit vehicles.
H:\Projects\7939\SD\VISSIM\3A_RB_Refined\11 MOEs\7939_3A_Refined_RB_PM Arterial MOEs.xls 5/3/2013

Year 2013 Scenario 3A Refined Rapid Bus Conditions VISSIM Model
Snelling Avenue Rapid Bus VISSIM Evaluation
Arterial MOEs (P.M. Peak Hour 4:45 - 5:45)
Snelling at Spruce Tree
(vph) (ft) (ft) (sec/veh) (sec/veh) (sec/veh)
Left 61 5 87 43.8 D
Thru 1,218 211 865 51.4 D
Right 146 225 883 27.8 C
Left 70 9 160 34.1 C
Thru 1,363 54 347 14.2 B
Right 14 65 370 12.3 B
Left 35 25 158 67.6 E
Thru 64 24 157 41.6 D
Right 177 9 137 11.3 B
Left 141 45 255 57.4 E
Thru 53 95 469 92.3 F
Right 97 100 471 96.6 F
Snelling at St Anthony
(vph) (ft) (ft) (sec/veh) (sec/veh) (sec/veh)
Left 363 39 332 20.0 B
Thru 980 39 332 12.8 B
Thru 1,338 361 1,002 78.6 E
Right 358 312 946 8.7 A
Left 363 197 943 75.9 E
Thru 432 194 937 70.2 E
Right 442 147 874 22.7 C
Snelling at Concordia
(vph) (ft) (ft) (sec/veh) (sec/veh) (sec/veh)
Thru 1,034 126 640 49.6 D
Right 235 62 555 28.3 C
Left 500 52 337 8.8 A
Thru 1,209 52 338 20.5 C
Left 329 88 594 68.6 E
Thru 324 88 594 87.4 F
Right 593 410 1,318 82.6 F
Snelling at Marshall
(vph) (ft) (ft) (sec/veh) (sec/veh) (sec/veh)
Left 49 6 90 50.2 D
Thru 1,015 181 629 45.3 D
Right 81 2 90 26.4 C
Left 47 3 68 62.0 E
Thru 1,525 645 1,064 62.7 E
Right 222 42 364 49.6 D
Left 216 64 354 47.2 D
Thru 350 61 285 39.4 D
Right 85 73 312 35.1 D
Left 73 13 118 31.9 C
Thru 245 42 193 41.2 D
Right 43 43 202 32.1 C
41.4 D
Westbound 38.2 D
Northbound 44.2 D
50.9 D
Southbound 61.1 E
Eastbound
Approach
LOS
Overall
DelayOverall
LOS
Simulated
Volume
Average
Queue
Maximum
Queue
Movement
DelayMovement
LOS
Approach
DelayApproach Movement
Eastbound 80.1 F
Northbound 45.7 D
44.3 DSouthbound 17.1 B
Approach
DelayApproach
LOS
Overall
DelayOverall
LOS
Simulated
Volume
Average
Queue
Maximum
Queue
Movement
DelayMovement
LOS
Westbound 54.9 D
Approach Movement
Northbound 14.7 B
45.8 DSouthbound 63.9 E
Approach
LOS
Overall
DelayOverall
LOS
Simulated
Volume
Average
Queue
Maximum
Queue
Movement
DelayMovement
LOS
Approach
DelayApproach Movement
Eastbound 25.4 C
Westbound 76.8 E
Northbound 48.6 D
35.1 D
Southbound 15.1 B
Approach
DelayApproach
LOS
Overall
DelayOverall
LOS
Simulated
Volume
Average
Queue
Maximum
Queue
Movement
DelayMovement
LOSApproach Movement
* Results shown are the average of 20 model runs.
** Results shown are from all vehicles except transit vehicles.
H:\Projects\7939\SD\VISSIM\3A_RB_Refined\11 MOEs\7939_3A_Refined_RB_PM Arterial MOEs.xls 5/3/2013
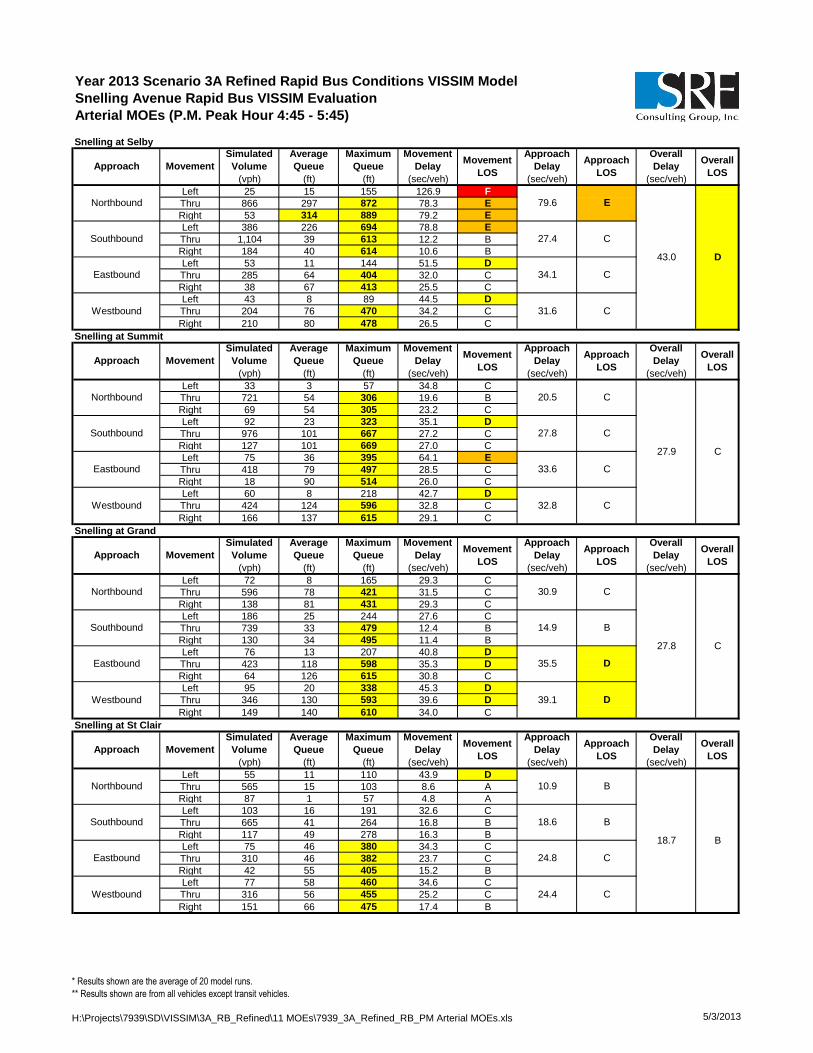
Year 2013 Scenario 3A Refined Rapid Bus Conditions VISSIM Model
Snelling Avenue Rapid Bus VISSIM Evaluation
Arterial MOEs (P.M. Peak Hour 4:45 - 5:45)
Snelling at Selby
(vph) (ft) (ft) (sec/veh) (sec/veh) (sec/veh)
Left 25 15 155 126.9 F
Thru 866 297 872 78.3 E
Right 53 314 889 79.2 E
Left 386 226 694 78.8 E
Thru 1,104 39 613 12.2 B
Right 184 40 614 10.6 B
Left 53 11 144 51.5 D
Thru 285 64 404 32.0 C
Right 38 67 413 25.5 C
Left 43 8 89 44.5 D
Thru 204 76 470 34.2 C
Right 210 80 478 26.5 C
Snelling at Summit
(vph) (ft) (ft) (sec/veh) (sec/veh) (sec/veh)
Left 33 3 57 34.8 C
Thru 721 54 306 19.6 B
Right 69 54 305 23.2 C
Left 92 23 323 35.1 D
Thru 976 101 667 27.2 C
Right 127 101 669 27.0 C
Left 75 36 395 64.1 E
Thru 418 79 497 28.5 C
Right 18 90 514 26.0 C
Left 60 8 218 42.7 D
Thru 424 124 596 32.8 C
Right 166 137 615 29.1 C
Snelling at Grand
(vph) (ft) (ft) (sec/veh) (sec/veh) (sec/veh)
Left 72 8 165 29.3 C
Thru 596 78 421 31.5 C
Right 138 81 431 29.3 C
Left 186 25 244 27.6 C
Thru 739 33 479 12.4 B
Right 130 34 495 11.4 B
Left 76 13 207 40.8 D
Thru 423 118 598 35.3 D
Right 64 126 615 30.8 C
Left 95 20 338 45.3 D
Thru 346 130 593 39.6 D
Right 149 140 610 34.0 C
Snelling at St Clair
(vph) (ft) (ft) (sec/veh) (sec/veh) (sec/veh)
Left 55 11 110 43.9 D
Thru 565 15 103 8.6 A
Right 87 1 57 4.8 A
Left 103 16 191 32.6 C
Thru 665 41 264 16.8 B
Right 117 49 278 16.3 B
Left 75 46 380 34.3 C
Thru 310 46 382 23.7 C
Right 42 55 405 15.2 B
Left 77 58 460 34.6 C
Thru 316 56 455 25.2 C
Right 151 66 475 17.4 B
24.8 C
Westbound 24.4 C
Northbound 10.9 B
18.7 B
Southbound 18.6 B
Eastbound
Approach
LOS
Overall
DelayOverall
LOS
Simulated
Volume
Average
Queue
Maximum
Queue
Movement
DelayMovement
LOS
Approach
DelayApproach Movement
Eastbound 35.5 D
Westbound 39.1 D
Northbound 30.9 C
27.8 C
Southbound 14.9 B
Approach
DelayApproach
LOS
Overall
DelayOverall
LOS
Simulated
Volume
Average
Queue
Maximum
Queue
Movement
DelayMovement
LOS
33.6 C
Westbound 32.8 C
Approach Movement
Northbound 20.5 C
27.9 C
Southbound 27.8 C
Eastbound
Approach
LOS
Overall
DelayOverall
LOS
Simulated
Volume
Average
Queue
Maximum
Queue
Movement
DelayMovement
LOS
Approach
DelayApproach Movement
Eastbound 34.1 C
Westbound 31.6 C
Northbound 79.6 E
43.0 D
Southbound 27.4 C
Approach
DelayApproach
LOS
Overall
DelayOverall
LOS
Simulated
Volume
Average
Queue
Maximum
Queue
Movement
DelayMovement
LOSApproach Movement
* Results shown are the average of 20 model runs.
** Results shown are from all vehicles except transit vehicles.
H:\Projects\7939\SD\VISSIM\3A_RB_Refined\11 MOEs\7939_3A_Refined_RB_PM Arterial MOEs.xls 5/3/2013

Year 2013 Scenario 3A Refined Rapid Bus Conditions VISSIM Model
Snelling Avenue Rapid Bus VISSIM Evaluation
Arterial MOEs (P.M. Peak Hour 4:45 - 5:45)
Snelling at Jefferson
(vph) (ft) (ft) (sec/veh) (sec/veh) (sec/veh)
Left 7 23 313 15.2 B
Thru 671 23 313 12.4 B
Right 44 27 327 11.8 B
Left 38 20 183 14.5 B
Thru 746 20 183 8.7 A
Right 1 23 189 8.2 A
Left 11 20 156 39.2 D
Thru 82 20 153 36.1 D
Right 8 29 177 23.8 C
Left 40 34 226 42.1 D
Thru 85 34 227 39.4 D
Right 37 42 242 26.4 C
Snelling at Randolph
(vph) (ft) (ft) (sec/veh) (sec/veh) (sec/veh)
Left 54 5 104 23.0 C
Thru 496 50 296 28.7 C
Right 105 5 177 13.9 B
Left 146 13 162 21.4 C
Thru 539 30 261 17.9 B
Right 116 3 124 9.5 A
Left 123 33 493 38.9 D
Thru 423 107 601 33.5 C
Right 41 1 63 19.3 B
Left 88 11 119 28.8 C
Thru 346 77 546 30.2 C
Right 103 8 311 16.4 B
Snelling at Highland
(vph) (ft) (ft) (sec/veh) (sec/veh) (sec/veh)
Left 8 5 96 8.4 A
Thru 606 5 97 3.1 A
Right 100 7 109 3.1 A
Left 32 12 245 14.4 B
Thru 596 12 244 7.8 A
Right 36 14 250 6.9 A
Left 23 11 109 21.2 C
Thru 75 10 111 21.3 C
Right 18 1 40 6.0 A
Left 110 17 137 29.4 C
Thru 68 8 108 21.5 C
Right 21 10 120 9.1 A
Snelling at Ford
(vph) (ft) (ft) (sec/veh) (sec/veh) (sec/veh)
Left 124 14 149 17.6 B
Thru 446 14 148 5.7 A
Right 5 18 165 4.9 A
Left 13 5 126 8.0 A
Thru 459 5 124 4.2 A
Right 251 4 135 4.7 A
Left 266 25 193 25.1 C
Thru 8 25 187 24.3 C
Right 144 7 142 11.3 B
Left 8 1 43 21.5 C
Thru 5 1 39 19.2 B
Right 3 0 59 6.4 A
20.3 C
Westbound 18.0 B
Northbound 8.3 A
9.6 A
Southbound 4.4 A
Eastbound
Approach
LOS
Overall
DelayOverall
LOS
Simulated
Volume
Average
Queue
Maximum
Queue
Movement
DelayMovement
LOS
Approach
DelayApproach Movement
Eastbound 19.0 B
Westbound 24.5 C
Northbound 3.2 A
8.7 A
Southbound 8.0 A
Approach
DelayApproach
LOS
Overall
DelayOverall
LOS
Simulated
Volume
Average
Queue
Maximum
Queue
Movement
DelayMovement
LOS
33.6 C
Westbound 27.3 C
Approach Movement
Northbound 25.9 C
25.3 C
Southbound 17.4 B
Eastbound
Approach
LOS
Overall
DelayOverall
LOS
Simulated
Volume
Average
Queue
Maximum
Queue
Movement
DelayMovement
LOS
Approach
DelayApproach Movement
Eastbound 35.5 D
Westbound 37.2 D
Northbound 12.4 B
14.5 B
Southbound 9.0 A
Approach
DelayApproach
LOS
Overall
DelayOverall
LOS
Simulated
Volume
Average
Queue
Maximum
Queue
Movement
DelayMovement
LOSApproach Movement
* Results shown are the average of 20 model runs.
** Results shown are from all vehicles except transit vehicles.
H:\Projects\7939\SD\VISSIM\3A_RB_Refined\11 MOEs\7939_3A_Refined_RB_PM Arterial MOEs.xls 5/3/2013

Year 2013 Scenario 3A Refined Rapid Bus Conditions VISSIM Model
Snelling Avenue Rapid Bus VISSIM Evaluation
Arterial MOEs (P.M. Peak Hour 4:45 - 5:45)
Ford at Fairview
(vph) (ft) (ft) (sec/veh) (sec/veh) (sec/veh)
Left 71 13 145 41.7 D
Thru 497 32 350 13.2 B
Right 25 33 366 12.4 B
Left 26 1 49 23.8 C
Thru 463 44 463 16.3 B
Right 181 50 479 15.0 B
Left 143 44 225 57.6 E
Thru 367 33 354 19.2 B
Right 66 2 83 11.7 B
Left 15 1 34 22.6 C
Thru 350 31 283 17.8 B
Right 16 0 50 8.7 A
Ford at Kenneth
(vph) (ft) (ft) (sec/veh) (sec/veh) (sec/veh)
Left 55 30 227 51.4 D
Thru 21 29 226 48.1 D
Right 37 24 223 26.6 C
Left 29 18 150 45.8 D
Thru 26 18 154 46.1 D
Right 43 15 151 19.6 B
Left 47 1 52 8.3 A
Thru 504 6 132 2.6 A
Right 49 7 144 2.7 A
Left 14 0 29 9.9 A
Thru 567 8 164 6.1 A
Right 21 9 168 5.2 A
Ford at Cleveland
(vph) (ft) (ft) (sec/veh) (sec/veh) (sec/veh)
Left 247 44 292 32.5 C
Thru 352 63 391 26.9 C
Right 38 61 388 27.6 C
Left 79 10 221 35.9 D
Thru 403 138 764 41.5 D
Right 170 138 764 45.9 D
Left 159 32 324 36.0 D
Thru 487 78 458 23.2 C
Right 269 79 459 35.5 D
Left 84 15 144 33.8 C
Thru 496 57 313 26.9 C
Right 83 57 316 29.0 C
Ford at Finn
(vph) (ft) (ft) (sec/veh) (sec/veh) (sec/veh)
Left 200 58 269 47.4 D
Thru 10 56 274 28.8 C
Right 176 59 275 10.4 B
Left 114 39 243 41.4 D
Thru 16 39 244 36.9 D
Right 66 39 250 26.3 C
Left 52 3 127 18.0 B
Thru 636 34 317 14.8 B
Right 43 34 324 11.4 B
Left 195 11 151 14.3 B
Thru 659 14 180 7.2 A
Right 52 15 184 5.5 A
14.8 B
Westbound 8.6 A
Northbound 30.0 C
16.8 B
Southbound 35.9 D
Eastbound
Approach
LOS
Overall
DelayOverall
LOS
Simulated
Volume
Average
Queue
Maximum
Queue
Movement
DelayMovement
LOS
Approach
DelayApproach Movement
Eastbound 29.0 C
Westbound 28.1 C
Northbound 29.1 C
31.8 C
Southbound 42.0 D
Approach
DelayApproach
LOS
Overall
DelayOverall
LOS
Simulated
Volume
Average
Queue
Maximum
Queue
Movement
DelayMovement
LOS
3.1 A
Westbound 6.1 A
Approach Movement
Northbound 42.6 D
9.7 A
Southbound 34.3 C
Eastbound
Approach
LOS
Overall
DelayOverall
LOS
Simulated
Volume
Average
Queue
Maximum
Queue
Movement
DelayMovement
LOS
Approach
DelayApproach Movement
Eastbound 27.9 C
Westbound 17.6 B
Northbound 16.6 B
19.6 B
Southbound 16.3 B
Approach
DelayApproach
LOS
Overall
DelayOverall
LOS
Simulated
Volume
Average
Queue
Maximum
Queue
Movement
DelayMovement
LOSApproach Movement
* Results shown are the average of 20 model runs.
** Results shown are from all vehicles except transit vehicles.
H:\Projects\7939\SD\VISSIM\3A_RB_Refined\11 MOEs\7939_3A_Refined_RB_PM Arterial MOEs.xls 5/3/2013

Year 2013 Scenario 3A Refined Rapid Bus Conditions VISSIM Model
Snelling Avenue Rapid Bus VISSIM Evaluation
Arterial MOEs (P.M. Peak Hour 4:45 - 5:45)
Ford at Cretin
(vph) (ft) (ft) (sec/veh) (sec/veh) (sec/veh)
Left 172 49 258 47.1 D
Right 111 3 71 5.8 A
Left 111 4 105 13.3 B
Thru 560 7 158 5.1 A
Thru 782 28 261 9.1 A
Right 145 28 261 15.0 B
46th at 46th
(vph) (ft) (ft) (sec/veh) (sec/veh) (sec/veh)
Left 14 16 148 53.6 D
Thru 38 16 143 52.4 D
Right 252 0 16 2.9 A
Left 81 21 168 42.6 D
Thru 31 12 109 52.9 D
Right 10 10 109 69.5 E
Left 26 1 43 10.2 B
Thru 340 19 163 11.4 B
Right 51 26 181 19.1 B
Left 299 17 252 16.6 B
Thru 474 12 228 9.6 A
Right 118 4 148 9.8 A
46th at 42nd
(vph) (ft) (ft) (sec/veh) (sec/veh) (sec/veh)
Left 5 2 38 29.5 C
Thru 6 1 38 21.6 C
Right 4 1 42 3.9 A
Left 37 9 126 26.7 C
Thru 5 9 125 27.6 C
Right 58 7 127 10.6 B
Left 85 13 148 30.5 C
Thru 374 28 207 20.3 C
Right 5 33 220 17.5 B
Left 3 0 12 8.3 A
Thru 459 9 168 6.9 A
Right 34 11 178 5.9 A
46th at Minnehaha
(vph) (ft) (ft) (sec/veh) (sec/veh) (sec/veh)
Left 42 60 408 41.3 D
Thru 271 59 406 33.6 C
Right 66 58 405 21.5 C
Left 122 366 1,147 101.1 F
Thru 314 360 1,140 89.1 F
Right 121 351 1,130 79.0 E
Left 173 24 208 27.9 C
Thru 277 20 209 14.6 B
Right 15 25 221 15.6 B
Left 82 17 150 39.8 D
Thru 352 55 304 35.2 D
Right 91 56 306 29.6 C
19.6 B
Westbound 34.9 C
Northbound 32.4 C
46.5 D
Southbound 89.5 F
Eastbound
Approach
LOS
Overall
DelayOverall
LOS
Simulated
Volume
Average
Queue
Maximum
Queue
Movement
DelayMovement
LOS
Approach
DelayApproach Movement
Eastbound 22.1 C
Westbound 6.8 A
Northbound 19.7 B
14.6 B
Southbound 17.4 B
Approach
DelayApproach
LOS
Overall
DelayOverall
LOS
Simulated
Volume
Average
Queue
Maximum
Queue
Movement
DelayMovement
LOS
12.2 B
Westbound 12.0 B
Approach Movement
Northbound 11.4 B
14.4 B
Southbound 47.4 D
Eastbound
Approach
LOS
Overall
DelayOverall
LOS
Simulated
Volume
Average
Queue
Maximum
Queue
Movement
DelayMovement
LOS
Approach
DelayApproach Movement
Eastbound 6.5 A
Westbound 10.0 B
11.9 B
Southbound 30.9 C
Approach
DelayApproach
LOS
Overall
DelayOverall
LOS
Simulated
Volume
Average
Queue
Maximum
Queue
Movement
DelayMovement
LOSApproach Movement
* Results shown are the average of 20 model runs.
** Results shown are from all vehicles except transit vehicles.
H:\Projects\7939\SD\VISSIM\3A_RB_Refined\11 MOEs\7939_3A_Refined_RB_PM Arterial MOEs.xls 5/3/2013

Year 2013 Scenario 3A Refined Rapid Bus Conditions VISSIM Model
Snelling Avenue Rapid Bus VISSIM Evaluation
Arterial MOEs (P.M. Peak Hour 4:45 - 5:45)
46th at Hiawatha
(vph) (ft) (ft) (sec/veh) (sec/veh) (sec/veh)
Left 84 19 139 41.1 D
Thru 806 69 346 27.4 C
Right 243 0 2 2.7 A
Left 144 34 216 41.2 D
Thru 858 65 359 24.4 C
Right 40 0 0 2.2 A
Left 52 6 86 24.9 C
Thru 77 18 118 33.8 C
Right 22 18 119 34.7 C
Left 203 52 351 43.1 D
Thru 146 20 223 25.5 C
Right 168 6 164 12.0 B
46th at 36th
(vph) (ft) (ft) (sec/veh) (sec/veh) (sec/veh)
Left 1 0 29 9.1 A
Thru 2 0 27 11.2 B
Right 0 - - - A
Left 36 1 59 6.2 A
Thru 1 1 61 7.9 A
Right 5 1 66 4.1 A
Left 5 0 21 4.9 A
Thru 115 1 71 4.6 A
Right 1 2 96 2.3 A
Left 0 - - - A
Thru 241 3 141 3.0 A
Right 28 0 52 1.9 A
4.6 A
Westbound 2.9 A
Northbound 10.2 B
3.7 A
Southbound 6.0 A
Eastbound
Approach
LOS
Overall
DelayOverall
LOSApproach
Simulated
Volume
Average
Queue
Maximum
Queue
Movement
DelayMovement
LOS
Approach
DelayMovement
Eastbound 30.8
28.0Westbound C
Northbound 23.1 C
25.4 C
Southbound 25.9 C
Approach
DelayApproach
LOS
Overall
DelayOverall
LOS
C
Simulated
Volume
Average
Queue
Maximum
Queue
Movement
DelayMovement
LOSApproach Movement
* Results shown are the average of 20 model runs.
** Results shown are from all vehicles except transit vehicles.
H:\Projects\7939\SD\VISSIM\3A_RB_Refined\11 MOEs\7939_3A_Refined_RB_PM Arterial MOEs.xls 5/3/2013
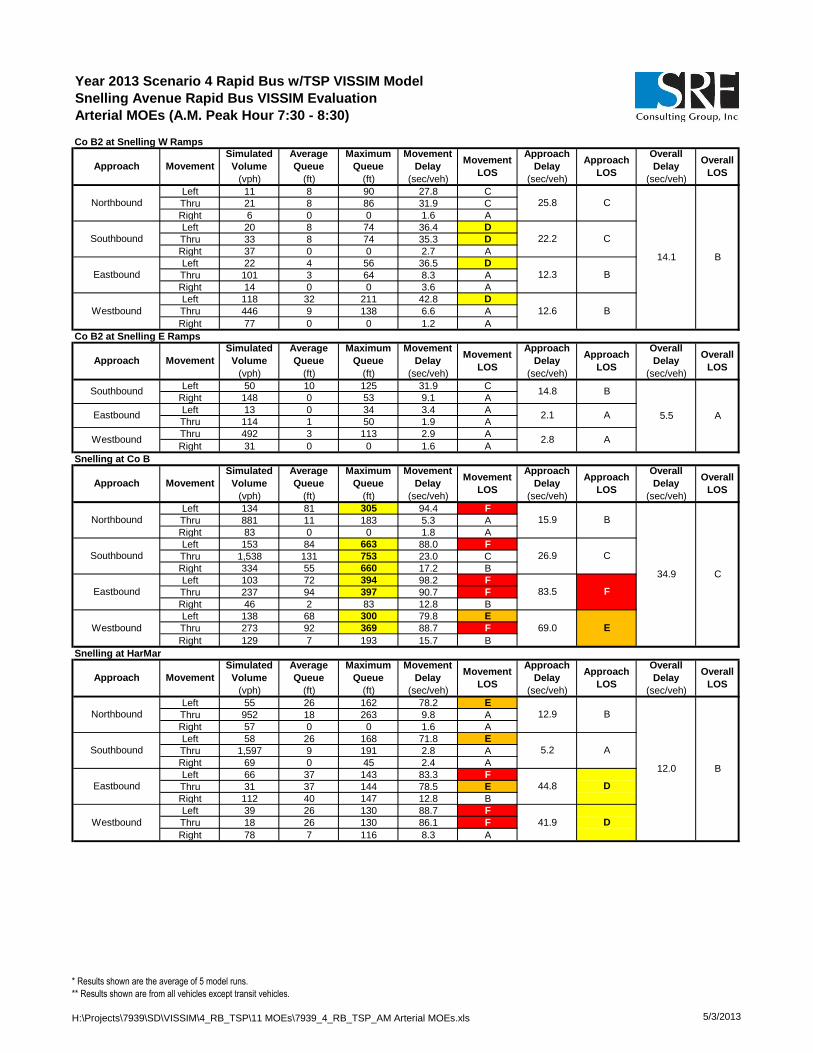
Year 2013 Scenario 4 Rapid Bus w/TSP VISSIM Model
Snelling Avenue Rapid Bus VISSIM Evaluation
Arterial MOEs (A.M. Peak Hour 7:30 - 8:30)
Co B2 at Snelling W Ramps
(vph) (ft) (ft) (sec/veh) (sec/veh) (sec/veh)
Left 11 8 90 27.8 C
Thru 21 8 86 31.9 C
Right 6 0 0 1.6 A
Left 20 8 74 36.4 D
Thru 33 8 74 35.3 D
Right 37 0 0 2.7 A
Left 22 4 56 36.5 D
Thru 101 3 64 8.3 A
Right 14 0 0 3.6 A
Left 118 32 211 42.8 D
Thru 446 9 138 6.6 A
Right 77 0 0 1.2 A
Co B2 at Snelling E Ramps
(vph) (ft) (ft) (sec/veh) (sec/veh) (sec/veh)
Left 50 10 125 31.9 C
Right 148 0 53 9.1 A
Left 13 0 34 3.4 A
Thru 114 1 50 1.9 A
Thru 492 3 113 2.9 A
Right 31 0 0 1.6 A
Snelling at Co B
(vph) (ft) (ft) (sec/veh) (sec/veh) (sec/veh)
Left 134 81 305 94.4 F
Thru 881 11 183 5.3 A
Right 83 0 0 1.8 A
Left 153 84 663 88.0 F
Thru 1,538 131 753 23.0 C
Right 334 55 660 17.2 B
Left 103 72 394 98.2 F
Thru 237 94 397 90.7 F
Right 46 2 83 12.8 B
Left 138 68 300 79.8 E
Thru 273 92 369 88.7 F
Right 129 7 193 15.7 B
Snelling at HarMar
(vph) (ft) (ft) (sec/veh) (sec/veh) (sec/veh)
Left 55 26 162 78.2 E
Thru 952 18 263 9.8 A
Right 57 0 0 1.6 A
Left 58 26 168 71.8 E
Thru 1,597 9 191 2.8 A
Right 69 0 45 2.4 A
Left 66 37 143 83.3 F
Thru 31 37 144 78.5 E
Right 112 40 147 12.8 B
Left 39 26 130 88.7 F
Thru 18 26 130 86.1 F
Right 78 7 116 8.3 A
12.3 B
Westbound 12.6 B
Northbound 25.8 C
14.1 B
Southbound 22.2 C
Eastbound
Approach
LOS
Overall
DelayOverall
LOSApproach
Simulated
Volume
Average
Queue
Maximum
Queue
Movement
DelayMovement
LOS
Approach
DelayMovement
Approach Movement
Simulated
Volume
Average
Queue
Maximum
Queue
Movement
DelayMovement
LOS
Approach
Delay
5.5 A
Southbound 14.8 B
Eastbound
Approach
LOS
Overall
DelayOverall
LOS
2.1 A
Westbound 2.8 A
Approach Movement
Simulated
Volume
Average
Queue
Maximum
Queue
Movement
DelayMovement
LOS
Approach
DelayApproach
LOS
Overall
DelayOverall
LOS
Northbound 15.9 B
34.9 C
Southbound 26.9 C
Eastbound 83.5 F
Westbound 69.0 E
Approach Movement
Simulated
Volume
Average
Queue
Maximum
Queue
Movement
DelayMovement
LOS
Approach
DelayApproach
LOS
Overall
DelayOverall
LOS
Northbound 12.9 B
12.0 B
Southbound 5.2 A
Eastbound 44.8 D
Westbound 41.9 D
* Results shown are the average of 5 model runs.
** Results shown are from all vehicles except transit vehicles.
H:\Projects\7939\SD\VISSIM\4_RB_TSP\11 MOEs\7939_4_RB_TSP_AM Arterial MOEs.xls 5/3/2013

Year 2013 Scenario 4 Rapid Bus w/TSP VISSIM Model
Snelling Avenue Rapid Bus VISSIM Evaluation
Arterial MOEs (A.M. Peak Hour 7:30 - 8:30)
Snelling at Roselawn
(vph) (ft) (ft) (sec/veh) (sec/veh) (sec/veh)
Left 10 4 53 77.8 E
Thru 937 9 236 4.6 A
Right 9 0 30 2.6 A
Left 33 24 120 117.2 F
Thru 1,663 6 164 2.8 A
Right 46 0 28 2.5 A
Left 24 49 217 121.4 F
Thru 42 46 210 108.7 F
Right 77 4 81 13.9 B
Left 47 121 513 111.0 F
Thru 114 122 514 112.2 F
Right 103 4 96 17.4 B
Snelling at Larpenteur
(vph) (ft) (ft) (sec/veh) (sec/veh) (sec/veh)
Left 182 101 403 84.2 F
Thru 787 42 385 17.1 B
Right 40 0 57 4.2 A
Left 48 36 182 122.1 F
Thru 1,620 129 999 24.4 C
Right 120 3 91 13.2 B
Left 84 40 183 79.8 E
Thru 192 55 225 69.0 E
Right 21 67 248 59.0 E
Left 208 1,375 1,709 328.2 F
Thru 679 1,493 1,709 345.4 F
Right 85 1,496 1,709 344.1 F
Snelling at Hoyt
(vph) (ft) (ft) (sec/veh) (sec/veh) (sec/veh)
Left 14 0 28 18.0 B
Thru 922 10 228 5.2 A
Right 30 0 0 2.9 A
Left 15 0 11 8.0 A
Thru 1,820 2 114 2.2 A
Right 14 0 0 2.6 A
Left 10 4 40 71.6 E
Thru 7 4 67 85.9 F
Right 8 3 93 18.0 B
Left 73 40 212 90.5 F
Thru 9 10 140 76.5 E
Right 77 12 157 16.6 B
Snelling at Midway
(vph) (ft) (ft) (sec/veh) (sec/veh) (sec/veh)
Left 44 1 59 22.0 C
Thru 940 11 244 5.3 A
Right 21 0 41 2.6 A
Left 42 0 15 8.3 A
Thru 1,808 4 146 4.0 A
Right 52 7 178 4.6 A
Left 0 - - - A
Thru 14 6 71 81.4 F
Right 3 0 37 11.0 B
Left 45 36 171 80.0 E
Thru 26 35 166 85.1 F
Right 23 1 58 7.4 A
Approach Movement
Simulated
Volume
Average
Queue
Maximum
Queue
Movement
DelayMovement
LOS
Approach
DelayApproach
LOS
Overall
DelayOverall
LOS
Northbound 5.4 A
13.6 B
Southbound 4.9 A
Eastbound 60.1 E
Westbound 75.1 E
Approach Movement
Simulated
Volume
Average
Queue
Maximum
Queue
Movement
DelayMovement
LOS
Approach
DelayApproach
LOS
Overall
DelayOverall
LOS
Northbound 28.6 C
105.5 F
Southbound 26.3 C
Eastbound 71.3 E
Westbound 341.6 F
Approach Movement
Simulated
Volume
Average
Queue
Maximum
Queue
Movement
DelayMovement
LOS
Approach
DelayApproach
LOS
Overall
DelayOverall
LOS
Northbound 5.3 A
6.5 A
Southbound 2.3 A
Eastbound 58.4 E
Westbound 53.9 D
Approach Movement
Simulated
Volume
Average
Queue
Maximum
Queue
Movement
DelayMovement
LOS
Approach
DelayApproach
LOS
Overall
DelayOverall
LOS
Northbound 6.0 A
6.9 A
Southbound 4.1 A
Eastbound 68.7 E
Westbound 63.4 E
* Results shown are the average of 5 model runs.
** Results shown are from all vehicles except transit vehicles.
H:\Projects\7939\SD\VISSIM\4_RB_TSP\11 MOEs\7939_4_RB_TSP_AM Arterial MOEs.xls 5/3/2013

Year 2013 Scenario 4 Rapid Bus w/TSP VISSIM Model
Snelling Avenue Rapid Bus VISSIM Evaluation
Arterial MOEs (A.M. Peak Hour 7:30 - 8:30)
Snelling at Hewitt
(vph) (ft) (ft) (sec/veh) (sec/veh) (sec/veh)
Left 14 0 26 13.3 B
Thru 1,069 38 419 13.1 B
Right 21 45 444 12.7 B
Left 75 2 87 14.1 B
Thru 1,360 29 486 9.2 A
Right 28 0 54 4.9 A
Left 49 14 143 32.0 C
Thru 11 14 144 34.2 C
Right 30 18 163 15.9 B
Left 58 12 110 32.8 C
Thru 5 12 108 33.7 C
Right 7 17 123 16.2 B
Snelling at Minnehaha
(vph) (ft) (ft) (sec/veh) (sec/veh) (sec/veh)
Left 18 1 50 21.0 C
Thru 995 20 367 8.4 A
Right 12 20 359 6.6 A
Left 35 1 61 13.8 B
Thru 1,289 35 575 12.6 B
Right 124 35 578 14.1 B
Left 55 27 170 45.4 D
Thru 58 27 171 36.4 D
Right 22 27 170 35.1 D
Left 35 26 210 38.0 D
Thru 69 26 212 36.9 D
Right 53 26 212 34.8 C
Snelling at Thomas
(vph) (ft) (ft) (sec/veh) (sec/veh) (sec/veh)
Left 22 1 50 13.8 B
Thru 946 25 331 9.6 A
Right 24 26 336 7.9 A
Left 33 1 44 14.0 B
Thru 1,248 33 546 12.9 B
Right 67 0 39 9.1 A
Left 31 11 136 32.9 C
Thru 22 11 137 32.1 C
Right 16 16 153 16.9 B
Left 25 15 160 32.7 C
Thru 45 15 161 26.9 C
Right 49 20 175 14.2 B
Snelling at University
(vph) (ft) (ft) (sec/veh) (sec/veh) (sec/veh)
Left 161 26 303 26.8 C
Thru 869 48 298 14.1 B
Right 126 48 302 4.2 A
Left 154 15 167 30.2 C
Thru 998 78 654 26.1 C
Right 144 3 104 16.6 B
Left 50 15 127 48.4 D
Thru 227 54 286 37.9 D
Right 137 56 289 29.4 C
Left 148 298 606 227.2 F
Thru 549 116 574 52.1 D
Right 75 122 604 46.6 D
Approach Movement
Simulated
Volume
Average
Queue
Maximum
Queue
Movement
DelayMovement
LOS
Approach
DelayApproach
LOS
Overall
DelayOverall
LOS
Northbound 13.1 B
12.0 B
Southbound 9.4 A
Eastbound 27.0 C
Westbound 31.1 C
Approach Movement
Simulated
Volume
Average
Queue
Maximum
Queue
Movement
DelayMovement
LOS
Approach
DelayApproach
LOS
Overall
DelayOverall
LOS
Northbound 8.6 A
13.9 B
Southbound 12.8 B
Eastbound 39.9 D
Westbound 36.4 D
Approach Movement
Simulated
Volume
Average
Queue
Maximum
Queue
Movement
DelayMovement
LOS
Approach
DelayApproach
LOS
Overall
DelayOverall
LOS
Northbound 9.7 A
12.5 B
Southbound 12.7 B
Eastbound 28.9 C
Westbound 22.9 C
Approach Movement
Simulated
Volume
Average
Queue
Maximum
Queue
Movement
DelayMovement
LOS
Approach
DelayApproach
LOS
Overall
DelayOverall
LOS
Northbound 14.8 B
36.0 D
Southbound 25.5 C
Eastbound 36.4 D
Westbound 85.1 F
* Results shown are the average of 5 model runs.
** Results shown are from all vehicles except transit vehicles.
H:\Projects\7939\SD\VISSIM\4_RB_TSP\11 MOEs\7939_4_RB_TSP_AM Arterial MOEs.xls 5/3/2013

Year 2013 Scenario 4 Rapid Bus w/TSP VISSIM Model
Snelling Avenue Rapid Bus VISSIM Evaluation
Arterial MOEs (A.M. Peak Hour 7:30 - 8:30)
Snelling at Spruce Tree
(vph) (ft) (ft) (sec/veh) (sec/veh) (sec/veh)
Left 66 1 80 11.2 B
Thru 1,105 8 137 4.4 A
Right 54 11 154 1.8 A
Left 17 0 26 12.7 B
Thru 1,216 8 185 2.7 A
Right 51 11 209 1.9 A
Left 19 6 70 48.0 D
Thru 0 6 72 34.3 C
Right 61 2 93 7.5 A
Left 47 14 119 47.4 D
Thru 22 9 110 47.8 D
Right 36 9 110 16.4 B
Snelling at St Anthony
(vph) (ft) (ft) (sec/veh) (sec/veh) (sec/veh)
Left 875 40 305 14.1 B
Thru 822 40 306 8.2 A
Thru 930 85 469 35.3 D
Right 401 43 411 10.3 B
Left 214 68 351 33.4 C
Thru 526 68 347 35.8 D
Right 392 29 287 8.5 A
Snelling at Concordia
(vph) (ft) (ft) (sec/veh) (sec/veh) (sec/veh)
Thru 1,367 53 454 20.6 C
Right 412 11 369 12.6 B
Left 491 17 332 10.7 B
Thru 640 17 332 6.5 A
Left 327 56 252 40.0 D
Thru 164 56 252 37.0 D
Right 413 0 0 3.4 A
Snelling at Marshall
(vph) (ft) (ft) (sec/veh) (sec/veh) (sec/veh)
Left 67 5 87 27.8 C
Thru 1,468 128 586 22.0 C
Right 50 1 67 7.5 A
Left 26 3 68 28.0 C
Thru 792 58 337 21.9 C
Right 226 10 183 11.5 B
Left 273 120 517 66.5 E
Thru 211 28 188 29.6 C
Right 58 34 214 18.6 B
Left 46 6 120 23.9 C
Thru 329 46 230 34.1 C
Right 47 46 239 27.6 C
Approach Movement
Simulated
Volume
Average
Queue
Maximum
Queue
Movement
DelayMovement
LOS
Approach
DelayApproach
LOS
Overall
DelayOverall
LOS
Northbound 4.7 A
5.4 A
Southbound 2.8 A
Eastbound 17.3 B
Westbound 36.9 D
Approach
DelayApproach Movement
Overall
DelayOverall
LOS
Simulated
Volume
Average
Queue
Maximum
Queue
Movement
DelayMovement
LOS
Northbound 11.2 B
20.5 CSouthbound 27.8 C
Approach
LOS
Westbound 25.9 C
Approach MovementOverall
LOS
Simulated
Volume
Average
Queue
Maximum
Queue
Movement
DelayMovement
LOS
Southbound 8.3 A
Approach
DelayApproach
LOS
Overall
Delay
Eastbound 22.7 C
Northbound 18.7 B
16.6 B
Approach Movement
Simulated
Volume
Average
Queue
Maximum
Queue
Movement
DelayMovement
LOS
Approach
DelayApproach
LOS
Overall
DelayOverall
LOS
Northbound 21.8 C
26.2 C
Southbound 19.8 B
Eastbound 47.1 D
Westbound 32.2 C
* Results shown are the average of 5 model runs.
** Results shown are from all vehicles except transit vehicles.
H:\Projects\7939\SD\VISSIM\4_RB_TSP\11 MOEs\7939_4_RB_TSP_AM Arterial MOEs.xls 5/3/2013

Year 2013 Scenario 4 Rapid Bus w/TSP VISSIM Model
Snelling Avenue Rapid Bus VISSIM Evaluation
Arterial MOEs (A.M. Peak Hour 7:30 - 8:30)
Snelling at Selby
(vph) (ft) (ft) (sec/veh) (sec/veh) (sec/veh)
Left 12 2 55 44.6 D
Thru 1,073 187 679 44.9 D
Right 21 190 666 39.4 D
Left 228 78 494 53.5 D
Thru 643 31 301 13.5 B
Right 28 33 302 12.5 B
Left 66 241 519 332.8 F
Thru 144 65 506 101.0 F
Right 12 64 515 84.4 F
Left 30 4 48 45.0 D
Thru 176 175 535 47.7 D
Right 454 177 540 39.0 D
Snelling at Summit
(vph) (ft) (ft) (sec/veh) (sec/veh) (sec/veh)
Left 40 1 49 9.8 A
Thru 916 14 137 4.9 A
Right 31 14 137 5.8 A
Left 40 11 124 27.3 C
Thru 552 43 276 20.1 C
Right 101 44 277 19.7 B
Left 49 15 198 58.0 E
Thru 178 29 263 25.9 C
Right 13 39 286 21.6 C
Left 63 8 231 46.2 D
Thru 355 163 596 47.7 D
Right 146 178 615 41.7 D
Snelling at Grand
(vph) (ft) (ft) (sec/veh) (sec/veh) (sec/veh)
Left 44 1 50 12.6 B
Thru 763 30 221 13.2 B
Right 56 31 231 12.3 B
Left 99 11 118 24.5 C
Thru 423 25 184 13.8 B
Right 101 26 198 9.9 A
Left 46 7 88 31.8 C
Thru 184 39 292 30.8 C
Right 23 42 308 24.5 C
Left 81 20 453 69.0 E
Thru 295 283 637 77.0 E
Right 176 294 652 69.9 E
Snelling at St Clair
(vph) (ft) (ft) (sec/veh) (sec/veh) (sec/veh)
Left 39 1 42 11.1 B
Thru 645 11 115 5.9 A
Right 43 0 46 3.3 A
Left 46 2 76 13.9 B
Thru 449 11 158 7.2 A
Right 30 15 176 6.6 A
Left 47 48 356 43.8 D
Thru 217 46 344 32.1 C
Right 39 56 368 19.1 B
Left 69 108 583 51.3 D
Thru 256 109 585 43.5 D
Right 180 122 602 32.1 C
Approach Movement
Simulated
Volume
Average
Queue
Maximum
Queue
Movement
DelayMovement
LOS
Approach
DelayApproach
LOS
Overall
DelayOverall
LOS
Northbound 44.7 D
47.0 D
Southbound 23.6 C
Eastbound 168.6 F
Westbound 41.6 D
Approach Movement
Simulated
Volume
Average
Queue
Maximum
Queue
Movement
DelayMovement
LOS
Approach
DelayApproach
LOS
Overall
DelayOverall
LOS
Northbound 5.1 A
21.3 C
Southbound 20.4 C
Eastbound 32.2 C
Westbound 46.0 D
Approach Movement
Simulated
Volume
Average
Queue
Maximum
Queue
Movement
DelayMovement
LOS
Approach
DelayApproach
LOS
Overall
DelayOverall
LOS
Northbound 13.1 B
30.1 C
Southbound 14.8 B
Eastbound 30.4 C
Westbound 73.6 E
Approach Movement
Simulated
Volume
Average
Queue
Maximum
Queue
Movement
DelayMovement
LOS
Approach
DelayApproach
LOS
Overall
DelayOverall
LOS
Northbound 6.0 A
18.8 B
Southbound 7.8 A
Eastbound 32.3 C
Westbound 40.5 D
* Results shown are the average of 5 model runs.
** Results shown are from all vehicles except transit vehicles.
H:\Projects\7939\SD\VISSIM\4_RB_TSP\11 MOEs\7939_4_RB_TSP_AM Arterial MOEs.xls 5/3/2013

Year 2013 Scenario 4 Rapid Bus w/TSP VISSIM Model
Snelling Avenue Rapid Bus VISSIM Evaluation
Arterial MOEs (A.M. Peak Hour 7:30 - 8:30)
Snelling at Jefferson
(vph) (ft) (ft) (sec/veh) (sec/veh) (sec/veh)
Left 5 18 250 19.2 B
Thru 646 17 243 10.8 B
Right 24 21 256 9.3 A
Left 16 6 102 9.2 A
Thru 545 6 100 3.6 A
Right 4 7 103 3.4 A
Left 19 18 164 39.8 D
Thru 59 18 163 37.7 D
Right 7 28 191 20.1 C
Left 62 44 296 43.8 D
Thru 66 45 305 46.9 D
Right 54 53 317 33.5 C
Snelling at Randolph
(vph) (ft) (ft) (sec/veh) (sec/veh) (sec/veh)
Left 64 4 92 15.7 B
Thru 485 35 226 21.1 C
Right 33 1 73 8.0 A
Left 100 5 84 15.9 B
Thru 353 22 244 18.2 B
Right 156 7 187 12.1 B
Left 100 52 594 60.6 E
Thru 363 136 600 46.3 D
Right 44 1 74 26.3 C
Left 60 10 88 48.2 D
Thru 407 163 631 48.2 D
Right 89 21 591 31.2 C
Snelling at Highland
(vph) (ft) (ft) (sec/veh) (sec/veh) (sec/veh)
Left 3 6 126 6.1 A
Thru 488 6 113 3.9 A
Right 154 8 125 3.6 A
Left 20 8 175 12.9 B
Thru 425 8 175 6.9 A
Right 12 9 184 7.3 A
Left 37 18 169 27.5 C
Thru 93 18 168 25.5 C
Right 9 0 54 7.0 A
Left 124 23 161 35.6 D
Thru 61 10 115 24.6 C
Right 61 13 128 9.0 A
Snelling at Ford
(vph) (ft) (ft) (sec/veh) (sec/veh) (sec/veh)
Left 75 9 126 12.9 B
Thru 441 9 126 6.0 A
Right 5 14 144 2.6 A
Left 2 4 121 11.7 B
Thru 389 3 114 3.7 A
Right 171 1 93 3.4 A
Left 203 20 154 23.3 C
Thru 3 20 152 18.3 B
Right 76 3 104 7.6 A
Left 8 1 43 21.9 C
Thru 5 1 46 16.3 B
Right 2 0 61 6.8 A
Approach Movement
Simulated
Volume
Average
Queue
Maximum
Queue
Movement
DelayMovement
LOS
Approach
DelayApproach
LOS
Overall
DelayOverall
LOS
Northbound 10.8 B
13.4 B
Southbound 3.7 A
Eastbound 36.6 D
Westbound 41.9 D
Approach Movement
Simulated
Volume
Average
Queue
Maximum
Queue
Movement
DelayMovement
LOS
Approach
DelayApproach
LOS
Overall
DelayOverall
LOS
Northbound 19.8 B
31.4 C
Southbound 16.3 B
Eastbound 47.3 D
Westbound 45.5 D
Approach Movement
Simulated
Volume
Average
Queue
Maximum
Queue
Movement
DelayMovement
LOS
Approach
DelayApproach
LOS
Overall
DelayOverall
LOS
Northbound 3.9 A
10.5 B
Southbound 7.1 A
Eastbound 24.9 C
Westbound 26.3 C
Approach Movement
Simulated
Volume
Average
Queue
Maximum
Queue
Movement
DelayMovement
LOS
Approach
DelayApproach
LOS
Overall
DelayOverall
LOS
Northbound 7.0 A
8.2 A
Southbound 3.7 A
Eastbound 19.0 B
Westbound 17.9 B
* Results shown are the average of 5 model runs.
** Results shown are from all vehicles except transit vehicles.
H:\Projects\7939\SD\VISSIM\4_RB_TSP\11 MOEs\7939_4_RB_TSP_AM Arterial MOEs.xls 5/3/2013

Year 2013 Scenario 4 Rapid Bus w/TSP VISSIM Model
Snelling Avenue Rapid Bus VISSIM Evaluation
Arterial MOEs (A.M. Peak Hour 7:30 - 8:30)
Ford at Fairview
(vph) (ft) (ft) (sec/veh) (sec/veh) (sec/veh)
Left 40 3 58 22.5 C
Thru 436 22 297 11.5 B
Right 45 22 320 9.3 A
Left 22 1 46 19.5 B
Thru 430 21 275 11.0 B
Right 66 24 292 9.3 A
Left 88 9 110 23.1 C
Thru 215 13 179 13.6 B
Right 28 1 89 8.2 A
Left 28 2 53 16.9 B
Thru 216 12 178 12.9 B
Right 7 0 51 5.2 A
Ford at Kenneth
(vph) (ft) (ft) (sec/veh) (sec/veh) (sec/veh)
Left 38 18 165 37.2 D
Thru 27 18 162 34.3 C
Right 32 14 159 15.9 B
Left 11 12 118 36.3 D
Thru 44 11 117 31.8 C
Right 38 8 112 10.9 B
Left 31 0 37 4.2 A
Thru 291 3 75 1.8 A
Right 20 3 86 1.5 A
Left 15 0 24 5.2 A
Thru 300 4 89 4.4 A
Right 7 4 91 3.7 A
Ford at Cleveland
(vph) (ft) (ft) (sec/veh) (sec/veh) (sec/veh)
Left 296 26 260 18.6 B
Thru 389 47 363 18.6 B
Right 56 44 362 21.0 C
Left 28 2 61 16.8 B
Thru 274 30 301 20.4 C
Right 86 28 298 22.8 C
Left 91 11 119 23.1 C
Thru 258 18 154 11.9 B
Right 123 17 154 13.9 B
Left 50 6 90 26.8 C
Thru 288 17 121 14.1 B
Right 37 14 124 11.4 B
Ford at Finn
(vph) (ft) (ft) (sec/veh) (sec/veh) (sec/veh)
Left 48 9 91 32.4 C
Thru 1 6 85 28.2 C
Right 42 6 90 4.8 A
Left 31 7 100 32.3 C
Thru 1 7 92 17.0 B
Right 29 4 95 10.9 B
Left 20 1 56 9.7 A
Thru 400 6 114 4.8 A
Right 20 4 122 3.3 A
Left 125 1 73 4.8 A
Thru 487 2 100 2.5 A
Right 59 2 105 2.2 A
Approach Movement
Simulated
Volume
Average
Queue
Maximum
Queue
Movement
DelayMovement
LOS
Approach
DelayApproach
LOS
Overall
DelayOverall
LOS
Northbound 12.1 B
12.7 B
Southbound 11.1 B
Eastbound 15.7 B
Westbound 13.2 B
Approach Movement
Simulated
Volume
Average
Queue
Maximum
Queue
Movement
DelayMovement
LOS
Approach
DelayApproach
LOS
Overall
DelayOverall
LOS
Northbound 29.4 C
8.4 A
Southbound 23.8 C
Eastbound 2.0 A
Westbound 4.5 A
Approach Movement
Simulated
Volume
Average
Queue
Maximum
Queue
Movement
DelayMovement
LOS
Approach
DelayApproach
LOS
Overall
DelayOverall
LOS
Northbound 18.7 B
17.5 B
Southbound 20.7 C
Eastbound 14.6 B
Westbound 15.5 B
Approach Movement
Simulated
Volume
Average
Queue
Maximum
Queue
Movement
DelayMovement
LOS
Approach
DelayApproach
LOS
Overall
DelayOverall
LOS
Northbound 19.7 B
5.8 A
Southbound 22.0 C
Eastbound 4.9 A
Westbound 2.9 A
* Results shown are the average of 5 model runs.
** Results shown are from all vehicles except transit vehicles.
H:\Projects\7939\SD\VISSIM\4_RB_TSP\11 MOEs\7939_4_RB_TSP_AM Arterial MOEs.xls 5/3/2013

Year 2013 Scenario 4 Rapid Bus w/TSP VISSIM Model
Snelling Avenue Rapid Bus VISSIM Evaluation
Arterial MOEs (A.M. Peak Hour 7:30 - 8:30)
Ford at Cretin
(vph) (ft) (ft) (sec/veh) (sec/veh) (sec/veh)
Left 117 23 148 32.2 C
Right 65 1 78 4.1 A
Left 112 2 71 8.0 A
Thru 322 3 107 3.8 A
Thru 380 7 156 4.6 A
Right 181 7 165 5.7 A
46th at 46th
(vph) (ft) (ft) (sec/veh) (sec/veh) (sec/veh)
Left 28 20 188 61.9 E
Thru 33 20 179 53.4 D
Right 217 0 3 2.6 A
Left 50 13 136 43.3 D
Thru 15 16 160 52.6 D
Right 42 19 152 54.0 D
Left 25 2 81 14.4 B
Thru 169 16 139 19.1 B
Right 34 20 159 15.7 B
Left 142 5 121 9.3 A
Thru 219 6 113 8.0 A
Right 81 3 70 7.4 A
46th at 42nd
(vph) (ft) (ft) (sec/veh) (sec/veh) (sec/veh)
Left 5 2 51 29.0 C
Thru 5 2 54 32.2 C
Right 4 1 54 7.7 A
Left 28 10 146 32.7 C
Thru 4 10 153 28.7 C
Right 84 9 148 12.2 B
Left 49 6 114 21.9 C
Thru 190 13 128 17.4 B
Right 14 16 141 12.1 B
Left 4 0 34 18.6 B
Thru 269 14 170 14.0 B
Right 13 17 179 7.4 A
46th at Minnehaha
(vph) (ft) (ft) (sec/veh) (sec/veh) (sec/veh)
Left 22 34 252 28.3 C
Thru 274 34 260 24.2 C
Right 13 31 260 14.1 B
Left 38 26 277 32.4 C
Thru 166 26 275 22.9 C
Right 109 21 253 11.2 B
Left 127 13 173 21.0 C
Thru 206 13 163 13.8 B
Right 25 18 175 11.9 B
Left 74 13 114 32.8 C
Thru 179 29 195 28.7 C
Right 113 30 199 20.0 C
Approach MovementOverall
LOS
Simulated
Volume
Average
Queue
Maximum
Queue
Movement
DelayMovement
LOS
7.6 A
Southbound 22.2 C
Approach
DelayApproach
LOS
Overall
Delay
Eastbound 4.9 A
Westbound 4.9 A
Approach Movement
Simulated
Volume
Average
Queue
Maximum
Queue
Movement
DelayMovement
LOS
Approach
DelayApproach
LOS
Overall
DelayOverall
LOS
Northbound 14.5 B
16.1 B
Southbound 48.8 D
Eastbound 18.1 B
Westbound 8.3 A
Approach Movement
Simulated
Volume
Average
Queue
Maximum
Queue
Movement
DelayMovement
LOS
Approach
DelayApproach
LOS
Overall
DelayOverall
LOS
Northbound 23.9 C
16.3 B
Southbound 17.7 B
Eastbound 18.0 B
Westbound 13.8 B
Approach Movement
Simulated
Volume
Average
Queue
Maximum
Queue
Movement
DelayMovement
LOS
Approach
DelayApproach
LOS
Overall
DelayOverall
LOS
Northbound 24.0 C
21.8 C
Southbound 20.0 B
Eastbound 16.2 B
Westbound 26.9 C
* Results shown are the average of 5 model runs.
** Results shown are from all vehicles except transit vehicles.
H:\Projects\7939\SD\VISSIM\4_RB_TSP\11 MOEs\7939_4_RB_TSP_AM Arterial MOEs.xls 5/3/2013
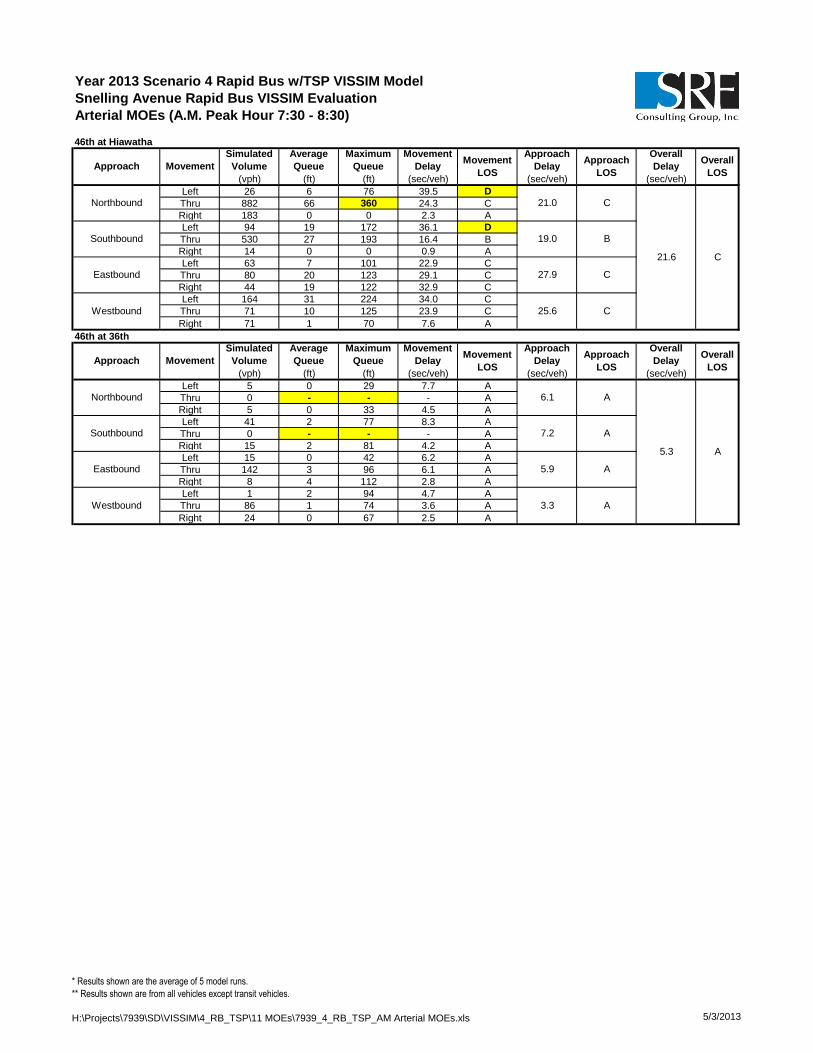
Year 2013 Scenario 4 Rapid Bus w/TSP VISSIM Model
Snelling Avenue Rapid Bus VISSIM Evaluation
Arterial MOEs (A.M. Peak Hour 7:30 - 8:30)
46th at Hiawatha
(vph) (ft) (ft) (sec/veh) (sec/veh) (sec/veh)
Left 26 6 76 39.5 D
Thru 882 66 360 24.3 C
Right 183 0 0 2.3 A
Left 94 19 172 36.1 D
Thru 530 27 193 16.4 B
Right 14 0 0 0.9 A
Left 63 7 101 22.9 C
Thru 80 20 123 29.1 C
Right 44 19 122 32.9 C
Left 164 31 224 34.0 C
Thru 71 10 125 23.9 C
Right 71 1 70 7.6 A
46th at 36th
(vph) (ft) (ft) (sec/veh) (sec/veh) (sec/veh)
Left 5 0 29 7.7 A
Thru 0 - - - A
Right 5 0 33 4.5 A
Left 41 2 77 8.3 A
Thru 0 - - - A
Right 15 2 81 4.2 A
Left 15 0 42 6.2 A
Thru 142 3 96 6.1 A
Right 8 4 112 2.8 A
Left 1 2 94 4.7 A
Thru 86 1 74 3.6 A
Right 24 0 67 2.5 A
Approach Movement
Simulated
Volume
Average
Queue
Maximum
Queue
Movement
DelayMovement
LOS
B
Approach
DelayApproach
LOS
Overall
DelayOverall
LOS
C
C
Northbound 21.0 C
21.6 C
Southbound 19.0
Movement
Eastbound 27.9
25.6Westbound
Simulated
Volume
Average
Queue
Maximum
Queue
Movement
DelayMovement
LOS
Approach
Delay
A
Southbound 7.2 A
Eastbound
Approach
LOS
Overall
DelayOverall
LOSApproach
5.9 A
Westbound 3.3 A
Northbound 6.1 A
5.3
* Results shown are the average of 5 model runs.
** Results shown are from all vehicles except transit vehicles.
H:\Projects\7939\SD\VISSIM\4_RB_TSP\11 MOEs\7939_4_RB_TSP_AM Arterial MOEs.xls 5/3/2013

Year 2013 Scenario 4 Rapid Bus w/TSP VISSIM Model
Snelling Avenue Rapid Bus VISSIM Evaluation
Arterial MOEs (P.M. Peak Hour 4:45 - 5:45)
Co B2 at Snelling W Ramps
(vph) (ft) (ft) (sec/veh) (sec/veh) (sec/veh)
Left 75 34 216 32.6 C
Thru 151 34 215 34.3 C
Right 142 0 0 4.0 A
Left 6 25 182 42.0 D
Thru 106 26 195 43.2 D
Right 148 1 61 4.4 A
Left 403 136 653 52.2 D
Thru 747 64 405 27.0 C
Right 77 0 0 10.4 B
Left 350 104 478 46.1 D
Thru 438 33 194 22.7 C
Right 24 0 0 6.2 A
Co B2 at Snelling E Ramps
(vph) (ft) (ft) (sec/veh) (sec/veh) (sec/veh)
Left 21 40 550 41.1 D
Right 495 23 486 23.6 C
Left 248 5 203 9.6 A
Thru 648 7 238 5.0 A
Thru 318 8 142 8.1 A
Right 38 0 0 2.8 A
Snelling at Co B
(vph) (ft) (ft) (sec/veh) (sec/veh) (sec/veh)
Left 153 78 350 79.5 E
Thru 1,562 33 298 8.6 A
Right 212 0 0 3.3 A
Left 425 232 680 112.6 F
Thru 1,246 226 679 30.1 C
Right 294 95 612 15.7 B
Left 166 1,339 1,646 436.4 F
Thru 467 1,359 1,643 414.0 F
Right 142 1,231 1,662 346.8 F
Left 167 92 363 88.2 F
Thru 261 75 392 73.7 E
Right 299 37 317 21.8 C
Snelling at HarMar
(vph) (ft) (ft) (sec/veh) (sec/veh) (sec/veh)
Left 51 23 167 74.7 E
Thru 1,612 17 161 5.5 A
Right 268 0 0 3.3 A
Left 124 54 296 69.8 E
Thru 1,334 22 217 6.2 A
Right 98 1 67 3.3 A
Left 115 58 195 80.3 F
Thru 49 58 196 87.6 F
Right 80 61 198 11.2 B
Left 100 58 220 83.8 F
Thru 57 58 219 78.1 E
Right 197 49 246 11.7 B
34.3 C
Westbound 32.3 C
Northbound 22.3 C
30.7 C
Southbound 21.0 C
Eastbound
Approach
LOS
Overall
DelayOverall
LOSApproach
Simulated
Volume
Average
Queue
Maximum
Queue
Movement
DelayMovement
LOS
Approach
DelayMovement
Approach Movement
Simulated
Volume
Average
Queue
Maximum
Queue
Movement
DelayMovement
LOS
Approach
Delay
11.8 B
Southbound 24.3 C
Eastbound
Approach
LOS
Overall
DelayOverall
LOS
6.3 A
Westbound 7.5 A
Approach Movement
Simulated
Volume
Average
Queue
Maximum
Queue
Movement
DelayMovement
LOS
Approach
DelayApproach
LOS
Overall
DelayOverall
LOS
Northbound 13.6 B
87.5 F
Southbound 45.8 D
Eastbound 406.5 F
Westbound 55.7 E
Approach Movement
Simulated
Volume
Average
Queue
Maximum
Queue
Movement
DelayMovement
LOS
Approach
DelayApproach
LOS
Overall
DelayOverall
LOS
Northbound 7.0 A
14.8 B
Southbound 11.1 B
Eastbound 59.1 E
Westbound 42.7 D
* Results shown are the average of 20 model runs.
** Results shown are from all vehicles except transit vehicles.
H:\Projects\7939\SD\VISSIM\4_RB_TSP\11 MOEs\7939_4_RB_TSP_PM Arterial MOEs.xls 5/3/2013

Year 2013 Scenario 4 Rapid Bus w/TSP VISSIM Model
Snelling Avenue Rapid Bus VISSIM Evaluation
Arterial MOEs (P.M. Peak Hour 4:45 - 5:45)
Snelling at Roselawn
(vph) (ft) (ft) (sec/veh) (sec/veh) (sec/veh)
Left 15 11 71 120.9 F
Thru 1,834 14 313 4.1 A
Right 28 0 19 3.6 A
Left 96 187 577 229.7 F
Thru 1,305 37 392 11.5 B
Right 101 1 57 6.1 A
Left 51 282 731 152.1 F
Thru 192 273 729 143.4 F
Right 70 6 171 64.1 E
Left 22 104 462 144.1 F
Thru 94 100 454 126.3 F
Right 45 3 90 31.7 C
Snelling at Larpenteur
(vph) (ft) (ft) (sec/veh) (sec/veh) (sec/veh)
Left 222 120 458 88.3 F
Thru 1,700 276 1,307 37.9 D
Right 185 6 146 20.8 C
Left 172 403 1,238 219.4 F
Thru 1,044 315 1,234 53.3 D
Right 171 9 213 30.2 C
Left 26 11 74 213.2 F
Thru 669 930 1,511 245.0 F
Right 187 954 1,537 255.2 F
Left 153 91 355 96.1 F
Thru 352 96 423 53.9 D
Right 151 110 446 46.1 D
Snelling at Hoyt
(vph) (ft) (ft) (sec/veh) (sec/veh) (sec/veh)
Left 7 0 16 13.7 B
Thru 2,065 26 507 7.0 A
Right 124 0 5 5.6 A
Left 45 2 78 32.3 C
Thru 1,331 4 123 2.9 A
Right 9 0 0 2.8 A
Left 23 11 86 82.7 F
Thru 6 3 56 74.9 E
Right 1 1 68 11.6 B
Left 41 21 127 86.3 F
Thru 10 7 85 80.2 F
Right 29 7 103 22.1 C
Snelling at Midway
(vph) (ft) (ft) (sec/veh) (sec/veh) (sec/veh)
Left 53 1 61 16.4 B
Thru 2,098 69 756 10.9 B
Right 66 1 86 9.1 A
Left 75 1 73 19.1 B
Thru 1,251 8 232 4.2 A
Right 48 11 265 5.1 A
Left 46 25 140 91.5 F
Thru 30 15 98 84.3 F
Right 39 2 66 9.1 A
Left 19 19 117 96.4 F
Thru 15 19 115 86.9 F
Right 51 2 66 13.1 B
Approach Movement
Simulated
Volume
Average
Queue
Maximum
Queue
Movement
DelayMovement
LOS
Approach
DelayApproach
LOS
Overall
DelayOverall
LOS
Northbound 5.1 A
26.8 C
Southbound 25.0 C
Eastbound 127.2 F
Westbound 102.1 F
Approach Movement
Simulated
Volume
Average
Queue
Maximum
Queue
Movement
DelayMovement
LOS
Approach
DelayApproach
LOS
Overall
DelayOverall
LOS
Northbound 41.7 D
88.3 F
Southbound 71.1 E
Eastbound 246.2 F
Westbound 62.0 E
Approach Movement
Simulated
Volume
Average
Queue
Maximum
Queue
Movement
DelayMovement
LOS
Approach
DelayApproach
LOS
Overall
DelayOverall
LOS
Northbound 7.0 A
7.6 A
Southbound 3.8 A
Eastbound 78.2 E
Westbound 62.1 E
Approach Movement
Simulated
Volume
Average
Queue
Maximum
Queue
Movement
DelayMovement
LOS
Approach
DelayApproach
LOS
Overall
DelayOverall
LOS
Northbound 11.0 B
11.1 B
Southbound 5.0 A
Eastbound 61.7 E
Westbound 45.1 D
* Results shown are the average of 20 model runs.
** Results shown are from all vehicles except transit vehicles.
H:\Projects\7939\SD\VISSIM\4_RB_TSP\11 MOEs\7939_4_RB_TSP_PM Arterial MOEs.xls 5/3/2013

Year 2013 Scenario 4 Rapid Bus w/TSP VISSIM Model
Snelling Avenue Rapid Bus VISSIM Evaluation
Arterial MOEs (P.M. Peak Hour 4:45 - 5:45)
Snelling at Hewitt
(vph) (ft) (ft) (sec/veh) (sec/veh) (sec/veh)
Left 24 0 42 18.2 B
Thru 1,582 83 750 16.6 B
Right 19 94 785 17.7 B
Left 71 4 101 24.5 C
Thru 1,341 57 588 14.2 B
Right 102 1 73 7.3 A
Left 91 38 236 45.8 D
Thru 11 39 236 47.1 D
Right 74 48 254 30.4 C
Left 30 18 192 39.4 D
Thru 20 18 191 36.8 D
Right 80 25 207 23.1 C
Snelling at Minnehaha
(vph) (ft) (ft) (sec/veh) (sec/veh) (sec/veh)
Left 40 2 80 26.5 C
Thru 1,411 103 820 21.2 C
Right 51 103 822 21.6 C
Left 103 8 137 30.5 C
Thru 1,235 80 701 20.2 C
Right 105 80 704 22.7 C
Left 135 91 616 60.5 E
Thru 176 91 609 46.7 D
Right 76 91 609 44.5 D
Left 50 42 328 49.2 D
Thru 131 42 330 35.2 D
Right 79 42 332 31.8 C
Snelling at Thomas
(vph) (ft) (ft) (sec/veh) (sec/veh) (sec/veh)
Left 45 2 68 21.8 C
Thru 1,358 103 754 21.0 C
Right 72 105 760 20.4 C
Left 61 3 82 27.0 C
Thru 1,266 75 622 20.9 C
Right 31 0 45 11.8 B
Left 110 68 409 43.6 D
Thru 85 67 402 43.5 D
Right 79 79 423 35.7 D
Left 40 26 219 39.4 D
Thru 55 26 223 35.2 D
Right 44 33 235 24.1 C
Snelling at University
(vph) (ft) (ft) (sec/veh) (sec/veh) (sec/veh)
Left 112 40 316 44.4 D
Thru 1,078 90 324 20.8 C
Right 180 92 328 8.1 A
Left 197 52 475 59.1 E
Thru 1,110 195 990 46.0 D
Right 60 1 66 27.7 C
Left 174 130 696 190.5 F
Thru 743 1,376 1,687 293.0 F
Right 155 1,386 1,689 332.7 F
Left 167 122 572 166.6 F
Thru 522 714 1,203 205.6 F
Right 213 703 1,205 218.3 F
Approach Movement
Simulated
Volume
Average
Queue
Maximum
Queue
Movement
DelayMovement
LOS
Approach
DelayApproach
LOS
Overall
DelayOverall
LOS
Northbound 16.7 B
17.2 B
Southbound 14.2 B
Eastbound 39.5 D
Westbound 29.0 C
Approach Movement
Simulated
Volume
Average
Queue
Maximum
Queue
Movement
DelayMovement
LOS
Approach
DelayApproach
LOS
Overall
DelayOverall
LOS
Northbound 21.3 C
25.6 C
Southbound 21.1 C
Eastbound 51.1 D
Westbound 36.8 D
Approach Movement
Simulated
Volume
Average
Queue
Maximum
Queue
Movement
DelayMovement
LOS
Approach
DelayApproach
LOS
Overall
DelayOverall
LOS
Northbound 21.0 C
23.2 C
Southbound 20.9 C
Eastbound 41.3 D
Westbound 32.9 C
Approach Movement
Simulated
Volume
Average
Queue
Maximum
Queue
Movement
DelayMovement
LOS
Approach
DelayApproach
LOS
Overall
DelayOverall
LOS
Northbound 21.0 C
122.5 F
Southbound 47.1 D
Eastbound 282.1 F
Westbound 201.4 F
* Results shown are the average of 20 model runs.
** Results shown are from all vehicles except transit vehicles.
H:\Projects\7939\SD\VISSIM\4_RB_TSP\11 MOEs\7939_4_RB_TSP_PM Arterial MOEs.xls 5/3/2013
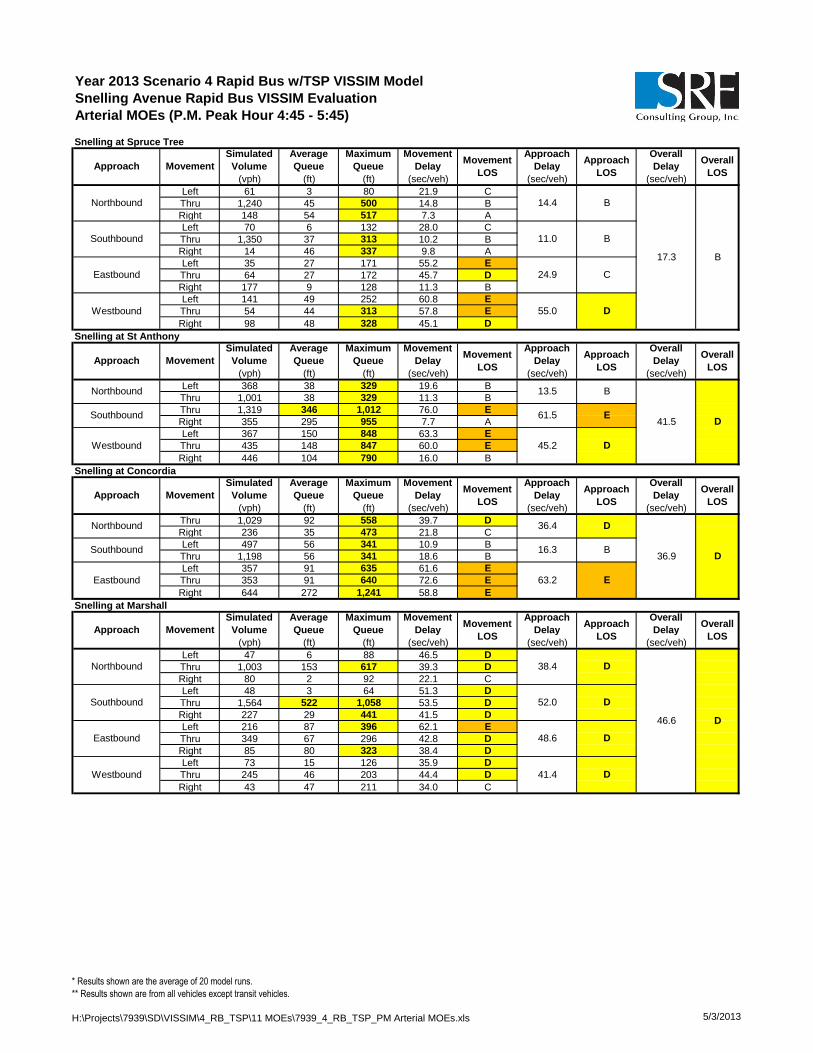
Year 2013 Scenario 4 Rapid Bus w/TSP VISSIM Model
Snelling Avenue Rapid Bus VISSIM Evaluation
Arterial MOEs (P.M. Peak Hour 4:45 - 5:45)
Snelling at Spruce Tree
(vph) (ft) (ft) (sec/veh) (sec/veh) (sec/veh)
Left 61 3 80 21.9 C
Thru 1,240 45 500 14.8 B
Right 148 54 517 7.3 A
Left 70 6 132 28.0 C
Thru 1,350 37 313 10.2 B
Right 14 46 337 9.8 A
Left 35 27 171 55.2 E
Thru 64 27 172 45.7 D
Right 177 9 128 11.3 B
Left 141 49 252 60.8 E
Thru 54 44 313 57.8 E
Right 98 48 328 45.1 D
Snelling at St Anthony
(vph) (ft) (ft) (sec/veh) (sec/veh) (sec/veh)
Left 368 38 329 19.6 B
Thru 1,001 38 329 11.3 B
Thru 1,319 346 1,012 76.0 E
Right 355 295 955 7.7 A
Left 367 150 848 63.3 E
Thru 435 148 847 60.0 E
Right 446 104 790 16.0 B
Snelling at Concordia
(vph) (ft) (ft) (sec/veh) (sec/veh) (sec/veh)
Thru 1,029 92 558 39.7 D
Right 236 35 473 21.8 C
Left 497 56 341 10.9 B
Thru 1,198 56 341 18.6 B
Left 357 91 635 61.6 E
Thru 353 91 640 72.6 E
Right 644 272 1,241 58.8 E
Snelling at Marshall
(vph) (ft) (ft) (sec/veh) (sec/veh) (sec/veh)
Left 47 6 88 46.5 D
Thru 1,003 153 617 39.3 D
Right 80 2 92 22.1 C
Left 48 3 64 51.3 D
Thru 1,564 522 1,058 53.5 D
Right 227 29 441 41.5 D
Left 216 87 396 62.1 E
Thru 349 67 296 42.8 D
Right 85 80 323 38.4 D
Left 73 15 126 35.9 D
Thru 245 46 203 44.4 D
Right 43 47 211 34.0 C
Approach Movement
Simulated
Volume
Average
Queue
Maximum
Queue
Movement
DelayMovement
LOS
Approach
DelayApproach
LOS
Overall
DelayOverall
LOS
Northbound 14.4 B
17.3 B
Southbound 11.0 B
Eastbound 24.9 C
Westbound 55.0 D
Approach
DelayApproach Movement
Overall
DelayOverall
LOS
Simulated
Volume
Average
Queue
Maximum
Queue
Movement
DelayMovement
LOS
Northbound 13.5 B
41.5 DSouthbound 61.5 E
Approach
LOS
Westbound 45.2 D
Approach MovementOverall
LOS
Simulated
Volume
Average
Queue
Maximum
Queue
Movement
DelayMovement
LOS
Southbound 16.3 B
Approach
DelayApproach
LOS
Overall
Delay
Eastbound 63.2 E
Northbound 36.4 D
36.9 D
Approach Movement
Simulated
Volume
Average
Queue
Maximum
Queue
Movement
DelayMovement
LOS
Approach
DelayApproach
LOS
Overall
DelayOverall
LOS
Northbound 38.4 D
46.6 D
Southbound 52.0 D
Eastbound 48.6 D
Westbound 41.4 D
* Results shown are the average of 20 model runs.
** Results shown are from all vehicles except transit vehicles.
H:\Projects\7939\SD\VISSIM\4_RB_TSP\11 MOEs\7939_4_RB_TSP_PM Arterial MOEs.xls 5/3/2013

Year 2013 Scenario 4 Rapid Bus w/TSP VISSIM Model
Snelling Avenue Rapid Bus VISSIM Evaluation
Arterial MOEs (P.M. Peak Hour 4:45 - 5:45)
Snelling at Selby
(vph) (ft) (ft) (sec/veh) (sec/veh) (sec/veh)
Left 26 12 85 99.9 F
Thru 857 172 674 50.5 D
Right 53 180 685 48.0 D
Left 393 231 697 78.4 E
Thru 1,131 47 682 12.9 B
Right 188 49 687 11.1 B
Left 53 15 161 61.4 E
Thru 285 70 424 34.5 C
Right 38 73 431 28.3 C
Left 43 10 93 51.6 D
Thru 204 91 502 39.3 D
Right 210 95 509 31.1 C
Snelling at Summit
(vph) (ft) (ft) (sec/veh) (sec/veh) (sec/veh)
Left 32 2 52 30.3 C
Thru 721 41 336 15.2 B
Right 69 41 336 17.8 B
Left 94 19 238 31.1 C
Thru 985 86 704 23.5 C
Right 128 86 703 23.7 C
Left 68 389 856 256.1 F
Thru 382 378 872 120.7 F
Right 16 387 892 105.8 F
Left 58 33 516 102.2 F
Thru 401 336 612 79.5 E
Right 156 350 630 74.5 E
Snelling at Grand
(vph) (ft) (ft) (sec/veh) (sec/veh) (sec/veh)
Left 71 7 142 27.3 C
Thru 596 77 409 31.0 C
Right 138 80 418 29.1 C
Left 188 25 298 26.8 C
Thru 749 47 522 16.0 B
Right 131 50 539 14.7 B
Left 76 18 299 53.5 D
Thru 423 151 610 43.4 D
Right 64 162 627 37.3 D
Left 94 36 488 68.3 E
Thru 345 201 610 56.2 E
Right 149 213 626 49.6 D
Snelling at St Clair
(vph) (ft) (ft) (sec/veh) (sec/veh) (sec/veh)
Left 55 8 93 35.9 D
Thru 566 13 133 8.1 A
Right 87 1 54 4.8 A
Left 104 13 149 28.1 C
Thru 675 35 269 14.1 B
Right 119 42 286 15.3 B
Left 76 100 553 59.3 E
Thru 310 98 552 40.6 D
Right 42 108 568 30.3 C
Left 77 111 607 50.4 D
Thru 317 109 605 40.5 D
Right 152 122 624 30.6 C
Approach Movement
Simulated
Volume
Average
Queue
Maximum
Queue
Movement
DelayMovement
LOS
Approach
DelayApproach
LOS
Overall
DelayOverall
LOS
Northbound 51.7 D
36.4 D
Southbound 27.7 C
Eastbound 37.7 D
Westbound 36.7 D
Approach Movement
Simulated
Volume
Average
Queue
Maximum
Queue
Movement
DelayMovement
LOS
Approach
DelayApproach
LOS
Overall
DelayOverall
LOS
Northbound 16.0 B
50.5 D
Southbound 24.2 C
Eastbound 139.9 F
Westbound 80.4 F
Approach Movement
Simulated
Volume
Average
Queue
Maximum
Queue
Movement
DelayMovement
LOS
Approach
DelayApproach
LOS
Overall
DelayOverall
LOS
Northbound 30.3 C
33.5 C
Southbound 17.7 B
Eastbound 44.0 D
Westbound 56.5 E
Approach Movement
Simulated
Volume
Average
Queue
Maximum
Queue
Movement
DelayMovement
LOS
Approach
DelayApproach
LOS
Overall
DelayOverall
LOS
Northbound 9.8 A
23.6 C
Southbound 15.9 B
Eastbound 42.9 D
Westbound 39.1 D
* Results shown are the average of 20 model runs.
** Results shown are from all vehicles except transit vehicles.
H:\Projects\7939\SD\VISSIM\4_RB_TSP\11 MOEs\7939_4_RB_TSP_PM Arterial MOEs.xls 5/3/2013

Year 2013 Scenario 4 Rapid Bus w/TSP VISSIM Model
Snelling Avenue Rapid Bus VISSIM Evaluation
Arterial MOEs (P.M. Peak Hour 4:45 - 5:45)
Snelling at Jefferson
(vph) (ft) (ft) (sec/veh) (sec/veh) (sec/veh)
Left 7 22 307 14.4 B
Thru 671 22 310 11.5 B
Right 44 25 322 11.3 B
Left 38 18 196 13.9 B
Thru 755 18 196 7.9 A
Right 1 20 207 12.3 B
Left 11 29 201 54.8 D
Thru 82 29 200 49.5 D
Right 8 40 224 39.5 D
Left 40 57 331 64.2 E
Thru 85 57 329 60.8 E
Right 37 67 348 44.8 D
Snelling at Randolph
(vph) (ft) (ft) (sec/veh) (sec/veh) (sec/veh)
Left 53 5 91 21.4 C
Thru 495 45 285 26.5 C
Right 106 5 166 13.1 B
Left 148 12 202 20.3 C
Thru 545 31 292 17.9 B
Right 117 4 157 9.6 A
Left 123 53 562 50.9 D
Thru 423 140 618 41.3 D
Right 41 1 62 26.4 C
Left 88 13 159 34.5 C
Thru 347 91 578 34.3 C
Right 103 11 348 19.6 B
Snelling at Highland
(vph) (ft) (ft) (sec/veh) (sec/veh) (sec/veh)
Left 8 5 100 8.6 A
Thru 607 5 100 3.3 A
Right 100 7 112 2.9 A
Left 33 11 252 14.8 B
Thru 603 11 252 7.3 A
Right 36 13 259 6.5 A
Left 23 13 139 25.0 C
Thru 75 13 140 24.9 C
Right 18 1 41 6.5 A
Left 110 20 162 34.4 C
Thru 68 9 116 24.1 C
Right 21 12 127 10.5 B
Snelling at Ford
(vph) (ft) (ft) (sec/veh) (sec/veh) (sec/veh)
Left 124 16 169 18.9 B
Thru 446 16 168 6.6 A
Right 5 21 183 4.2 A
Left 13 6 149 8.5 A
Thru 461 6 145 4.8 A
Right 253 4 151 4.8 A
Left 267 24 200 24.9 C
Thru 8 24 201 26.9 C
Right 143 7 151 11.4 B
Left 8 1 43 21.8 C
Thru 5 1 40 21.1 C
Right 3 0 58 5.6 A
Approach Movement
Simulated
Volume
Average
Queue
Maximum
Queue
Movement
DelayMovement
LOS
Approach
DelayApproach
LOS
Overall
DelayOverall
LOS
Northbound 11.5 B
16.4 B
Southbound 8.2 A
Eastbound 49.3 D
Westbound 58.0 E
Approach Movement
Simulated
Volume
Average
Queue
Maximum
Queue
Movement
DelayMovement
LOS
Approach
DelayApproach
LOS
Overall
DelayOverall
LOS
Northbound 23.9 C
27.5 C
Southbound 17.1 B
Eastbound 42.3 D
Westbound 31.5 C
Approach Movement
Simulated
Volume
Average
Queue
Maximum
Queue
Movement
DelayMovement
LOS
Approach
DelayApproach
LOS
Overall
DelayOverall
LOS
Northbound 3.3 A
9.2 A
Southbound 7.6 A
Eastbound 22.1 C
Westbound 28.4 C
Approach Movement
Simulated
Volume
Average
Queue
Maximum
Queue
Movement
DelayMovement
LOS
Approach
DelayApproach
LOS
Overall
DelayOverall
LOS
Northbound 9.2 A
10.2 B
Southbound 4.9 A
Eastbound 20.3 C
Westbound 18.5 B
* Results shown are the average of 20 model runs.
** Results shown are from all vehicles except transit vehicles.
H:\Projects\7939\SD\VISSIM\4_RB_TSP\11 MOEs\7939_4_RB_TSP_PM Arterial MOEs.xls 5/3/2013

Year 2013 Scenario 4 Rapid Bus w/TSP VISSIM Model
Snelling Avenue Rapid Bus VISSIM Evaluation
Arterial MOEs (P.M. Peak Hour 4:45 - 5:45)
Ford at Fairview
(vph) (ft) (ft) (sec/veh) (sec/veh) (sec/veh)
Left 71 14 150 44.9 D
Thru 498 33 362 13.6 B
Right 25 35 372 12.3 B
Left 26 2 50 24.1 C
Thru 464 50 501 17.9 B
Right 181 57 517 16.4 B
Left 143 39 253 52.6 D
Thru 366 29 387 17.8 B
Right 67 2 85 11.0 B
Left 15 1 33 21.6 C
Thru 352 28 259 16.5 B
Right 16 0 51 8.4 A
Ford at Kenneth
(vph) (ft) (ft) (sec/veh) (sec/veh) (sec/veh)
Left 54 32 226 54.8 D
Thru 21 31 227 49.9 D
Right 37 26 227 28.7 C
Left 29 20 162 49.6 D
Thru 26 20 168 47.7 D
Right 43 16 166 22.0 C
Left 46 1 62 7.9 A
Thru 505 6 120 2.5 A
Right 48 7 131 2.2 A
Left 14 0 24 9.8 A
Thru 568 8 149 5.8 A
Right 21 8 152 4.6 A
Ford at Cleveland
(vph) (ft) (ft) (sec/veh) (sec/veh) (sec/veh)
Left 247 79 404 51.9 D
Thru 352 77 458 31.4 C
Right 38 75 454 32.3 C
Left 79 20 464 68.3 E
Thru 403 300 978 71.4 E
Right 169 303 980 76.9 E
Left 158 25 259 30.3 C
Thru 488 61 400 20.4 C
Right 269 62 402 28.9 C
Left 85 14 141 31.6 C
Thru 496 48 293 23.6 C
Right 83 48 295 24.0 C
Ford at Finn
(vph) (ft) (ft) (sec/veh) (sec/veh) (sec/veh)
Left 201 66 299 53.1 D
Thru 10 65 306 32.7 C
Right 176 68 304 10.6 B
Left 114 41 244 42.9 D
Thru 16 41 245 38.6 D
Right 67 41 248 27.9 C
Left 52 3 108 18.0 B
Thru 635 32 329 14.2 B
Right 43 32 338 10.2 B
Left 195 10 143 13.6 B
Thru 659 14 183 6.9 A
Right 52 15 186 5.4 A
Approach Movement
Simulated
Volume
Average
Queue
Maximum
Queue
Movement
DelayMovement
LOS
Approach
DelayApproach
LOS
Overall
DelayOverall
LOS
Northbound 17.3 B
19.4 B
Southbound 17.8 B
Eastbound 25.7 C
Westbound 16.4 B
Approach Movement
Simulated
Volume
Average
Queue
Maximum
Queue
Movement
DelayMovement
LOS
Approach
DelayApproach
LOS
Overall
DelayOverall
LOS
Northbound 45.3 D
9.9 A
Southbound 36.9 D
Eastbound 2.9 A
Westbound 5.9 A
Approach Movement
Simulated
Volume
Average
Queue
Maximum
Queue
Movement
DelayMovement
LOS
Approach
DelayApproach
LOS
Overall
DelayOverall
LOS
Northbound 39.4 D
38.8 D
Southbound 72.5 E
Eastbound 24.6 C
Westbound 24.7 C
Approach Movement
Simulated
Volume
Average
Queue
Maximum
Queue
Movement
DelayMovement
LOS
Approach
DelayApproach
LOS
Overall
DelayOverall
LOS
Northbound 33.2 C
17.2 B
Southbound 37.5 D
Eastbound 14.2 B
Westbound 8.3 A
* Results shown are the average of 20 model runs.
** Results shown are from all vehicles except transit vehicles.
H:\Projects\7939\SD\VISSIM\4_RB_TSP\11 MOEs\7939_4_RB_TSP_PM Arterial MOEs.xls 5/3/2013

Year 2013 Scenario 4 Rapid Bus w/TSP VISSIM Model
Snelling Avenue Rapid Bus VISSIM Evaluation
Arterial MOEs (P.M. Peak Hour 4:45 - 5:45)
Ford at Cretin
(vph) (ft) (ft) (sec/veh) (sec/veh) (sec/veh)
Left 172 51 257 48.1 D
Right 111 3 68 5.6 A
Left 111 4 119 13.7 B
Thru 559 7 145 5.0 A
Thru 783 27 246 8.8 A
Right 145 28 247 15.4 B
46th at 46th
(vph) (ft) (ft) (sec/veh) (sec/veh) (sec/veh)
Left 14 16 148 53.6 D
Thru 39 16 143 53.0 D
Right 252 0 20 3.0 A
Left 81 21 169 42.6 D
Thru 31 12 105 52.4 D
Right 10 9 104 66.7 E
Left 26 1 49 10.4 B
Thru 338 18 159 11.0 B
Right 50 25 175 16.6 B
Left 299 16 249 16.2 B
Thru 475 12 207 9.7 A
Right 118 4 156 9.4 A
46th at 42nd
(vph) (ft) (ft) (sec/veh) (sec/veh) (sec/veh)
Left 5 2 45 35.2 D
Thru 6 2 46 32.0 C
Right 4 1 50 5.8 A
Left 37 12 145 32.4 C
Thru 5 11 145 33.3 C
Right 58 10 144 13.8 B
Left 85 11 159 26.4 C
Thru 372 21 197 16.1 B
Right 5 26 213 12.9 B
Left 3 0 15 10.2 B
Thru 460 9 185 6.6 A
Right 34 11 192 5.9 A
46th at Minnehaha
(vph) (ft) (ft) (sec/veh) (sec/veh) (sec/veh)
Left 42 68 436 44.9 D
Thru 271 67 430 36.8 D
Right 66 65 428 24.2 C
Left 120 693 1,339 165.5 F
Thru 306 679 1,333 150.5 F
Right 118 678 1,331 140.1 F
Left 173 21 190 25.9 C
Thru 277 17 198 13.4 B
Right 15 22 211 13.6 B
Left 82 15 148 35.4 D
Thru 353 49 289 31.3 C
Right 91 50 290 26.6 C
Approach MovementOverall
LOS
Simulated
Volume
Average
Queue
Maximum
Queue
Movement
DelayMovement
LOS
11.9 B
Southbound 31.4 C
Approach
DelayApproach
LOS
Overall
Delay
Eastbound 6.5 A
Westbound 9.8 A
Approach Movement
Simulated
Volume
Average
Queue
Maximum
Queue
Movement
DelayMovement
LOS
Approach
DelayApproach
LOS
Overall
DelayOverall
LOS
Northbound 11.6 B
14.2 B
Southbound 47.1 D
Eastbound 11.6 B
Westbound 11.9 B
Approach Movement
Simulated
Volume
Average
Queue
Maximum
Queue
Movement
DelayMovement
LOS
Approach
DelayApproach
LOS
Overall
DelayOverall
LOS
Northbound 26.1 C
13.2 B
Southbound 21.7 C
Eastbound 18.0 B
Westbound 6.6 A
Approach Movement
Simulated
Volume
Average
Queue
Maximum
Queue
Movement
DelayMovement
LOS
Approach
DelayApproach
LOS
Overall
DelayOverall
LOS
Northbound 35.5 D
63.0 E
Southbound 151.6 F
Eastbound 18.0 B
Westbound 31.1 C
* Results shown are the average of 20 model runs.
** Results shown are from all vehicles except transit vehicles.
H:\Projects\7939\SD\VISSIM\4_RB_TSP\11 MOEs\7939_4_RB_TSP_PM Arterial MOEs.xls 5/3/2013

Year 2013 Scenario 4 Rapid Bus w/TSP VISSIM Model
Snelling Avenue Rapid Bus VISSIM Evaluation
Arterial MOEs (P.M. Peak Hour 4:45 - 5:45)
46th at Hiawatha
(vph) (ft) (ft) (sec/veh) (sec/veh) (sec/veh)
Left 85 20 140 41.6 D
Thru 808 69 356 27.4 C
Right 243 0 0 2.7 A
Left 145 34 192 40.5 D
Thru 859 65 345 24.5 C
Right 39 0 0 2.2 A
Left 52 6 86 25.1 C
Thru 77 18 123 34.2 C
Right 22 18 123 34.6 C
Left 201 50 352 42.3 D
Thru 145 20 256 25.2 C
Right 166 6 182 11.8 B
46th at 36th
(vph) (ft) (ft) (sec/veh) (sec/veh) (sec/veh)
Left 1 0 29 9.0 A
Thru 2 0 27 11.1 B
Right 0 - - - A
Left 36 1 58 6.5 A
Thru 1 1 58 7.1 A
Right 5 1 66 4.2 A
Left 5 0 21 5.0 A
Thru 115 1 74 4.8 A
Right 1 2 99 2.0 A
Left 0 - - - A
Thru 241 3 149 3.4 A
Right 28 0 50 2.1 A
Approach Movement
Simulated
Volume
Average
Queue
Maximum
Queue
Movement
DelayMovement
LOS
C
Approach
DelayApproach
LOS
Overall
DelayOverall
LOS
C
C
Northbound 23.2 C
25.4 C
Southbound 25.9
Movement
Eastbound 31.1
27.6Westbound
Simulated
Volume
Average
Queue
Maximum
Queue
Movement
DelayMovement
LOS
Approach
Delay
A
Southbound 6.2 A
Eastbound
Approach
LOS
Overall
DelayOverall
LOSApproach
4.8 A
Westbound 3.3 A
Northbound 10.1 B
4.0
* Results shown are the average of 20 model runs.
** Results shown are from all vehicles except transit vehicles.
H:\Projects\7939\SD\VISSIM\4_RB_TSP\11 MOEs\7939_4_RB_TSP_PM Arterial MOEs.xls 5/3/2013

Table X –Overall Average Delay Per Vehicle Summary
Baseline
Rapid Bus
Alpha
Rapid Bus Beta
Rapid Bus
Refined
Rapid Bus
Refined w/ TSP
Baseline
Rapid Bus
Alpha
Rapid Bus Beta
Rapid Bus
Refined
Rapid Bus
Refined w/ TSP
1 County Road B2 at Snelling Ave. W. Ramps 14.0 13.9 13.9 13.9 14.1 29.1 29.4 29.5 29.4 30.7 2 County Road B2 at Snelling Ave. E. Ramps 5.1 5.2 5.2 5.1 5.5 11.6 11.9 11.9 11.9 11.8 3 Snelling Avenue at County Road B 33.7 33.9 33.9 33.9 34.9 71.4 73.9 73.9 73.5 87.5 4 Snelling Avenue at Har Mar Mall 11.5 11.6 11.6 11.7 12.0 14.3 14.4 14.4 14.2 14.8 5 Snelling Avenue at Roselawn Avenue 13.0 13.0 13.0 13.1 13.6 24.6 24.0 23.9 23.5 26.8 6 Snelling Avenue at Larpenteur Avenue 96.2 95.7 95.8 95.6 105.5 65.5 64.9 65.9 66.2 88.3 7 Snelling Avenue at Hoyt Avenue 6.2 6.2 6.3 6.4 6.5 9.3 8.9 10.3 10.1 7.6 8 Snelling Avenue at Midway Parkway 7.0 6.9 6.9 6.9 6.9 11.6 11.5 11.5 11.4 11.1 9 Snelling Avenue at Hewitt Avenue 11.7 11.9 11.9 11.6 12.0 17.1 16.9 17.1 16.8 17.2
10 Snelling Avenue at Minnehaha Avenue 13.1 13.3 13.1 13.1 13.9 23.5 23.4 24.3 24.0 25.6 11 Snelling Avenue at Thomas Avenue 12.4 12.7 12.7 12.7 12.5 27.5 26.8 28.3 28.4 23.2 12 Snelling Avenue at University Avenue 32.5 31.6 31.8 31.9 36.0 71.9 76.2 74.3 75.1 122.5 13 Snelling Avenue at Spruce Tree Avenue 6.2 6.1 6.4 6.0 5.4 29.6 34.1 29.1 35.1 17.3 14 Snelling Ave. at St Anthony Ave. (I-94 N. Ramps) 20.9 20.8 21.1 20.6 20.5 43.6 44.2 44.5 45.8 41.5 15 Snelling Ave. at Concordia Ave. (I-94 S. Ramps) 15.6 15.5 15.6 15.6 16.6 42.5 45.7 44.1 44.3 36.9 16 Snelling Avenue at Marshall Avenue 27.1 26.9 27.6 28.0 26.2 49.3 52.1 50.8 50.9 46.6 17 Snelling Avenue at Selby Avenue 42.4 41.5 46.1 50.5 47.0 36.9 40.1 42.5 43.0 36.4 18 Snelling Avenue at Summit Avenue 20.1 20.3 20.3 20.1 21.3 27.8 27.9 28.1 27.9 50.5 19 Snelling Avenue at Grand Avenue 23.5 23.8 23.5 23.8 30.1 27.5 27.8 27.7 27.8 33.5 20 Snelling Avenue at St. Clair Avenue 14.6 14.7 14.7 14.8 18.8 18.4 18.5 18.7 18.7 23.6 21 Snelling Avenue at Jefferson Avenue 11.2 11.3 11.2 11.2 13.4 14.6 14.4 14.4 14.5 16.4 22 Snelling Avenue at Randolph Avenue 26.9 26.9 27.1 27.1 31.4 25.2 25.3 25.2 25.3 27.5 23 Snelling Avenue at Highland Parkway 9.3 9.4 9.3 9.3 10.5 8.7 8.8 8.8 8.7 9.2 24 Snelling Avenue at Ford Parkway 7.6 7.6 7.5 7.6 8.2 9.4 9.6 9.7 9.6 10.2 25 Ford Parkway at Fairview Avenue 12.4 12.7 12.5 12.6 12.7 18.7 19.6 19.5 19.6 19.4 26 Ford Parkway at Kenneth Street 8.0 8.2 8.1 8.1 8.4 9.5 9.6 9.6 9.7 9.9 27 Ford Parkway at Cleveland Avenue 16.8 17.0 17.1 17.0 17.5 31.3 32.0 32.0 31.8 38.8 28 Ford Parkway at Finn Street 5.8 5.8 5.9 6.0 5.8 16.6 17.0 17.0 16.8 17.2 29 Ford Parkway at Cretin Avenue 7.5 7.6 7.5 7.6 7.6 11.5 11.7 11.9 11.9 11.9 30 46th Street at 46th Avenue 16.4 16.3 16.3 16.2 16.1 14.2 14.4 14.5 14.4 14.2 31 46th Street at 42nd Avenue 18.2 18.2 18.2 18.3 16.3 14.5 14.6 14.5 14.6 13.2 32 46th Street at Minnehaha Avenue 22.3 22.4 22.4 22.2 21.8 45.2 47.3 43.6 46.5 63.0 33 TH 55 (Hiawatha Avenue) at 46th Street 21.7 22.0 21.7 21.7 21.6 25.6 25.6 25.6 25.4 25.4 34 46th Street at 36th Avenue 4.9 5.0 5.1 5.1 5.3 3.5 3.8 3.7 3.7 4.0
AM Peak Hour
Signalized IntersectionNo.
PM Peak Hour
Snelling Avenue Rapid Bus VISSIM Evaluation5/15/2013
DRAFT Final ReportPage __

Year 2013 Scenario 3A Refined Rapid Bus Conditions VISSIM Model
Snelling Avenue Rapid Bus VISSIM Evaluation
Person Delay (A.M. Peak Hour 7:30 - 8:30)
Co B2 at Snelling W Ramps
(vph) (sec/veh) (hrs) (hrs) (hrs)
Left 11 29.9 0.09 14 0.1
Thru 21 32.9 6 5.3 0.19 92 0.8
Right 6 1.6 0.00 9 0.0
Left 20 37.3 0.21 25 0.3
Thru 33 34.9 0.32 42 0.4
Right 37 2.5 0.03 50 0.0
Left 22 36.8 0.22 28 0.3
Thru 101 7.0 0.20 128 0.2
Right 14 3.6 0.01 16 0.0
Left 118 42.6 6 9.4 1.40 247 2.9
Thru 446 6.4 0.79 576 1.0
Right 78 1.3 0.03 122 0.0
Co B2 at Snelling E Ramps
(vph) (sec/veh) (hrs) (hrs) (hrs)
Left 50 31.9 0.44 62 0.6
Right 148 9.1 6 9.4 0.37 299 0.8
Left 13 4.1 0.01 17 0.0
Thru 114 1.3 0.04 144 0.1
Thru 492 2.3 0.32 642 0.4
Right 30 1.4 0.01 39 0.0
Snelling at Co B
(vph) (sec/veh) (hrs) (hrs) (hrs)
Left 134 86.9 3.24 175 4.2
Thru 881 5.5 6 9.4 1.35 1,233 1.9
Right 83 2.1 0.05 105 0.1
Left 153 87.7 3.73 213 5.2
Thru 1,539 25.2 6 5.3 10.78 2,067 14.5
Right 333 18.3 1.69 438 2.2
Left 103 82.4 2.37 130 3.0
Thru 237 85.2 5.61 307 7.3
Right 46 14.7 0.19 59 0.2
Left 137 67.3 2.57 175 3.3
Thru 270 81.5 6.12 353 8.0
Right 128 12.5 0.45 181 0.6
Snelling at HarMar
(vph) (sec/veh) (hrs) (hrs) (hrs)
Left 56 83.0 1.28 72 1.7
Thru 954 9.4 6 9.4 2.50 1,328 3.5
Right 57 1.6 0.02 71 0.0
Left 58 68.9 1.12 77 1.5
Thru 1,598 2.4 6 5.3 1.05 2,139 1.4
Right 69 2.5 0.05 88 0.1
Left 64 81.3 1.46 84 1.9
Thru 31 82.5 0.72 41 0.9
Right 112 13.9 0.43 145 0.6
Left 39 88.4 0.95 50 1.2
Thru 18 85.9 0.43 22 0.5
Right 78 8.1 0.17 96 0.2
Approach
Rapid Bus
Volume
Rapid Bus
Passengers/B
us
Simulated
Volume
Movement
DelayTotal
Persons
Rapid Bus
Volume
6.2
Southbound
Eastbound
Approach
Person
Delay
Westbound
Northbound
Total
Persons
Person
Delay
Movement
Movement
Total Delay
1.8
Southbound
Eastbound
Simulated
Volume
Movement
Delay
Rapid Bus
Passengers/B
us
Total Delay
Total Delay Total
Persons
Total Delay Total
Persons
Person
Delay
Simulated
Volume
Movement
Delay
Rapid Bus
Volume
Rapid Bus
Passengers/B
us
Rapid Bus
Volume
Rapid Bus
Passengers/B
us
Simulated
Volume
Person
Delay
Westbound
Approach Movement
Northbound
50.5
Southbound
Eastbound
Westbound
Approach Movement
Movement
Delay
Northbound
13.5
Southbound
Eastbound
Westbound
Person
Delay
Person
Delay
Person
Delay
Person
Delay
* Results shown are the average of 5 model runs.
** Results shown are from all vehicles except transit vehicles.
H:\Projects\7939\SD\VISSIM\3A_RB_Refined\11 MOEs\7939_3A_Refined_RB_AM PersonDelay.xls 7/2/2013

Year 2013 Scenario 3A Refined Rapid Bus Conditions VISSIM Model
Snelling Avenue Rapid Bus VISSIM Evaluation
Person Delay (A.M. Peak Hour 7:30 - 8:30)
Snelling at Roselawn
(vph) (sec/veh) (hrs) (hrs) (hrs)
Left 10 73.5 0.21 14 0.3
Thru 942 4.9 6 9.4 1.28 1,310 1.8
Right 10 3.2 0.01 11 0.0
Left 32 116.5 1.05 41 1.3
Thru 1,672 2.6 6 5.3 1.21 2,232 1.6
Right 47 2.3 0.03 62 0.0
Left 24 122.4 0.82 32 1.1
Thru 42 112.1 1.31 54 1.7
Right 76 13.1 0.28 100 0.4
Left 47 104.2 1.37 60 1.7
Thru 113 106.3 3.35 147 4.4
Right 102 15.4 0.44 133 0.6
Snelling at Larpenteur
(vph) (sec/veh) (hrs) (hrs) (hrs)
Left 182 77.7 3.93 235 5.1
Thru 789 17.1 6 9.4 3.75 1,109 5.3
Right 40 4.2 0.05 54 0.1
Left 48 130.3 1.74 60 2.2
Thru 1,620 26.2 6 5.3 11.79 2,167 15.8
Right 121 13.6 0.46 160 0.6
Left 83 73.2 1.69 111 2.2
Thru 192 66.2 3.53 249 4.6
Right 21 55.8 0.33 27 0.4
Left 222 282.6 17.44 285 22.4
Thru 712 291.3 57.62 921 74.5
Right 90 286.8 7.15 116 9.3
Snelling at Hoyt
(vph) (sec/veh) (hrs) (hrs) (hrs)
Left 14 21.1 0.08 19 0.1
Thru 923 5.4 6 9.4 1.38 1,282 1.9
Right 30 2.9 0.02 35 0.0
Left 16 6.6 0.03 21 0.0
Thru 1,833 2.2 6 5.3 1.10 2,440 1.5
Right 14 4.0 0.02 18 0.0
Left 10 73.1 0.20 13 0.3
Thru 7 88.5 0.17 9 0.2
Right 8 20.1 0.04 11 0.1
Left 73 87.2 1.78 96 2.3
Thru 9 75.3 0.18 11 0.2
Right 77 16.3 0.35 100 0.5
Snelling at Midway
(vph) (sec/veh) (hrs) (hrs) (hrs)
Left 44 23.0 0.28 56 0.4
Thru 940 5.7 6 9.4 1.48 1,302 2.1
Right 21 2.8 0.02 27 0.0
Left 43 8.1 0.10 55 0.1
Thru 1,820 3.8 6 5.3 1.94 2,426 2.6
Right 51 4.4 0.06 66 0.1
Left 0 - - 0 -
Thru 13 80.9 0.30 18 0.4
Right 3 10.4 0.01 4 0.0
Left 45 78.6 0.98 60 1.3
Thru 26 84.5 0.61 33 0.8
Right 23 6.9 0.04 29 0.1
Total Delay Total
Persons
Person
Delay
Rapid Bus
Volume
Rapid Bus
Passengers/B
us
Total Delay Total
Persons
Rapid Bus
Volume
Rapid Bus
Passengers/B
us
Person
Delay
Rapid Bus
Volume
Rapid Bus
Passengers/B
us
Total Delay Total
Persons
Person
Delay
Rapid Bus
Volume
Rapid Bus
Passengers/B
us
Total Delay Total
Persons
Person
Delay
Movement
Delay
Approach Movement
Simulated
Volume
Movement
Delay
Northbound
14.8
Southbound
Eastbound
Westbound
Movement
Simulated
Volume
Approach Movement
Simulated
Volume
Movement
Delay
Simulated
Volume
Movement
Delay
Northbound
142.3
Southbound
Eastbound
Westbound
Approach Movement
Northbound
7.1
Southbound
Eastbound
Westbound
Approach
Northbound
7.8
Southbound
Eastbound
Westbound
Person
Delay
Person
Delay
Person
Delay
Person
Delay
* Results shown are the average of 5 model runs.
** Results shown are from all vehicles except transit vehicles.
H:\Projects\7939\SD\VISSIM\3A_RB_Refined\11 MOEs\7939_3A_Refined_RB_AM PersonDelay.xls 7/2/2013
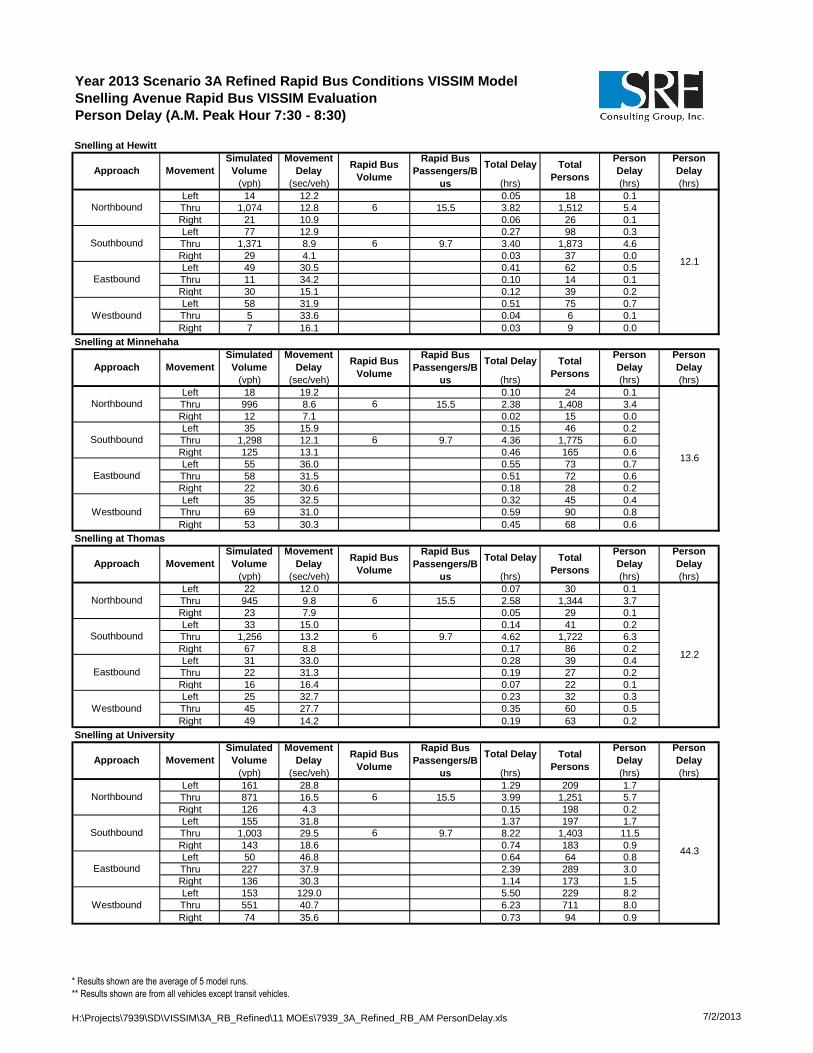
Year 2013 Scenario 3A Refined Rapid Bus Conditions VISSIM Model
Snelling Avenue Rapid Bus VISSIM Evaluation
Person Delay (A.M. Peak Hour 7:30 - 8:30)
Snelling at Hewitt
(vph) (sec/veh) (hrs) (hrs) (hrs)
Left 14 12.2 0.05 18 0.1
Thru 1,074 12.8 6 15.5 3.82 1,512 5.4
Right 21 10.9 0.06 26 0.1
Left 77 12.9 0.27 98 0.3
Thru 1,371 8.9 6 9.7 3.40 1,873 4.6
Right 29 4.1 0.03 37 0.0
Left 49 30.5 0.41 62 0.5
Thru 11 34.2 0.10 14 0.1
Right 30 15.1 0.12 39 0.2
Left 58 31.9 0.51 75 0.7
Thru 5 33.6 0.04 6 0.1
Right 7 16.1 0.03 9 0.0
Snelling at Minnehaha
(vph) (sec/veh) (hrs) (hrs) (hrs)
Left 18 19.2 0.10 24 0.1
Thru 996 8.6 6 15.5 2.38 1,408 3.4
Right 12 7.1 0.02 15 0.0
Left 35 15.9 0.15 46 0.2
Thru 1,298 12.1 6 9.7 4.36 1,775 6.0
Right 125 13.1 0.46 165 0.6
Left 55 36.0 0.55 73 0.7
Thru 58 31.5 0.51 72 0.6
Right 22 30.6 0.18 28 0.2
Left 35 32.5 0.32 45 0.4
Thru 69 31.0 0.59 90 0.8
Right 53 30.3 0.45 68 0.6
Snelling at Thomas
(vph) (sec/veh) (hrs) (hrs) (hrs)
Left 22 12.0 0.07 30 0.1
Thru 945 9.8 6 15.5 2.58 1,344 3.7
Right 23 7.9 0.05 29 0.1
Left 33 15.0 0.14 41 0.2
Thru 1,256 13.2 6 9.7 4.62 1,722 6.3
Right 67 8.8 0.17 86 0.2
Left 31 33.0 0.28 39 0.4
Thru 22 31.3 0.19 27 0.2
Right 16 16.4 0.07 22 0.1
Left 25 32.7 0.23 32 0.3
Thru 45 27.7 0.35 60 0.5
Right 49 14.2 0.19 63 0.2
Snelling at University
(vph) (sec/veh) (hrs) (hrs) (hrs)
Left 161 28.8 1.29 209 1.7
Thru 871 16.5 6 15.5 3.99 1,251 5.7
Right 126 4.3 0.15 198 0.2
Left 155 31.8 1.37 197 1.7
Thru 1,003 29.5 6 9.7 8.22 1,403 11.5
Right 143 18.6 0.74 183 0.9
Left 50 46.8 0.64 64 0.8
Thru 227 37.9 2.39 289 3.0
Right 136 30.3 1.14 173 1.5
Left 153 129.0 5.50 229 8.2
Thru 551 40.7 6.23 711 8.0
Right 74 35.6 0.73 94 0.9
Rapid Bus
Volume
Rapid Bus
Passengers/B
us
Total Delay Total
Persons
Person
Delay
Rapid Bus
Volume
Rapid Bus
Passengers/B
us
Total Delay Total
Persons
Person
Delay
Rapid Bus
Volume
Rapid Bus
Passengers/B
us
Total Delay Total
Persons
Person
Delay
Rapid Bus
Volume
Rapid Bus
Passengers/B
us
Total Delay Total
Persons
Person
Delay
Simulated
Volume
Movement
DelayApproach Movement
Northbound
12.1
Southbound
Simulated
Volume
Movement
Delay
Eastbound
Westbound
Approach Movement
Simulated
Volume
Movement
Delay
Northbound
13.6
Southbound
Eastbound
Westbound
Approach Movement
Northbound
12.2
Southbound
Eastbound
Westbound
Approach Movement
Simulated
Volume
Movement
Delay
Northbound
44.3
Southbound
Eastbound
Westbound
Person
Delay
Person
Delay
Person
Delay
Person
Delay
* Results shown are the average of 5 model runs.
** Results shown are from all vehicles except transit vehicles.
H:\Projects\7939\SD\VISSIM\3A_RB_Refined\11 MOEs\7939_3A_Refined_RB_AM PersonDelay.xls 7/2/2013

Year 2013 Scenario 3A Refined Rapid Bus Conditions VISSIM Model
Snelling Avenue Rapid Bus VISSIM Evaluation
Person Delay (A.M. Peak Hour 7:30 - 8:30)
Snelling at Spruce Tree
(vph) (sec/veh) (hrs) (hrs) (hrs)
Left 66 10.7 0.19 86 0.3
Thru 1,108 5.7 6 36.8 1.74 1,717 2.7
Right 54 2.1 0.03 70 0.0
Left 18 14.4 0.07 23 0.1
Thru 1,227 2.9 6 9.9 0.99 1,723 1.4
Right 51 2.2 0.03 65 0.0
Left 19 49.3 0.27 27 0.4
Thru 0 73.1 0.01 1 0.0
Right 61 7.4 0.13 79 0.2
Left 47 44.7 0.58 60 0.7
Thru 22 47.1 0.29 30 0.4
Right 36 16.8 0.17 47 0.2
Snelling at St Anthony
(vph) (sec/veh) (hrs) (hrs) (hrs)
Left 877 13.5 3.28 1,138 4.3
Thru 825 8.6 6 36.8 1.96 1,355 3.2
Thru 937 37.1 6 9.9 9.66 1,344 13.9
Right 403 10.5 1.17 528 1.5
Left 214 32.1 1.91 279 2.5
Thru 526 34.4 5.02 681 6.5
Right 392 8.3 0.91 504 1.2
Snelling at Concordia
(vph) (sec/veh) (hrs) (hrs) (hrs)
Thru 1,371 19.2 6 36.8 7.32 2,061 11.0
Right 414 11.5 1.32 564 1.8
Left 494 10.0 1.37 641 1.8
Thru 642 5.2 6 9.9 0.93 960 1.4
Left 327 39.0 3.54 427 4.6
Thru 164 36.6 1.67 216 2.2
Right 413 3.4 0.39 541 0.5
Snelling at Marshall
(vph) (sec/veh) (hrs) (hrs) (hrs)
Left 67 35.8 0.67 88 0.9
Thru 1,472 30.7 6 36.8 12.54 2,159 18.4
Right 50 13.6 0.19 66 0.2
Left 26 26.6 0.19 32 0.2
Thru 795 24.7 6 9.9 5.45 1,134 7.8
Right 228 11.7 0.74 325 1.1
Left 273 40.0 3.03 414 4.6
Thru 210 25.8 1.50 268 1.9
Right 58 14.4 0.23 76 0.3
Left 47 19.9 0.26 59 0.3
Thru 329 31.7 2.89 428 3.8
Right 47 24.8 0.33 60 0.4
Rapid Bus
Volume
Rapid Bus
Passengers/B
us
Total Delay Total
Persons
Person
Delay
Rapid Bus
Volume
Rapid Bus
Passengers/B
us
Total Delay Total
Persons
Person
Delay
Rapid Bus
Volume
Rapid Bus
Passengers/B
us
Person
Delay
Total Delay
Rapid Bus
Volume
Rapid Bus
Passengers/B
us
Total Delay Total
Persons
Total
Persons
6.4
Southbound
Eastbound
Westbound
Approach
Simulated
Volume
Movement
Delay
Northbound
Movement
Simulated
Volume
Movement
Delay
Northbound
33.0Southbound
Westbound
Approach Movement
23.3
Approach Movement
Person
Delay
Simulated
Volume
Movement
Delay
Southbound
Eastbound
Northbound
Simulated
Volume
Movement
Delay
Northbound
39.9
Southbound
Eastbound
Westbound
Approach
Person
DelayMovement
Person
Delay
Person
Delay
Person
Delay
* Results shown are the average of 5 model runs.
** Results shown are from all vehicles except transit vehicles.
H:\Projects\7939\SD\VISSIM\3A_RB_Refined\11 MOEs\7939_3A_Refined_RB_AM PersonDelay.xls 7/2/2013

Year 2013 Scenario 3A Refined Rapid Bus Conditions VISSIM Model
Snelling Avenue Rapid Bus VISSIM Evaluation
Person Delay (A.M. Peak Hour 7:30 - 8:30)
Snelling at Selby
(vph) (sec/veh) (hrs) (hrs) (hrs)
Left 12 73.3 0.25 15 0.3
Thru 1,075 74.8 6 36.8 22.35 1,651 34.3
Right 22 66.5 0.40 29 0.5
Left 229 66.5 4.24 298 5.5
Thru 646 14.6 6 9.9 2.61 941 3.8
Right 28 11.7 0.09 37 0.1
Left 67 161.6 3.03 89 4.0
Thru 147 42.7 1.75 191 2.3
Right 13 31.6 0.11 16 0.1
Left 31 32.4 0.28 41 0.4
Thru 174 37.6 1.82 226 2.4
Right 452 29.5 3.71 583 4.8
Snelling at Summit
(vph) (sec/veh) (hrs) (hrs) (hrs)
Left 41 9.8 0.11 53 0.1
Thru 917 5.0 6 36.8 1.28 1,442 2.0
Right 32 6.4 0.06 41 0.1
Left 40 28.5 0.32 51 0.4
Thru 550 21.2 6 9.9 3.24 816 4.8
Right 101 21.7 0.61 132 0.8
Left 49 54.8 0.74 63 1.0
Thru 178 25.1 1.24 229 1.6
Right 13 19.6 0.07 17 0.1
Left 64 39.5 0.70 83 0.9
Thru 357 41.3 4.10 461 5.3
Right 146 35.2 1.43 191 1.9
Snelling at Grand
(vph) (sec/veh) (hrs) (hrs) (hrs)
Left 44 11.6 0.14 57 0.2
Thru 764 14.2 6 36.8 3.02 1,244 4.9
Right 55 13.0 0.20 75 0.3
Left 98 29.9 0.81 129 1.1
Thru 422 17.4 6 9.9 2.04 646 3.1
Right 102 12.3 0.35 134 0.5
Left 46 26.8 0.34 59 0.4
Thru 184 27.7 1.42 243 1.9
Right 23 21.2 0.14 30 0.2
Left 82 39.3 0.89 105 1.1
Thru 298 46.6 3.86 379 4.9
Right 176 39.5 1.93 227 2.5
Snelling at St Clair
(vph) (sec/veh) (hrs) (hrs) (hrs)
Left 39 12.0 0.13 49 0.2
Thru 646 6.7 6 22.9 1.19 1,010 1.9
Right 43 4.4 0.05 55 0.1
Left 46 13.3 0.17 60 0.2
Thru 450 7.2 6 8.8 0.90 672 1.4
Right 30 6.5 0.05 41 0.1
Left 47 33.2 0.43 61 0.6
Thru 217 25.4 1.53 278 2.0
Right 39 12.9 0.14 50 0.2
Left 68 37.2 0.71 86 0.9
Thru 256 29.9 2.12 332 2.8
Right 179 20.3 1.01 235 1.3
Rapid Bus
Volume
Rapid Bus
Passengers/B
us
Total Delay
Rapid Bus
Volume
Rapid Bus
Passengers/B
us
Total DelayPerson
DelayTotal
Persons
Person
Delay
Rapid Bus
Volume
Rapid Bus
Passengers/B
us
Total Delay Total
Persons
Person
Delay
Total
Persons
Rapid Bus
Volume
Rapid Bus
Passengers/B
us
Total Delay Total
Persons
Person
Delay
58.5
Southbound
Eastbound
Westbound
Approach Movement
Simulated
Volume
Movement
Delay
Northbound
Simulated
Volume
Movement
Delay
Northbound
18.9
Southbound
Eastbound
Westbound
Approach Movement
21.1
Southbound
Eastbound
Westbound
Approach Movement
Simulated
Volume
Movement
Delay
Northbound
Simulated
Volume
Movement
Delay
Northbound
11.4
Southbound
Eastbound
Westbound
Approach Movement
Person
Delay
Person
Delay
Person
Delay
Person
Delay
* Results shown are the average of 5 model runs.
** Results shown are from all vehicles except transit vehicles.
H:\Projects\7939\SD\VISSIM\3A_RB_Refined\11 MOEs\7939_3A_Refined_RB_AM PersonDelay.xls 7/2/2013

Year 2013 Scenario 3A Refined Rapid Bus Conditions VISSIM Model
Snelling Avenue Rapid Bus VISSIM Evaluation
Person Delay (A.M. Peak Hour 7:30 - 8:30)
Snelling at Jefferson
(vph) (sec/veh) (hrs) (hrs) (hrs)
Left 5 18.3 0.02 5 0.0
Thru 647 10.7 6 22.9 1.92 1,008 3.0
Right 25 8.7 0.06 31 0.1
Left 16 7.2 0.03 20 0.0
Thru 544 3.4 6 8.8 0.52 793 0.8
Right 4 4.4 0.00 5 0.0
Left 19 32.5 0.17 24 0.2
Thru 59 28.6 0.47 75 0.6
Right 7 14.1 0.03 9 0.0
Left 62 31.1 0.54 82 0.7
Thru 66 34.1 0.63 87 0.8
Right 54 21.2 0.32 70 0.4
Snelling at Randolph
(vph) (sec/veh) (hrs) (hrs) (hrs)
Left 64 17.5 0.31 80 0.4
Thru 487 24.2 6 22.9 3.27 801 5.4
Right 33 8.5 0.08 44 0.1
Left 98 16.2 0.44 127 0.6
Thru 352 19.3 6 6.6 1.88 530 2.8
Right 156 11.7 0.51 201 0.7
Left 101 44.1 1.23 133 1.6
Thru 364 35.8 3.62 474 4.7
Right 44 18.2 0.22 56 0.3
Left 60 35.8 0.59 78 0.8
Thru 407 37.9 4.28 521 5.5
Right 88 21.4 0.53 111 0.7
Snelling at Highland
(vph) (sec/veh) (hrs) (hrs) (hrs)
Left 3 5.3 0.00 4 0.0
Thru 489 3.6 6 10.0 0.49 725 0.7
Right 152 3.2 0.14 195 0.2
Left 20 10.3 0.06 26 0.1
Thru 426 6.1 6 6.6 0.72 626 1.1
Right 12 5.2 0.02 14 0.0
Left 37 22.3 0.23 48 0.3
Thru 93 23.0 0.60 121 0.8
Right 9 7.0 0.02 12 0.0
Left 124 30.5 1.05 163 1.4
Thru 61 21.6 0.37 79 0.5
Right 61 8.7 0.15 78 0.2
Snelling at Ford
(vph) (sec/veh) (hrs) (hrs) (hrs)
Left 76 11.9 0.25 98 0.3
Thru 440 4.8 0.59 566 0.8
Right 5 3.3 0.00 7 0.0
Left 2 4.8 0.00 2 0.0
Thru 390 2.5 0.27 506 0.4
Right 171 2.9 6 6.6 0.14 300 0.2
Left 202 24.8 6 10.0 1.40 356 2.5
Thru 3 23.9 0.02 4 0.0
Right 76 8.1 0.17 102 0.2
Left 8 22.0 0.05 10 0.1
Thru 5 17.8 0.02 6 0.0
Right 2 5.2 0.00 3 0.0
Rapid Bus
Volume
Rapid Bus
Passengers/B
us
Total Delay Total
Persons
Person
Delay
Rapid Bus
Volume
Rapid Bus
Passengers/B
us
Total DelayPerson
Delay
Rapid Bus
Volume
Rapid Bus
Passengers/B
us
Total Delay Total
Persons
Person
Delay
Person
Delay
Rapid Bus
Volume
Rapid Bus
Passengers/B
us
Total DelayPerson
DelayTotal
Persons
Total
Persons
6.7
Southbound
Eastbound
Westbound
Approach Movement
Simulated
Volume
Movement
Delay
Northbound
Simulated
Volume
Movement
Delay
Northbound
23.5
Southbound
Eastbound
Westbound
Approach Movement
5.2
Southbound
Eastbound
Westbound
Approach Movement
Simulated
Volume
Movement
Delay
Northbound
Simulated
Volume
Movement
Delay
Northbound
4.5
Southbound
Eastbound
Westbound
Approach
Person
DelayMovement
Person
Delay
Person
Delay
* Results shown are the average of 5 model runs.
** Results shown are from all vehicles except transit vehicles.
H:\Projects\7939\SD\VISSIM\3A_RB_Refined\11 MOEs\7939_3A_Refined_RB_AM PersonDelay.xls 7/2/2013
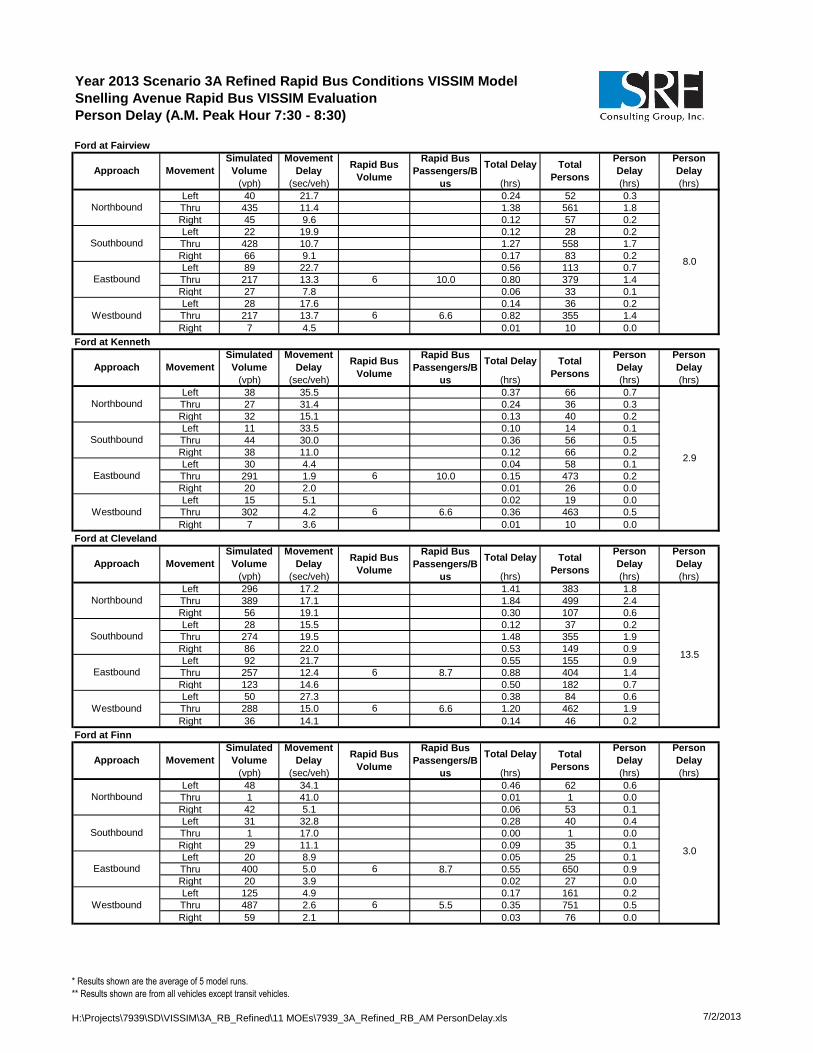
Year 2013 Scenario 3A Refined Rapid Bus Conditions VISSIM Model
Snelling Avenue Rapid Bus VISSIM Evaluation
Person Delay (A.M. Peak Hour 7:30 - 8:30)
Ford at Fairview
(vph) (sec/veh) (hrs) (hrs) (hrs)
Left 40 21.7 0.24 52 0.3
Thru 435 11.4 1.38 561 1.8
Right 45 9.6 0.12 57 0.2
Left 22 19.9 0.12 28 0.2
Thru 428 10.7 1.27 558 1.7
Right 66 9.1 0.17 83 0.2
Left 89 22.7 0.56 113 0.7
Thru 217 13.3 6 10.0 0.80 379 1.4
Right 27 7.8 0.06 33 0.1
Left 28 17.6 0.14 36 0.2
Thru 217 13.7 6 6.6 0.82 355 1.4
Right 7 4.5 0.01 10 0.0
Ford at Kenneth
(vph) (sec/veh) (hrs) (hrs) (hrs)
Left 38 35.5 0.37 66 0.7
Thru 27 31.4 0.24 36 0.3
Right 32 15.1 0.13 40 0.2
Left 11 33.5 0.10 14 0.1
Thru 44 30.0 0.36 56 0.5
Right 38 11.0 0.12 66 0.2
Left 30 4.4 0.04 58 0.1
Thru 291 1.9 6 10.0 0.15 473 0.2
Right 20 2.0 0.01 26 0.0
Left 15 5.1 0.02 19 0.0
Thru 302 4.2 6 6.6 0.36 463 0.5
Right 7 3.6 0.01 10 0.0
Ford at Cleveland
(vph) (sec/veh) (hrs) (hrs) (hrs)
Left 296 17.2 1.41 383 1.8
Thru 389 17.1 1.84 499 2.4
Right 56 19.1 0.30 107 0.6
Left 28 15.5 0.12 37 0.2
Thru 274 19.5 1.48 355 1.9
Right 86 22.0 0.53 149 0.9
Left 92 21.7 0.55 155 0.9
Thru 257 12.4 6 8.7 0.88 404 1.4
Right 123 14.6 0.50 182 0.7
Left 50 27.3 0.38 84 0.6
Thru 288 15.0 6 6.6 1.20 462 1.9
Right 36 14.1 0.14 46 0.2
Ford at Finn
(vph) (sec/veh) (hrs) (hrs) (hrs)
Left 48 34.1 0.46 62 0.6
Thru 1 41.0 0.01 1 0.0
Right 42 5.1 0.06 53 0.1
Left 31 32.8 0.28 40 0.4
Thru 1 17.0 0.00 1 0.0
Right 29 11.1 0.09 35 0.1
Left 20 8.9 0.05 25 0.1
Thru 400 5.0 6 8.7 0.55 650 0.9
Right 20 3.9 0.02 27 0.0
Left 125 4.9 0.17 161 0.2
Thru 487 2.6 6 5.5 0.35 751 0.5
Right 59 2.1 0.03 76 0.0
Rapid Bus
Volume
Rapid Bus
Passengers/B
us
Total Delay
Rapid Bus
Passengers/B
us
Total Delay Total
Persons
Person
Delay
Total
Persons
8.0
Person
Delay
Rapid Bus
Volume
Rapid Bus
Passengers/B
us
Total Delay Total
Persons
Person
DelayRapid Bus
Volume
Rapid Bus
Passengers/B
us
Total Delay
Person
Delay
Total
Persons
Person
Delay
Rapid Bus
Volume
Southbound
Eastbound
Westbound
Approach
Simulated
Volume
Movement
Delay
Northbound
Simulated
Volume
Movement
Delay
Northbound
Movement
Movement
2.9
Southbound
Eastbound
Westbound
Approach
Person
Delay
13.5
Southbound
Eastbound
Westbound
Approach Movement
Simulated
Volume
Movement
Delay
Northbound
Simulated
Volume
Movement
Delay
Northbound
3.0
Southbound
Eastbound
Westbound
Approach Movement
Person
Delay
Person
Delay
* Results shown are the average of 5 model runs.
** Results shown are from all vehicles except transit vehicles.
H:\Projects\7939\SD\VISSIM\3A_RB_Refined\11 MOEs\7939_3A_Refined_RB_AM PersonDelay.xls 7/2/2013

Year 2013 Scenario 3A Refined Rapid Bus Conditions VISSIM Model
Snelling Avenue Rapid Bus VISSIM Evaluation
Person Delay (A.M. Peak Hour 7:30 - 8:30)
Ford at Cretin
(vph) (sec/veh) (hrs) (hrs) (hrs)
Left 117 32.4 1.06 168 1.5
Right 65 4.0 0.07 85 0.1
Left 112 8.1 0.25 145 0.3
Thru 320 3.8 6 8.7 0.34 529 0.6
Thru 379 4.6 6 5.5 0.49 588 0.8
Right 182 5.7 0.29 257 0.4
46th at 46th
(vph) (sec/veh) (hrs) (hrs) (hrs)
Left 28 55.1 0.43 36 0.5
Thru 33 49.2 0.45 40 0.6
Right 217 2.3 0.14 281 0.2
Left 50 39.3 0.54 71 0.8
Thru 16 52.8 0.23 21 0.3
Right 42 51.0 0.60 56 0.8
Left 25 16.4 0.11 30 0.1
Thru 168 21.8 6 8.7 1.02 325 2.0
Right 34 17.3 0.16 45 0.2
Left 142 9.6 0.38 179 0.5
Thru 219 8.2 6 5.5 0.50 366 0.8
Right 82 8.3 0.19 125 0.3
46th at 42nd
(vph) (sec/veh) (hrs) (hrs) (hrs)
Left 5 24.7 0.04 8 0.1
Thru 5 21.5 0.03 6 0.0
Right 4 3.7 0.00 5 0.0
Left 28 21.4 0.17 36 0.2
Thru 4 26.2 0.03 5 0.0
Right 84 7.4 0.17 111 0.2
Left 49 27.3 0.37 64 0.5
Thru 190 23.4 6 8.7 1.23 351 2.3
Right 14 16.2 0.06 18 0.1
Left 4 19.1 0.02 6 0.0
Thru 270 16.5 6 5.5 1.24 431 2.0
Right 14 10.5 0.04 18 0.1
46th at Minnehaha
(vph) (sec/veh) (hrs) (hrs) (hrs)
Left 22 26.3 0.16 29 0.2
Thru 274 22.5 1.71 353 2.2
Right 13 14.0 0.05 18 0.1
Left 38 29.8 0.32 49 0.4
Thru 166 21.0 0.96 211 1.2
Right 109 10.2 0.31 138 0.4
Left 127 22.6 0.80 164 1.0
Thru 206 14.6 6 8.7 0.84 373 1.5
Right 25 16.2 0.11 31 0.1
Left 74 36.3 0.75 95 1.0
Thru 179 32.4 6 5.5 1.61 317 2.8
Right 114 22.2 0.70 149 0.9
Rapid Bus
Passengers/B
us
Total Delay
Rapid Bus
Volume
Person
Delay
Rapid Bus
Volume
Rapid Bus
Passengers/B
us
Total Delay Total
Persons
Person
Delay
Rapid Bus
Volume
Rapid Bus
Volume
Rapid Bus
Passengers/B
us
Total DelayPerson
DelayTotal
Persons
Total
Persons
Total Delay Total
Persons
Person
Delay
Rapid Bus
Passengers/B
us
Southbound
Eastbound
Westbound
Approach
Movement
Simulated
Volume
Movement
Delay
3.7
Movement
Simulated
Volume
Movement
Delay
Northbound
7.1
Southbound
Eastbound
Westbound
Approach
5.5
Southbound
Eastbound
Westbound
Approach Movement
Simulated
Volume
Movement
Delay
Northbound
Simulated
Volume
Movement
Delay
Northbound
11.9
Southbound
Eastbound
Westbound
Approach Movement
Person
Delay
Person
Delay
Person
Delay
Person
Delay
* Results shown are the average of 5 model runs.
** Results shown are from all vehicles except transit vehicles.
H:\Projects\7939\SD\VISSIM\3A_RB_Refined\11 MOEs\7939_3A_Refined_RB_AM PersonDelay.xls 7/2/2013

Year 2013 Scenario 3A Refined Rapid Bus Conditions VISSIM Model
Snelling Avenue Rapid Bus VISSIM Evaluation
Person Delay (A.M. Peak Hour 7:30 - 8:30)
46th at Hiawatha
(vph) (sec/veh) (hrs) (hrs) (hrs)
Left 26 39.7 0.29 34 0.4
Thru 883 24.0 5.90 1,129 7.5
Right 183 2.3 0.12 238 0.2
Left 94 37.1 0.97 119 1.2
Thru 531 16.5 2.44 682 3.1
Right 14 1.2 0.00 17 0.0
Left 63 21.8 0.38 83 0.5
Thru 80 29.5 6 8.7 0.65 210 1.7
Right 44 33.1 0.41 58 0.5
Left 162 35.9 1.62 210 2.1
Thru 71 22.2 6 5.5 0.44 174 1.1
Right 71 8.5 0.17 92 0.2
46th at 36th
(vph) (sec/veh) (hrs) (hrs) (hrs)
Left 5 8.1 0.01 6 0.0
Thru 0 - - 0 -
Right 5 4.4 0.01 6 0.0
Left 41 7.9 6 8.7 0.09 160 0.4
Thru 0 - - 0 -
Right 15 4.2 0.02 21 0.0
Left 15 6.2 0.03 18 0.0
Thru 142 5.8 0.23 182 0.3
Right 8 2.3 0.01 11 0.0
Left 1 5.2 0.00 2 0.0
Thru 86 3.4 0.08 111 0.1
Right 24 2.4 6 5.5 0.02 112 0.1
Rapid Bus
Volume
Rapid Bus
Passengers/B
us
Total DelayPerson
Delay
Rapid Bus
Volume
Rapid Bus
Passengers/B
us
Total Delay Total
Persons
Person
Delay
Total
PersonsApproach Movement
Simulated
Volume
Movement
Delay
Northbound
18.6
Southbound
Movement
Eastbound
Westbound
Simulated
Volume
Movement
Delay
0.9
Southbound
Eastbound
Approach
Westbound
Northbound
Person
Delay
Person
Delay
* Results shown are the average of 5 model runs.
** Results shown are from all vehicles except transit vehicles.
H:\Projects\7939\SD\VISSIM\3A_RB_Refined\11 MOEs\7939_3A_Refined_RB_AM PersonDelay.xls 7/2/2013

Year 2013 Scenario 3A Refined Rapid Bus Conditions VISSIM Model
Snelling Avenue Rapid Bus VISSIM Evaluation
Person Delay (P.M. Peak Hour 4:45 - 5:45)
Co B2 at Snelling W Ramps
(vph) (sec/veh) (hrs) (hrs) (hrs)
Left 75 33.5 0.70 99 0.9
Thru 151 35.0 6 16.9 1.47 332 3.2
Right 141 4.0 0.16 184 0.2
Left 6 43.1 0.07 7 0.1
Thru 106 44.8 1.32 138 1.7
Right 148 4.5 0.19 192 0.2
Left 403 45.3 5.07 524 6.6
Thru 749 24.4 5.08 974 6.6
Right 77 9.5 0.20 99 0.3
Left 349 48.1 6 19.2 4.66 603 8.0
Thru 440 23.5 2.87 577 3.8
Right 24 5.5 0.04 49 0.1
Co B2 at Snelling E Ramps
(vph) (sec/veh) (hrs) (hrs) (hrs)
Left 21 41.5 0.24 27 0.3
Right 497 25.4 6 19.2 3.51 816 5.8
Left 248 9.3 0.64 322 0.8
Thru 647 4.7 0.85 841 1.1
Thru 318 6.6 0.59 414 0.8
Right 38 2.8 0.03 50 0.0
Snelling at Co B
(vph) (sec/veh) (hrs) (hrs) (hrs)
Left 154 72.8 3.11 199 4.0
Thru 1,557 9.2 6 19.2 3.97 2,170 5.5
Right 211 3.2 0.19 274 0.2
Left 426 96.8 11.45 568 15.3
Thru 1,245 31.9 6 16.9 11.03 1,749 15.5
Right 294 16.3 1.33 382 1.7
Left 178 329.0 16.30 233 21.3
Thru 505 304.9 42.74 655 55.5
Right 153 251.1 10.66 200 14.0
Left 167 79.1 3.67 218 4.8
Thru 260 70.5 5.10 338 6.6
Right 300 21.4 1.79 404 2.4
Snelling at HarMar
(vph) (sec/veh) (hrs) (hrs) (hrs)
Left 51 72.3 1.02 67 1.4
Thru 1,609 5.0 6 19.2 2.25 2,239 3.1
Right 266 3.4 0.25 344 0.3
Left 125 60.3 2.10 161 2.7
Thru 1,343 6.4 6 16.9 2.38 1,880 3.3
Right 99 3.2 0.09 129 0.1
Left 115 79.7 2.55 150 3.3
Thru 49 82.8 1.14 64 1.5
Right 80 11.9 0.27 104 0.3
Left 100 79.7 2.21 128 2.8
Thru 57 77.6 1.23 75 1.6
Right 198 11.8 0.65 255 0.8
Approach
Rapid Bus
Volume
Rapid Bus
Passengers/B
us
Simulated
Volume
Movement
DelayTotal
Persons
Rapid Bus
Volume
31.7
Southbound
Eastbound
Approach
Person
Delay
Westbound
Northbound
Total
Persons
Person
Delay
Movement
Movement
Total Delay
8.8
Southbound
Eastbound
Simulated
Volume
Movement
Delay
Rapid Bus
Passengers/B
us
Total Delay
Total Delay Total
Persons
Total Delay Total
Persons
Person
Delay
Simulated
Volume
Movement
Delay
Rapid Bus
Volume
Rapid Bus
Passengers/B
us
Rapid Bus
Volume
Rapid Bus
Passengers/B
us
Simulated
Volume
Person
Delay
Westbound
Approach Movement
Northbound
146.9
Southbound
Eastbound
Westbound
Approach Movement
Movement
Delay
Northbound
21.3
Southbound
Eastbound
Westbound
Person
Delay
Person
Delay
Person
Delay
Person
Delay
* Results shown are the average of 20 model runs.
** Results shown are from all vehicles except transit vehicles.
H:\Projects\7939\SD\VISSIM\3A_RB_Refined\11 MOEs\7939_3A_Refined_RB_PM PersonDelay.xls 7/2/2013

Year 2013 Scenario 3A Refined Rapid Bus Conditions VISSIM Model
Snelling Avenue Rapid Bus VISSIM Evaluation
Person Delay (P.M. Peak Hour 4:45 - 5:45)
Snelling at Roselawn
(vph) (sec/veh) (hrs) (hrs) (hrs)
Left 15 125.7 0.52 19 0.7
Thru 1,831 3.7 6 19.2 1.90 2,523 2.6
Right 27 3.9 0.03 36 0.0
Left 96 220.0 5.89 124 7.6
Thru 1,316 9.5 6 16.9 3.47 1,845 4.9
Right 102 4.9 0.14 132 0.2
Left 51 126.7 1.78 67 2.4
Thru 193 117.1 6.27 250 8.1
Right 70 46.7 0.91 91 1.2
Left 22 136.0 0.82 28 1.0
Thru 94 120.2 3.13 122 4.1
Right 45 28.8 0.36 59 0.5
Snelling at Larpenteur
(vph) (sec/veh) (hrs) (hrs) (hrs)
Left 221 94.9 5.82 284 7.5
Thru 1,695 51.3 6 19.2 24.14 2,346 33.4
Right 185 30.7 1.58 239 2.0
Left 175 219.6 10.67 227 13.8
Thru 1,053 53.8 6 16.9 15.73 1,504 22.5
Right 173 28.7 1.38 225 1.8
Left 27 76.8 0.58 37 0.8
Thru 699 93.6 18.18 907 23.6
Right 196 98.0 5.34 256 7.0
Left 153 79.2 3.36 198 4.4
Thru 352 49.7 4.86 456 6.3
Right 151 41.8 1.75 196 2.3
Snelling at Hoyt
(vph) (sec/veh) (hrs) (hrs) (hrs)
Left 7 18.5 0.04 9 0.0
Thru 2,063 11.7 6 19.2 6.69 2,820 9.2
Right 124 7.6 0.26 162 0.3
Left 46 31.1 0.39 59 0.5
Thru 1,347 2.5 6 16.9 0.94 1,885 1.3
Right 9 3.0 0.01 12 0.0
Left 23 83.2 0.54 30 0.7
Thru 6 77.5 0.13 8 0.2
Right 1 12.6 0.00 2 0.0
Left 41 85.8 0.97 53 1.3
Thru 10 80.3 0.22 13 0.3
Right 29 26.7 0.22 38 0.3
Snelling at Midway
(vph) (sec/veh) (hrs) (hrs) (hrs)
Left 53 15.8 0.23 69 0.3
Thru 2,094 11.6 6 19.2 6.77 2,861 9.2
Right 66 10.1 0.19 84 0.2
Left 76 17.9 0.38 100 0.5
Thru 1,266 4.4 6 16.9 1.54 1,780 2.2
Right 49 5.0 0.07 62 0.1
Left 46 87.5 1.12 60 1.5
Thru 30 81.0 0.67 38 0.9
Right 39 9.0 0.10 51 0.1
Left 19 87.4 0.47 25 0.6
Thru 15 79.4 0.33 21 0.5
Right 51 13.2 0.19 66 0.2
Total Delay Total
Persons
Person
Delay
Rapid Bus
Volume
Rapid Bus
Passengers/B
us
Total Delay Total
Persons
Rapid Bus
Volume
Rapid Bus
Passengers/B
us
Person
Delay
Rapid Bus
Volume
Rapid Bus
Passengers/B
us
Total Delay Total
Persons
Person
Delay
Rapid Bus
Volume
Rapid Bus
Passengers/B
us
Total Delay Total
Persons
Person
Delay
Movement
Delay
Approach Movement
Simulated
Volume
Movement
Delay
Northbound
33.2
Southbound
Eastbound
Westbound
Movement
Simulated
Volume
Approach Movement
Simulated
Volume
Movement
Delay
Simulated
Volume
Movement
Delay
Northbound
125.2
Southbound
Eastbound
Westbound
Approach Movement
Northbound
14.1
Southbound
Eastbound
Westbound
Approach
Northbound
16.3
Southbound
Eastbound
Westbound
Person
Delay
Person
Delay
Person
Delay
Person
Delay
* Results shown are the average of 20 model runs.
** Results shown are from all vehicles except transit vehicles.
H:\Projects\7939\SD\VISSIM\3A_RB_Refined\11 MOEs\7939_3A_Refined_RB_PM PersonDelay.xls 7/2/2013

Year 2013 Scenario 3A Refined Rapid Bus Conditions VISSIM Model
Snelling Avenue Rapid Bus VISSIM Evaluation
Person Delay (P.M. Peak Hour 4:45 - 5:45)
Snelling at Hewitt
(vph) (sec/veh) (hrs) (hrs) (hrs)
Left 24 18.7 0.12 30 0.2
Thru 1,570 16.3 6 24.4 7.10 2,214 10.0
Right 19 16.5 0.09 24 0.1
Left 72 23.7 0.47 94 0.6
Thru 1,350 14.9 6 25.7 5.59 1,937 8.0
Right 102 7.6 0.22 133 0.3
Left 91 38.1 0.96 118 1.3
Thru 11 36.4 0.11 15 0.1
Right 74 23.7 0.48 96 0.6
Left 30 34.5 0.29 40 0.4
Thru 20 32.6 0.18 27 0.2
Right 80 18.3 0.41 104 0.5
Snelling at Minnehaha
(vph) (sec/veh) (hrs) (hrs) (hrs)
Left 39 27.9 0.30 51 0.4
Thru 1,395 21.1 6 24.4 8.20 1,987 11.7
Right 50 23.2 0.32 65 0.4
Left 103 30.5 0.87 134 1.1
Thru 1,245 21.5 6 25.7 7.43 1,801 10.8
Right 106 23.7 0.70 137 0.9
Left 134 43.6 1.62 175 2.1
Thru 175 33.6 1.64 227 2.1
Right 75 32.4 0.68 99 0.9
Left 50 37.3 0.51 63 0.7
Thru 131 27.8 1.01 170 1.3
Right 79 26.5 0.58 103 0.8
Snelling at Thomas
(vph) (sec/veh) (hrs) (hrs) (hrs)
Left 44 24.8 0.31 58 0.4
Thru 1,346 23.3 6 24.4 8.71 1,927 12.5
Right 72 22.7 0.45 92 0.6
Left 61 36.7 0.63 79 0.8
Thru 1,273 33.0 6 25.7 11.65 1,837 16.8
Right 32 20.5 0.18 41 0.2
Left 110 35.0 1.07 141 1.4
Thru 85 34.8 0.82 110 1.1
Right 79 30.2 0.66 101 0.8
Left 40 34.2 0.38 51 0.5
Thru 55 29.0 0.45 72 0.6
Right 44 19.5 0.24 56 0.3
Snelling at University
(vph) (sec/veh) (hrs) (hrs) (hrs)
Left 110 65.8 2.00 142 2.6
Thru 1,059 29.8 6 24.4 8.75 1,557 12.9
Right 178 13.5 0.67 266 1.0
Left 197 89.9 4.92 254 6.3
Thru 1,114 79.4 6 42.3 24.56 1,727 38.1
Right 60 52.6 0.88 78 1.1
Left 186 65.5 3.39 242 4.4
Thru 810 119.4 26.86 1,049 34.8
Right 172 136.7 6.53 223 8.5
Left 166 102.5 4.72 248 7.1
Thru 520 78.5 11.33 671 14.6
Right 213 86.8 5.14 273 6.6
Rapid Bus
Volume
Rapid Bus
Passengers/B
us
Total Delay Total
Persons
Person
Delay
Rapid Bus
Volume
Rapid Bus
Passengers/B
us
Total Delay Total
Persons
Person
Delay
Rapid Bus
Volume
Rapid Bus
Passengers/B
us
Total Delay Total
Persons
Person
Delay
Rapid Bus
Volume
Rapid Bus
Passengers/B
us
Total Delay Total
Persons
Person
Delay
Simulated
Volume
Movement
DelayApproach Movement
Northbound
22.4
Southbound
Simulated
Volume
Movement
Delay
Eastbound
Westbound
Approach Movement
Simulated
Volume
Movement
Delay
Northbound
33.1
Southbound
Eastbound
Westbound
Approach Movement
Northbound
36.0
Southbound
Eastbound
Westbound
Approach Movement
Simulated
Volume
Movement
Delay
Northbound
138.0
Southbound
Eastbound
Westbound
Person
Delay
Person
Delay
Person
Delay
Person
Delay
* Results shown are the average of 20 model runs.
** Results shown are from all vehicles except transit vehicles.
H:\Projects\7939\SD\VISSIM\3A_RB_Refined\11 MOEs\7939_3A_Refined_RB_PM PersonDelay.xls 7/2/2013

Year 2013 Scenario 3A Refined Rapid Bus Conditions VISSIM Model
Snelling Avenue Rapid Bus VISSIM Evaluation
Person Delay (P.M. Peak Hour 4:45 - 5:45)
Snelling at Spruce Tree
(vph) (sec/veh) (hrs) (hrs) (hrs)
Left 61 43.8 0.74 80 1.0
Thru 1,218 51.4 6 21.6 17.37 1,779 25.4
Right 146 27.8 1.12 189 1.5
Left 70 34.1 0.66 90 0.9
Thru 1,363 14.2 6 42.3 5.37 2,082 8.2
Right 14 12.3 0.05 18 0.1
Left 35 67.6 0.65 45 0.8
Thru 64 41.6 0.74 83 1.0
Right 177 11.3 0.56 232 0.7
Left 141 57.4 2.25 183 2.9
Thru 53 92.3 1.37 68 1.7
Right 97 96.6 2.61 126 3.4
Snelling at St Anthony
(vph) (sec/veh) (hrs) (hrs) (hrs)
Left 363 20.0 2.01 471 2.6
Thru 980 12.8 6 21.6 3.49 1,467 5.2
Thru 1,338 78.6 6 42.3 29.22 2,056 44.9
Right 358 8.7 0.86 462 1.1
Left 363 75.9 7.65 490 10.3
Thru 432 70.2 8.43 562 11.0
Right 442 22.7 2.79 576 3.6
Snelling at Concordia
(vph) (sec/veh) (hrs) (hrs) (hrs)
Thru 1,034 49.6 6 21.6 14.25 1,539 21.2
Right 235 28.3 1.85 308 2.4
Left 500 8.8 1.23 644 1.6
Thru 1,209 20.5 6 42.3 6.88 1,912 10.9
Left 329 68.6 6.27 430 8.2
Thru 324 87.4 7.85 421 10.2
Right 593 82.6 13.62 772 17.7
Snelling at Marshall
(vph) (sec/veh) (hrs) (hrs) (hrs)
Left 49 50.2 0.68 63 0.9
Thru 1,015 45.3 6 21.6 12.78 1,483 18.7
Right 81 26.4 0.59 105 0.8
Left 47 62.0 0.81 63 1.1
Thru 1,525 62.7 6 42.3 26.56 2,271 39.5
Right 222 49.6 3.06 338 4.7
Left 216 47.2 2.83 314 4.1
Thru 350 39.4 3.83 453 5.0
Right 85 35.1 0.83 110 1.1
Left 73 31.9 0.64 96 0.8
Thru 245 41.2 2.80 317 3.6
Right 43 32.1 0.39 56 0.5
Rapid Bus
Volume
Rapid Bus
Passengers/B
us
Total Delay Total
Persons
Person
Delay
Rapid Bus
Volume
Rapid Bus
Passengers/B
us
Total Delay Total
Persons
Person
Delay
Rapid Bus
Volume
Rapid Bus
Passengers/B
us
Person
Delay
Total Delay
Rapid Bus
Volume
Rapid Bus
Passengers/B
us
Total Delay Total
Persons
Total
Persons
47.5
Southbound
Eastbound
Westbound
Approach
Simulated
Volume
Movement
Delay
Northbound
Movement
Simulated
Volume
Movement
Delay
Northbound
78.8Southbound
Westbound
Approach Movement
72.2
Approach Movement
Person
Delay
Simulated
Volume
Movement
Delay
Southbound
Eastbound
Northbound
Simulated
Volume
Movement
Delay
Northbound
80.7
Southbound
Eastbound
Westbound
Approach
Person
DelayMovement
Person
Delay
Person
Delay
Person
Delay
* Results shown are the average of 20 model runs.
** Results shown are from all vehicles except transit vehicles.
H:\Projects\7939\SD\VISSIM\3A_RB_Refined\11 MOEs\7939_3A_Refined_RB_PM PersonDelay.xls 7/2/2013

Year 2013 Scenario 3A Refined Rapid Bus Conditions VISSIM Model
Snelling Avenue Rapid Bus VISSIM Evaluation
Person Delay (P.M. Peak Hour 4:45 - 5:45)
Snelling at Selby
(vph) (sec/veh) (hrs) (hrs) (hrs)
Left 25 126.9 0.88 32 1.1
Thru 866 78.3 6 21.6 18.82 1,290 28.0
Right 53 79.2 1.18 71 1.6
Left 386 78.8 8.46 504 11.0
Thru 1,104 12.2 6 42.3 3.73 1,722 5.8
Right 184 10.6 0.54 238 0.7
Left 53 51.5 0.75 68 1.0
Thru 285 32.0 2.53 368 3.3
Right 38 25.5 0.27 49 0.3
Left 43 44.5 0.53 56 0.7
Thru 204 34.2 1.94 264 2.5
Right 210 26.5 1.54 272 2.0
Snelling at Summit
(vph) (sec/veh) (hrs) (hrs) (hrs)
Left 33 34.8 0.31 42 0.4
Thru 721 19.6 6 21.6 3.92 1,105 6.0
Right 69 23.2 0.45 89 0.6
Left 92 35.1 0.90 119 1.2
Thru 976 27.2 6 42.3 7.37 1,560 11.8
Right 127 27.0 0.95 164 1.2
Left 75 64.1 1.33 98 1.7
Thru 418 28.5 3.32 546 4.3
Right 18 26.0 0.13 23 0.2
Left 60 42.7 0.71 78 0.9
Thru 424 32.8 3.86 552 5.0
Right 166 29.1 1.34 215 1.7
Snelling at Grand
(vph) (sec/veh) (hrs) (hrs) (hrs)
Left 72 29.3 0.58 93 0.8
Thru 596 31.5 6 21.6 5.21 939 8.2
Right 138 29.3 1.12 177 1.4
Left 186 27.6 1.42 243 1.9
Thru 739 12.4 6 42.3 2.54 1,251 4.3
Right 130 11.4 0.41 168 0.5
Left 76 40.8 0.86 98 1.1
Thru 423 35.3 4.14 550 5.4
Right 64 30.8 0.55 84 0.7
Left 95 45.3 1.19 123 1.5
Thru 346 39.6 3.80 446 4.9
Right 149 34.0 1.41 195 1.8
Snelling at St Clair
(vph) (sec/veh) (hrs) (hrs) (hrs)
Left 55 43.9 0.67 71 0.9
Thru 565 8.6 6 18.6 1.36 878 2.1
Right 87 4.8 0.12 111 0.1
Left 103 32.6 0.94 134 1.2
Thru 665 16.8 6 30.0 3.11 1,080 5.0
Right 117 16.3 0.53 150 0.7
Left 75 34.3 0.72 96 0.9
Thru 310 23.7 2.04 405 2.7
Right 42 15.2 0.18 54 0.2
Left 77 34.6 0.74 99 1.0
Thru 316 25.2 2.22 412 2.9
Right 151 17.4 0.73 196 0.9
Rapid Bus
Volume
Rapid Bus
Passengers/B
us
Total Delay
Rapid Bus
Volume
Rapid Bus
Passengers/B
us
Total DelayPerson
DelayTotal
Persons
Person
Delay
Rapid Bus
Volume
Rapid Bus
Passengers/B
us
Total Delay Total
Persons
Person
Delay
Total
Persons
Rapid Bus
Volume
Rapid Bus
Passengers/B
us
Total Delay Total
Persons
Person
Delay
58.1
Southbound
Eastbound
Westbound
Approach Movement
Simulated
Volume
Movement
Delay
Northbound
Simulated
Volume
Movement
Delay
Northbound
35.1
Southbound
Eastbound
Westbound
Approach Movement
32.6
Southbound
Eastbound
Westbound
Approach Movement
Simulated
Volume
Movement
Delay
Northbound
Simulated
Volume
Movement
Delay
Northbound
18.7
Southbound
Eastbound
Westbound
Approach Movement
Person
Delay
Person
Delay
Person
Delay
Person
Delay
* Results shown are the average of 20 model runs.
** Results shown are from all vehicles except transit vehicles.
H:\Projects\7939\SD\VISSIM\3A_RB_Refined\11 MOEs\7939_3A_Refined_RB_PM PersonDelay.xls 7/2/2013
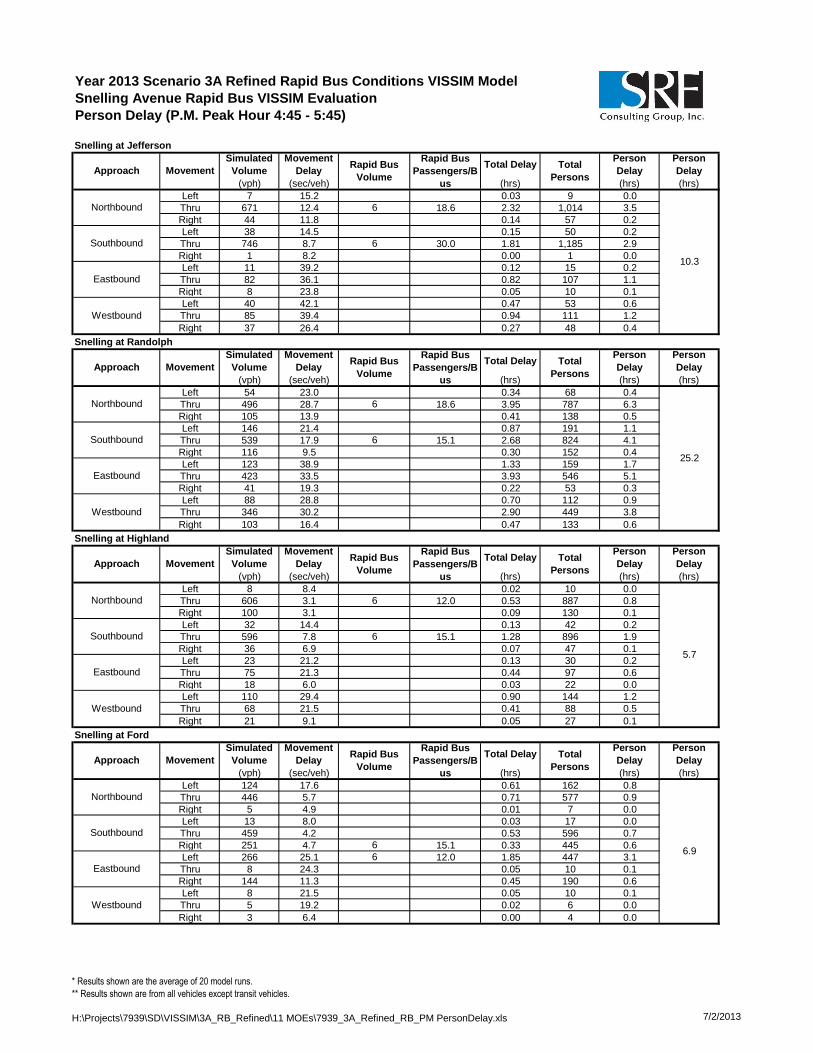
Year 2013 Scenario 3A Refined Rapid Bus Conditions VISSIM Model
Snelling Avenue Rapid Bus VISSIM Evaluation
Person Delay (P.M. Peak Hour 4:45 - 5:45)
Snelling at Jefferson
(vph) (sec/veh) (hrs) (hrs) (hrs)
Left 7 15.2 0.03 9 0.0
Thru 671 12.4 6 18.6 2.32 1,014 3.5
Right 44 11.8 0.14 57 0.2
Left 38 14.5 0.15 50 0.2
Thru 746 8.7 6 30.0 1.81 1,185 2.9
Right 1 8.2 0.00 1 0.0
Left 11 39.2 0.12 15 0.2
Thru 82 36.1 0.82 107 1.1
Right 8 23.8 0.05 10 0.1
Left 40 42.1 0.47 53 0.6
Thru 85 39.4 0.94 111 1.2
Right 37 26.4 0.27 48 0.4
Snelling at Randolph
(vph) (sec/veh) (hrs) (hrs) (hrs)
Left 54 23.0 0.34 68 0.4
Thru 496 28.7 6 18.6 3.95 787 6.3
Right 105 13.9 0.41 138 0.5
Left 146 21.4 0.87 191 1.1
Thru 539 17.9 6 15.1 2.68 824 4.1
Right 116 9.5 0.30 152 0.4
Left 123 38.9 1.33 159 1.7
Thru 423 33.5 3.93 546 5.1
Right 41 19.3 0.22 53 0.3
Left 88 28.8 0.70 112 0.9
Thru 346 30.2 2.90 449 3.8
Right 103 16.4 0.47 133 0.6
Snelling at Highland
(vph) (sec/veh) (hrs) (hrs) (hrs)
Left 8 8.4 0.02 10 0.0
Thru 606 3.1 6 12.0 0.53 887 0.8
Right 100 3.1 0.09 130 0.1
Left 32 14.4 0.13 42 0.2
Thru 596 7.8 6 15.1 1.28 896 1.9
Right 36 6.9 0.07 47 0.1
Left 23 21.2 0.13 30 0.2
Thru 75 21.3 0.44 97 0.6
Right 18 6.0 0.03 22 0.0
Left 110 29.4 0.90 144 1.2
Thru 68 21.5 0.41 88 0.5
Right 21 9.1 0.05 27 0.1
Snelling at Ford
(vph) (sec/veh) (hrs) (hrs) (hrs)
Left 124 17.6 0.61 162 0.8
Thru 446 5.7 0.71 577 0.9
Right 5 4.9 0.01 7 0.0
Left 13 8.0 0.03 17 0.0
Thru 459 4.2 0.53 596 0.7
Right 251 4.7 6 15.1 0.33 445 0.6
Left 266 25.1 6 12.0 1.85 447 3.1
Thru 8 24.3 0.05 10 0.1
Right 144 11.3 0.45 190 0.6
Left 8 21.5 0.05 10 0.1
Thru 5 19.2 0.02 6 0.0
Right 3 6.4 0.00 4 0.0
Rapid Bus
Volume
Rapid Bus
Passengers/B
us
Total Delay Total
Persons
Person
Delay
Rapid Bus
Volume
Rapid Bus
Passengers/B
us
Total DelayPerson
Delay
Rapid Bus
Volume
Rapid Bus
Passengers/B
us
Total Delay Total
Persons
Person
Delay
Person
Delay
Rapid Bus
Volume
Rapid Bus
Passengers/B
us
Total DelayPerson
DelayTotal
Persons
Total
Persons
10.3
Southbound
Eastbound
Westbound
Approach Movement
Simulated
Volume
Movement
Delay
Northbound
Simulated
Volume
Movement
Delay
Northbound
25.2
Southbound
Eastbound
Westbound
Approach Movement
5.7
Southbound
Eastbound
Westbound
Approach Movement
Simulated
Volume
Movement
Delay
Northbound
Simulated
Volume
Movement
Delay
Northbound
6.9
Southbound
Eastbound
Westbound
Approach
Person
DelayMovement
Person
Delay
Person
Delay
* Results shown are the average of 20 model runs.
** Results shown are from all vehicles except transit vehicles.
H:\Projects\7939\SD\VISSIM\3A_RB_Refined\11 MOEs\7939_3A_Refined_RB_PM PersonDelay.xls 7/2/2013
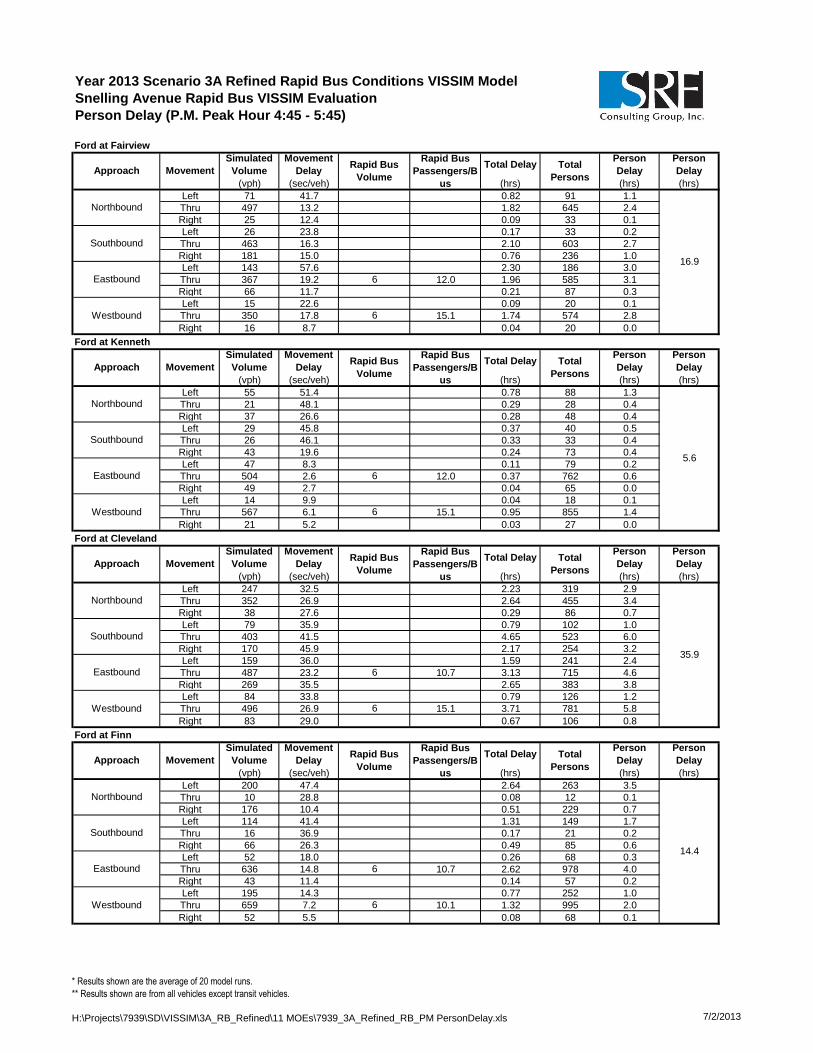
Year 2013 Scenario 3A Refined Rapid Bus Conditions VISSIM Model
Snelling Avenue Rapid Bus VISSIM Evaluation
Person Delay (P.M. Peak Hour 4:45 - 5:45)
Ford at Fairview
(vph) (sec/veh) (hrs) (hrs) (hrs)
Left 71 41.7 0.82 91 1.1
Thru 497 13.2 1.82 645 2.4
Right 25 12.4 0.09 33 0.1
Left 26 23.8 0.17 33 0.2
Thru 463 16.3 2.10 603 2.7
Right 181 15.0 0.76 236 1.0
Left 143 57.6 2.30 186 3.0
Thru 367 19.2 6 12.0 1.96 585 3.1
Right 66 11.7 0.21 87 0.3
Left 15 22.6 0.09 20 0.1
Thru 350 17.8 6 15.1 1.74 574 2.8
Right 16 8.7 0.04 20 0.0
Ford at Kenneth
(vph) (sec/veh) (hrs) (hrs) (hrs)
Left 55 51.4 0.78 88 1.3
Thru 21 48.1 0.29 28 0.4
Right 37 26.6 0.28 48 0.4
Left 29 45.8 0.37 40 0.5
Thru 26 46.1 0.33 33 0.4
Right 43 19.6 0.24 73 0.4
Left 47 8.3 0.11 79 0.2
Thru 504 2.6 6 12.0 0.37 762 0.6
Right 49 2.7 0.04 65 0.0
Left 14 9.9 0.04 18 0.1
Thru 567 6.1 6 15.1 0.95 855 1.4
Right 21 5.2 0.03 27 0.0
Ford at Cleveland
(vph) (sec/veh) (hrs) (hrs) (hrs)
Left 247 32.5 2.23 319 2.9
Thru 352 26.9 2.64 455 3.4
Right 38 27.6 0.29 86 0.7
Left 79 35.9 0.79 102 1.0
Thru 403 41.5 4.65 523 6.0
Right 170 45.9 2.17 254 3.2
Left 159 36.0 1.59 241 2.4
Thru 487 23.2 6 10.7 3.13 715 4.6
Right 269 35.5 2.65 383 3.8
Left 84 33.8 0.79 126 1.2
Thru 496 26.9 6 15.1 3.71 781 5.8
Right 83 29.0 0.67 106 0.8
Ford at Finn
(vph) (sec/veh) (hrs) (hrs) (hrs)
Left 200 47.4 2.64 263 3.5
Thru 10 28.8 0.08 12 0.1
Right 176 10.4 0.51 229 0.7
Left 114 41.4 1.31 149 1.7
Thru 16 36.9 0.17 21 0.2
Right 66 26.3 0.49 85 0.6
Left 52 18.0 0.26 68 0.3
Thru 636 14.8 6 10.7 2.62 978 4.0
Right 43 11.4 0.14 57 0.2
Left 195 14.3 0.77 252 1.0
Thru 659 7.2 6 10.1 1.32 995 2.0
Right 52 5.5 0.08 68 0.1
Rapid Bus
Volume
Rapid Bus
Passengers/B
us
Total Delay
Rapid Bus
Passengers/B
us
Total Delay Total
Persons
Person
Delay
Total
Persons
16.9
Person
Delay
Rapid Bus
Volume
Rapid Bus
Passengers/B
us
Total Delay Total
Persons
Person
DelayRapid Bus
Volume
Rapid Bus
Passengers/B
us
Total Delay
Person
Delay
Total
Persons
Person
Delay
Rapid Bus
Volume
Southbound
Eastbound
Westbound
Approach
Simulated
Volume
Movement
Delay
Northbound
Simulated
Volume
Movement
Delay
Northbound
Movement
Movement
5.6
Southbound
Eastbound
Westbound
Approach
Person
Delay
35.9
Southbound
Eastbound
Westbound
Approach Movement
Simulated
Volume
Movement
Delay
Northbound
Simulated
Volume
Movement
Delay
Northbound
14.4
Southbound
Eastbound
Westbound
Approach Movement
Person
Delay
Person
Delay
* Results shown are the average of 20 model runs.
** Results shown are from all vehicles except transit vehicles.
H:\Projects\7939\SD\VISSIM\3A_RB_Refined\11 MOEs\7939_3A_Refined_RB_PM PersonDelay.xls 7/2/2013
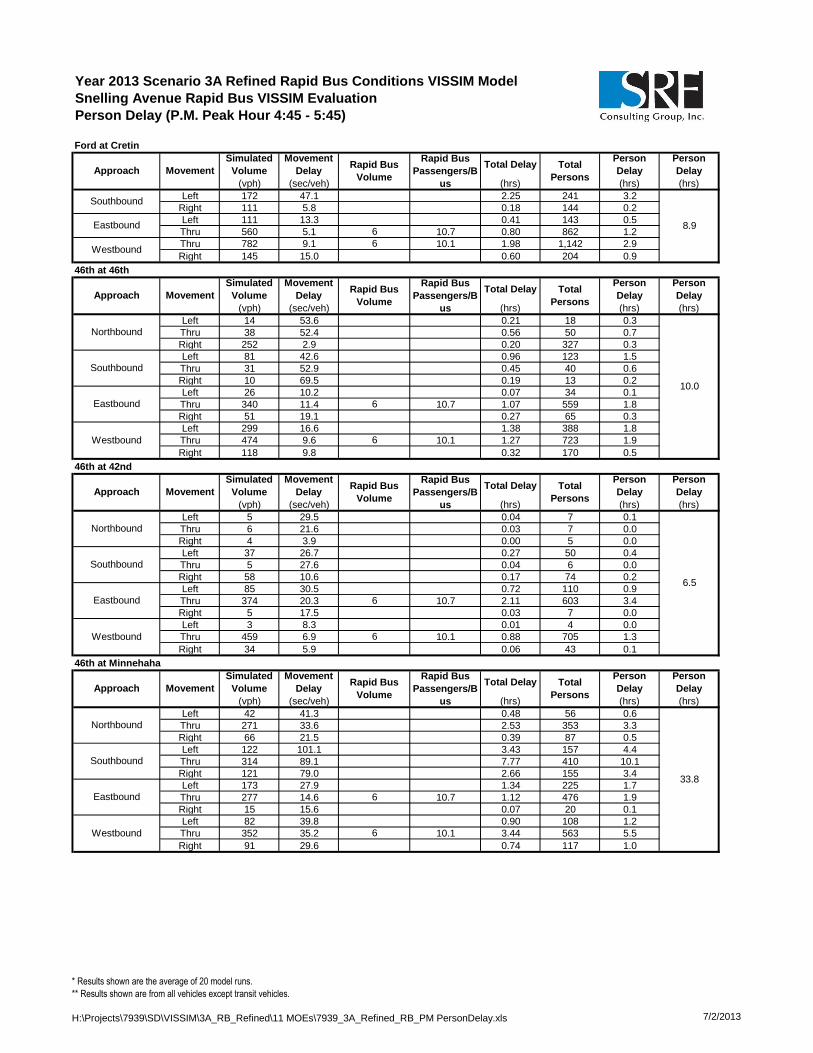
Year 2013 Scenario 3A Refined Rapid Bus Conditions VISSIM Model
Snelling Avenue Rapid Bus VISSIM Evaluation
Person Delay (P.M. Peak Hour 4:45 - 5:45)
Ford at Cretin
(vph) (sec/veh) (hrs) (hrs) (hrs)
Left 172 47.1 2.25 241 3.2
Right 111 5.8 0.18 144 0.2
Left 111 13.3 0.41 143 0.5
Thru 560 5.1 6 10.7 0.80 862 1.2
Thru 782 9.1 6 10.1 1.98 1,142 2.9
Right 145 15.0 0.60 204 0.9
46th at 46th
(vph) (sec/veh) (hrs) (hrs) (hrs)
Left 14 53.6 0.21 18 0.3
Thru 38 52.4 0.56 50 0.7
Right 252 2.9 0.20 327 0.3
Left 81 42.6 0.96 123 1.5
Thru 31 52.9 0.45 40 0.6
Right 10 69.5 0.19 13 0.2
Left 26 10.2 0.07 34 0.1
Thru 340 11.4 6 10.7 1.07 559 1.8
Right 51 19.1 0.27 65 0.3
Left 299 16.6 1.38 388 1.8
Thru 474 9.6 6 10.1 1.27 723 1.9
Right 118 9.8 0.32 170 0.5
46th at 42nd
(vph) (sec/veh) (hrs) (hrs) (hrs)
Left 5 29.5 0.04 7 0.1
Thru 6 21.6 0.03 7 0.0
Right 4 3.9 0.00 5 0.0
Left 37 26.7 0.27 50 0.4
Thru 5 27.6 0.04 6 0.0
Right 58 10.6 0.17 74 0.2
Left 85 30.5 0.72 110 0.9
Thru 374 20.3 6 10.7 2.11 603 3.4
Right 5 17.5 0.03 7 0.0
Left 3 8.3 0.01 4 0.0
Thru 459 6.9 6 10.1 0.88 705 1.3
Right 34 5.9 0.06 43 0.1
46th at Minnehaha
(vph) (sec/veh) (hrs) (hrs) (hrs)
Left 42 41.3 0.48 56 0.6
Thru 271 33.6 2.53 353 3.3
Right 66 21.5 0.39 87 0.5
Left 122 101.1 3.43 157 4.4
Thru 314 89.1 7.77 410 10.1
Right 121 79.0 2.66 155 3.4
Left 173 27.9 1.34 225 1.7
Thru 277 14.6 6 10.7 1.12 476 1.9
Right 15 15.6 0.07 20 0.1
Left 82 39.8 0.90 108 1.2
Thru 352 35.2 6 10.1 3.44 563 5.5
Right 91 29.6 0.74 117 1.0
Rapid Bus
Passengers/B
us
Total Delay
Rapid Bus
Volume
Person
Delay
Rapid Bus
Volume
Rapid Bus
Passengers/B
us
Total Delay Total
Persons
Person
Delay
Rapid Bus
Volume
Rapid Bus
Volume
Rapid Bus
Passengers/B
us
Total DelayPerson
DelayTotal
Persons
Total
Persons
Total Delay Total
Persons
Person
Delay
Rapid Bus
Passengers/B
us
Southbound
Eastbound
Westbound
Approach
Movement
Simulated
Volume
Movement
Delay
8.9
Movement
Simulated
Volume
Movement
Delay
Northbound
10.0
Southbound
Eastbound
Westbound
Approach
6.5
Southbound
Eastbound
Westbound
Approach Movement
Simulated
Volume
Movement
Delay
Northbound
Simulated
Volume
Movement
Delay
Northbound
33.8
Southbound
Eastbound
Westbound
Approach Movement
Person
Delay
Person
Delay
Person
Delay
Person
Delay
* Results shown are the average of 20 model runs.
** Results shown are from all vehicles except transit vehicles.
H:\Projects\7939\SD\VISSIM\3A_RB_Refined\11 MOEs\7939_3A_Refined_RB_PM PersonDelay.xls 7/2/2013

Year 2013 Scenario 3A Refined Rapid Bus Conditions VISSIM Model
Snelling Avenue Rapid Bus VISSIM Evaluation
Person Delay (P.M. Peak Hour 4:45 - 5:45)
46th at Hiawatha
(vph) (sec/veh) (hrs) (hrs) (hrs)
Left 84 41.1 0.95 107 1.2
Thru 806 27.4 6.13 1,040 7.9
Right 243 2.7 0.18 316 0.2
Left 144 41.2 1.65 186 2.1
Thru 858 24.4 5.82 1,113 7.5
Right 40 2.2 0.02 51 0.0
Left 52 24.9 0.36 67 0.5
Thru 77 33.8 6 10.7 0.72 216 2.0
Right 22 34.7 0.21 28 0.3
Left 203 43.1 2.43 264 3.2
Thru 146 25.5 6 10.1 1.03 296 2.1
Right 168 12.0 0.56 215 0.7
46th at 36th
(vph) (sec/veh) (hrs) (hrs) (hrs)
Left 1 9.1 0.00 2 0.0
Thru 2 11.2 0.00 2 0.0
Right 0 - - 0 -
Left 36 6.2 6 10.7 0.06 163 0.3
Thru 1 7.9 0.00 1 0.0
Right 5 4.1 0.01 7 0.0
Left 5 4.9 0.01 7 0.0
Thru 115 4.6 0.15 148 0.2
Right 1 2.3 0.00 1 0.0
Left 0 - - 0 -
Thru 241 3.0 0.20 310 0.3
Right 28 1.9 6 10.1 0.01 143 0.1
Rapid Bus
Volume
Rapid Bus
Passengers/B
us
Total DelayPerson
Delay
Rapid Bus
Volume
Rapid Bus
Passengers/B
us
Total Delay Total
Persons
Person
Delay
Total
PersonsApproach Movement
Simulated
Volume
Movement
Delay
Northbound
27.8
Southbound
Movement
Eastbound
Westbound
Simulated
Volume
Movement
Delay
0.8
Southbound
Eastbound
Approach
Westbound
Northbound
Person
Delay
Person
Delay
* Results shown are the average of 20 model runs.
** Results shown are from all vehicles except transit vehicles.
H:\Projects\7939\SD\VISSIM\3A_RB_Refined\11 MOEs\7939_3A_Refined_RB_PM PersonDelay.xls 7/2/2013
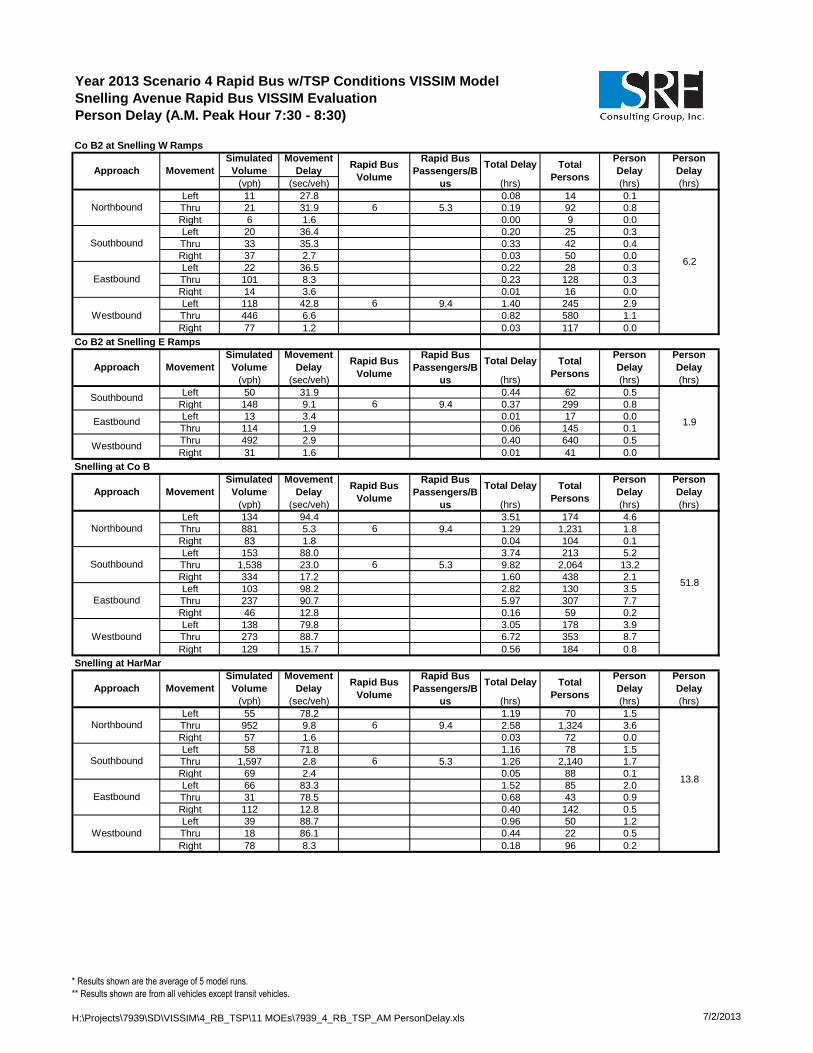
Year 2013 Scenario 4 Rapid Bus w/TSP Conditions VISSIM Model
Snelling Avenue Rapid Bus VISSIM Evaluation
Person Delay (A.M. Peak Hour 7:30 - 8:30)
Co B2 at Snelling W Ramps
(vph) (sec/veh) (hrs) (hrs) (hrs)
Left 11 27.8 0.08 14 0.1
Thru 21 31.9 6 5.3 0.19 92 0.8
Right 6 1.6 0.00 9 0.0
Left 20 36.4 0.20 25 0.3
Thru 33 35.3 0.33 42 0.4
Right 37 2.7 0.03 50 0.0
Left 22 36.5 0.22 28 0.3
Thru 101 8.3 0.23 128 0.3
Right 14 3.6 0.01 16 0.0
Left 118 42.8 6 9.4 1.40 245 2.9
Thru 446 6.6 0.82 580 1.1
Right 77 1.2 0.03 117 0.0
Co B2 at Snelling E Ramps
(vph) (sec/veh) (hrs) (hrs) (hrs)
Left 50 31.9 0.44 62 0.5
Right 148 9.1 6 9.4 0.37 299 0.8
Left 13 3.4 0.01 17 0.0
Thru 114 1.9 0.06 145 0.1
Thru 492 2.9 0.40 640 0.5
Right 31 1.6 0.01 41 0.0
Snelling at Co B
(vph) (sec/veh) (hrs) (hrs) (hrs)
Left 134 94.4 3.51 174 4.6
Thru 881 5.3 6 9.4 1.29 1,231 1.8
Right 83 1.8 0.04 104 0.1
Left 153 88.0 3.74 213 5.2
Thru 1,538 23.0 6 5.3 9.82 2,064 13.2
Right 334 17.2 1.60 438 2.1
Left 103 98.2 2.82 130 3.5
Thru 237 90.7 5.97 307 7.7
Right 46 12.8 0.16 59 0.2
Left 138 79.8 3.05 178 3.9
Thru 273 88.7 6.72 353 8.7
Right 129 15.7 0.56 184 0.8
Snelling at HarMar
(vph) (sec/veh) (hrs) (hrs) (hrs)
Left 55 78.2 1.19 70 1.5
Thru 952 9.8 6 9.4 2.58 1,324 3.6
Right 57 1.6 0.03 72 0.0
Left 58 71.8 1.16 78 1.5
Thru 1,597 2.8 6 5.3 1.26 2,140 1.7
Right 69 2.4 0.05 88 0.1
Left 66 83.3 1.52 85 2.0
Thru 31 78.5 0.68 43 0.9
Right 112 12.8 0.40 142 0.5
Left 39 88.7 0.96 50 1.2
Thru 18 86.1 0.44 22 0.5
Right 78 8.3 0.18 96 0.2
Person
Delay
Person
Delay
Person
Delay
Person
Delay
Westbound
Northbound
13.8
Southbound
Eastbound
Movement
DelayApproach Movement
Eastbound
Westbound
Northbound
51.8
Southbound
Person
Delay
Westbound
Approach Movement
Simulated
Volume
Movement
Delay
Rapid Bus
Volume
Rapid Bus
Passengers/B
us
Rapid Bus
Volume
Rapid Bus
Passengers/B
us
Simulated
VolumeTotal Delay Total
Persons
Total Delay Total
Persons
Person
Delay
1.9
Southbound
Eastbound
Simulated
Volume
Movement
Delay
Rapid Bus
Passengers/B
us
Total Delay Total
Persons
Person
Delay
Movement
Movement
Total Delay Total
Persons
Rapid Bus
Volume
6.2
Southbound
Eastbound
Approach
Person
Delay
Westbound
Northbound
Approach
Rapid Bus
Volume
Rapid Bus
Passengers/B
us
Simulated
Volume
Movement
Delay
* Results shown are the average of 5 model runs.
** Results shown are from all vehicles except transit vehicles.
H:\Projects\7939\SD\VISSIM\4_RB_TSP\11 MOEs\7939_4_RB_TSP_AM PersonDelay.xls 7/2/2013

Year 2013 Scenario 4 Rapid Bus w/TSP Conditions VISSIM Model
Snelling Avenue Rapid Bus VISSIM Evaluation
Person Delay (A.M. Peak Hour 7:30 - 8:30)
Snelling at Roselawn
(vph) (sec/veh) (hrs) (hrs) (hrs)
Left 10 77.8 0.22 14 0.3
Thru 937 4.6 6 9.4 1.20 1,301 1.7
Right 9 2.6 0.01 11 0.0
Left 33 117.2 1.07 42 1.4
Thru 1,663 2.8 6 5.3 1.27 2,221 1.7
Right 46 2.5 0.03 61 0.0
Left 24 121.4 0.82 32 1.1
Thru 42 108.7 1.28 54 1.6
Right 77 13.9 0.30 100 0.4
Left 47 111.0 1.46 60 1.9
Thru 114 112.2 3.54 148 4.6
Right 103 17.4 0.50 133 0.6
Snelling at Larpenteur
(vph) (sec/veh) (hrs) (hrs) (hrs)
Left 182 84.2 4.25 236 5.5
Thru 787 17.1 6 9.4 3.73 1,105 5.2
Right 40 4.2 0.05 54 0.1
Left 48 122.1 1.63 61 2.1
Thru 1,620 24.4 6 5.3 10.99 2,165 14.7
Right 120 13.2 0.44 159 0.6
Left 84 79.8 1.86 111 2.5
Thru 192 69.0 3.69 249 4.8
Right 21 59.0 0.35 26 0.4
Left 208 328.2 18.92 265 24.2
Thru 679 345.4 65.18 883 84.7
Right 85 344.1 8.14 110 10.5
Snelling at Hoyt
(vph) (sec/veh) (hrs) (hrs) (hrs)
Left 14 18.0 0.07 19 0.1
Thru 922 5.2 6 9.4 1.32 1,283 1.8
Right 30 2.9 0.02 35 0.0
Left 15 8.0 0.03 21 0.0
Thru 1,820 2.2 6 5.3 1.13 2,419 1.5
Right 14 2.6 0.01 18 0.0
Left 10 71.6 0.20 13 0.3
Thru 7 85.9 0.17 9 0.2
Right 8 18.0 0.04 11 0.1
Left 73 90.5 1.85 96 2.4
Thru 9 76.5 0.18 11 0.2
Right 77 16.6 0.36 100 0.5
Snelling at Midway
(vph) (sec/veh) (hrs) (hrs) (hrs)
Left 44 22.0 0.27 56 0.3
Thru 940 5.3 6 9.4 1.39 1,302 1.9
Right 21 2.6 0.02 27 0.0
Left 42 8.3 0.10 55 0.1
Thru 1,808 4.0 6 5.3 1.99 2,406 2.6
Right 52 4.6 0.07 66 0.1
Left 0 - - 0 -
Thru 14 81.4 0.31 18 0.4
Right 3 11.0 0.01 4 0.0
Left 45 80.0 1.00 60 1.3
Thru 26 85.1 0.61 33 0.8
Right 23 7.4 0.05 29 0.1
Person
Delay
Person
Delay
Person
Delay
Person
Delay
Westbound
Northbound
7.7
Southbound
Eastbound
Eastbound
Westbound
Approach
Northbound
7.2
Southbound
Westbound
Approach Movement
Simulated
Volume
Movement
Delay
Northbound
155.2
Southbound
Eastbound
Approach Movement
Simulated
Volume
Movement
Delay
Eastbound
Westbound
Movement
Simulated
Volume
Northbound
15.3
Southbound
Simulated
Volume
Movement
DelayApproach Movement
Movement
Delay
Person
Delay
Rapid Bus
Volume
Rapid Bus
Passengers/B
us
Total Delay Total
Persons
Person
Delay
Person
Delay
Rapid Bus
Volume
Rapid Bus
Passengers/B
us
Total Delay Total
Persons
Person
Delay
Rapid Bus
Volume
Rapid Bus
Passengers/B
us
Total Delay Total
Persons
Rapid Bus
Volume
Rapid Bus
Passengers/B
us
Total Delay Total
Persons
* Results shown are the average of 5 model runs.
** Results shown are from all vehicles except transit vehicles.
H:\Projects\7939\SD\VISSIM\4_RB_TSP\11 MOEs\7939_4_RB_TSP_AM PersonDelay.xls 7/2/2013

Year 2013 Scenario 4 Rapid Bus w/TSP Conditions VISSIM Model
Snelling Avenue Rapid Bus VISSIM Evaluation
Person Delay (A.M. Peak Hour 7:30 - 8:30)
Snelling at Hewitt
(vph) (sec/veh) (hrs) (hrs) (hrs)
Left 14 13.3 0.05 18 0.1
Thru 1,069 13.1 6 15.5 3.90 1,505 5.5
Right 21 12.7 0.07 25 0.1
Left 75 14.1 0.30 97 0.4
Thru 1,360 9.2 6 9.7 3.49 1,852 4.7
Right 28 4.9 0.04 36 0.0
Left 49 32.0 0.44 63 0.6
Thru 11 34.2 0.10 14 0.1
Right 30 15.9 0.13 39 0.2
Left 58 32.8 0.53 75 0.7
Thru 5 33.7 0.04 6 0.1
Right 7 16.2 0.03 9 0.0
Snelling at Minnehaha
(vph) (sec/veh) (hrs) (hrs) (hrs)
Left 18 21.0 0.10 23 0.1
Thru 995 8.4 6 15.5 2.32 1,406 3.3
Right 12 6.6 0.02 15 0.0
Left 35 13.8 0.13 46 0.2
Thru 1,289 12.6 6 9.7 4.53 1,758 6.2
Right 124 14.1 0.48 163 0.6
Left 55 45.4 0.70 73 0.9
Thru 58 36.4 0.59 72 0.7
Right 22 35.1 0.21 28 0.3
Left 35 38.0 0.37 45 0.5
Thru 69 36.9 0.70 90 0.9
Right 53 34.8 0.51 68 0.7
Snelling at Thomas
(vph) (sec/veh) (hrs) (hrs) (hrs)
Left 22 13.8 0.08 28 0.1
Thru 946 9.6 6 15.5 2.53 1,344 3.6
Right 24 7.9 0.05 30 0.1
Left 33 14.0 0.13 41 0.2
Thru 1,248 12.9 6 9.7 4.46 1,707 6.1
Right 67 9.1 0.17 86 0.2
Left 31 32.9 0.28 39 0.4
Thru 22 32.1 0.19 27 0.2
Right 16 16.9 0.08 22 0.1
Left 25 32.7 0.23 32 0.3
Thru 45 26.9 0.34 60 0.5
Right 49 14.2 0.19 63 0.2
Snelling at University
(vph) (sec/veh) (hrs) (hrs) (hrs)
Left 161 26.8 1.20 209 1.6
Thru 869 14.1 6 15.5 3.41 1,246 4.9
Right 126 4.2 0.15 196 0.2
Left 154 30.2 1.30 197 1.7
Thru 998 26.1 6 9.7 7.23 1,390 10.1
Right 144 16.6 0.67 185 0.9
Left 50 48.4 0.67 64 0.9
Thru 227 37.9 2.39 289 3.1
Right 137 29.4 1.12 174 1.4
Left 148 227.2 9.33 220 13.9
Thru 549 52.1 7.93 706 10.2
Right 75 46.6 0.97 95 1.2
Person
Delay
Person
Delay
Person
Delay
Person
Delay
Northbound
49.9
Southbound
Eastbound
Westbound
Movement
Simulated
Volume
Movement
Delay
Northbound
11.9
Southbound
Eastbound
Westbound
Approach
Westbound
Approach Movement
Simulated
Volume
Movement
Delay
Northbound
14.4
Southbound
Eastbound
Approach Movement
Simulated
Volume
Movement
Delay
Eastbound
Westbound
Northbound
12.5
Southbound
Approach Movement
Simulated
Volume
Movement
Delay
Total
Persons
Person
Delay
Total
Persons
Person
Delay
Rapid Bus
Volume
Rapid Bus
Passengers/B
us
Total Delay
Person
Delay
Rapid Bus
Volume
Rapid Bus
Passengers/B
us
Total Delay
Total Delay Total
Persons
Person
Delay
Rapid Bus
Volume
Rapid Bus
Passengers/B
us
Total Delay Total
Persons
Rapid Bus
Volume
Rapid Bus
Passengers/B
us
* Results shown are the average of 5 model runs.
** Results shown are from all vehicles except transit vehicles.
H:\Projects\7939\SD\VISSIM\4_RB_TSP\11 MOEs\7939_4_RB_TSP_AM PersonDelay.xls 7/2/2013
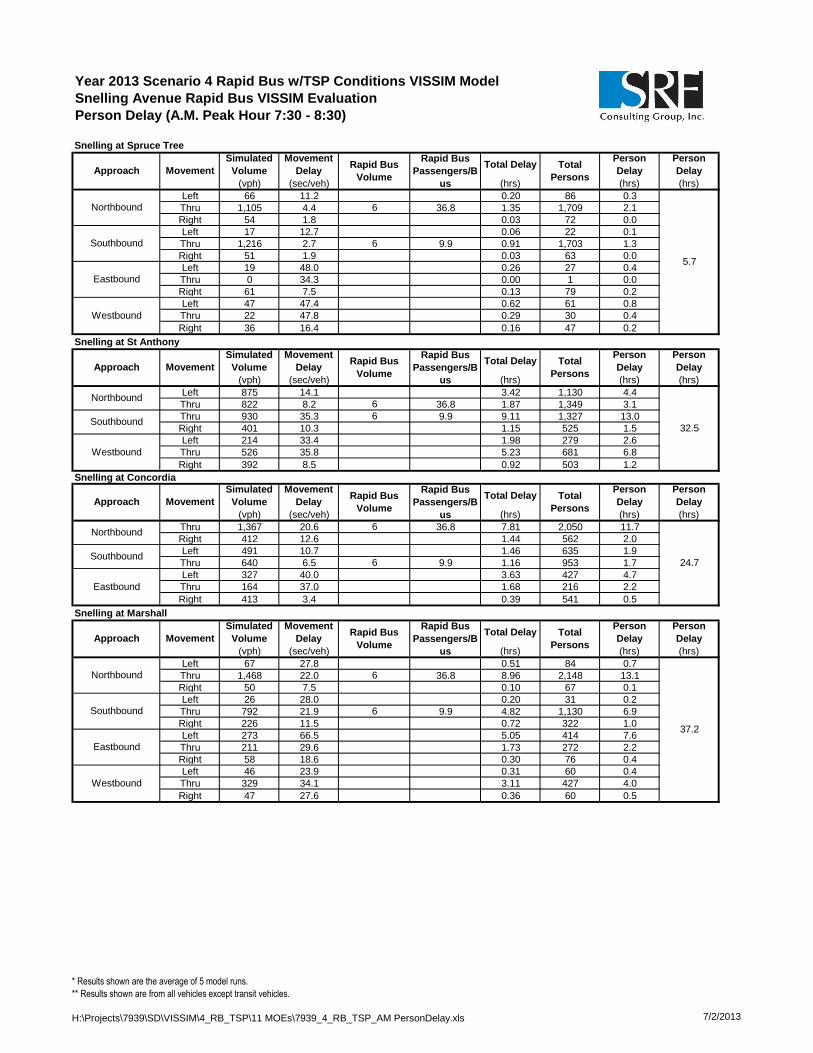
Year 2013 Scenario 4 Rapid Bus w/TSP Conditions VISSIM Model
Snelling Avenue Rapid Bus VISSIM Evaluation
Person Delay (A.M. Peak Hour 7:30 - 8:30)
Snelling at Spruce Tree
(vph) (sec/veh) (hrs) (hrs) (hrs)
Left 66 11.2 0.20 86 0.3
Thru 1,105 4.4 6 36.8 1.35 1,709 2.1
Right 54 1.8 0.03 72 0.0
Left 17 12.7 0.06 22 0.1
Thru 1,216 2.7 6 9.9 0.91 1,703 1.3
Right 51 1.9 0.03 63 0.0
Left 19 48.0 0.26 27 0.4
Thru 0 34.3 0.00 1 0.0
Right 61 7.5 0.13 79 0.2
Left 47 47.4 0.62 61 0.8
Thru 22 47.8 0.29 30 0.4
Right 36 16.4 0.16 47 0.2
Snelling at St Anthony
(vph) (sec/veh) (hrs) (hrs) (hrs)
Left 875 14.1 3.42 1,130 4.4
Thru 822 8.2 6 36.8 1.87 1,349 3.1
Thru 930 35.3 6 9.9 9.11 1,327 13.0
Right 401 10.3 1.15 525 1.5
Left 214 33.4 1.98 279 2.6
Thru 526 35.8 5.23 681 6.8
Right 392 8.5 0.92 503 1.2
Snelling at Concordia
(vph) (sec/veh) (hrs) (hrs) (hrs)
Thru 1,367 20.6 6 36.8 7.81 2,050 11.7
Right 412 12.6 1.44 562 2.0
Left 491 10.7 1.46 635 1.9
Thru 640 6.5 6 9.9 1.16 953 1.7
Left 327 40.0 3.63 427 4.7
Thru 164 37.0 1.68 216 2.2
Right 413 3.4 0.39 541 0.5
Snelling at Marshall
(vph) (sec/veh) (hrs) (hrs) (hrs)
Left 67 27.8 0.51 84 0.7
Thru 1,468 22.0 6 36.8 8.96 2,148 13.1
Right 50 7.5 0.10 67 0.1
Left 26 28.0 0.20 31 0.2
Thru 792 21.9 6 9.9 4.82 1,130 6.9
Right 226 11.5 0.72 322 1.0
Left 273 66.5 5.05 414 7.6
Thru 211 29.6 1.73 272 2.2
Right 58 18.6 0.30 76 0.4
Left 46 23.9 0.31 60 0.4
Thru 329 34.1 3.11 427 4.0
Right 47 27.6 0.36 60 0.5
Person
Delay
Person
Delay
Person
Delay
Northbound
37.2
Southbound
Eastbound
Westbound
Approach
Person
DelayMovement
Simulated
Volume
Movement
Delay
Southbound
Eastbound
Northbound
Simulated
Volume
Movement
Delay
24.7
Approach Movement
Person
Delay
Simulated
Volume
Movement
Delay
Northbound
32.5Southbound
Westbound
Approach Movement
Simulated
Volume
Movement
Delay
Northbound
Movement
5.7
Southbound
Eastbound
Westbound
Approach
Total
Persons
Rapid Bus
Volume
Rapid Bus
Passengers/B
us
Total Delay Total
Persons
Person
Delay
Total DelayRapid Bus
Volume
Rapid Bus
Passengers/B
us
Rapid Bus
Volume
Rapid Bus
Passengers/B
us
Total Delay Total
Persons
Person
Delay
Rapid Bus
Volume
Rapid Bus
Passengers/B
us
Total Delay Total
Persons
Person
Delay
* Results shown are the average of 5 model runs.
** Results shown are from all vehicles except transit vehicles.
H:\Projects\7939\SD\VISSIM\4_RB_TSP\11 MOEs\7939_4_RB_TSP_AM PersonDelay.xls 7/2/2013

Year 2013 Scenario 4 Rapid Bus w/TSP Conditions VISSIM Model
Snelling Avenue Rapid Bus VISSIM Evaluation
Person Delay (A.M. Peak Hour 7:30 - 8:30)
Snelling at Selby
(vph) (sec/veh) (hrs) (hrs) (hrs)
Left 12 44.6 0.15 15 0.2
Thru 1,073 44.9 6 36.8 13.36 1,644 20.5
Right 21 39.4 0.23 27 0.3
Left 228 53.5 3.39 293 4.4
Thru 643 13.5 6 9.9 2.41 939 3.5
Right 28 12.5 0.10 37 0.1
Left 66 332.8 6.08 86 8.0
Thru 144 101.0 4.05 188 5.3
Right 12 84.4 0.29 16 0.4
Left 30 45.0 0.38 39 0.5
Thru 176 47.7 2.33 230 3.1
Right 454 39.0 4.92 584 6.3
Snelling at Summit
(vph) (sec/veh) (hrs) (hrs) (hrs)
Left 40 9.8 0.11 51 0.1
Thru 916 4.9 6 36.8 1.24 1,438 1.9
Right 31 5.8 0.05 40 0.1
Left 40 27.3 0.31 51 0.4
Thru 552 20.1 6 9.9 3.08 820 4.6
Right 101 19.7 0.55 132 0.7
Left 49 58.0 0.78 63 1.0
Thru 178 25.9 1.28 229 1.7
Right 13 21.6 0.08 17 0.1
Left 63 46.2 0.81 83 1.1
Thru 355 47.7 4.70 459 6.1
Right 146 41.7 1.69 189 2.2
Snelling at Grand
(vph) (sec/veh) (hrs) (hrs) (hrs)
Left 44 12.6 0.15 56 0.2
Thru 763 13.2 6 36.8 2.81 1,238 4.6
Right 56 12.3 0.19 74 0.3
Left 99 24.5 0.67 130 0.9
Thru 423 13.8 6 9.9 1.62 650 2.5
Right 101 9.9 0.28 131 0.4
Left 46 31.8 0.40 59 0.5
Thru 184 30.8 1.58 243 2.1
Right 23 24.5 0.16 30 0.2
Left 81 69.0 1.54 103 2.0
Thru 295 77.0 6.32 375 8.0
Right 176 69.9 3.42 229 4.4
Snelling at St Clair
(vph) (sec/veh) (hrs) (hrs) (hrs)
Left 39 11.1 0.12 48 0.1
Thru 645 5.9 6 22.9 1.05 1,001 1.6
Right 43 3.3 0.04 55 0.1
Left 46 13.9 0.18 60 0.2
Thru 449 7.2 6 8.8 0.90 672 1.3
Right 30 6.6 0.06 40 0.1
Left 47 43.8 0.57 61 0.7
Thru 217 32.1 1.93 278 2.5
Right 39 19.1 0.21 50 0.3
Left 69 51.3 0.98 87 1.2
Thru 256 43.5 3.10 332 4.0
Right 180 32.1 1.60 236 2.1
Person
Delay
Person
Delay
Person
Delay
Person
Delay
Northbound
14.3
Southbound
Eastbound
Westbound
Approach Movement
Simulated
Volume
Movement
Delay
Northbound
Simulated
Volume
Movement
Delay
26.0
Southbound
Eastbound
Westbound
Approach Movement
Northbound
19.9
Southbound
Eastbound
Westbound
Approach Movement
Simulated
Volume
Movement
Delay
Northbound
Simulated
Volume
Movement
Delay
52.5
Southbound
Eastbound
Westbound
Approach Movement
Person
DelayRapid Bus
Volume
Rapid Bus
Passengers/B
us
Total Delay Total
Persons
Person
Delay
Rapid Bus
Volume
Rapid Bus
Passengers/B
us
Total Delay Total
Persons
Person
Delay
Total
Persons
Person
DelayTotal
Persons
Rapid Bus
Volume
Rapid Bus
Passengers/B
us
Total Delay
Rapid Bus
Volume
Rapid Bus
Passengers/B
us
Total Delay
* Results shown are the average of 5 model runs.
** Results shown are from all vehicles except transit vehicles.
H:\Projects\7939\SD\VISSIM\4_RB_TSP\11 MOEs\7939_4_RB_TSP_AM PersonDelay.xls 7/2/2013
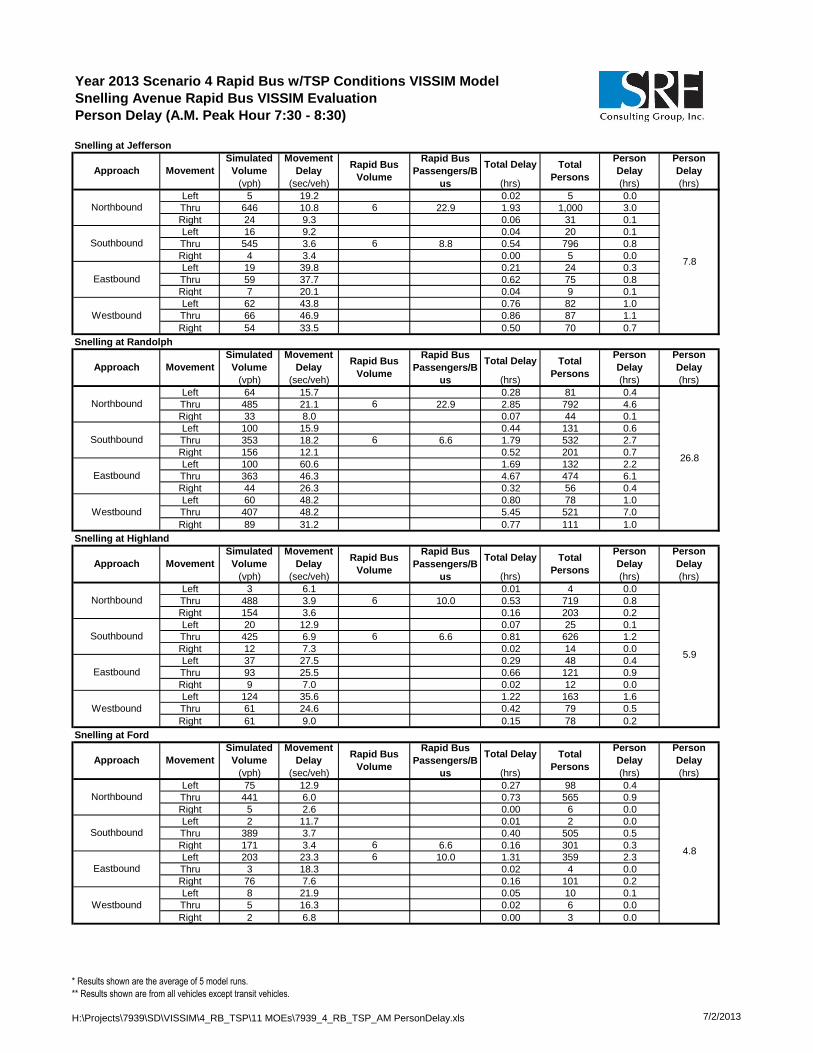
Year 2013 Scenario 4 Rapid Bus w/TSP Conditions VISSIM Model
Snelling Avenue Rapid Bus VISSIM Evaluation
Person Delay (A.M. Peak Hour 7:30 - 8:30)
Snelling at Jefferson
(vph) (sec/veh) (hrs) (hrs) (hrs)
Left 5 19.2 0.02 5 0.0
Thru 646 10.8 6 22.9 1.93 1,000 3.0
Right 24 9.3 0.06 31 0.1
Left 16 9.2 0.04 20 0.1
Thru 545 3.6 6 8.8 0.54 796 0.8
Right 4 3.4 0.00 5 0.0
Left 19 39.8 0.21 24 0.3
Thru 59 37.7 0.62 75 0.8
Right 7 20.1 0.04 9 0.1
Left 62 43.8 0.76 82 1.0
Thru 66 46.9 0.86 87 1.1
Right 54 33.5 0.50 70 0.7
Snelling at Randolph
(vph) (sec/veh) (hrs) (hrs) (hrs)
Left 64 15.7 0.28 81 0.4
Thru 485 21.1 6 22.9 2.85 792 4.6
Right 33 8.0 0.07 44 0.1
Left 100 15.9 0.44 131 0.6
Thru 353 18.2 6 6.6 1.79 532 2.7
Right 156 12.1 0.52 201 0.7
Left 100 60.6 1.69 132 2.2
Thru 363 46.3 4.67 474 6.1
Right 44 26.3 0.32 56 0.4
Left 60 48.2 0.80 78 1.0
Thru 407 48.2 5.45 521 7.0
Right 89 31.2 0.77 111 1.0
Snelling at Highland
(vph) (sec/veh) (hrs) (hrs) (hrs)
Left 3 6.1 0.01 4 0.0
Thru 488 3.9 6 10.0 0.53 719 0.8
Right 154 3.6 0.16 203 0.2
Left 20 12.9 0.07 25 0.1
Thru 425 6.9 6 6.6 0.81 626 1.2
Right 12 7.3 0.02 14 0.0
Left 37 27.5 0.29 48 0.4
Thru 93 25.5 0.66 121 0.9
Right 9 7.0 0.02 12 0.0
Left 124 35.6 1.22 163 1.6
Thru 61 24.6 0.42 79 0.5
Right 61 9.0 0.15 78 0.2
Snelling at Ford
(vph) (sec/veh) (hrs) (hrs) (hrs)
Left 75 12.9 0.27 98 0.4
Thru 441 6.0 0.73 565 0.9
Right 5 2.6 0.00 6 0.0
Left 2 11.7 0.01 2 0.0
Thru 389 3.7 0.40 505 0.5
Right 171 3.4 6 6.6 0.16 301 0.3
Left 203 23.3 6 10.0 1.31 359 2.3
Thru 3 18.3 0.02 4 0.0
Right 76 7.6 0.16 101 0.2
Left 8 21.9 0.05 10 0.1
Thru 5 16.3 0.02 6 0.0
Right 2 6.8 0.00 3 0.0
Person
Delay
Person
Delay
Northbound
4.8
Southbound
Eastbound
Westbound
Approach
Person
DelayMovement
Simulated
Volume
Movement
Delay
Northbound
Simulated
Volume
Movement
Delay
5.9
Southbound
Eastbound
Westbound
Approach Movement
Northbound
26.8
Southbound
Eastbound
Westbound
Approach Movement
Simulated
Volume
Movement
Delay
Northbound
Simulated
Volume
Movement
Delay
7.8
Southbound
Eastbound
Westbound
Approach Movement
Person
DelayTotal
Persons
Total
Persons
Rapid Bus
Volume
Rapid Bus
Passengers/B
us
Total Delay
Person
Delay
Rapid Bus
Volume
Rapid Bus
Passengers/B
us
Total Delay Total
Persons
Person
Delay
Person
Delay
Person
Delay
Rapid Bus
Volume
Rapid Bus
Passengers/B
us
Total Delay
Rapid Bus
Volume
Rapid Bus
Passengers/B
us
Total Delay Total
Persons
* Results shown are the average of 5 model runs.
** Results shown are from all vehicles except transit vehicles.
H:\Projects\7939\SD\VISSIM\4_RB_TSP\11 MOEs\7939_4_RB_TSP_AM PersonDelay.xls 7/2/2013
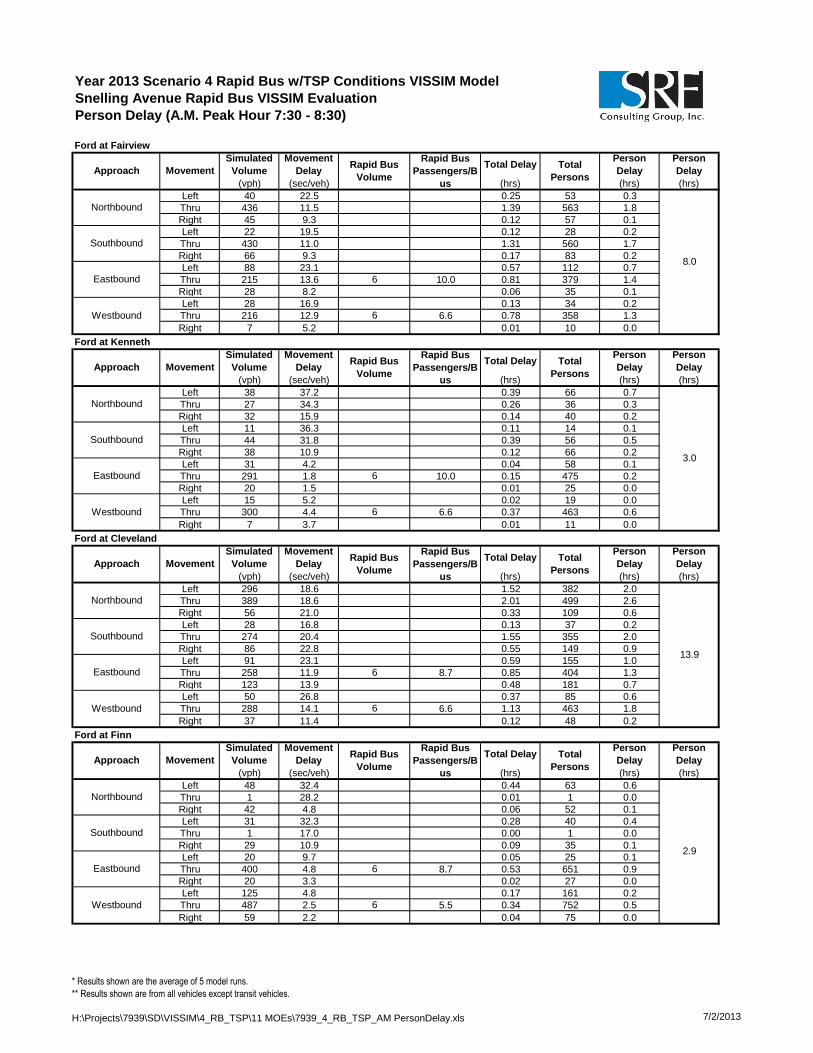
Year 2013 Scenario 4 Rapid Bus w/TSP Conditions VISSIM Model
Snelling Avenue Rapid Bus VISSIM Evaluation
Person Delay (A.M. Peak Hour 7:30 - 8:30)
Ford at Fairview
(vph) (sec/veh) (hrs) (hrs) (hrs)
Left 40 22.5 0.25 53 0.3
Thru 436 11.5 1.39 563 1.8
Right 45 9.3 0.12 57 0.1
Left 22 19.5 0.12 28 0.2
Thru 430 11.0 1.31 560 1.7
Right 66 9.3 0.17 83 0.2
Left 88 23.1 0.57 112 0.7
Thru 215 13.6 6 10.0 0.81 379 1.4
Right 28 8.2 0.06 35 0.1
Left 28 16.9 0.13 34 0.2
Thru 216 12.9 6 6.6 0.78 358 1.3
Right 7 5.2 0.01 10 0.0
Ford at Kenneth
(vph) (sec/veh) (hrs) (hrs) (hrs)
Left 38 37.2 0.39 66 0.7
Thru 27 34.3 0.26 36 0.3
Right 32 15.9 0.14 40 0.2
Left 11 36.3 0.11 14 0.1
Thru 44 31.8 0.39 56 0.5
Right 38 10.9 0.12 66 0.2
Left 31 4.2 0.04 58 0.1
Thru 291 1.8 6 10.0 0.15 475 0.2
Right 20 1.5 0.01 25 0.0
Left 15 5.2 0.02 19 0.0
Thru 300 4.4 6 6.6 0.37 463 0.6
Right 7 3.7 0.01 11 0.0
Ford at Cleveland
(vph) (sec/veh) (hrs) (hrs) (hrs)
Left 296 18.6 1.52 382 2.0
Thru 389 18.6 2.01 499 2.6
Right 56 21.0 0.33 109 0.6
Left 28 16.8 0.13 37 0.2
Thru 274 20.4 1.55 355 2.0
Right 86 22.8 0.55 149 0.9
Left 91 23.1 0.59 155 1.0
Thru 258 11.9 6 8.7 0.85 404 1.3
Right 123 13.9 0.48 181 0.7
Left 50 26.8 0.37 85 0.6
Thru 288 14.1 6 6.6 1.13 463 1.8
Right 37 11.4 0.12 48 0.2
Ford at Finn
(vph) (sec/veh) (hrs) (hrs) (hrs)
Left 48 32.4 0.44 63 0.6
Thru 1 28.2 0.01 1 0.0
Right 42 4.8 0.06 52 0.1
Left 31 32.3 0.28 40 0.4
Thru 1 17.0 0.00 1 0.0
Right 29 10.9 0.09 35 0.1
Left 20 9.7 0.05 25 0.1
Thru 400 4.8 6 8.7 0.53 651 0.9
Right 20 3.3 0.02 27 0.0
Left 125 4.8 0.17 161 0.2
Thru 487 2.5 6 5.5 0.34 752 0.5
Right 59 2.2 0.04 75 0.0
Person
Delay
Person
Delay
Northbound
2.9
Southbound
Eastbound
Westbound
Approach Movement
Simulated
Volume
Movement
Delay
Northbound
Simulated
Volume
Movement
Delay
13.9
Southbound
Eastbound
Westbound
Approach Movement
3.0
Southbound
Eastbound
Westbound
Approach
Person
Delay
Simulated
Volume
Movement
Delay
Northbound
Simulated
Volume
Movement
Delay
Northbound
Movement
Movement
Southbound
Eastbound
Westbound
Approach
Person
Delay
Total
Persons
Person
Delay
Rapid Bus
Volume
Person
DelayRapid Bus
Volume
Rapid Bus
Passengers/B
us
Total Delay
Rapid Bus
Volume
Rapid Bus
Passengers/B
us
Total Delay Total
Persons
Rapid Bus
Passengers/B
us
Total Delay Total
Persons
Person
Delay
Total
Persons
8.0
Person
DelayRapid Bus
Volume
Rapid Bus
Passengers/B
us
Total Delay
* Results shown are the average of 5 model runs.
** Results shown are from all vehicles except transit vehicles.
H:\Projects\7939\SD\VISSIM\4_RB_TSP\11 MOEs\7939_4_RB_TSP_AM PersonDelay.xls 7/2/2013

Year 2013 Scenario 4 Rapid Bus w/TSP Conditions VISSIM Model
Snelling Avenue Rapid Bus VISSIM Evaluation
Person Delay (A.M. Peak Hour 7:30 - 8:30)
Ford at Cretin
(vph) (sec/veh) (hrs) (hrs) (hrs)
Left 117 32.2 1.05 168 1.5
Right 65 4.1 0.07 85 0.1
Left 112 8.0 0.25 145 0.3
Thru 322 3.8 6 8.7 0.34 532 0.6
Thru 380 4.6 6 5.5 0.48 589 0.7
Right 181 5.7 0.29 257 0.4
46th at 46th
(vph) (sec/veh) (hrs) (hrs) (hrs)
Left 28 61.9 0.47 36 0.6
Thru 33 53.4 0.48 40 0.6
Right 217 2.6 0.16 281 0.2
Left 50 43.3 0.60 71 0.9
Thru 15 52.6 0.22 20 0.3
Right 42 54.0 0.63 55 0.8
Left 25 14.4 0.10 30 0.1
Thru 169 19.1 6 8.7 0.89 324 1.7
Right 34 15.7 0.15 44 0.2
Left 142 9.3 0.37 179 0.5
Thru 219 8.0 6 5.5 0.49 367 0.8
Right 81 7.4 0.17 125 0.3
46th at 42nd
(vph) (sec/veh) (hrs) (hrs) (hrs)
Left 5 29.0 0.04 8 0.1
Thru 5 32.2 0.05 6 0.1
Right 4 7.7 0.01 5 0.0
Left 28 32.7 0.25 36 0.3
Thru 4 28.7 0.03 5 0.0
Right 84 12.2 0.28 111 0.4
Left 49 21.9 0.30 63 0.4
Thru 190 17.4 6 8.7 0.92 349 1.7
Right 14 12.1 0.05 18 0.1
Left 4 18.6 0.02 5 0.0
Thru 269 14.0 6 5.5 1.05 431 1.7
Right 13 7.4 0.03 18 0.0
46th at Minnehaha
(vph) (sec/veh) (hrs) (hrs) (hrs)
Left 22 28.3 0.17 29 0.2
Thru 274 24.2 1.84 353 2.4
Right 13 14.1 0.05 18 0.1
Left 38 32.4 0.35 49 0.4
Thru 166 22.9 1.05 211 1.3
Right 109 11.2 0.34 138 0.4
Left 127 21.0 0.74 165 1.0
Thru 206 13.8 6 8.7 0.79 370 1.4
Right 25 11.9 0.08 31 0.1
Left 74 32.8 0.67 94 0.9
Thru 179 28.7 6 5.5 1.43 319 2.5
Right 113 20.0 0.63 147 0.8
Person
Delay
Person
Delay
Person
Delay
Person
Delay
Northbound
11.6
Southbound
Eastbound
Westbound
Approach Movement
Simulated
Volume
Movement
Delay
Northbound
Simulated
Volume
Movement
Delay
4.7
Southbound
Eastbound
Westbound
Approach Movement
Simulated
Volume
Movement
Delay
Northbound
7.0
Southbound
Eastbound
Westbound
Approach Movement
Simulated
Volume
Movement
Delay
3.6
Movement
Southbound
Eastbound
Westbound
ApproachTotal Delay Total
Persons
Person
Delay
Rapid Bus
Passengers/B
us
Person
DelayTotal
Persons
Total
Persons
Rapid Bus
Volume
Rapid Bus
Passengers/B
us
Total Delay
Person
Delay
Rapid Bus
Volume
Rapid Bus
Passengers/B
us
Total Delay Total
Persons
Person
Delay
Rapid Bus
Volume
Rapid Bus
Passengers/B
us
Total Delay
Rapid Bus
Volume
* Results shown are the average of 5 model runs.
** Results shown are from all vehicles except transit vehicles.
H:\Projects\7939\SD\VISSIM\4_RB_TSP\11 MOEs\7939_4_RB_TSP_AM PersonDelay.xls 7/2/2013

Year 2013 Scenario 4 Rapid Bus w/TSP Conditions VISSIM Model
Snelling Avenue Rapid Bus VISSIM Evaluation
Person Delay (A.M. Peak Hour 7:30 - 8:30)
46th at Hiawatha
(vph) (sec/veh) (hrs) (hrs) (hrs)
Left 26 39.5 0.29 35 0.4
Thru 882 24.3 5.97 1,128 7.6
Right 183 2.3 0.12 238 0.2
Left 94 36.1 0.94 117 1.2
Thru 530 16.4 2.42 682 3.1
Right 14 0.9 0.00 17 0.0
Left 63 22.9 0.40 83 0.5
Thru 80 29.1 6 8.7 0.65 210 1.7
Right 44 32.9 0.41 58 0.5
Left 164 34.0 1.55 213 2.0
Thru 71 23.9 6 5.5 0.47 174 1.2
Right 71 7.6 0.15 92 0.2
46th at 36th
(vph) (sec/veh) (hrs) (hrs) (hrs)
Left 5 7.7 0.01 6 0.0
Thru 0 - - 0 -
Right 5 4.5 0.01 6 0.0
Left 41 8.3 6 8.7 0.09 160 0.4
Thru 0 - - 0 -
Right 15 4.2 0.02 21 0.0
Left 15 6.2 0.03 18 0.0
Thru 142 6.1 0.24 182 0.3
Right 8 2.8 0.01 11 0.0
Left 1 4.7 0.00 2 0.0
Thru 86 3.6 0.08 111 0.1
Right 24 2.5 6 5.5 0.02 112 0.1
Person
Delay
Person
Delay
Westbound
Simulated
Volume
Movement
Delay
1.0
Southbound
Eastbound
Approach
Westbound
Northbound
Simulated
Volume
Movement
Delay
Northbound
18.6
Southbound
Movement
Eastbound
Approach Movement
Person
Delay
Rapid Bus
Volume
Rapid Bus
Passengers/B
us
Total Delay Total
Persons
Person
Delay
Total
Persons
Rapid Bus
Volume
Rapid Bus
Passengers/B
us
Total Delay
* Results shown are the average of 5 model runs.
** Results shown are from all vehicles except transit vehicles.
H:\Projects\7939\SD\VISSIM\4_RB_TSP\11 MOEs\7939_4_RB_TSP_AM PersonDelay.xls 7/2/2013

Year 2013 Scenario 4 Rapid Bus w/TSP VISSIM Model
Snelling Avenue Rapid Bus VISSIM Evaluation
Person Delay (P.M. Peak Hour 4:45 - 5:45)
Co B2 at Snelling W Ramps
(vph) (sec/veh) (hrs) (hrs) (hrs)
Left 75 32.6 0.68 99 0.9
Thru 151 34.3 6 16.9 1.44 331 3.2
Right 142 4.0 0.16 185 0.2
Left 6 42.0 0.07 7 0.1
Thru 106 43.2 1.27 137 1.6
Right 148 4.4 0.18 192 0.2
Left 403 52.2 5.85 521 7.6
Thru 747 27.0 5.61 973 7.3
Right 77 10.4 0.22 99 0.3
Left 350 46.1 6 19.2 4.48 603 7.7
Thru 438 22.7 2.76 574 3.6
Right 24 6.2 0.04 49 0.1
Co B2 at Snelling E Ramps
(vph) (sec/veh) (hrs) (hrs) (hrs)
Left 21 41.1 0.24 28 0.3
Right 495 23.6 6 19.2 3.24 813 5.3
Left 248 9.6 0.66 324 0.9
Thru 648 5.0 0.90 843 1.2
Thru 318 8.1 0.71 413 0.9
Right 38 2.8 0.03 50 0.0
Snelling at Co B
(vph) (sec/veh) (hrs) (hrs) (hrs)
Left 153 79.5 3.39 198 4.4
Thru 1,562 8.6 6 19.2 3.73 2,175 5.2
Right 212 3.3 0.20 276 0.3
Left 425 112.6 13.28 566 17.7
Thru 1,246 30.1 6 16.9 10.42 1,750 14.6
Right 294 15.7 1.28 382 1.7
Left 166 436.4 20.13 217 26.3
Thru 467 414.0 53.75 606 69.6
Right 142 346.8 13.69 186 17.9
Left 167 88.2 4.10 216 5.3
Thru 261 73.7 5.34 339 6.9
Right 299 21.8 1.81 404 2.4
Snelling at HarMar
(vph) (sec/veh) (hrs) (hrs) (hrs)
Left 51 74.7 1.05 67 1.4
Thru 1,612 5.5 6 19.2 2.46 2,240 3.4
Right 268 3.3 0.25 346 0.3
Left 124 69.8 2.41 159 3.1
Thru 1,334 6.2 6 16.9 2.30 1,865 3.2
Right 98 3.3 0.09 128 0.1
Left 115 80.3 2.57 150 3.3
Thru 49 87.6 1.20 63 1.5
Right 80 11.2 0.25 103 0.3
Left 100 83.8 2.32 128 3.0
Thru 57 78.1 1.24 75 1.6
Right 197 11.7 0.64 255 0.8
Approach
Rapid Bus
Volume
Rapid Bus
Passengers/B
us
Simulated
Volume
Movement
DelayTotal
Persons
Rapid Bus
Volume
32.8
Southbound
Eastbound
Approach
Person
Delay
Westbound
Northbound
Total
Persons
Person
Delay
Movement
Movement
Total Delay
8.6
Southbound
Eastbound
Simulated
Volume
Movement
Delay
Rapid Bus
Passengers/B
us
Total Delay
Total Delay Total
Persons
Total Delay Total
Persons
Person
Delay
Simulated
Volume
Movement
Delay
Rapid Bus
Volume
Rapid Bus
Passengers/B
us
Rapid Bus
Volume
Rapid Bus
Passengers/B
us
Simulated
Volume
Person
Delay
Westbound
Approach Movement
Northbound
172.4
Southbound
Eastbound
Westbound
Approach Movement
Movement
Delay
Northbound
22.2
Southbound
Eastbound
Westbound
Person
Delay
Person
Delay
Person
Delay
Person
Delay
* Results shown are the average of 20 model runs.
** Results shown are from all vehicles except transit vehicles.
H:\Projects\7939\SD\VISSIM\4_RB_TSP\11 MOEs\7939_4_RB_TSP_PM PersonDelay.xls 7/2/2013

Year 2013 Scenario 4 Rapid Bus w/TSP VISSIM Model
Snelling Avenue Rapid Bus VISSIM Evaluation
Person Delay (P.M. Peak Hour 4:45 - 5:45)
Snelling at Roselawn
(vph) (sec/veh) (hrs) (hrs) (hrs)
Left 15 120.9 0.50 19 0.6
Thru 1,834 4.1 6 19.2 2.11 2,524 2.9
Right 28 3.6 0.03 37 0.0
Left 96 229.7 6.10 122 7.8
Thru 1,305 11.5 6 16.9 4.17 1,828 5.8
Right 101 6.1 0.17 130 0.2
Left 51 152.1 2.14 67 2.8
Thru 192 143.4 7.66 250 10.0
Right 70 64.1 1.24 91 1.6
Left 22 144.1 0.87 27 1.1
Thru 94 126.3 3.28 122 4.3
Right 45 31.7 0.40 59 0.5
Snelling at Larpenteur
(vph) (sec/veh) (hrs) (hrs) (hrs)
Left 222 88.3 5.45 286 7.0
Thru 1,700 37.9 6 19.2 17.92 2,352 24.8
Right 185 20.8 1.07 240 1.4
Left 172 219.4 10.51 223 13.6
Thru 1,044 53.3 6 16.9 15.47 1,492 22.1
Right 171 30.2 1.44 222 1.9
Left 26 213.2 1.55 34 2.0
Thru 669 245.0 45.50 868 59.1
Right 187 255.2 13.25 244 17.3
Left 153 96.1 4.10 199 5.3
Thru 352 53.9 5.28 456 6.8
Right 151 46.1 1.93 195 2.5
Snelling at Hoyt
(vph) (sec/veh) (hrs) (hrs) (hrs)
Left 7 13.7 0.03 9 0.0
Thru 2,065 7.0 6 19.2 4.02 2,823 5.5
Right 124 5.6 0.19 161 0.3
Left 45 32.3 0.40 58 0.5
Thru 1,331 2.9 6 16.9 1.06 1,865 1.5
Right 9 2.8 0.01 12 0.0
Left 23 82.7 0.53 30 0.7
Thru 6 74.9 0.12 8 0.2
Right 1 11.6 0.00 2 0.0
Left 41 86.3 0.97 53 1.3
Thru 10 80.2 0.22 13 0.3
Right 29 22.1 0.18 38 0.2
Snelling at Midway
(vph) (sec/veh) (hrs) (hrs) (hrs)
Left 53 16.4 0.24 69 0.3
Thru 2,098 10.9 6 19.2 6.36 2,865 8.7
Right 66 9.1 0.17 84 0.2
Left 75 19.1 0.40 98 0.5
Thru 1,251 4.2 6 16.9 1.45 1,760 2.0
Right 48 5.1 0.07 62 0.1
Left 46 91.5 1.17 60 1.5
Thru 30 84.3 0.69 38 0.9
Right 39 9.1 0.10 51 0.1
Left 19 96.4 0.52 26 0.7
Thru 15 86.9 0.37 21 0.5
Right 51 13.1 0.19 66 0.2
Total Delay Total
Persons
Person
Delay
Rapid Bus
Volume
Rapid Bus
Passengers/B
us
Total Delay Total
Persons
Rapid Bus
Volume
Rapid Bus
Passengers/B
us
Person
Delay
Rapid Bus
Volume
Rapid Bus
Passengers/B
us
Total Delay Total
Persons
Person
Delay
Rapid Bus
Volume
Rapid Bus
Passengers/B
us
Total Delay Total
Persons
Person
Delay
Movement
Delay
Approach Movement
Simulated
Volume
Movement
Delay
Northbound
37.7
Southbound
Eastbound
Westbound
Movement
Simulated
Volume
Approach Movement
Simulated
Volume
Movement
Delay
Simulated
Volume
Movement
Delay
Northbound
163.7
Southbound
Eastbound
Westbound
Approach Movement
Northbound
10.5
Southbound
Eastbound
Westbound
Approach
Northbound
15.8
Southbound
Eastbound
Westbound
Person
Delay
Person
Delay
Person
Delay
Person
Delay
* Results shown are the average of 20 model runs.
** Results shown are from all vehicles except transit vehicles.
H:\Projects\7939\SD\VISSIM\4_RB_TSP\11 MOEs\7939_4_RB_TSP_PM PersonDelay.xls 7/2/2013

Year 2013 Scenario 4 Rapid Bus w/TSP VISSIM Model
Snelling Avenue Rapid Bus VISSIM Evaluation
Person Delay (P.M. Peak Hour 4:45 - 5:45)
Snelling at Hewitt
(vph) (sec/veh) (hrs) (hrs) (hrs)
Left 24 18.2 0.12 31 0.2
Thru 1,582 16.6 6 24.4 7.31 2,228 10.3
Right 19 17.7 0.09 24 0.1
Left 71 24.5 0.49 92 0.6
Thru 1,341 14.2 6 25.7 5.30 1,928 7.6
Right 102 7.3 0.21 132 0.3
Left 91 45.8 1.15 118 1.5
Thru 11 47.1 0.15 15 0.2
Right 74 30.4 0.62 96 0.8
Left 30 39.4 0.33 40 0.4
Thru 20 36.8 0.21 27 0.3
Right 80 23.1 0.51 104 0.7
Snelling at Minnehaha
(vph) (sec/veh) (hrs) (hrs) (hrs)
Left 40 26.5 0.29 51 0.4
Thru 1,411 21.2 6 24.4 8.29 2,004 11.8
Right 51 21.6 0.31 65 0.4
Left 103 30.5 0.87 135 1.1
Thru 1,235 20.2 6 25.7 6.93 1,790 10.0
Right 105 22.7 0.66 135 0.9
Left 135 60.5 2.26 176 3.0
Thru 176 46.7 2.28 228 3.0
Right 76 44.5 0.93 99 1.2
Left 50 49.2 0.68 63 0.9
Thru 131 35.2 1.28 170 1.7
Right 79 31.8 0.70 103 0.9
Snelling at Thomas
(vph) (sec/veh) (hrs) (hrs) (hrs)
Left 45 21.8 0.27 59 0.4
Thru 1,358 21.0 6 24.4 7.93 1,941 11.3
Right 72 20.4 0.41 93 0.5
Left 61 27.0 0.46 80 0.6
Thru 1,266 20.9 6 25.7 7.34 1,830 10.6
Right 31 11.8 0.10 41 0.1
Left 110 43.6 1.34 141 1.7
Thru 85 43.5 1.03 110 1.3
Right 79 35.7 0.79 101 1.0
Left 40 39.4 0.44 51 0.6
Thru 55 35.2 0.54 72 0.7
Right 44 24.1 0.30 56 0.4
Snelling at University
(vph) (sec/veh) (hrs) (hrs) (hrs)
Left 112 44.4 1.38 145 1.8
Thru 1,078 20.8 6 24.4 6.22 1,582 9.1
Right 180 8.1 0.40 268 0.6
Left 197 59.1 3.23 254 4.2
Thru 1,110 46.0 6 42.3 14.18 1,724 22.0
Right 60 27.7 0.46 78 0.6
Left 174 190.5 9.19 224 11.8
Thru 743 293.0 60.45 962 78.3
Right 155 332.7 14.36 204 18.8
Left 167 166.6 7.72 250 11.6
Thru 522 205.6 29.79 676 38.6
Right 213 218.3 12.94 273 16.6
Rapid Bus
Volume
Rapid Bus
Passengers/B
us
Total Delay Total
Persons
Person
Delay
Rapid Bus
Volume
Rapid Bus
Passengers/B
us
Total Delay Total
Persons
Person
Delay
Rapid Bus
Volume
Rapid Bus
Passengers/B
us
Total Delay Total
Persons
Person
Delay
Rapid Bus
Volume
Rapid Bus
Passengers/B
us
Total Delay Total
Persons
Person
Delay
Simulated
Volume
Movement
DelayApproach Movement
Northbound
22.9
Southbound
Simulated
Volume
Movement
Delay
Eastbound
Westbound
Approach Movement
Simulated
Volume
Movement
Delay
Northbound
35.1
Southbound
Eastbound
Westbound
Approach Movement
Northbound
29.2
Southbound
Eastbound
Westbound
Approach Movement
Simulated
Volume
Movement
Delay
Northbound
214.0
Southbound
Eastbound
Westbound
Person
Delay
Person
Delay
Person
Delay
Person
Delay
* Results shown are the average of 20 model runs.
** Results shown are from all vehicles except transit vehicles.
H:\Projects\7939\SD\VISSIM\4_RB_TSP\11 MOEs\7939_4_RB_TSP_PM PersonDelay.xls 7/2/2013

Year 2013 Scenario 4 Rapid Bus w/TSP VISSIM Model
Snelling Avenue Rapid Bus VISSIM Evaluation
Person Delay (P.M. Peak Hour 4:45 - 5:45)
Snelling at Spruce Tree
(vph) (sec/veh) (hrs) (hrs) (hrs)
Left 61 21.9 0.37 81 0.5
Thru 1,240 14.8 6 21.6 5.11 1,808 7.5
Right 148 7.3 0.30 192 0.4
Left 70 28.0 0.54 90 0.7
Thru 1,350 10.2 6 42.3 3.81 2,071 5.8
Right 14 9.8 0.04 17 0.0
Left 35 55.2 0.53 45 0.7
Thru 64 45.7 0.82 83 1.1
Right 177 11.3 0.56 232 0.7
Left 141 60.8 2.38 183 3.1
Thru 54 57.8 0.87 69 1.1
Right 98 45.1 1.23 128 1.6
Snelling at St Anthony
(vph) (sec/veh) (hrs) (hrs) (hrs)
Left 368 19.6 2.00 479 2.6
Thru 1,001 11.3 6 21.6 3.15 1,495 4.7
Thru 1,319 76.0 6 42.3 27.82 2,034 42.9
Right 355 7.7 0.76 458 1.0
Left 367 63.3 6.45 495 8.7
Thru 435 60.0 7.24 566 9.4
Right 446 16.0 1.98 581 2.6
Snelling at Concordia
(vph) (sec/veh) (hrs) (hrs) (hrs)
Thru 1,029 39.7 6 21.6 11.35 1,534 16.9
Right 236 21.8 1.43 308 1.9
Left 497 10.9 1.50 642 1.9
Thru 1,198 18.6 6 42.3 6.19 1,900 9.8
Left 357 61.6 6.12 467 8.0
Thru 353 72.6 7.13 460 9.3
Right 644 58.8 10.53 840 13.7
Snelling at Marshall
(vph) (sec/veh) (hrs) (hrs) (hrs)
Left 47 46.5 0.61 61 0.8
Thru 1,003 39.3 6 21.6 10.95 1,468 16.0
Right 80 22.1 0.49 103 0.6
Left 48 51.3 0.69 64 0.9
Thru 1,564 53.5 6 42.3 23.23 2,323 34.5
Right 227 41.5 2.62 346 4.0
Left 216 62.1 3.73 315 5.4
Thru 349 42.8 4.15 451 5.4
Right 85 38.4 0.91 110 1.2
Left 73 35.9 0.72 96 1.0
Thru 245 44.4 3.02 317 3.9
Right 43 34.0 0.41 56 0.5
Rapid Bus
Volume
Rapid Bus
Passengers/B
us
Total Delay Total
Persons
Person
Delay
Rapid Bus
Volume
Rapid Bus
Passengers/B
us
Total Delay Total
Persons
Person
Delay
Rapid Bus
Volume
Rapid Bus
Passengers/B
us
Person
Delay
Total Delay
Rapid Bus
Volume
Rapid Bus
Passengers/B
us
Total Delay Total
Persons
Total
Persons
23.2
Southbound
Eastbound
Westbound
Approach
Simulated
Volume
Movement
Delay
Northbound
Movement
Simulated
Volume
Movement
Delay
Northbound
71.9Southbound
Westbound
Approach Movement
61.5
Approach Movement
Person
Delay
Simulated
Volume
Movement
Delay
Southbound
Eastbound
Northbound
Simulated
Volume
Movement
Delay
Northbound
74.2
Southbound
Eastbound
Westbound
Approach
Person
DelayMovement
Person
Delay
Person
Delay
Person
Delay
* Results shown are the average of 20 model runs.
** Results shown are from all vehicles except transit vehicles.
H:\Projects\7939\SD\VISSIM\4_RB_TSP\11 MOEs\7939_4_RB_TSP_PM PersonDelay.xls 7/2/2013

Year 2013 Scenario 4 Rapid Bus w/TSP VISSIM Model
Snelling Avenue Rapid Bus VISSIM Evaluation
Person Delay (P.M. Peak Hour 4:45 - 5:45)
Snelling at Selby
(vph) (sec/veh) (hrs) (hrs) (hrs)
Left 26 99.9 0.71 33 0.9
Thru 857 50.5 6 21.6 12.03 1,279 18.0
Right 53 48.0 0.71 70 0.9
Left 393 78.4 8.56 514 11.2
Thru 1,131 12.9 6 42.3 4.05 1,759 6.3
Right 188 11.1 0.58 245 0.8
Left 53 61.4 0.90 67 1.1
Thru 285 34.5 2.73 368 3.5
Right 38 28.3 0.30 49 0.4
Left 43 51.6 0.62 57 0.8
Thru 204 39.3 2.22 263 2.9
Right 210 31.1 1.81 271 2.3
Snelling at Summit
(vph) (sec/veh) (hrs) (hrs) (hrs)
Left 32 30.3 0.27 41 0.3
Thru 721 15.2 6 21.6 3.04 1,103 4.7
Right 69 17.8 0.34 90 0.4
Left 94 31.1 0.81 122 1.1
Thru 985 23.5 6 42.3 6.44 1,571 10.3
Right 128 23.7 0.84 165 1.1
Left 68 256.1 4.83 90 6.4
Thru 382 120.7 12.82 499 16.7
Right 16 105.8 0.48 21 0.6
Left 58 102.2 1.65 76 2.2
Thru 401 79.5 8.85 523 11.5
Right 156 74.5 3.23 202 4.2
Snelling at Grand
(vph) (sec/veh) (hrs) (hrs) (hrs)
Left 71 27.3 0.54 93 0.7
Thru 596 31.0 6 21.6 5.13 940 8.1
Right 138 29.1 1.11 177 1.4
Left 188 26.8 1.40 244 1.8
Thru 749 16.0 6 42.3 3.32 1,265 5.6
Right 131 14.7 0.53 169 0.7
Left 76 53.5 1.13 98 1.5
Thru 423 43.4 5.10 550 6.6
Right 64 37.3 0.67 84 0.9
Left 94 68.3 1.79 123 2.3
Thru 345 56.2 5.38 444 6.9
Right 149 49.6 2.05 195 2.7
Snelling at St Clair
(vph) (sec/veh) (hrs) (hrs) (hrs)
Left 55 35.9 0.55 71 0.7
Thru 566 8.1 6 18.6 1.27 881 2.0
Right 87 4.8 0.12 112 0.2
Left 104 28.1 0.81 136 1.1
Thru 675 14.1 6 30.0 2.64 1,096 4.3
Right 119 15.3 0.50 151 0.6
Left 76 59.3 1.24 97 1.6
Thru 310 40.6 3.50 404 4.6
Right 42 30.3 0.36 54 0.5
Left 77 50.4 1.08 100 1.4
Thru 317 40.5 3.56 412 4.6
Right 152 30.6 1.29 197 1.7
Rapid Bus
Volume
Rapid Bus
Passengers/B
us
Total Delay
Rapid Bus
Volume
Rapid Bus
Passengers/B
us
Total DelayPerson
DelayTotal
Persons
Person
Delay
Rapid Bus
Volume
Rapid Bus
Passengers/B
us
Total Delay Total
Persons
Person
Delay
Total
Persons
Rapid Bus
Volume
Rapid Bus
Passengers/B
us
Total Delay Total
Persons
Person
Delay
49.2
Southbound
Eastbound
Westbound
Approach Movement
Simulated
Volume
Movement
Delay
Northbound
Simulated
Volume
Movement
Delay
Northbound
59.5
Southbound
Eastbound
Westbound
Approach Movement
39.2
Southbound
Eastbound
Westbound
Approach Movement
Simulated
Volume
Movement
Delay
Northbound
Simulated
Volume
Movement
Delay
Northbound
23.1
Southbound
Eastbound
Westbound
Approach Movement
Person
Delay
Person
Delay
Person
Delay
Person
Delay
* Results shown are the average of 20 model runs.
** Results shown are from all vehicles except transit vehicles.
H:\Projects\7939\SD\VISSIM\4_RB_TSP\11 MOEs\7939_4_RB_TSP_PM PersonDelay.xls 7/2/2013

Year 2013 Scenario 4 Rapid Bus w/TSP VISSIM Model
Snelling Avenue Rapid Bus VISSIM Evaluation
Person Delay (P.M. Peak Hour 4:45 - 5:45)
Snelling at Jefferson
(vph) (sec/veh) (hrs) (hrs) (hrs)
Left 7 14.4 0.03 10 0.0
Thru 671 11.5 6 18.6 2.15 1,017 3.3
Right 44 11.3 0.14 56 0.2
Left 38 13.9 0.15 50 0.2
Thru 755 7.9 6 30.0 1.66 1,200 2.6
Right 1 12.3 0.00 1 0.0
Left 11 54.8 0.17 15 0.2
Thru 82 49.5 1.13 107 1.5
Right 8 39.5 0.09 10 0.1
Left 40 64.2 0.72 53 0.9
Thru 85 60.8 1.44 111 1.9
Right 37 44.8 0.45 48 0.6
Snelling at Randolph
(vph) (sec/veh) (hrs) (hrs) (hrs)
Left 53 21.4 0.32 68 0.4
Thru 495 26.5 6 18.6 3.65 790 5.8
Right 106 13.1 0.38 136 0.5
Left 148 20.3 0.83 193 1.1
Thru 545 17.9 6 15.1 2.71 835 4.2
Right 117 9.6 0.31 153 0.4
Left 123 50.9 1.75 159 2.3
Thru 423 41.3 4.85 547 6.3
Right 41 26.4 0.30 53 0.4
Left 88 34.5 0.84 113 1.1
Thru 347 34.3 3.30 449 4.3
Right 103 19.6 0.56 133 0.7
Snelling at Highland
(vph) (sec/veh) (hrs) (hrs) (hrs)
Left 8 8.6 0.02 11 0.0
Thru 607 3.3 6 12.0 0.55 891 0.8
Right 100 2.9 0.08 129 0.1
Left 33 14.8 0.14 43 0.2
Thru 603 7.3 6 15.1 1.22 909 1.8
Right 36 6.5 0.07 46 0.1
Left 23 25.0 0.16 30 0.2
Thru 75 24.9 0.52 97 0.7
Right 18 6.5 0.03 22 0.0
Left 110 34.4 1.05 144 1.4
Thru 68 24.1 0.46 88 0.6
Right 21 10.5 0.06 27 0.1
Snelling at Ford
(vph) (sec/veh) (hrs) (hrs) (hrs)
Left 124 18.9 0.65 160 0.8
Thru 446 6.6 0.82 578 1.1
Right 5 4.2 0.01 7 0.0
Left 13 8.5 0.03 18 0.0
Thru 461 4.8 0.62 601 0.8
Right 253 4.8 6 15.1 0.34 452 0.6
Left 267 24.9 6 12.0 1.85 450 3.1
Thru 8 26.9 0.06 10 0.1
Right 143 11.4 0.45 188 0.6
Left 8 21.8 0.05 10 0.1
Thru 5 21.1 0.03 6 0.0
Right 3 5.6 0.00 4 0.0
Rapid Bus
Volume
Rapid Bus
Passengers/B
us
Total Delay Total
Persons
Person
Delay
Rapid Bus
Volume
Rapid Bus
Passengers/B
us
Total DelayPerson
Delay
Rapid Bus
Volume
Rapid Bus
Passengers/B
us
Total Delay Total
Persons
Person
Delay
Person
Delay
Rapid Bus
Volume
Rapid Bus
Passengers/B
us
Total DelayPerson
DelayTotal
Persons
Total
Persons
11.5
Southbound
Eastbound
Westbound
Approach Movement
Simulated
Volume
Movement
Delay
Northbound
Simulated
Volume
Movement
Delay
Northbound
27.4
Southbound
Eastbound
Westbound
Approach Movement
6.0
Southbound
Eastbound
Westbound
Approach Movement
Simulated
Volume
Movement
Delay
Northbound
Simulated
Volume
Movement
Delay
Northbound
7.2
Southbound
Eastbound
Westbound
Approach
Person
DelayMovement
Person
Delay
Person
Delay
* Results shown are the average of 20 model runs.
** Results shown are from all vehicles except transit vehicles.
H:\Projects\7939\SD\VISSIM\4_RB_TSP\11 MOEs\7939_4_RB_TSP_PM PersonDelay.xls 7/2/2013

Year 2013 Scenario 4 Rapid Bus w/TSP VISSIM Model
Snelling Avenue Rapid Bus VISSIM Evaluation
Person Delay (P.M. Peak Hour 4:45 - 5:45)
Ford at Fairview
(vph) (sec/veh) (hrs) (hrs) (hrs)
Left 71 44.9 0.88 91 1.1
Thru 498 13.6 1.88 646 2.4
Right 25 12.3 0.09 33 0.1
Left 26 24.1 0.17 33 0.2
Thru 464 17.9 2.31 604 3.0
Right 181 16.4 0.83 236 1.1
Left 143 52.6 2.09 186 2.7
Thru 366 17.8 6 12.0 1.81 584 2.9
Right 67 11.0 0.20 88 0.3
Left 15 21.6 0.09 20 0.1
Thru 352 16.5 6 15.1 1.61 579 2.7
Right 16 8.4 0.04 20 0.0
Ford at Kenneth
(vph) (sec/veh) (hrs) (hrs) (hrs)
Left 54 54.8 0.83 88 1.3
Thru 21 49.9 0.29 28 0.4
Right 37 28.7 0.30 48 0.4
Left 29 49.6 0.40 40 0.5
Thru 26 47.7 0.34 33 0.4
Right 43 22.0 0.26 73 0.4
Left 46 7.9 0.10 78 0.2
Thru 505 2.5 6 12.0 0.35 763 0.5
Right 48 2.2 0.03 64 0.0
Left 14 9.8 0.04 18 0.1
Thru 568 5.8 6 15.1 0.92 860 1.4
Right 21 4.6 0.03 27 0.0
Ford at Cleveland
(vph) (sec/veh) (hrs) (hrs) (hrs)
Left 247 51.9 3.56 320 4.6
Thru 352 31.4 3.07 454 4.0
Right 38 32.3 0.34 86 0.8
Left 79 68.3 1.51 102 1.9
Thru 403 71.4 7.99 522 10.4
Right 169 76.9 3.62 254 5.4
Left 158 30.3 1.33 241 2.0
Thru 488 20.4 6 10.7 2.77 717 4.1
Right 269 28.9 2.16 384 3.1
Left 85 31.6 0.74 127 1.1
Thru 496 23.6 6 15.1 3.26 784 5.1
Right 83 24.0 0.55 106 0.7
Ford at Finn
(vph) (sec/veh) (hrs) (hrs) (hrs)
Left 201 53.1 2.96 262 3.9
Thru 10 32.7 0.09 12 0.1
Right 176 10.6 0.52 228 0.7
Left 114 42.9 1.36 149 1.8
Thru 16 38.6 0.17 21 0.2
Right 67 27.9 0.52 85 0.7
Left 52 18.0 0.26 67 0.3
Thru 635 14.2 6 10.7 2.50 979 3.9
Right 43 10.2 0.12 56 0.2
Left 195 13.6 0.74 251 0.9
Thru 659 6.9 6 10.1 1.26 1,000 1.9
Right 52 5.4 0.08 67 0.1
Rapid Bus
Volume
Rapid Bus
Passengers/B
us
Total Delay
Rapid Bus
Passengers/B
us
Total Delay Total
Persons
Person
Delay
Total
Persons
16.7
Person
Delay
Rapid Bus
Volume
Rapid Bus
Passengers/B
us
Total Delay Total
Persons
Person
DelayRapid Bus
Volume
Rapid Bus
Passengers/B
us
Total Delay
Person
Delay
Total
Persons
Person
Delay
Rapid Bus
Volume
Southbound
Eastbound
Westbound
Approach
Simulated
Volume
Movement
Delay
Northbound
Simulated
Volume
Movement
Delay
Northbound
Movement
Movement
5.7
Southbound
Eastbound
Westbound
Approach
Person
Delay
43.2
Southbound
Eastbound
Westbound
Approach Movement
Simulated
Volume
Movement
Delay
Northbound
Simulated
Volume
Movement
Delay
Northbound
14.6
Southbound
Eastbound
Westbound
Approach Movement
Person
Delay
Person
Delay
* Results shown are the average of 20 model runs.
** Results shown are from all vehicles except transit vehicles.
H:\Projects\7939\SD\VISSIM\4_RB_TSP\11 MOEs\7939_4_RB_TSP_PM PersonDelay.xls 7/2/2013

Year 2013 Scenario 4 Rapid Bus w/TSP VISSIM Model
Snelling Avenue Rapid Bus VISSIM Evaluation
Person Delay (P.M. Peak Hour 4:45 - 5:45)
Ford at Cretin
(vph) (sec/veh) (hrs) (hrs) (hrs)
Left 172 48.1 2.30 241 3.2
Right 111 5.6 0.17 143 0.2
Left 111 13.7 0.42 142 0.5
Thru 559 5.0 6 10.7 0.78 862 1.2
Thru 783 8.8 6 10.1 1.92 1,144 2.8
Right 145 15.4 0.62 205 0.9
46th at 46th
(vph) (sec/veh) (hrs) (hrs) (hrs)
Left 14 53.6 0.21 18 0.3
Thru 39 53.0 0.57 50 0.7
Right 252 3.0 0.21 327 0.3
Left 81 42.6 0.96 123 1.5
Thru 31 52.4 0.45 40 0.6
Right 10 66.7 0.18 13 0.2
Left 26 10.4 0.07 34 0.1
Thru 338 11.0 6 10.7 1.03 556 1.7
Right 50 16.6 0.23 65 0.3
Left 299 16.2 1.35 389 1.7
Thru 475 9.7 6 10.1 1.28 728 2.0
Right 118 9.4 0.31 170 0.4
46th at 42nd
(vph) (sec/veh) (hrs) (hrs) (hrs)
Left 5 35.2 0.05 7 0.1
Thru 6 32.0 0.05 7 0.1
Right 4 5.8 0.01 5 0.0
Left 37 32.4 0.33 50 0.4
Thru 5 33.3 0.05 6 0.1
Right 58 13.8 0.22 74 0.3
Left 85 26.4 0.62 110 0.8
Thru 372 16.1 6 10.7 1.67 599 2.7
Right 5 12.9 0.02 7 0.0
Left 3 10.2 0.01 4 0.0
Thru 460 6.6 6 10.1 0.84 708 1.3
Right 34 5.9 0.06 44 0.1
46th at Minnehaha
(vph) (sec/veh) (hrs) (hrs) (hrs)
Left 42 44.9 0.52 55 0.7
Thru 271 36.8 2.77 353 3.6
Right 66 24.2 0.44 87 0.6
Left 120 165.5 5.49 154 7.1
Thru 306 150.5 12.80 399 16.7
Right 118 140.1 4.58 150 5.8
Left 173 25.9 1.25 227 1.6
Thru 277 13.4 6 10.7 1.03 475 1.8
Right 15 13.6 0.06 20 0.1
Left 82 35.4 0.80 108 1.1
Thru 353 31.3 6 10.1 3.07 567 4.9
Right 91 26.6 0.67 117 0.9
Rapid Bus
Passengers/B
us
Total Delay
Rapid Bus
Volume
Person
Delay
Rapid Bus
Volume
Rapid Bus
Passengers/B
us
Total Delay Total
Persons
Person
Delay
Rapid Bus
Volume
Rapid Bus
Volume
Rapid Bus
Passengers/B
us
Total DelayPerson
DelayTotal
Persons
Total
Persons
Total Delay Total
Persons
Person
Delay
Rapid Bus
Passengers/B
us
Southbound
Eastbound
Westbound
Approach
Movement
Simulated
Volume
Movement
Delay
8.9
Movement
Simulated
Volume
Movement
Delay
Northbound
9.8
Southbound
Eastbound
Westbound
Approach
5.8
Southbound
Eastbound
Westbound
Approach Movement
Simulated
Volume
Movement
Delay
Northbound
Simulated
Volume
Movement
Delay
Northbound
44.8
Southbound
Eastbound
Westbound
Approach Movement
Person
Delay
Person
Delay
Person
Delay
Person
Delay
* Results shown are the average of 20 model runs.
** Results shown are from all vehicles except transit vehicles.
H:\Projects\7939\SD\VISSIM\4_RB_TSP\11 MOEs\7939_4_RB_TSP_PM PersonDelay.xls 7/2/2013

Year 2013 Scenario 4 Rapid Bus w/TSP VISSIM Model
Snelling Avenue Rapid Bus VISSIM Evaluation
Person Delay (P.M. Peak Hour 4:45 - 5:45)
46th at Hiawatha
(vph) (sec/veh) (hrs) (hrs) (hrs)
Left 85 41.6 0.98 109 1.3
Thru 808 27.4 6.14 1,043 7.9
Right 243 2.7 0.18 316 0.2
Left 145 40.5 1.63 188 2.1
Thru 859 24.5 5.85 1,113 7.6
Right 39 2.2 0.02 52 0.0
Left 52 25.1 0.36 66 0.5
Thru 77 34.2 6 10.7 0.73 217 2.1
Right 22 34.6 0.21 28 0.3
Left 201 42.3 2.36 263 3.1
Thru 145 25.2 6 10.1 1.02 296 2.1
Right 166 11.8 0.54 214 0.7
46th at 36th
(vph) (sec/veh) (hrs) (hrs) (hrs)
Left 1 9.0 0.00 2 0.0
Thru 2 11.1 0.00 2 0.0
Right 0 - - 0 -
Left 36 6.5 6 10.7 0.06 163 0.3
Thru 1 7.1 0.00 1 0.0
Right 5 4.2 0.01 7 0.0
Left 5 5.0 0.01 7 0.0
Thru 115 4.8 0.15 148 0.2
Right 1 2.0 0.00 1 0.0
Left 0 - - 0 -
Thru 241 3.4 0.23 311 0.3
Right 28 2.1 6 10.1 0.02 145 0.1
Rapid Bus
Volume
Rapid Bus
Passengers/B
us
Total DelayPerson
Delay
Rapid Bus
Volume
Rapid Bus
Passengers/B
us
Total Delay Total
Persons
Person
Delay
Total
PersonsApproach Movement
Simulated
Volume
Movement
Delay
Northbound
27.8
Southbound
Movement
Eastbound
Westbound
Simulated
Volume
Movement
Delay
0.9
Southbound
Eastbound
Approach
Westbound
Northbound
Person
Delay
Person
Delay
* Results shown are the average of 20 model runs.
** Results shown are from all vehicles except transit vehicles.
H:\Projects\7939\SD\VISSIM\4_RB_TSP\11 MOEs\7939_4_RB_TSP_PM PersonDelay.xls 7/2/2013

Snelling Avenue Rapid Bus VISSIM EvaluationStation Travel Time Comparison (A.M. Peak Hour 7:30 - 8:30)
Baseline Scenario 1
Preliminary Rapid Bus Scenario 2
(Alpha)
Refined Rapid Bus Scenario 3
(Beta)
Refined Rapid Bus
Scenario 3A
Rapid Bus w/TSP
Scenario 4
Segment (ft)
Northbound46th Street Station - - - - - -Minnehaha Avenue 752 31.9 32.1 32.1 31.3 30.3 46th Avenue/Minnehaha Park 931 42.0 42.0 41.9 41.3 38.5 Woodlawn Avenue/Ford Plant 950 20.7 20.7 20.7 20.7 20.7 Finn Street 613 18.0 17.9 18.1 18.1 17.9 Kenneth Street 921 21.8 21.9 21.8 21.9 21.9 Fairview Avenue 984 34.2 34.9 34.6 34.0 34.2 Highland Parkway 784 18.1 18.1 18.0 18.1 18.3 Randolph Avenue 728 36.6 35.8 37.2 37.3 34.3 St. Clair Avenue 797 20.9 21.0 21.0 21.2 20.6 Grand Avenue 829 30.4 31.1 31.2 31.0 29.9 Hague_Selby 785 65.4 65.0 71.8 76.3 59.8 University_Spruce Tree 1,028 43.3 43.5 43.5 43.5 39.7 Minnehaha Avenue 776 23.4 23.7 23.4 23.6 23.6 Hewitt Avenue 877 30.2 30.2 30.5 30.1 30.6 Como Avenue - - - - - - Larpenteur Avenue 1,531 39.8 40.4 39.3 39.7 39.6 Roselawn Avenue 612 12.9 12.9 12.9 13.0 12.8 County Road B/Har Mar Mall 629 10.6 10.6 10.6 10.7 10.5 Rosedale Transit Center - - - - - -SouthboundRosedale Transit Center - - - - - -County Road B 812 14.9 15.0 15.0 15.0 14.7 Roselawn Avenue 610 10.5 10.6 10.6 10.7 10.7 Larpenteur Avenue 1,528 46.2 46.9 46.6 46.7 45.2 Como Avenue - - - - - - Hewitt Avenue 1,242 23.6 23.9 23.7 23.6 23.8 Minnehaha Avenue 875 24.1 24.3 24.2 24.0 24.3 University Avenue 778 38.7 38.5 38.4 38.8 35.8 Hague_Dayton 1,267 41.9 42.1 41.9 42.2 41.3 Grand Avenue 567 35.4 35.2 35.3 35.5 31.8 St. Clair Avenue 828 23.0 23.0 22.9 22.9 22.9 Randolph Avenue 794 31.6 31.7 32.1 32.1 31.0 Highland Parkway 730 20.4 20.6 20.5 20.5 21.2 Fairview Avenue 786 33.7 35.1 34.5 34.6 33.9 Kenneth Street 983 23.1 23.4 23.2 22.9 23.3 Finn Street 918 15.5 15.5 15.6 15.7 15.6 Woodlawn Avenue/Ford Plant 612 20.5 20.6 20.6 20.6 20.6 45th Avenue/46th Avenue 949 28.9 28.1 28.2 28.4 28.1 Minnehaha Avenue 968 49.0 48.6 48.6 48.6 45.1 46th Street Station - - - - - -
Note:Travel time segments are from approximately 2 blocks upstream to 2 blocks downstream of a Rapid Bus station.
Station(sec)
Travel Time
* Results shown are the average of 5 model runs.** Results shown are from all vehicles except transit vehicles.H:\Projects\7939\SD\VISSIM\_Project MOEs\Travel Times\7939_AM Travel Times Comparison.xls 5/15/2013

Snelling Avenue Rapid Bus VISSIM EvaluationStation Travel Time Comparison (P.M. Peak Hour 4:45 - 5:45)
Baseline Scenario 1
Preliminary Rapid Bus Scenario 2
(Alpha)
Refined Rapid Bus Scenario 3
(Beta)
Refined Rapid Bus
Scenario 3A
Rapid Bus w/TSP
Scenario 4
Segment (ft)
Northbound46th Street Station - - - - - -Minnehaha Avenue 752 31.6 32.1 31.9 31.8 30.4 46th Avenue/Minnehaha Park 931 30.5 31.1 31.2 30.8 30.5 Woodlawn Avenue/Ford Plant 950 21.0 21.1 21.1 21.1 21.1 Finn Street 613 28.3 29.1 29.1 29.1 28.0 Kenneth Street 921 23.0 23.0 23.0 23.1 23.0 Fairview Avenue 984 37.3 38.1 38.5 38.7 37.2 Highland Parkway 784 17.6 17.6 17.6 17.6 17.7 Randolph Avenue 728 41.4 41.5 41.2 41.6 39.4 St. Clair Avenue 797 23.1 23.2 23.3 23.3 22.8 Grand Avenue 829 59.5 60.0 60.1 59.6 56.7 Hague_Selby 785 72.8 79.7 84.8 84.3 66.7 University_Spruce Tree 1,028 79.9 89.4 78.2 89.5 53.6 Minnehaha Avenue 776 29.9 30.6 31.3 30.7 31.2 Hewitt Avenue 877 31.0 31.1 31.3 31.1 31.4 Como Avenue - - - - - - Larpenteur Avenue 1,531 62.9 63.4 63.2 63.1 55.4 Roselawn Avenue 612 11.3 11.3 11.4 11.4 11.7 County Road B/Har Mar Mall 629 10.8 10.8 10.7 10.7 10.8 Rosedale Transit Center - - - - - -SouthboundRosedale Transit Center - - - - - -County Road B 812 17.9 17.8 18.0 17.7 17.4 Roselawn Avenue 610 15.6 15.1 15.2 15.4 16.4 Larpenteur Avenue 1,528 67.8 67.4 67.5 67.8 65.8 Como Avenue - - - - - - Hewitt Avenue 1,242 29.6 29.0 29.2 29.0 28.3 Minnehaha Avenue 875 31.9 31.4 31.9 32.7 30.9 University Avenue 778 68.7 70.3 71.4 71.1 53.8 Hague_Dayton 1,267 39.3 39.7 40.3 40.0 40.8 Grand Avenue 567 29.8 30.3 30.3 30.3 33.8 St. Clair Avenue 828 31.0 31.3 31.7 31.7 29.0 Randolph Avenue 794 30.5 30.5 30.3 30.6 30.5 Highland Parkway 730 21.9 22.1 22.1 21.9 21.5 Fairview Avenue 786 37.4 38.6 38.7 38.7 37.4 Kenneth Street 983 25.8 26.2 26.1 26.2 25.5 Finn Street 918 20.1 20.7 20.4 20.5 20.2 Woodlawn Avenue/Ford Plant 612 21.2 21.5 21.5 21.5 21.5 45th Avenue/46th Avenue 949 28.7 28.8 28.7 28.7 28.8 Minnehaha Avenue 968 51.6 51.4 51.4 51.6 47.6 46th Street Station - - - - - -
Note:Travel time segments are from approximately 2 blocks upstream to 2 blocks downstream of a Rapid Bus station.
Travel Time(sec)
Station
* Results shown are the average of 20 model runs.** Results shown are from all vehicles except transit vehicles.H:\Projects\7939\SD\VISSIM\_Project MOEs\Travel Times\7939_PM Travel Times Comparison.xls 5/15/2013
APPENDIX D
VISSIM STATION PLACEMENT AERIAL IMAGES – RAPID BUS REFINED SCENARIOS


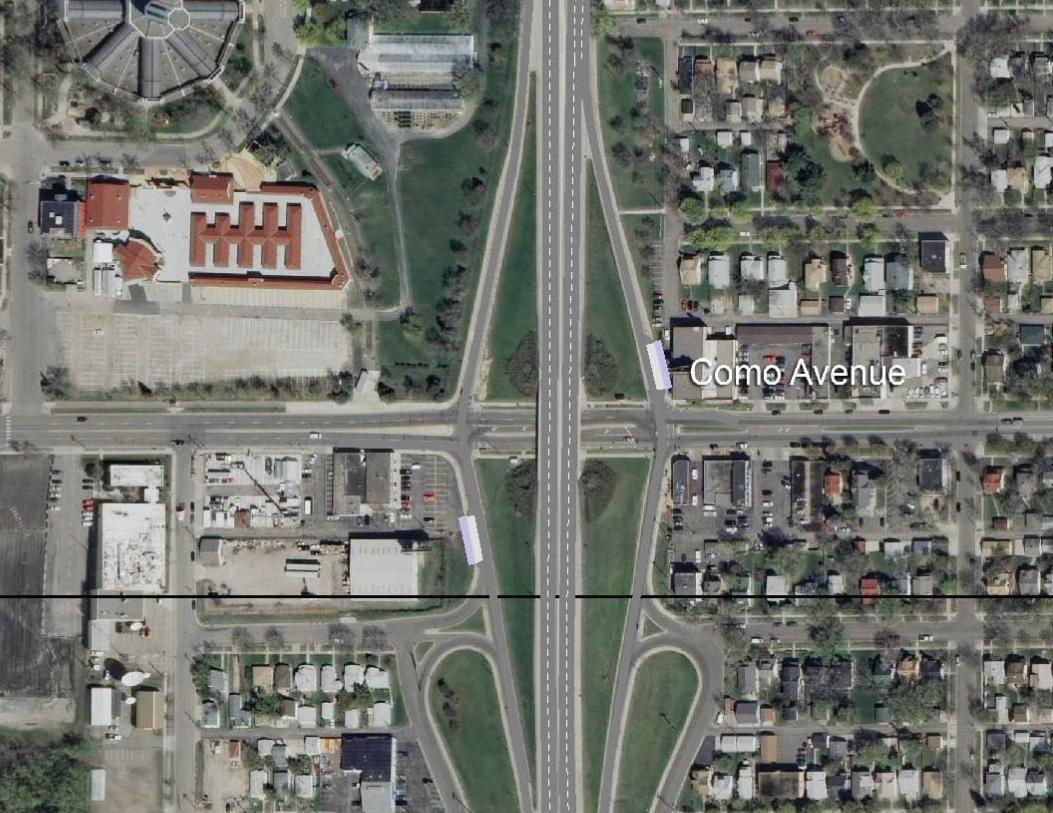


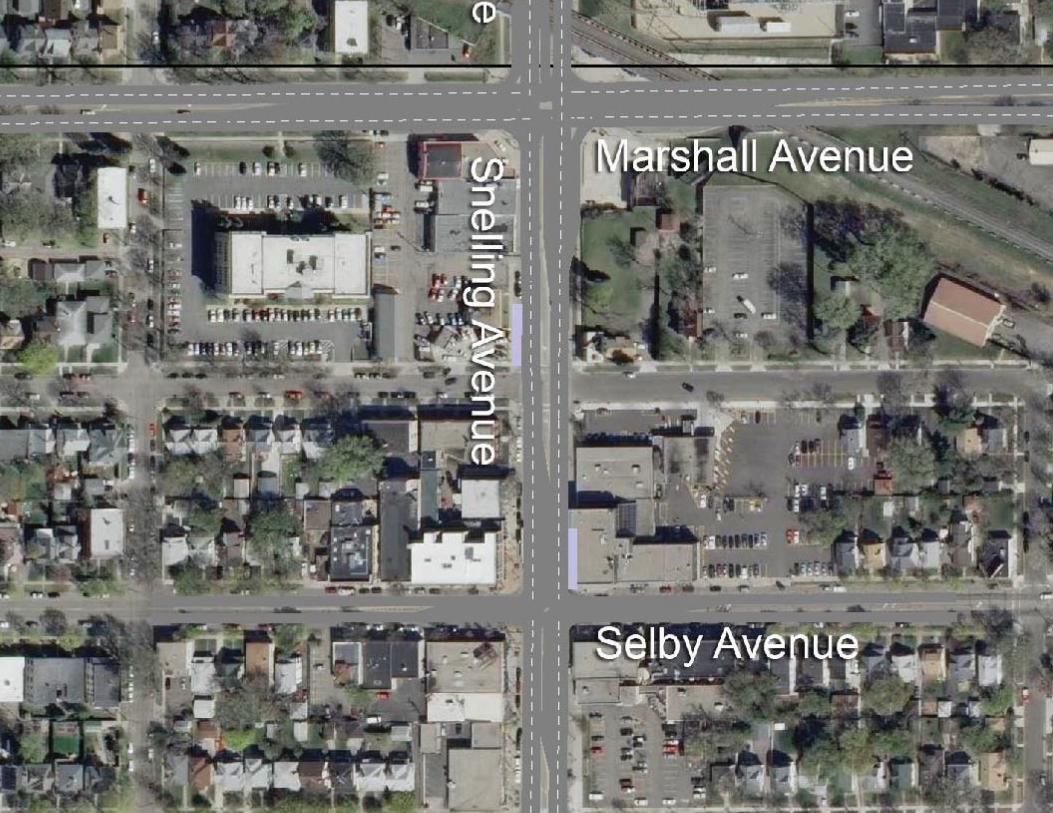


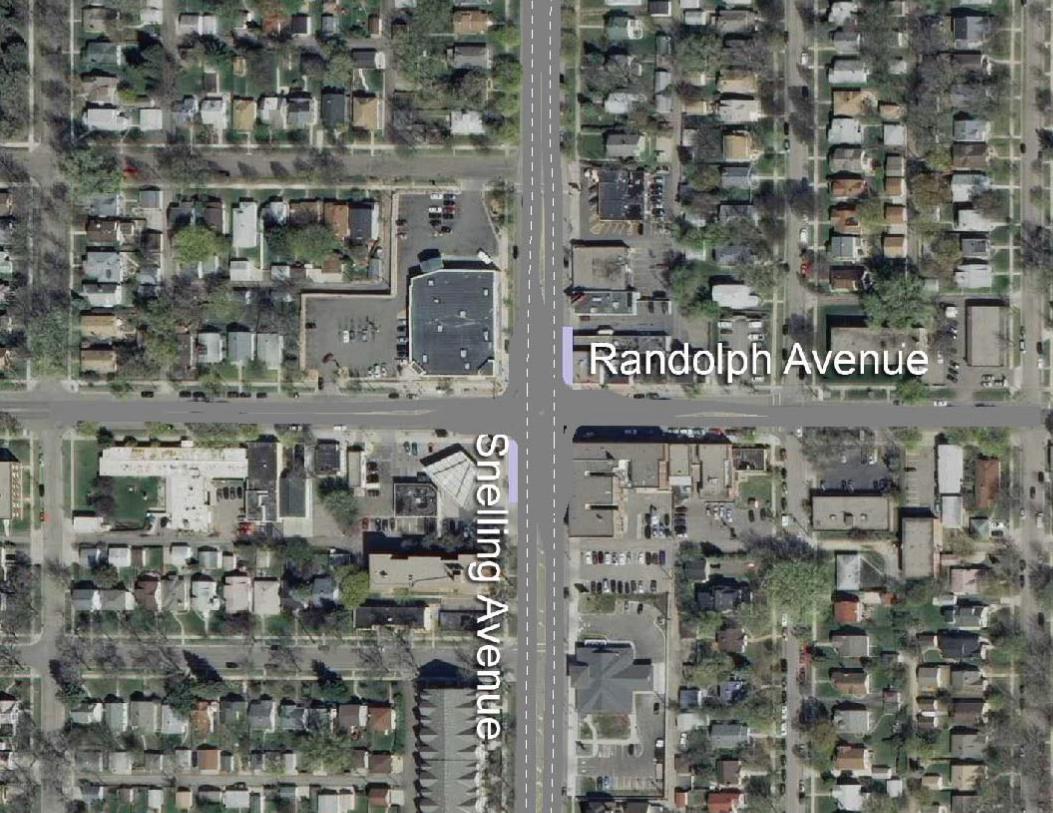


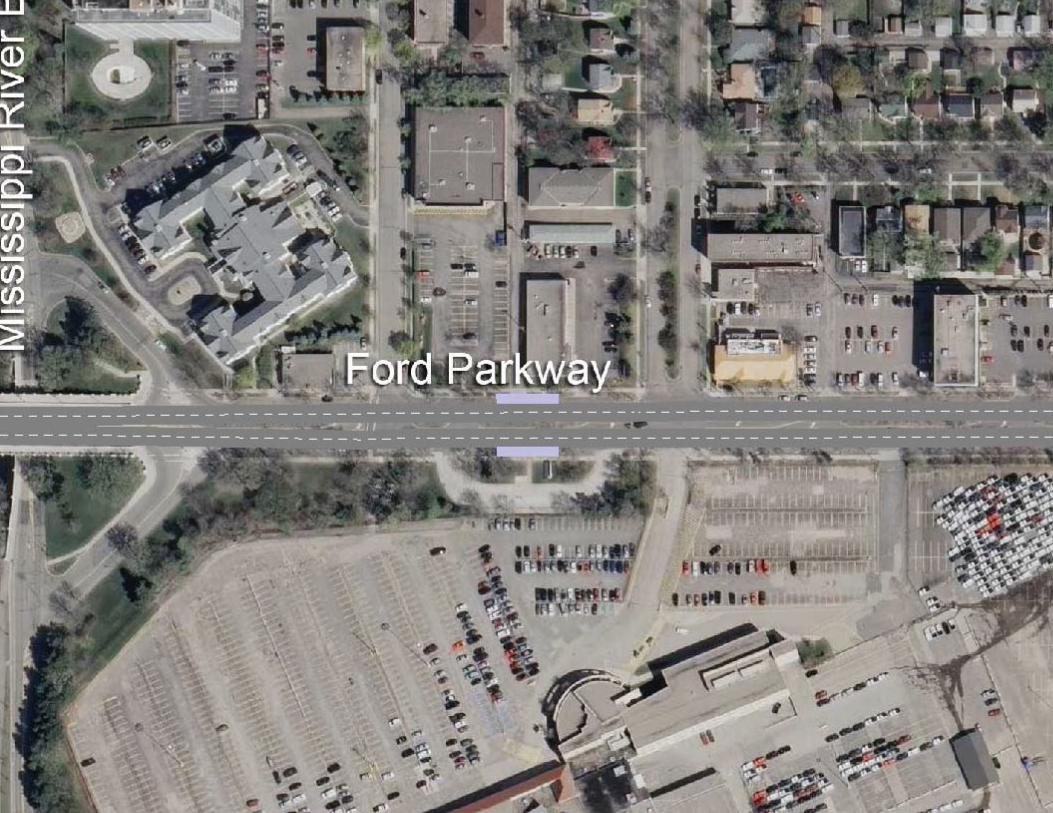
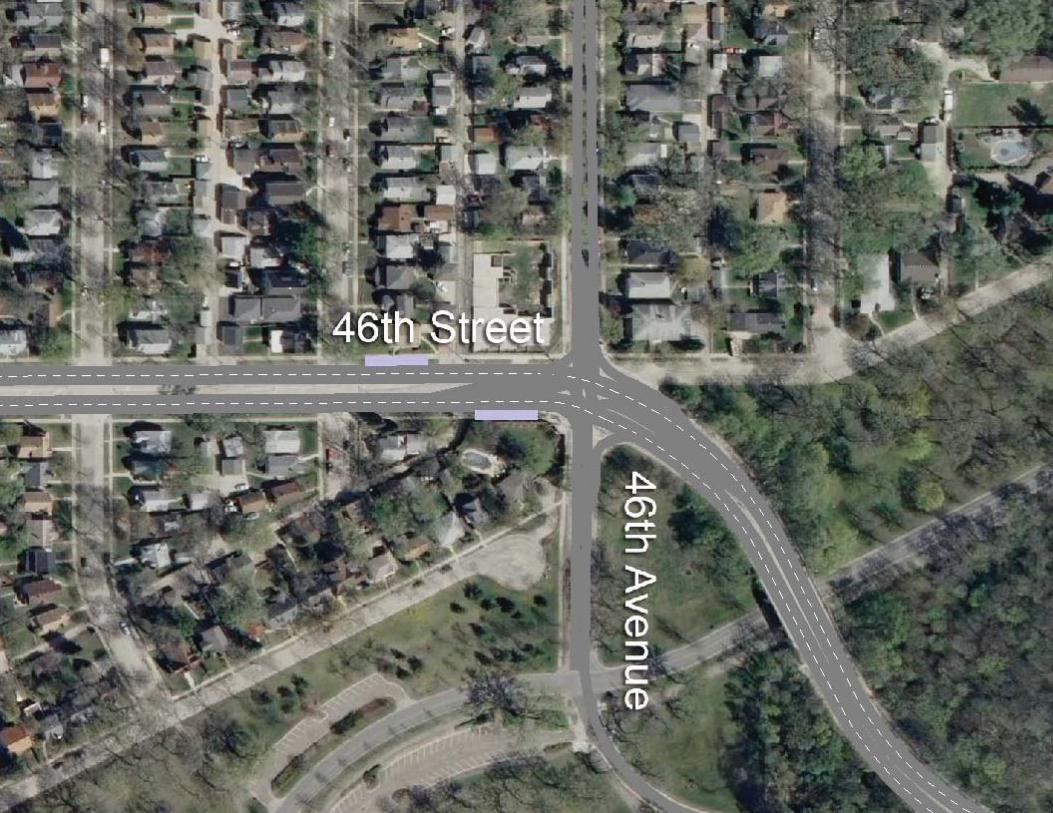


![VISSIM Lab Assignment_Final[1]](https://img.dokumen.tips/doc/110x75/55cf9aa0550346d033a2a24a/vissim-lab-assignmentfinal1.jpg)