Embed Size (px)
Citation preview
Snapshot of COVID-19 Transportation Impacts in the SCAG Region
August 2020
v i s i t u s a t s c a g . c a . g o v

v i s i t u s a t s c a g . c a . g o v
ABOUT SCAGSCAG is the nation’s largest metropolitan planning organization (MPO), representing six counties, 191 cities and more than 19 million residents. SCAG undertakes a variety of planning and policy initiatives to encourage a more sustainable Southern California now and in the future..
MISSION STATEMENTTo foster innovative regional solutions that improve the lives of Southern Californians through inclusive collaboration, visionary planning, regional advocacy, information sharing, and promoting best practices.
STAFF CONTRIBUTORS:Hiroshi Ishikawa, Senior Regional Planner
Priscilla Freduah-Agyemang , Senior Regional Planner
Scott Strelecki, Senior Regional Planner
Philip Law, Manager of Mobility Planning and Management
Annie Nam, Manager of Goods Movement & Transportation Finance
Naresh Amatya, Manager of Transportation and Programming
SPECIAL THANKS TO: Bill McCullough, System Metrics Group
Tarek Hatata, System Metrics Group
For questions or inquiries, please contact Hiroshi Ishikawa at [email protected].
Snapshot of COVID-19 Transportation Impacts in the SCAG Region

1
SNAPSHOT OF COVID-19 TRANSPORTATION IMPACTS IN THE SCAG REGIONINTRODUCTIONThe public response to the novel coronavirus (COVID-19) pandemic and the subsequent national, state, county, and local mandatory stay-at-home orders has significantly impacted transportation demand globally, nationally, regionally, and locally. As the largest metropolitan planning organization in the nation, the Southern California Association of Governments (SCAG) is at the forefront of transportation planning and analysis. In order to facilitate regional planning and public awareness, SCAG prepared this document to highlight impacts of the COVID-19 pandemic on transportation activities to date.
The analysis includes passenger, freight/cargo, and vehicle movement on the region’s highways, roads, rail, and transit systems. The short-term impacts of COVID-19 on the SCAG region’s transportation system include the following:
HIGHLIGHTS • Vehicle miles traveled (VMT) on the region’s arterial and highway network declined by nearly 80 percent in early
April (using January 2020 as benchmark). VMT on the freeway network alone dropped by nearly 50 percent in early April over prior year. VMT began increasing again by mid-April. Total VMT is now nearing pre-pandemic levels.
• Bus ridership is down, falling 71 percent overall in April 2020 compared to April 2019, as a result of the stay-at home-orders and as operators reduced vehicle capacity and implemented rear-door boarding to facilitate social distancing. Ridership recovered somewhat in May, but was still down 67 percent when comparing 2020 to 2019. The effects of the stay-at-home orders and social distancing measures were similar on the Metro Rail and Metrolink systems.
• Data on bicycle and pedestrian movements are limited. Trips taken on Los Angeles Metro’s bike share system, however, also began to drop in March, and by June were down by 39 percent over the prior year.
• Global and domestic air travel declined by over 60 percent from March to April 2020.
• Aviation passenger demand in the region has decreased by more than 90 percent overall from last year.
• Aircraft operations have declined at a lower rate (60 percent) than passenger demand (90 percent) from the previous year.
• Air cargo has been impacted, but not to the same magnitude as air passenger activity.
• Freight has been mixed with performance down as low as 90 percent for specific sectors, but signs of improvement have surfaced.
2
Snapshot of COVID-19 Transportation Impacts in the SCAG Region
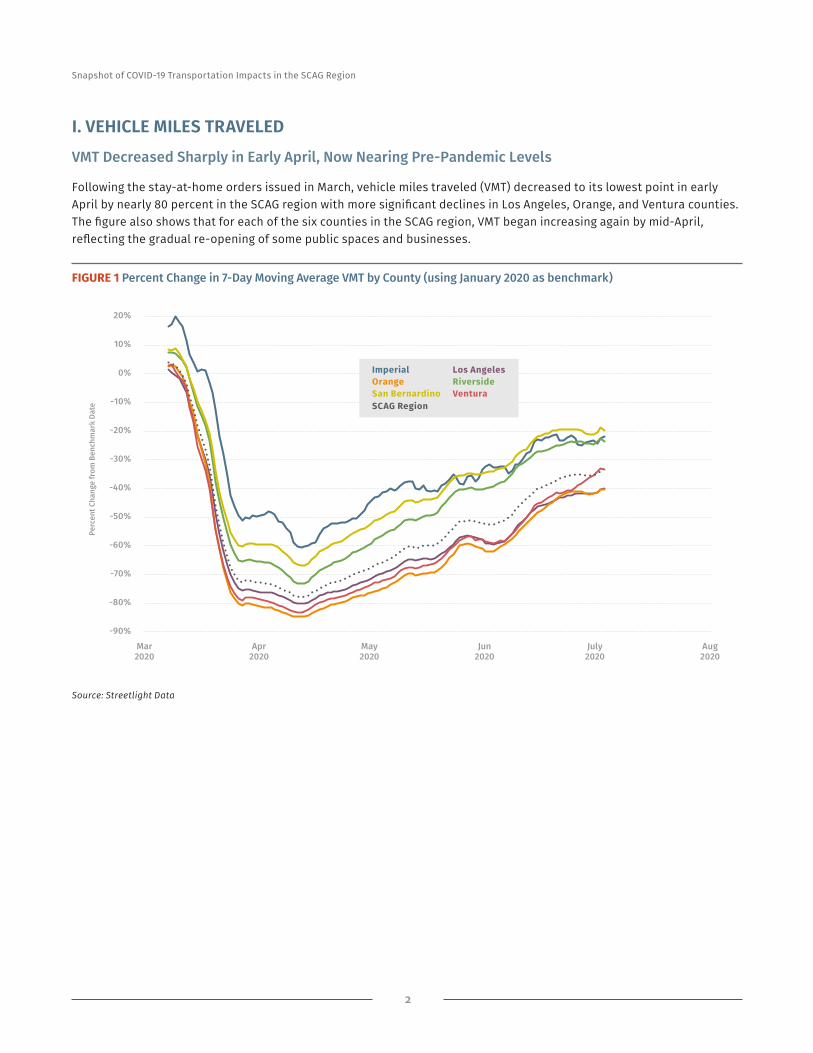
I. VEHICLE MILES TRAVELEDVMT Decreased Sharply in Early April, Now Nearing Pre-Pandemic Levels
Following the stay-at-home orders issued in March, vehicle miles traveled (VMT) decreased to its lowest point in early April by nearly 80 percent in the SCAG region with more significant declines in Los Angeles, Orange, and Ventura counties. The figure also shows that for each of the six counties in the SCAG region, VMT began increasing again by mid-April, reflecting the gradual re-opening of some public spaces and businesses.
Source: Streetlight Data
-90%
-80%
-70%
-60%
-50%
-40%
-30%
-20%
-10%
0%
10%
20%
Mar2020
Apr2020
May2020
Jun2020
Perc
ent C
hang
e fr
om B
ench
mar
k Da
te
ImperialOrangeSan BernardinoSCAG Region
Los AngelesRiversideVentura
July2020
Aug2020
FIGURE 1 Percent Change in 7-Day Moving Average VMT by County (using January 2020 as benchmark)

3
Snapshot of COVID-19 Transportation Impacts in the SCAG Region
VMT declines are much more substantial using Streetlight data encompassing both the freeway and arterial network, suggesting greater reductions in VMT on the arterial network versus the freeway network covered by Caltrans Performance Measurement System (PeMS) data. Truck VMT using PeMS data follows similar patterns of reduction with the lowest drop nearing 30 percent in early April and a gradual rebound by mid-April.
PeMS May 2020 average total freeway VMT was 36 percent below last year. June 2020 VMT was just 12 percent below 2019. Since the low point seen in the week ending on April 11, 2020, VMT has been growing around 2.9 percent per week on average. Truck VMT through the first week of July was only 6 percent below last year. Through the first week of July, VMT using Streetlight data also reflects continued growth at 34 percent below the January 2020 benchmark.
-90%
-80%
-70%
-60%
-50%
-40%
-30%
-20%
-10%
0%
10%
Mar2020
Apr2020
May2020
Jun2020
Perc
ent C
hang
e fr
om B
ench
mar
k Da
te
PeMS Weekly Avg Truck VMT (2019-2020)
PeMS Monthly Avg Freeway VMT (2019-2020)
Streetlight Weekly Avg VMT (from Jan ‘20)
July2020
Aug2020
FIGURE 2 SCAG Region Percent Change in VMT from Benchmark by Week/Month (2019-2020)
Source: PeMS and Streetlight Data

4
Snapshot of COVID-19 Transportation Impacts in the SCAG Region
Table continues on next page
II. TRANSIT AND PASSENGER RAIL
A. TRANSITTransit Ridership Has Declined Significantly in the SCAG region
Transit ridership has declined significantly with initial drops in March, more dramatic losses in April, and some recovery in May. Overall bus ridership fell by over 71 percent in April 2020 compared to April 2019, and by 66.5 percent in May 2020 compared to May 2019.
TABLE 1 Year-Over-Year Monthly Bus Ridership Change (2019 vs. 2020)
JAN FEB MAR APR MAY
Anaheim Transportation Network -1.7% 8.8% -52.5% -79.4% -81.9%
Antelope Valley Transit Authority 4.5% 9.4% -39.5% -77.3% -72.2%
Beach Cities Transit (City of Redondo Beach) 9.9% 14.1% -43.9% -85.2% -81.0%
City of Commerce Municipal Buslines -0.2% -24.2% -55.4% -89.7% -84.1%
City of Glendale 0.2% 7.8% -47.4% -85.6% -84.0%
City of Los Angeles Department of Transportation -13.1% -40.7% -53.8% -79.8% -76.8%
City of Pasadena 15.0% 18.0% -27.5% -67.2% -64.9%
Culver City Municipal Bus Lines -7.6% 1.3% -40.6% -75.8% -72.0%
Foothill Transit 2.6% 7.5% -39.7% -62.1% -53.4%
Gold Coast Transit 10.8% 13.2% -30.6% -65.9% -59.7%
City of Gardena Transportation Department 5.0% 11.8% -45.3% -70.7% -69.0%
Imperial County Transportation Commission -0.6% -4.2% -37.1% -77.2% -76.8%
Long Beach Transit 7.6% 10.3% -33.7% -86.6% -82.7%
Los Angeles County Metro 3.4% 4.2% -35.0% -68.6% -62.6%
Montebello Bus Lines 4.7% 6.4% -36.9% -77.1% -76.5%
Norwalk Transit System 10.8% 13.2% -33.7% -77.7% -71.0%
Omnitrans 3.7% 7.0% -29.1% -64.8% -58.1%
Orange County Transportation Authority 5.1% 8.7% -33.9% -76.2% -75.0%
Riverside Transit Agency 4.5% 9.3% -33.5% -72.6% -66.4%

5
Snapshot of COVID-19 Transportation Impacts in the SCAG Region
Source: National Transit Database monthly module adjusted database (https://www.transit.dot.gov/ntd/data-product/monthly-module-adjusted-data-release)
Orange and Imperial Counties Experienced the Steepest Decline in Bus Ridership
Summarizing the data by county shows Imperial and Orange Counties with the steepest decline in bus ridership of 77 percent in April. This pattern held steady in May, while the other counties experienced some recovery.
Source: SCAG Analysis of National Transit Database monthly module adjusted database
FIGURE 3 Year-Over-Year Bus Ridership Change, Summarized by County (2019 vs. 2020)
-90%
-80%
-70%
-60%
-50%
-40%
-30%
-20%
-10%
0%
10%
20%
Jan Feb Mar Apr
ImperialOrangeSan Bernardino
Los AngelesRiversideVentura
May
JAN FEB MAR APR MAY
Santa Clarita Transit 1.6% -4.4% -45.9% -81.4% -81.5%
Santa Monica's Big Blue Bus 6.6% 9.4% -29.5% -73.1% -73.6%
SunLine Transit Agency 4.5% 6.6% -35.5% -62.9% -59.6%
Torrance Transit System 12.9% 11.9% -25.6% -69.0% -62.2%
Ventura Intercity Service Transit Authority -3.3% 5.7% -37.6% -82.5% -75.8%
Victor Valley Transit Authority 11.9% 20.6% -33.4% -70.4% -67.5%
TOTAL 3.1% 3.8% -36.0% -71.2% -66.5%
TABLE 1 Year-Over-Year Monthly Bus Ridership Change (2019 vs. 2020) — Continued
6
Snapshot of COVID-19 Transportation Impacts in the SCAG Region
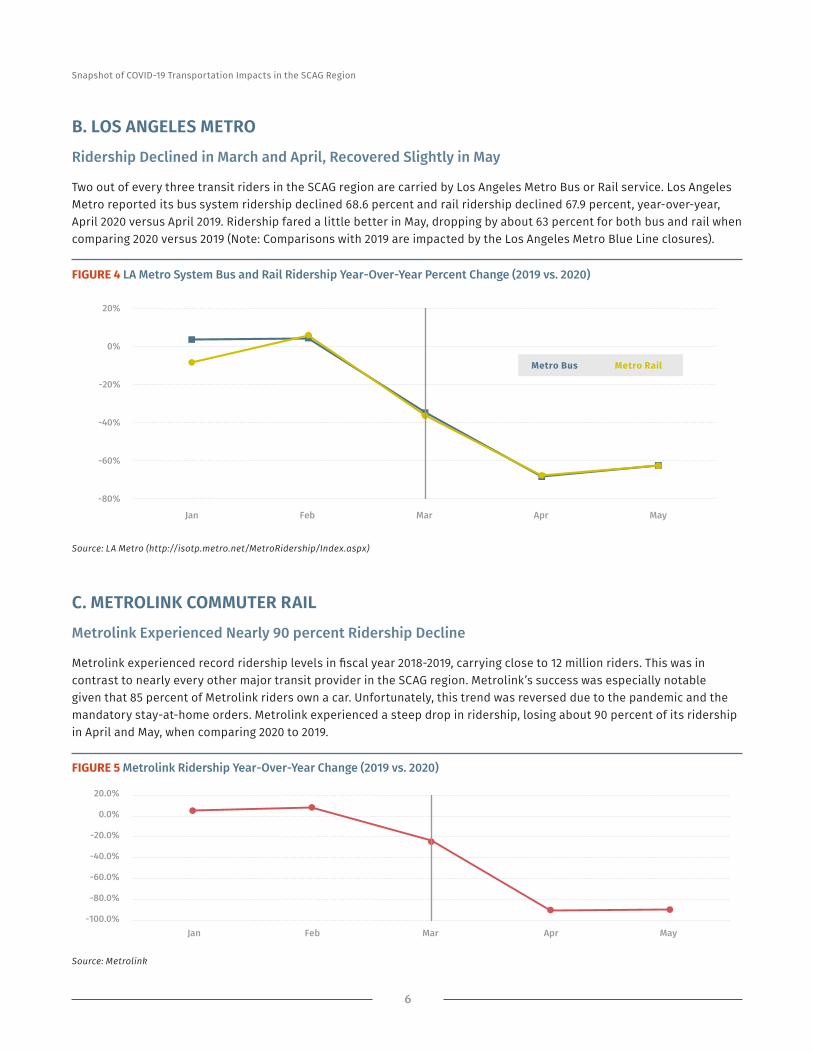
B. LOS ANGELES METRORidership Declined in March and April, Recovered Slightly in May
Two out of every three transit riders in the SCAG region are carried by Los Angeles Metro Bus or Rail service. Los Angeles Metro reported its bus system ridership declined 68.6 percent and rail ridership declined 67.9 percent, year-over-year, April 2020 versus April 2019. Ridership fared a little better in May, dropping by about 63 percent for both bus and rail when comparing 2020 versus 2019 (Note: Comparisons with 2019 are impacted by the Los Angeles Metro Blue Line closures).
FIGURE 4 LA Metro System Bus and Rail Ridership Year-Over-Year Percent Change (2019 vs. 2020)
-80%
-60%
-40%
-20%
0%
20%
Jan Feb Mar Apr May
Metro Bus Metro Rail
Source: LA Metro (http://isotp.metro.net/MetroRidership/Index.aspx)
C. METROLINK COMMUTER RAILMetrolink Experienced Nearly 90 percent Ridership Decline
Metrolink experienced record ridership levels in fiscal year 2018-2019, carrying close to 12 million riders. This was in contrast to nearly every other major transit provider in the SCAG region. Metrolink’s success was especially notable given that 85 percent of Metrolink riders own a car. Unfortunately, this trend was reversed due to the pandemic and the mandatory stay-at-home orders. Metrolink experienced a steep drop in ridership, losing about 90 percent of its ridership in April and May, when comparing 2020 to 2019.
FIGURE 5 Metrolink Ridership Year-Over-Year Change (2019 vs. 2020)
-100.0%
-80.0%
-60.0%
-40.0%
-20.0%
0.0%
20.0%
Jan Feb Mar Apr May
Source: Metrolink

7
Snapshot of COVID-19 Transportation Impacts in the SCAG Region
III. AVIATION
A. AIR PASSENGER TRAFFICAir Passenger Demand Down Globally, Nationally, and in the SCAG Region
Air passenger activity throughout the World, United States, and within the SCAG region, has been significantly impacted by the COVID-19 pandemic. Global air traffic was down 65 percent from March 2020 (15,012 flights) to April 2020 (5,275 flights).
Source: flightradar24.com
Similar to global air traffic, flights in North America have declined considerably. Air traffic in the United States was down 65 percent as well from March (8,400 flights) to April (2,950 flights)
Global Air Traffic from March 7, 2020 to April 7, 2020
North American Air Traffic from March 7, 2020 to April 7, 2020
MARCH 7, 2020 APRIL 7, 2020
MARCH 7, 2020 APRIL 7, 2020
Source: flightradar24.com

8
Snapshot of COVID-19 Transportation Impacts in the SCAG Region
Air passenger demand in the SCAG region was not immune to the impacts of the COVID-19 pandemic. The decline in regional air passenger demand mirrors global and national trends. Air passenger traffic has declined significantly in the months following the COVID-19 outbreak. In comparison to last year, air passenger traffic was down almost 60 percent in March and 96 percent in April.
Source: Airport monthly activity reports and Federal Aviation Administration (FAA) Air Traffic Activity Data System (ATADS)
FIGURE 6 Total SCAG Region Airport Passengers (2019 vs 2020)
8984421
7740561
4200328
367635
8911894
8139224
98808159368386
0
2000000
4000000
6000000
8000000
10000000
12000000
January February March April
Total Passengers (2020)Total Passengers (2019)
TABLE 2 Total SCAG Region Airport Passengers (2019 vs 2020)
2019 vs 2020 JAN FEB MAR APR
Total Passengers 0.81% -4.90% -57.49% -96.08%
Air Cargo (Tons) -3.07% -3.34% -3.67% -0.37%
Total Aircraft Operations 1.40% 3.64% -22.29% -60.76%

9
Snapshot of COVID-19 Transportation Impacts in the SCAG Region
The impact of the COVID-19 pandemic has been consistent across the commercial airports throughout the SCAG Region. In comparison to January 2019, air passenger demand in the SCAG region was down over 80 percent following the March 2020 stay-at-home orders.
FIGURE 7 SCAG Region Air Passenger Percent Change from January 2019 (Jan 2019 to April 2020)
-120.00%
-100.00%
-80.00%
-60.00%
-40.00%
-20.00%
0.00%
20.00%
40.00%
60.00%
Jan2019
Feb2019
Mar2019
Apr2019
May2019
Jun2019
Jul2019
Aug2019
Sept2019
Oct2019
Nov2019
Dec2019
Jan2020
Feb2020
Mar2020
Apr2020
LAXSNACombined
BURONT
Source: Airport monthly activity reports

10
Snapshot of COVID-19 Transportation Impacts in the SCAG Region
B. AIRCRAFT OPERATIONSAircraft Operations Down, but Not at Same Level as Passenger Demand
While air passenger demand has seen the greatest decreases, aircraft operations have not been affected to the same extent, most likely due to airlines operating at lower load factors. Although aircraft operations have not decreased at the same rate as passenger demand, operations have experienced significant decreases. Overall, aircraft operations were down 61 percent in the SCAG region from April 2019 to April 2020. At SCAG region commercial airports, aircraft operations were down anywhere between 30-70 percent in comparison to January 2019.
Source: Airport monthly activity reports and Federal Aviation Administration (FAA) Air Traffic Activity Data System (ATADS)
FIGURE 8 Total SCAG Region Aircraft Operations (2019 vs 2020)
FIGURE 9 SCAG Region Aircraft Operations Percent Change from January 2019 (Jan 2019 to April 2020)
130918122826
106513
52969
129113118516
137066134974
0
20000
40000
60000
80000
100000
120000
140000
160000
January February March April
Total Aircraft Operations (2020)Total Aircraft Operations (2019)
-80.00%
-60.00%
-40.00%
-20.00%
0.00%
20.00%
40.00%
Jan2019
Feb2019
Mar2019
Apr2019
May2019
Jun2019
Jul2019
Aug2019
Sept2019
Oct2019
Nov2919
Dec2019
Jan2020
Feb2020
Mar2020
Apr2020
LAXSNABUR
ONTCombined
11
Snapshot of COVID-19 Transportation Impacts in the SCAG Region
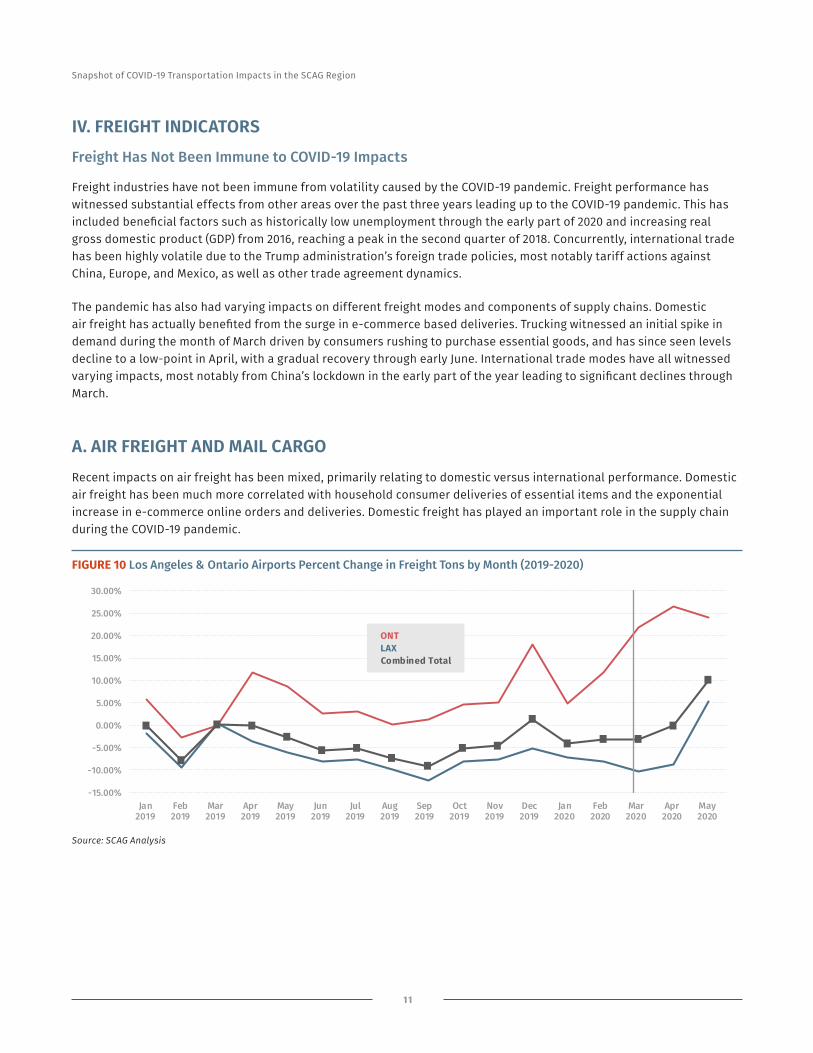
IV. FREIGHT INDICATORSFreight Has Not Been Immune to COVID-19 Impacts
Freight industries have not been immune from volatility caused by the COVID-19 pandemic. Freight performance has witnessed substantial effects from other areas over the past three years leading up to the COVID-19 pandemic. This has included beneficial factors such as historically low unemployment through the early part of 2020 and increasing real gross domestic product (GDP) from 2016, reaching a peak in the second quarter of 2018. Concurrently, international trade has been highly volatile due to the Trump administration’s foreign trade policies, most notably tariff actions against China, Europe, and Mexico, as well as other trade agreement dynamics.
The pandemic has also had varying impacts on different freight modes and components of supply chains. Domestic air freight has actually benefited from the surge in e-commerce based deliveries. Trucking witnessed an initial spike in demand during the month of March driven by consumers rushing to purchase essential goods, and has since seen levels decline to a low-point in April, with a gradual recovery through early June. International trade modes have all witnessed varying impacts, most notably from China’s lockdown in the early part of the year leading to significant declines through March.
A. AIR FREIGHT AND MAIL CARGORecent impacts on air freight has been mixed, primarily relating to domestic versus international performance. Domestic air freight has been much more correlated with household consumer deliveries of essential items and the exponential increase in e-commerce online orders and deliveries. Domestic freight has played an important role in the supply chain during the COVID-19 pandemic.
Source: SCAG Analysis
FIGURE 10 Los Angeles & Ontario Airports Percent Change in Freight Tons by Month (2019-2020)
-15.00%
-10.00%
-5.00%
0.00%
5.00%
10.00%
15.00%
20.00%
25.00%
30.00%
Jan2019
Feb2019
Mar2019
Apr2019
May2019
Jun2019
Jul2019
Aug2019
Sep2019
Oct2019
Nov2019
Dec2019
Jan2020
Feb2020
Mar2020
Apr2020
ONTLAXCombined Total
May2020
12
Snapshot of COVID-19 Transportation Impacts in the SCAG Region
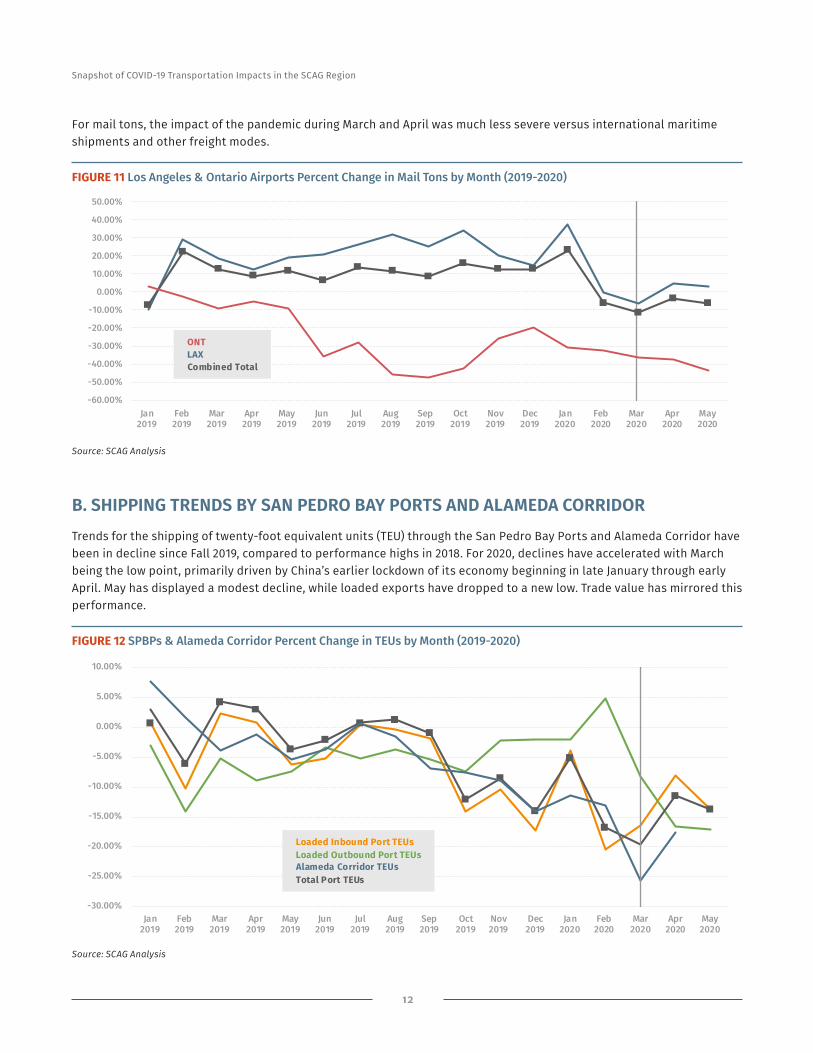
For mail tons, the impact of the pandemic during March and April was much less severe versus international maritime shipments and other freight modes.
Source: SCAG Analysis
B. SHIPPING TRENDS BY SAN PEDRO BAY PORTS AND ALAMEDA CORRIDOR Trends for the shipping of twenty-foot equivalent units (TEU) through the San Pedro Bay Ports and Alameda Corridor have been in decline since Fall 2019, compared to performance highs in 2018. For 2020, declines have accelerated with March being the low point, primarily driven by China’s earlier lockdown of its economy beginning in late January through early April. May has displayed a modest decline, while loaded exports have dropped to a new low. Trade value has mirrored this performance.
-60.00%
-50.00%
-40.00%
-30.00%
-20.00%
-10.00%
0.00%
10.00%
20.00%
30.00%
40.00%
50.00%
Jan2019
Feb2019
Mar2019
Apr2019
May2019
Jun2019
Jul2019
Aug2019
Sep2019
Oct2019
Nov2019
Dec2019
Jan2020
Feb2020
Mar2020
Apr2020
ONTLAXCombined Total
May2020
FIGURE 11 Los Angeles & Ontario Airports Percent Change in Mail Tons by Month (2019-2020)
Source: SCAG Analysis
FIGURE 12 SPBPs & Alameda Corridor Percent Change in TEUs by Month (2019-2020)
-30.00%
-25.00%
-20.00%
-15.00%
-10.00%
-5.00%
0.00%
5.00%
10.00%
Jan2019
Feb2019
Mar2019
Apr2019
May2019
Jun2019
Jul2019
Aug2019
Sep2019
Oct2019
Nov2019
Dec2019
Jan2020
Feb2020
Mar2020
Apr2020
May2020
Loaded Inbound Port TEUsLoaded Outbound Port TEUs
Total Port TEUsAlameda Corridor TEUs

13
Snapshot of COVID-19 Transportation Impacts in the SCAG Region
C. CLASS I RAIL OPERATOR PERFORMANCE Class I rail volumes for intermodal and automotive declined greatly through April, although upward trends have begun to surface.
• Railroads may be benefiting somewhat from e-commerce dynamics for trailers on flat cars.
• Intermodal containers, which include international marine and domestic containers, have improved since March.
• The annual rate of total vehicle sales has been on a steady decline. This has accelerated to a 90 percent drop from last year during April/May. A strong upward recovery has begun through mid-June.
Source: SCAG Analysis
FIGURE 13 BNSF & Union Pacific Percent Change in Containers/Trailers/Motor Veh. & Equip. by Week (2019-2020)
-100%
-80%
-60%
-40%
-20%
0%
20%
W1 W3 W5 W7 W9 W11 W13 W15 W17 W19 W21 W23 W25 W27 W29 W31 W33 W35 W37 W39 W41 W43 W45 W47 W49 W51
2019 Intermodal Containers2019 Intermodal Trailers2019 Motor Vechiles & Equip.2020 Intermodal Containers2020 Intermodal Trailers2020 Motor Vehicles & Equip.

14
Snapshot of COVID-19 Transportation Impacts in the SCAG Region
D. BORDER TRUCK CROSSINGS AND TRADE VALUECross-border trade value and truck activity has witnessed a substantial decline as a result of the COVID-19 pandemic. Compared to seaport trade, the greatest impact occurred in April. This is likely due to the closer proximity of the manufacturing supply chain and consumer-driven trends more in line with U.S. domestic patterns. The drop in northbound trucks was not as severe, however, suggesting higher value of goods transported.
FIGURE 14 Imperial County Percent Change in Trade Value & Truck Crossings by Month (2019-2020)
-50.00%
-40.00%
-30.00%
-20.00%
-10.00%
0.00%
10.00%
20.00%
Jan2019
Feb2019
Mar2019
Apr2019
May2019
Jun2019
Jul2019
Aug2019
Sep2019
Oct2019
Nov2019
Dec2019
Jan2020
Feb2020
Mar2020
Apr2020
Import ValueExport Value
Northbound Truck CrossingsCombined Value
May2020

MAIN OFFICE900 Wilshire Blvd., Ste. 1700,Los Angeles, CA 90017 Tel: (213) 236-1800
REGIONAL OFFICES
IMPERIAL COUNTY1503 North Imperial Ave., Ste. 104 El Centro, CA 92243Tel: (213) 236-1967
ORANGE COUNTYOCTA Building 600 South Main St., Ste. 741 Orange, CA 92868 Tel: (213) 236-1997
RIVERSIDE COUNTY3403 10th St., Ste. 805 Riverside, CA 92501 Tel: (951) 784-1513
SAN BERNARDINO COUNTY1170 West 3rd St., Ste. 140 San Bernardino, CA 92410 Tel: (213) 236-1925
VENTURA COUNTY4001 Mission Oaks Blvd., Ste. L Camarillo, CA 93012Tel: (213) 236-1960
scag.ca.gov
please recycle | #2951.2020.08.06