Embed Size (px)
Citation preview

SNAP Participation and Urban and Rural Food Security
Nutrition Assistance Program Report March 2014 Food and Nutrition Service Office of Policy Support
Non-Discrimination Policy The U.S. Department of Agriculture (USDA) prohibits discrimination in all of its programs and activities on the basis of race, color, national origin, age, disability, and where applicable, sex (including gender identity and expression), marital status, familial status, parental status, religion, sexual orientation, political beliefs, genetic information, reprisal, or because all or part of an individual's income is derived from any public assistance program. (Not all prohibited bases apply to all programs.) Persons with disabilities who require alternative means for communication of program information (Braille, large print, audiotape, etc.) should contact USDA's TARGET Center at (202) 720-2600 (voice and TDD). To file a complaint of discrimination, write to USDA, Assistant Secretary for Civil Rights, Office of the Assistant Secretary for Civil Rights, 1400 Independence Avenue, S.W., Stop 9410, Washington, DC 20250-9410; or call toll-free at (866) 632-9992 (English) or (800) 877-8339 (TDD) or (866) 377-8642 (English Federal-relay) or (800) 845-6136 (Spanish Federal-relay). USDA is an equal opportunity provider and employer.

SNAP Participation and Urban and Rural Food Security
Author: James Mabli Submitted by: Mathematica Policy Research 955 Massachusetts Avenue Suite 801 Cambridge, MA 02139 Project Directors: Jim Ohls James Mabli Survey Director: Betsy Santos
Submitted to: Office of Policy Support Food and Nutrition Service 3101 Park Center Drive Alexandria, VA 22302-1500 Project Officer: Sarah Zapolsky
This study was conducted under Contract number GS-10F-0050L with the Food and Nutrition Service, United States Department of Agriculture.
This report is available on the Food and Nutrition website: http://www.fns.usda.gov Suggested Citation: Mabli, James. SNAP Participation and Urban and Rural Food Security. Prepared by Mathematica Policy Research for the U.S. Department of Agriculture, Food and Nutrition Service, March 2014.
Food and Nutrition Service, Office of Policy Support March 2014


iii
ACKNOWLEDGEMENTS
This report was prepared for the U.S. Department of Agriculture, Food and Nutrition Service (FNS), Office of Research and Analysis by James Mabli of Mathematica Policy Research. Many individuals made important contributions to this study. The author thanks Aaron Marden for expert programming in geooding, creating analysis variables, and generating study findings; Laura Castner for reviewing the report; Jim Ohls for providing technical guidance; and Autumn Parker for preparing the manuscript. The author also thanks Sarah Zapolsky of FNS for her guidance and support throughout the entire study, as well as Anita Singh, Katherine Law, and Danielle Berman of FNS and Alisha Coleman-Jensen and Mark Nord of the Economic Research Service for their thoughtful review and critique. Mathematica Project Directors: Jim Ohls and James Mabli Mathematica Project Number: 06801.750

This page has been left blank for double-sided copying.

v
CONTENTS
ACKNOWLEDGEMENTS ............................................................................................... iii EXECUTIVE SUMMARY ................................................................................................. xi I. INTRODUCTION .............................................................................................. 1 II. DATA AND METHODOLOGY .......................................................................... 3
A. Study Design ............................................................................................. 3 B. Outcome Measures and Explanatory Variables ......................................... 4
1. Outcome Measures ............................................................................. 4 2. Geocoding ........................................................................................... 5 3. Explanatory Variables ......................................................................... 6
C. Analysis Methods ....................................................................................... 6 III. FOOD INSECURITY OF SNAP HOUSEHOLDS IN URBAN AND
RURAL AREAS ................................................................................................ 9 A. Descriptive Tabulations of Food Insecurity and Urbanicity ........................ 9 B. Multivariate Analysis of Food Insecurity and Urbanicity ........................... 10
IV. SNAP AND URBAN AND RURAL FOOD INSECURITY ................................ 13 A. Associations Between SNAP and Household Food Insecurity in
Urban and Rural Areas ............................................................................ 13 B. Associations Between SNAP and Child Food Insecurity in Urban
and Rural Areas ....................................................................................... 14 V. CONCLUSIONS AND IMPLICATIONS FOR FUTURE RESEARCH ............. 17
A. Research Objectives and Key Findings ................................................... 17 B. Comparison of Findings to Related Studies ............................................. 17 C. Implications for Future Research ............................................................. 19
REFERENCES ............................................................................................... 21 APPENDIX A: FINDINGS FOR VERY LOW FOOD SECURITY APPENDIX B: DETAILS FOR FOOD INSECURITY AND
URBANICITY REGRESSIONS

Contents Mathematica Policy Research
vi
APPENDIX C: DETAILS FOR FOOD INSECURITY AND SNAP PARTICIPATION REGRESSIONS
APPENDIX D: FINDINGS FOR FOOD INSECURITY USING AN ALTERNATIVE DEFINITION OF URBAN/RURAL STATUS
vii
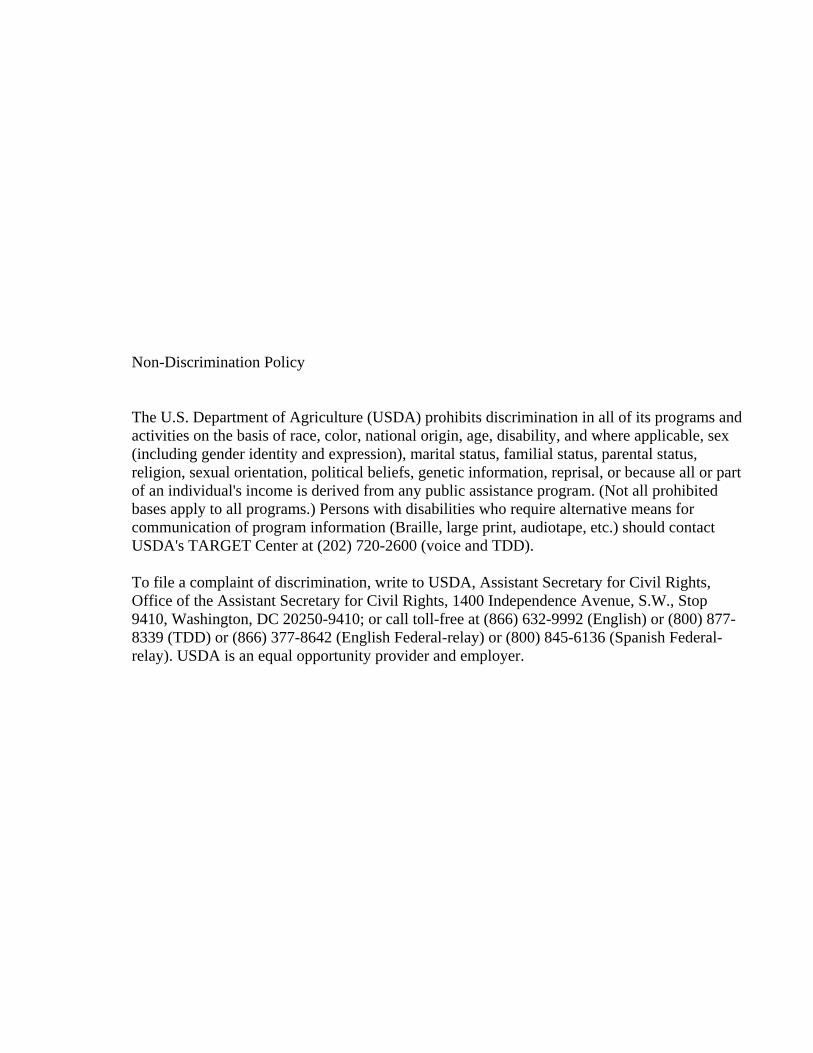
TABLES
A.1 Prevalence of Household Very Low Food Security and Children’s Very Low Food Security, for New-Entrant and Six-Month SNAP Households Living in Urban vs. Rural Areas ................................................. A-3
A.2 Percentage of Households That Have Very Low Food Security, by New-Entrant and Six-Month SNAP Participation Status and Urban vs. Rural Location ......................................................................................... A-4
A.3 Percentage of Households with Children with Very Low Food Security Among Children, by New-Entrant and Six-Month SNAP Participation Status and Urban vs. Rural Location ........................................ A-5
A.4 Percentage of Households That Have Very Low Food Security, by New-Entrant and Six-Month SNAP Participation Status and Urban vs. Rural Location ......................................................................................... A-6
A.5 Percentage of Households with Children with Very Low Food Security Among Children, by New-Entrant and Six-Month SNAP Participation Status and Urban vs. Rural Location ........................................ A-7
D.1 Prevalence of Household Food Insecurity and Children’s Food Insecurity, for New-Entrant and Six-Month SNAP Households Living in Urban vs. Rural Areas .............................................................................. D-4
D.2 Percentage of Households That Are Food Insecure, by New-Entrant and Six-Month SNAP Participation Status and Urban vs. Rural Location ........................................................................................................ D-5
D.3 Percentage of Households with Children with Food Insecurity Among Children, by New-Entrant and Six-Month SNAP Participation Status and Urban vs. Rural Location ............................................................ D-6
D.4 Percentage of Households That Are Food Insecure, by New-Entrant and Six-Month SNAP Participation Status and Urban vs. Rural Location ........................................................................................................ D-7
D.5 Percentage of Households with Children with Food Insecurity Among Children, by New-Entrant and Six-Month SNAP Participation Status and Urban vs. Rural Location ............................................................ D-8

This page has been left blank for double-sided copying.
ix
FIGURES
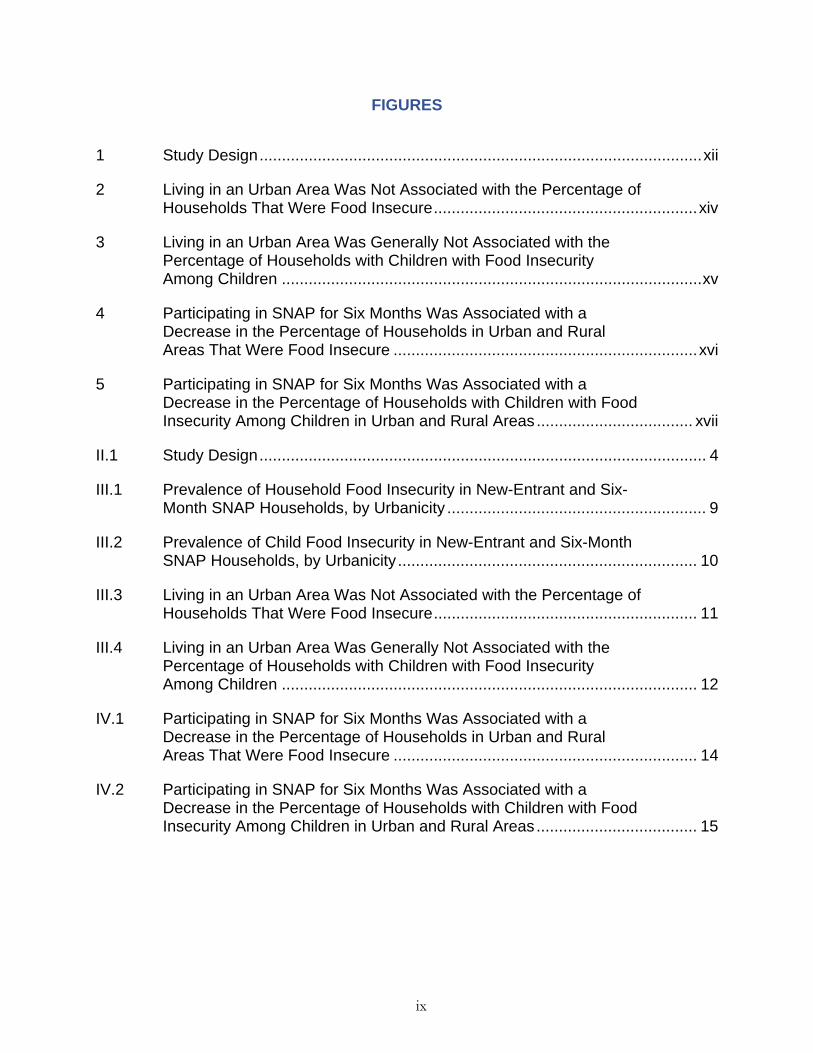
1 Study Design ................................................................................................... xii 2 Living in an Urban Area Was Not Associated with the Percentage of
Households That Were Food Insecure ........................................................... xiv 3 Living in an Urban Area Was Generally Not Associated with the
Percentage of Households with Children with Food Insecurity Among Children .............................................................................................. xv
4 Participating in SNAP for Six Months Was Associated with a Decrease in the Percentage of Households in Urban and Rural Areas That Were Food Insecure .................................................................... xvi
5 Participating in SNAP for Six Months Was Associated with a Decrease in the Percentage of Households with Children with Food Insecurity Among Children in Urban and Rural Areas ................................... xvii
II.1 Study Design .................................................................................................... 4 III.1 Prevalence of Household Food Insecurity in New-Entrant and Six-
Month SNAP Households, by Urbanicity .......................................................... 9 III.2 Prevalence of Child Food Insecurity in New-Entrant and Six-Month
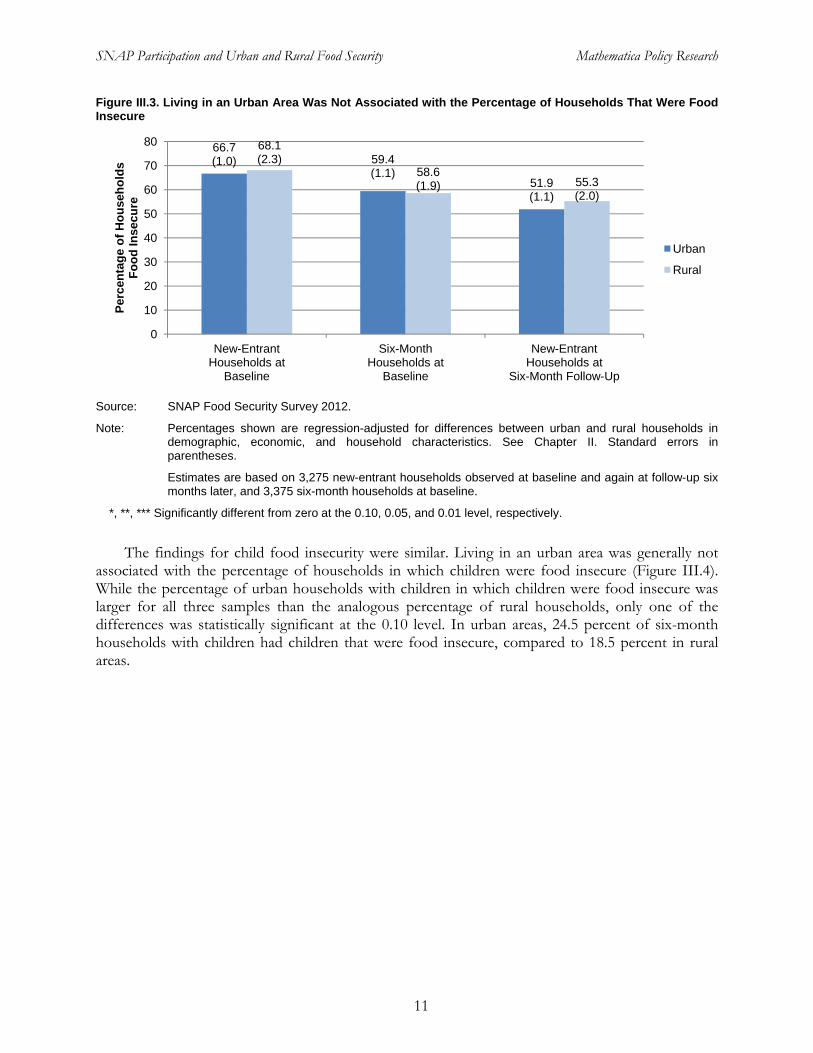
SNAP Households, by Urbanicity ................................................................... 10 III.3 Living in an Urban Area Was Not Associated with the Percentage of
Households That Were Food Insecure ........................................................... 11 III.4 Living in an Urban Area Was Generally Not Associated with the
Percentage of Households with Children with Food Insecurity Among Children ............................................................................................. 12
IV.1 Participating in SNAP for Six Months Was Associated with a Decrease in the Percentage of Households in Urban and Rural Areas That Were Food Insecure .................................................................... 14
IV.2 Participating in SNAP for Six Months Was Associated with a Decrease in the Percentage of Households with Children with Food Insecurity Among Children in Urban and Rural Areas .................................... 15

This page has been left blank for double-sided copying.

Executive Summary Mathematica Policy Research
xi
EXECUTIVE SUMMARY
A. What Are the Objectives?
The Supplemental Nutrition Assistance Program (SNAP) provides nutrition assistance benefits to low-income individuals and families in an effort to reduce hunger and improve the health and well-being of low-income people nationwide. Although SNAP has long been one of the largest and most important nutrition assistance programs for low-income households, its significance has grown even larger in recent years as it experienced record-high levels of participation. In fiscal year 2012, the program provided benefits to more than 46 million Americans on average per month.1
Given the size and importance of the program, policy researchers continually evaluate the program’s effectiveness in meeting its objectives. An outcome used by many studies has been food insecurity, which is a measure of whether a household experiences food access limitations due to lack of money or other resources. Although the evidence supporting the hypothesis that SNAP reduces food insecurity has been mixed,2 studies with the strongest research designs3—including the most recent and largest national evaluation conducted for the U.S. Department of Agriculture (Mabli et al. 2013)—have consistently shown that SNAP is associated with an improvement in food security.
There is a growing body of research demonstrating the ameliorative effects of the program, but less is known about how the association between SNAP and food security differs by the characteristics of the neighborhoods in which households live. This report examines whether the prevalence of household food insecurity, and the association between SNAP and household food insecurity, differ depending on whether a household lives in an urban or rural area. It also examines food insecurity among children.
The main objectives of this study were to:
Estimate the prevalence of household and child food insecurity in urban and rural areas.
Compare the percentage of households that are food insecure in urban areas with the percentage in rural areas after adjusting for differences in household characteristics and circumstances. Similarly, compare the percentage of households in which children are food insecure.
Estimate how the association between SNAP and food insecurity differs according to whether a household lives in an urban or rural area, after adjusting for differences in household characteristics and circumstances. Similarly, estimate the association between SNAP and food insecurity among children.
The objectives also consisted of examining household and child very low food security, which is a severe form of food insecurity.
1 Data were obtained from http://www.fns.usda.gov/pd/SNAPsummary.htm.
2 Recent reviews of the literature of the effects of SNAP on food security can be found in Mabli et al. (2013); Nord and Golla (2009); Ratcliffe et al. (2011); Wilde (2007); and Fox et al. (2004).
3 Ratcliffe et al. (2011); Mykerezi and Mills (2010); Nord and Golla 2009; Yen et al. 2008
Executive Summary Mathematica Policy Research
xii
B. How Was the Study Conducted?
Data for this study come from the SNAP Food Security (SNAPFS) survey, which Mathematica Policy Research conducted for the Food and Nutrition Service, U.S. Department of Agriculture, between October 2011 and September 2012 to assess the effect of SNAP participation on food security. SNAPFS is the largest survey of food security among SNAP participants to date.
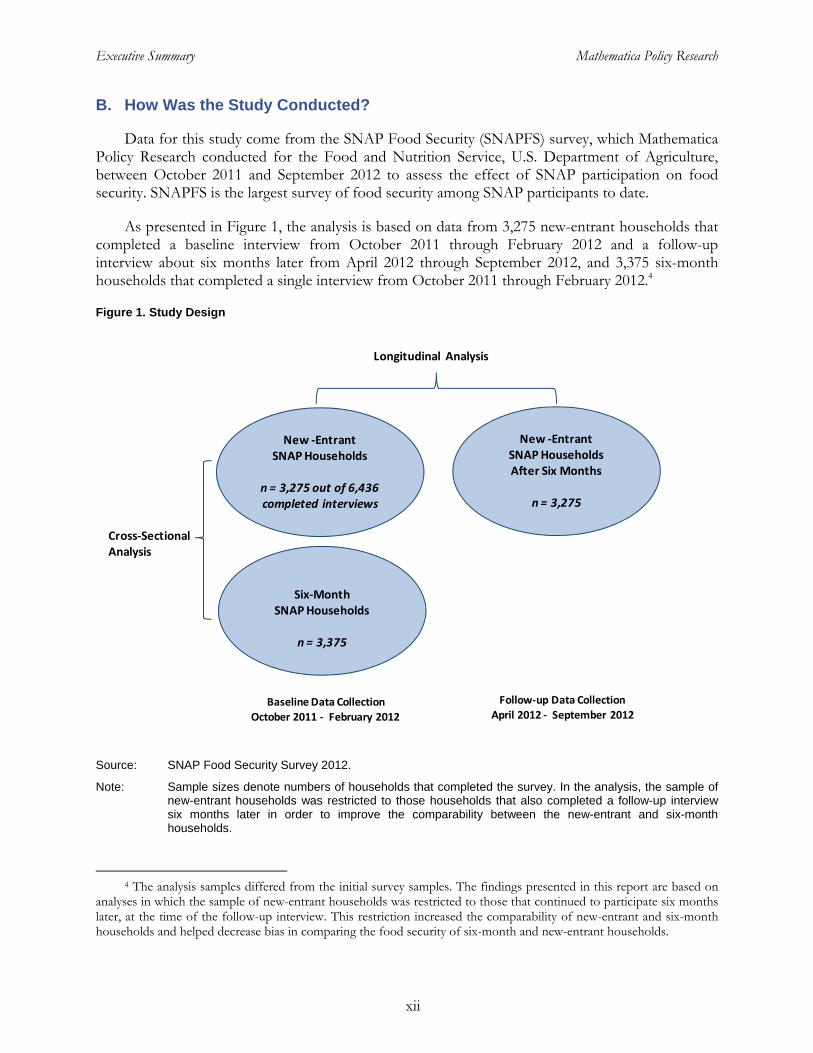
As presented in Figure 1, the analysis is based on data from 3,275 new-entrant households that completed a baseline interview from October 2011 through February 2012 and a follow-up interview about six months later from April 2012 through September 2012, and 3,375 six-month households that completed a single interview from October 2011 through February 2012.4
Figure 1. Study Design
Source: SNAP Food Security Survey 2012.
Note: Sample sizes denote numbers of households that completed the survey. In the analysis, the sample of new-entrant households was restricted to those households that also completed a follow-up interview six months later in order to improve the comparability between the new-entrant and six-month households.
4 The analysis samples differed from the initial survey samples. The findings presented in this report are based on
analyses in which the sample of new-entrant households was restricted to those that continued to participate six months later, at the time of the follow-up interview. This restriction increased the comparability of new-entrant and six-month households and helped decrease bias in comparing the food security of six-month and new-entrant households.
Longitudinal Analysis
Cross‐Sectional Analysis
New ‐Entrant SNAP Households
n = 3,275 out of 6,436 completed interviews
Six‐Month SNAP Households
n = 3,375
New ‐Entrant SNAP Households After Six Months
n = 3,275
Baseline Data Collection
October 2011 ‐ February 2012
Follow‐up Data Collection
April 2012 ‐ September 2012

Executive Summary Mathematica Policy Research
xiii
The SNAPFS survey included an 18-item food security module with a 30-day reference period. Household food security status was measured using the 10 adult-referenced items of the module. Children’s food security status was measured using the 8-item child scale of the module.
To determine whether a SNAP household lived in an urban or rural area, the Census tract in which a household resides was identified using households’ self-reported residential street address information. An indicator of urban/rural status was obtained for each Census tract from the Economic Research Service’s Food Environment Atlas (ERS 2013), based on 2010 Census data, and was merged onto the SNAPFS data file using the tract identification number.
The findings in this study are based on both descriptive and multivariate methods. Descriptive, tabular analysis was used to examine how the prevalence of food insecurity and very low food security differs in urban and rural areas for new-entrant and six-month SNAP households. Next, because the characteristics of households in urban areas likely differ from those of households in rural areas, multivariate regression analysis was used to estimate the association between household food security and urbanicity (whether a household lives in an urban or rural area) while accounting for differences in household characteristics and circumstances. Separate models were estimated for new-entrant and six-month households at the baseline interview and new-entrant households at the six-month follow-up interview.
Multivariate analysis was also used to estimate the association between household food security and SNAP participation. These analyses were based on two sets of comparisons. Using a cross-sectional sample, we compared information collected from SNAP households within days of entering the program to information collected from a contemporaneous sample of households that have participated for about six months. Next, using a longitudinal sample, we compared the baseline information collected from the new-entrant SNAP households to information from those same households six months later. All analyses used weights to account for the survey’s multistage sampling design and for nonresponse.
C. What Did the Study Find?
1. Food Insecurity of SNAP Households in Urban and Rural Areas
Descriptive tabulations of the data on key outcome variables, with no adjustment for other household characteristics, show that the prevalence of food insecurity was similar in urban and rural areas for each of the three groups of SNAP households (new-entrant households at baseline, six-month households at baseline, and new-entrant households at the six-month follow-up). The tabulations for children in SNAP households show that the prevalence of child food insecurity was higher in urban areas than in rural areas for each of the three groups of SNAP households.
While the descriptive tabulations of the prevalence of food insecurity noted in the previous paragraph represented the total difference in food security status due to living in an urban area as well as due to differences in household characteristics and circumstances, regression analysis that accounts for observed differences between households in urban and rural areas was used to estimate the difference in food security status associated with urbanicity only. We refer to these findings as “regression-adjusted” in the figures.

Executive Summary Mathematica Policy Research
xiv
Living in an urban area was not associated with the percentage of households that were food insecure. Differences ranged from -3.4 percentage points for new-entrant households at the six-month follow-up interview to 0.8 percentage points for six-month households at baseline and were not statistically significant at conventional levels (Figure 2).
Figure 2. Living in an Urban Area Was Not Associated with the Percentage of Households That Were Food Insecure
Source: SNAP Food Security Survey 2012.
Note: Percentages shown are regression-adjusted for differences between urban and rural households in demographic, economic, and household characteristics. See Chapter II.
Estimates are based on 3,275 new-entrant households observed at baseline and again at follow-up six months later, and 3,375 six-month households at baseline.
*, **, *** Significantly different from zero at the 0.10, 0.05, and 0.01 level, respectively.
The findings for child food insecurity were similar. Living in an urban area was generally not associated with the percentage of households in which children were food insecure. While the percentage of urban households with children in which children were food insecure was larger for all three samples than the analogous percentage of rural households, only one of the differences was statistically significant at the 0.10 level (Figure 3). In urban areas, 24.5 percent of six-month households with children had food insecure children, compared to 18.5 percent in rural areas.
66.759.4
51.9
68.1
58.655.3
0
10
20
30
40
50
60
70
80
New-Entrant Households at
Baseline
Six-Month Households at
Baseline
New-Entrant Households at
Six-Month Follow-Up
Per
cen
tag
e o
f H
ou
seh
old
s F
oo
d In
secu
re
Urban
Rural

Executive Summary Mathematica Policy Research
xv
Figure 3. Living in an Urban Area Was Generally Not Associated with the Percentage of Households with Children with Food Insecurity Among Children
Source: SNAP Food Security Survey 2012.
Note: Percentages shown are regression-adjusted for differences between urban and rural households in demographic, economic, and household characteristics. See Chapter II.
Estimates are based on 1,195 new-entrant households with children interviewed at both baseline and six-month follow-up and 1,522 six-month households with children interviewed at baseline.
*, **, *** Significantly different from zero at the 0.10, 0.05, and 0.01 level, respectively.
2. Associations Between SNAP and Household Food Security in Urban and Rural Areas
For households in urban and rural areas, participating in SNAP for about six months was associated with a decrease in the percentage of households that were food insecure. In addition, the decreases were similar for households in urban and rural areas; the magnitudes were not statistically significantly different.
In urban areas, participating in SNAP for about six months was associated with a reduction in the percentage of households that were food insecure of 4.5 percentage points in the cross-sectional sample, from 65.2 to 60.7 percent (Figure 4). This compares to the 5.2 percentage point reduction in rural areas from 66.6 to 61.3 percent. The associations were larger in the longitudinal sample, with reductions in food insecurity of 11.0 and 9.8 percentage points in urban and rural areas, respectively.
34.3
24.5 21.5
34.0
18.5* 19.1
0
10
20
30
40
50
60
70
80
Children in New-Entrant
Households at Baseline
Children in Six-Month
Households at Baseline
Children in New-Entrant
Households at Six-Month Follow-Up
Per
cen
tag
e o
f H
ou
seh
old
sF
oo
d In
secu
re
Urban
Rural

Executive Summary Mathematica Policy Research
xvi
Figure 4. Participating in SNAP for Six Months Was Associated with a Decrease in the Percentage of Households in Urban and Rural Areas That Were Food Insecure
Source: SNAP Food Security Survey 2012.
Note: Percentages shown are regression-adjusted for differences between new-entrant and six-month households in demographic, economic, and household characteristics. See Chapter II.
The cross-sectional estimates compare the sample of 3,275 new SNAP participants to the sample of 3,375 participants who had been receiving SNAP for about six months as of the baseline data collection. The longitudinal estimates compare the 3,275 new SNAP participants at baseline to the same 3,275 participants about six months later.
*, **, *** Significantly different from zero at the 0.10, 0.05, and 0.01 level, respectively.
For households with children in urban and rural areas, participating in SNAP for about six months was associated with a decrease in the percentage of households in which children were food insecure. Like household food insecurity, there were no statistical differences in the magnitude of the associations for households in urban and rural areas.
In urban areas, participating in SNAP for about six months was associated with a reduction in the percentage of households with children in which children were food insecure of 8.3 percentage points in the cross-sectional sample, from 34.2 to 25.9 percent (Figure 5). This compares to the 12.6 percentage point reduction in rural areas from 29.6 to 17.0 percent. The reductions in the longitudinal sample were 10.0 and 7.7 percentage points in urban and rural areas, respectively.
65.2 66.6 64.8 66.760.7*** 61.3*
53.8***
56.9***
0
10
20
30
40
50
60
70
80
Urban(Cross-Sectional)
Rural(Cross-Sectional)
Urban(Longitudinal)
Rural(Longitudinal)
Per
cen
tag
e o
f H
ou
seh
old
s F
oo
d In
secu
re
New-Entrant Households Six-Month Households

Executive Summary Mathematica Policy Research
xvii
Figure 5. Participating in SNAP for Six Months Was Associated with a Decrease in the Percentage of Households with Children with Food Insecurity Among Children in Urban and Rural Areas
Source: SNAP Food Security Survey 2012.
Note: Percentages shown are regression-adjusted for differences between new-entrant and six-month households in demographic, economic, and household characteristics. See Chapter II.
Cross-sectional estimates are based on a data set with 2,717 households with children (1,195 new-entrant households and 1,522 six-month households). Longitudinal estimates are based on a data set with 1,195 new-entrant households with children interviewed at both baseline and six month follow up.
*, **, *** Significantly different from zero at the 0.10, 0.05, and 0.01 level, respectively.
34.229.6
32.829.725.9***
17.0***22.8*** 22.0*
0
10
20
30
40
50
60
70
80
Urban(Cross-Sectional)
Rural(Cross-Sectional)
Urban(Longitudinal)
Rural(Longitudinal)
Per
cen
tag
e o
f H
ou
seh
old
s F
oo
d
Inse
cure
New-Entrant Households Six-Month Households

This page has been left blank for double-sided copying.

SNAP Participation and Urban and Rural Food Security Mathematica Policy Research
1
I. INTRODUCTION
The Supplemental Nutrition Assistance Program (SNAP) provides nutrition assistance benefits to low-income individuals and families in an effort to reduce hunger and improve the health and well-being of low-income people nationwide. Although SNAP has long been one of the largest and most important nutrition assistance programs for low-income households, its significance has grown even larger in recent years as it experienced record-high levels of participation. In Fiscal Year 2012, the program provided benefits to more than 46 million Americans on average per month.5
Given the size and importance of the program, policy researchers continually evaluate the program’s effectiveness in meeting its objectives. An outcome used by many studies has been food insecurity, which is a measure of whether a household experiences food access limitations due to lack of money or other resources. Although the evidence supporting the hypothesis that SNAP reduces food insecurity has been mixed,6 studies with the strongest research designs (Ratcliffe et al. 2011; Mykerezi and Mills 2010; Nord and Golla 2009; Yen et al. 2008), including the most recent and largest national evaluation (Mabli et al. 2013), have consistently shown that SNAP is associated with an improvement in food security.
There is a growing body of research demonstrating the ameliorative effects of the program, but less is known about how the association between SNAP and food security differs by the characteristics of the neighborhoods in which households live. In this report, we examine whether the prevalence of household food insecurity and the association between SNAP and household food insecurity differ depending on whether a household lives in an urban or rural area. We also examine food insecurity among children, and very low food security, which is a severe form of food insecurity.
The main objectives of this study were to:
Estimate the prevalence of household and child food insecurity and very low food security in urban and rural areas.
Compare the percentage of households that are food insecure in urban areas with the percentage in rural areas after adjusting for differences in household characteristics and circumstances. Repeat with household very low food security and child food insecurity and very low food security.
Estimate how the association between SNAP and food insecurity differs according to whether a household lives in an urban or rural area, after adjusting for differences in household characteristics and circumstances. Repeat with household very low food security and child food insecurity and very low food security.
We use recently collected, nationally representative data from the SNAP Food Security (SNAPFS) survey conducted by Mathematica Policy Research for the Food and Nutrition Service
5 Data were obtained from http://www.fns.usda.gov/pd/SNAPsummary.htm.
6 Recent reviews of the literature of the effects of SNAP on food security can be found in Mabli et al. (2013); Nord and Golla (2009); Ratcliffe et al. (2011); Wilde (2007); and Fox et al. (2004).

SNAP Participation and Urban and Rural Food Security Mathematica Policy Research
2
(FNS), U.S. Department of Agriculture, from October 2011 to September 2012. The study’s quasi-experimental research design consisted of two sets of comparisons. Using a cross-sectional sample, we compared information collected from SNAP households within days of entering the program with information collected from a contemporaneous sample of households that had participated for about six months. We refer to this as a cross-sectional analysis. Next, using a longitudinal sample, we compared the baseline information collected from the new-entrant SNAP households to information from those same households six months later. We refer to this as a longitudinal analysis.7 We addressed the first research objective using descriptive tabulations and the second and third objectives using multivariate regression models.
In this report, we discuss the methodology used in the analysis and present findings. Chapter II provides an overview of the study design and the data and methodology used in the analysis. In Chapter III, we describe the food security status by urbanicity of households’ residential locations using samples of new-entrant and six-month households and estimate the associations between food security and urbanicity for each sample. Chapter IV presents estimates of the associations between SNAP and household and child food insecurity by urban/rural status. Finally, we conclude in Chapter V by discussing implications for future research.
The appendices of the report provide supporting and additional tables. Because the findings for food insecurity were similar to those for very low food security, we present findings for food insecurity in the body of the report and present tables for very low food security in Appendix A. Appendices B and C contain detailed regression findings related to the food security analyses in Chapters III and IV, respectively. Appendix D presents the findings for food insecurity using an alternative data set to define urban/rural status.
7 The sample of new-entrant households used in both analyses was considerably smaller than the initial survey
samples. As discussed in Chapter II, the findings presented in this report are based on analyses in which the sample of new-entrant households was restricted to those that continued to participate six months later, at the time of the follow-up interview. This restriction increased the comparability of new-entrant and six-month households and helped decrease bias in comparing the food security of six-month and new-entrant households.

SNAP Participation and Urban and Rural Food Security Mathematica Policy Research
3
II. DATA AND METHODOLOGY
This chapter describes the study design underlying the SNAPFS survey. It also describes the outcome measures, definitions of urban and rural, analysis variables and methods, and construction of survey weights. Further details of the SNAPFS survey can be found in Appendix A of Mabli et al. (2013).
A. Study Design
The SNAPFS survey was designed to compare the food security levels of households that have applied for and been accepted into SNAP, but that are not yet receiving SNAP benefits, to the food security levels of households that have been receiving benefits for several (six to seven) months.
Because households were not randomly assigned to SNAP versus non-SNAP status, this raises the issue of “self-selection”: the possibility that members of the two groups being compared may differ in characteristics (such as underlying need) other than the defining characteristic—in this case, SNAP benefit receipt. For example, if households that have been receiving benefits for six months are different from a comparison group that has just entered the program in some unobserved aspect that caused them to remain on the program for six months, the six-month group could possibly have lower food security because of the unobserved factor.
For the analysis in this report, we sought to minimize selection bias by comparing extant SNAP participant households to households that had just entered SNAP (new-entrant households). Thus, a major source of selection bias in previous studies borne from comparing program participants to nonparticipants—many of whom do not eventually even enter SNAP—was avoided by interviewing new-entrant households and obtaining information from the month prior to entering SNAP. As shown in Figure II.1, the first design was a cross-sectional comparison group design composed of new-entrant households, defined as households that had been certified for SNAP in the five days prior to the sample date, and a group of participants who had been in the program for the previous six to seven months (six-month households). The second design was a longitudinal comparison of the new-entrant households at program entry and that same group of participants six or seven months later. This second design minimizes the bias associated with self-selection that exists when comparing different households at a point in time (as in the cross-sectional design), but may introduce biases due to changes in external factors over time. By using both quasi-experimental designs, we sought to address the weaknesses inherent in each design to obtain the most definitive possible estimates of the association between SNAP participation and child food security.

SNAP Participation and Urban and Rural Food Security Mathematica Policy Research
4
Figure II.1. Study Design
Source: SNAP Food Security Survey 2012.
Note: Sample sizes denote numbers of households that completed the survey. In the analysis, the sample of new-entrant households was restricted to those households that also completed a follow-up interview six months later in order to improve the comparability between the new-entrant and six-month households.
B. Outcome Measures and Explanatory Variables
1. Outcome Measures
The SNAPFS survey included the 18-item food security module used in the Current Population Survey Food Security Supplement (CPS-FSS). As in the CPS-FSS, we administered the 18 core items of the food security module for assessing the food security of households with children and 10 items for households without children. The questionnaire was based on a 30-day recall period.
We defined four outcome measures for the food security analyses:
1. Household food insecurity. This is a binary variable indicating whether a household was food insecure. Household food security status can be measured using the 10 adult-referenced items for households without children and the full 18 items (the 10 adult-referenced items plus the 8 child-referenced items) for households with children. In this study, we measured food security using the 10 adult-referenced items for all households to minimize any measurement effects associated with the presence and ages of children (Nord and Golla 2009; Nord and Bickel 2002). Households that affirmed three or more items were classified as food insecure.
Longitudinal Analysis
Cross‐Sectional Analysis
New ‐Entrant SNAP Households
n = 3,275 out of 6,436 completed interviews
Six‐Month SNAP Households
n = 3,375
New ‐Entrant SNAP Households After Six Months
n = 3,275
Baseline Data Collection
October 2011 ‐ February 2012
Follow‐up Data Collection
April 2012 ‐ September 2012
SNAP Participation and Urban and Rural Food Security Mathematica Policy Research
5
2. Household very low food security. This is a binary variable indicating whether a household experienced very low food security. This variable was measured using the 10-item adult scale of the food security module. Households that affirmed six or more items were classified as having very low food security.
3. Children’s food insecurity. For households with children, this is a binary variable indicating whether children in the household were food insecure. This variable was measured using the 8-item child scale of the food security module (Nord and Bickel 2002). Households that affirmed two or more items were classified as having food insecurity among children.
4. Children’s very low food security. For households with children, this is a binary variable indicating whether children in the household experienced very low food security. This variable was measured using the 8-item child scale of the food security module (Nord and Bickel 2002). Households that affirmed five or more items were classified as having very low food security among children.
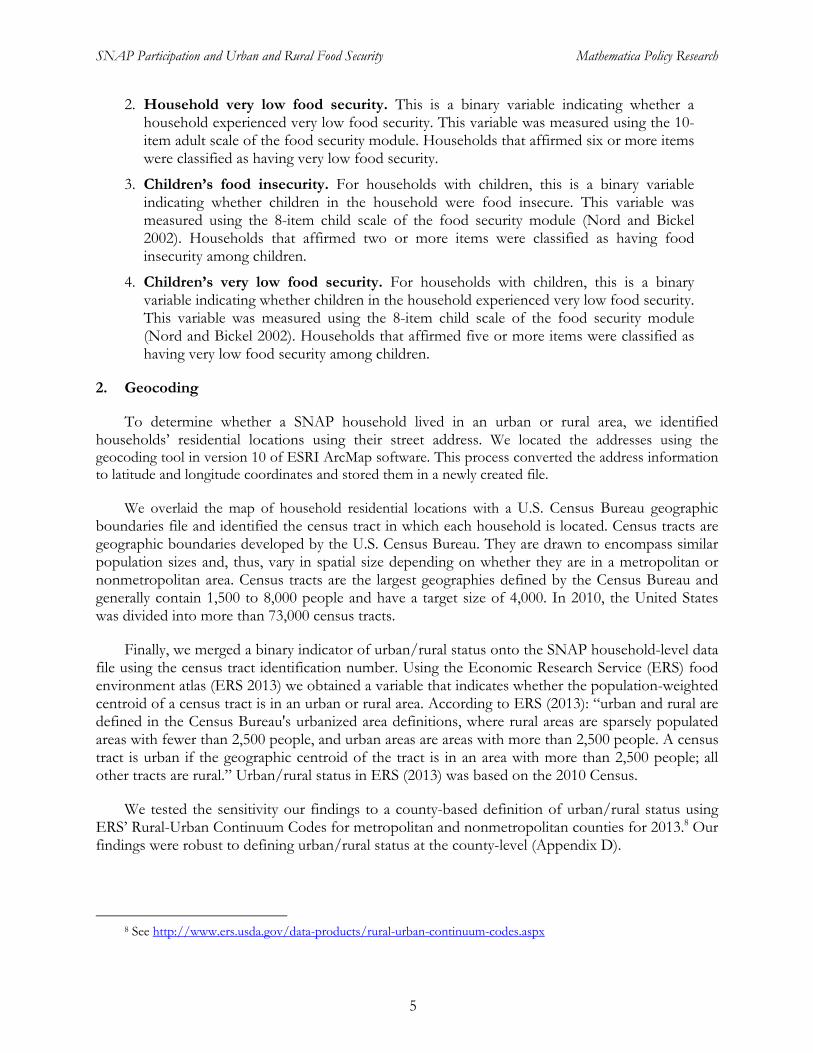
2. Geocoding
To determine whether a SNAP household lived in an urban or rural area, we identified households’ residential locations using their street address. We located the addresses using the geocoding tool in version 10 of ESRI ArcMap software. This process converted the address information to latitude and longitude coordinates and stored them in a newly created file.
We overlaid the map of household residential locations with a U.S. Census Bureau geographic boundaries file and identified the census tract in which each household is located. Census tracts are geographic boundaries developed by the U.S. Census Bureau. They are drawn to encompass similar population sizes and, thus, vary in spatial size depending on whether they are in a metropolitan or nonmetropolitan area. Census tracts are the largest geographies defined by the Census Bureau and generally contain 1,500 to 8,000 people and have a target size of 4,000. In 2010, the United States was divided into more than 73,000 census tracts.
Finally, we merged a binary indicator of urban/rural status onto the SNAP household-level data file using the census tract identification number. Using the Economic Research Service (ERS) food environment atlas (ERS 2013) we obtained a variable that indicates whether the population-weighted centroid of a census tract is in an urban or rural area. According to ERS (2013): “urban and rural are defined in the Census Bureau's urbanized area definitions, where rural areas are sparsely populated areas with fewer than 2,500 people, and urban areas are areas with more than 2,500 people. A census tract is urban if the geographic centroid of the tract is in an area with more than 2,500 people; all other tracts are rural.” Urban/rural status in ERS (2013) was based on the 2010 Census.
We tested the sensitivity our findings to a county-based definition of urban/rural status using ERS’ Rural-Urban Continuum Codes for metropolitan and nonmetropolitan counties for 2013.8 Our findings were robust to defining urban/rural status at the county-level (Appendix D).
8 See http://www.ers.usda.gov/data-products/rural-urban-continuum-codes.aspx

SNAP Participation and Urban and Rural Food Security Mathematica Policy Research
6
3. Explanatory Variables
All food security regression models included the following set of explanatory variables measuring household characteristics and circumstances: gender of household head; race and ethnicity of household head; highest grade completed by household head; employment status of household head; depression status of household head; household income-to-poverty ratio; household size; household composition; prior SNAP participation status; participation in Federal or State assistance programs; changes in household size, housing status, employment, pay, or hours worked; region of residence; State wage and unemployment rate; and State SNAP policies.
Appendix A of Mabli et al. (2013) describes how these variables were constructed. In addition to these explanatory variables, the binary indicator of urban/rural status was the main independent variable in the regressions in Chapter III and the binary indicator of whether a household was a new-entrant or six-month SNAP household was the main independent variable in the regressions in Chapter IV.
C. Analysis Methods
The analysis consisted of a mix of descriptive and multivariate methods. We used descriptive, tabular analysis to examine how the prevalence of food insecurity and very low food security differs in urban and rural areas for new-entrant and six-month SNAP households. Next, because the characteristics of households in urban areas likely differ from those of households in rural areas, we used multivariate logistic regression analysis to estimate the association between household food security and urbanicity while accounting for compositional and other differences between households. Separate models were estimated for new-entrant and six-month households at the baseline interview and new-entrant households at the six-month follow-up interview. Finally, we used multivariate logistic analysis to estimate the association between household food security and SNAP participation. For all multivariate analyses, separate models were estimated for the outcomes of household very low food security and child food insecurity and very low food security.
We transformed the raw logistic regression coefficients of the urbanicity and SNAP participation variables into “marginal effects” to measure the association of urbanicity (and SNAP participation) with the probability of being food insecure (or, in alternate specifications, the probability of experiencing very low food security). We present the raw regression coefficients and standard errors in Appendices B and C. In the main text, we present tables that summarize the associations and compare the rates of food insecurity across groups after accounting or adjusting for compositional differences across groups.
The summary tables have the regression-adjusted percentage of new-entrant households that are food insecure; the regression-adjusted percentage of six-month households that are food insecure; the difference in these percentages, which is the marginal effect; and the standard error of the marginal effect. Mabli et al. (2013) describes the steps used to produce regression-adjusted percentages of households that are food insecure.

SNAP Participation and Urban and Rural Food Security Mathematica Policy Research
7
Standard errors were estimated using a variance estimator based on a first-order Taylor series approximation. We accounted for the complex survey design of the SNAPFS survey when estimating standard errors.9
We used sampling weights for all analyses to account for the complex survey design and to adjust for the potential effects of differential nonresponse. Based on weighted data, the findings in this study are nationally representative of new-entrant and six-month SNAP households at the time of the baseline interviews. The findings are not representative of all SNAP households.
9 We used the Stata software’s “svy” commands.

This page has been left blank for double-sided copying.
SNAP Participation and Urban and Rural Food Security Mathematica Policy Research
9
III. FOOD INSECURITY OF SNAP HOUSEHOLDS IN URBAN AND RURAL AREAS
In this chapter, we first use tabular methods to examine the prevalence of household and child food insecurity in urban and rural areas. Next, we present regression-adjusted percentages of household and child food insecurity in urban and rural areas. All tables present separate findings for three samples: (1) new-entrant households at the baseline interview, (2) six-month households at the baseline interview, and (3) six-month households at the follow-up interview. Also, all tables restrict the sample of new-entrant households to those that continued to participate six months later, at the time of the follow-up interview.
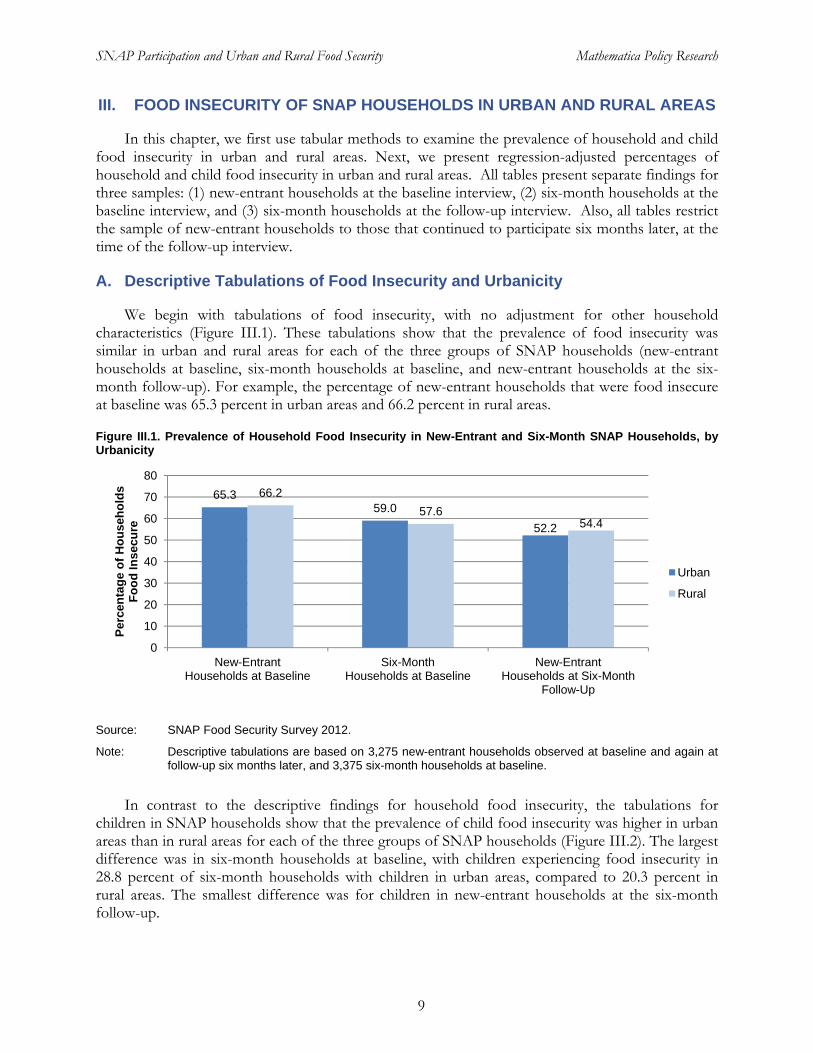
A. Descriptive Tabulations of Food Insecurity and Urbanicity
We begin with tabulations of food insecurity, with no adjustment for other household characteristics (Figure III.1). These tabulations show that the prevalence of food insecurity was similar in urban and rural areas for each of the three groups of SNAP households (new-entrant households at baseline, six-month households at baseline, and new-entrant households at the six-month follow-up). For example, the percentage of new-entrant households that were food insecure at baseline was 65.3 percent in urban areas and 66.2 percent in rural areas.
Figure III.1. Prevalence of Household Food Insecurity in New-Entrant and Six-Month SNAP Households, by Urbanicity
Source: SNAP Food Security Survey 2012.
Note: Descriptive tabulations are based on 3,275 new-entrant households observed at baseline and again at follow-up six months later, and 3,375 six-month households at baseline.
In contrast to the descriptive findings for household food insecurity, the tabulations for children in SNAP households show that the prevalence of child food insecurity was higher in urban areas than in rural areas for each of the three groups of SNAP households (Figure III.2). The largest difference was in six-month households at baseline, with children experiencing food insecurity in 28.8 percent of six-month households with children in urban areas, compared to 20.3 percent in rural areas. The smallest difference was for children in new-entrant households at the six-month follow-up.
65.359.0
52.2
66.2
57.654.4
0
10
20
30
40
50
60
70
80
New-Entrant Households at Baseline
Six-Month Households at Baseline
New-Entrant Households at Six-Month
Follow-Up
Per
cen
tag
e o
f H
ou
seh
old
sF
oo
d In
secu
re
Urban
Rural

SNAP Participation and Urban and Rural Food Security Mathematica Policy Research
10
Figure III.2. Prevalence of Child Food Insecurity in New-Entrant and Six-Month SNAP Households, by Urbanicity
Source: SNAP Food Security Survey 2012.
Note: Descriptive tabulations are based on 1,195 new-entrant households with children interviewed at both baseline and six-month follow-up and 1,522 six-month households with children interviewed at baseline.
B. Multivariate Analysis of Food Insecurity and Urbanicity
In this section, we present regression-adjusted percentages of households that were food insecure, as well as children who experienced food insecurity. The percentages account for differences between urban and rural areas in a set of observable characteristics of households and children within households.
Living in an urban area was not associated with the percentage of households that were food insecure. Differences ranged from -3.4 percentage points for new-entrant households at the six-month follow-up interview to 0.8 percentage points for six-month households at baseline and were not statistically significant at conventional levels (Figure III.3).10
10 Given that the percentages of households that were food insecure were similar in urban and rural areas, we
explored whether there were differences in the determinants of household food insecurity in urban and rural areas. This consisted of estimating a logistic regression of food insecurity on all of the explanatory variables included in the models above except urban/rural status. We estimated separate models for households in urban and rural areas. Although there were differences in some of the determinants in urban and rural areas in each of the three samples, there were few differences that were consistent across at least two samples (Appendix B). For new-entrant and six-month households at baseline, food insecurity was positively associated with participating in SNAP previously for households in rural areas and was positively associated with having been evicted in the past six months for households in urban areas. For new-entrant households at baseline and those households six months later, food insecurity was positively associated with receiving unemployment compensation for households in urban areas.
37.5
28.825.0
35.8
20.3 23.5
0
10
20
30
40
50
60
70
80
Children in New-Entrant Households at
Baseline
Children in Six-Month Households at
Baseline
Children in New-Entrant Households at
Six-Month Follow-Up
Per
cen
tag
e o
f H
ou
seh
old
sF
oo
d In
secu
re
Urban
Rural
SNAP Participation and Urban and Rural Food Security Mathematica Policy Research
11
Figure III.3. Living in an Urban Area Was Not Associated with the Percentage of Households That Were Food Insecure
Source: SNAP Food Security Survey 2012.
Note: Percentages shown are regression-adjusted for differences between urban and rural households in demographic, economic, and household characteristics. See Chapter II. Standard errors in parentheses.
Estimates are based on 3,275 new-entrant households observed at baseline and again at follow-up six months later, and 3,375 six-month households at baseline.
*, **, *** Significantly different from zero at the 0.10, 0.05, and 0.01 level, respectively.
The findings for child food insecurity were similar. Living in an urban area was generally not associated with the percentage of households in which children were food insecure (Figure III.4). While the percentage of urban households with children in which children were food insecure was larger for all three samples than the analogous percentage of rural households, only one of the differences was statistically significant at the 0.10 level. In urban areas, 24.5 percent of six-month households with children had children that were food insecure, compared to 18.5 percent in rural areas.
66.7(1.0) 59.4
(1.1)51.9(1.1)
68.1(2.3)
58.6(1.9) 55.3
(2.0)
0
10
20
30
40
50
60
70
80
New-Entrant Households at
Baseline
Six-Month Households at
Baseline
New-Entrant Households at
Six-Month Follow-Up
Per
cen
tag
e o
f H
ou
seh
old
s F
oo
d In
secu
re
Urban
Rural

SNAP Participation and Urban and Rural Food Security Mathematica Policy Research
12
Figure III.4. Living in an Urban Area Was Generally Not Associated with the Percentage of Households with Children with Food Insecurity Among Children
Source: SNAP Food Security Survey 2012.
Note: Percentages shown are regression-adjusted for differences between urban and rural households in demographic, economic, and household characteristics. See Chapter II. Standard errors in parentheses.
Estimates are based on 1,195 new-entrant households with children interviewed at both baseline and six-month follow-up and 1,522 six-month households with children interviewed at baseline.
*, **, *** Significantly different from zero at the 0.10, 0.05, and 0.01 level, respectively.
34.3(1.4)
24.5(1.4)
21.5(1.9)
34.0(3.0)
18.5*(3.3)*
19.1(2.5)
0
10
20
30
40
50
60
70
80
Children in New-Entrant
Households at Baseline
Children in Six-Month
Households at Baseline
Children in New-Entrant
Households at Six-Month Follow-Up
Per
cen
tag
e o
f H
ou
seh
old
sF
oo
d In
secu
re
Urban
Rural

SNAP Participation and Urban and Rural Food Security Mathematica Policy Research
13
IV. SNAP AND URBAN AND RURAL FOOD INSECURITY
This chapter describes the estimates of the associations between SNAP and household and child food insecurity in urban and rural areas. We also examine whether there are statistical differences in the associations by urbanicity. Because the associations are based on comparing outcomes of new-entrant and six-month households, the findings in this chapter are presented by cross-sectional and longitudinal analyses, and are identical to the layout of the figures in Mabli et al. (2013).
A. Associations Between SNAP and Household Food Insecurity in Urban and Rural Areas
For households in urban and rural areas, participating in SNAP for about six months was associated with a decrease in the percentage of households that were food insecure. In addition, the decreases were similar for households in urban and rural areas; the magnitudes were not statistically significantly different.
In urban areas, participating in SNAP for about six months was associated with a reduction in the percentage of households that were food insecure of 4.5 percentage points in the cross-sectional sample, from 65.2 to 60.7 percent (Figure IV.1). This compares to the 5.2 percentage point reduction in rural areas from 66.6 to 61.3 percent.
The associations were nearly twice as large in the longitudinal sample than in the cross-sectional sample. SNAP participation was associated with a decrease in the percentage of households that were food insecure of 11.0 percentage points in urban areas, from 64.8 percent of new-entrant households to 53.8 percent of those same households six months later.11 In rural areas, the reduction was 9.8 percentage points, from 66.7 to 56.9 percent.
11 Although the same set of new-entrant households are used in the cross-sectional and longitudinal analyses, the
regression-adjusted percentages of food insecure new-entrant households differ across the two analyses because they are generated using model parameters specific to the samples being examined.

SNAP Participation and Urban and Rural Food Security Mathematica Policy Research
14
Figure IV.1. Participating in SNAP for Six Months Was Associated with a Decrease in the Percentage of Households in Urban and Rural Areas That Were Food Insecure
Source: SNAP Food Security Survey 2012.
Note: Percentages shown are regression-adjusted for differences between new-entrant and six-month households in demographic, economic, and household characteristics. See Chapter II. Standard errors in parentheses.
The cross-sectional estimates compare the sample of 3,275 new SNAP participants to the sample of 3,375 participants who had been receiving SNAP for about six months as of the baseline data collection. The longitudinal estimates compare the 3,275 new SNAP participants at baseline to the same 3,275 participants about six months later.
*, **, *** Significantly different from zero at the 0.10, 0.05, and 0.01 level, respectively.
B. Associations Between SNAP and Child Food Insecurity in Urban and Rural Areas
For households with children in urban and rural areas, participating in SNAP for about six months was associated with a decrease in the percentage of households in which children were food insecure. Like household food insecurity, there were no statistical differences in the magnitude of the associations for households in urban and rural areas.
In urban areas, participating in SNAP for about six months was associated with a reduction in the percentage of households with children in which children were food insecure of 8.3 percentage points in the cross-sectional sample, from 34.2 to 25.9 percent (Figure IV.2). This compares to the 12.6 percentage point reduction in rural areas from 29.6 to 17.0 percent.
In the longitudinal sample, SNAP was associated with a decrease in the percentage of households with children in which children were food insecure by 10.0 percentage points in urban areas, from 32.8 percent of new-entrant households to 22.8 percent of those same households six months later. In rural areas, the reduction was 7.7 percentage points, from 29.7 to 22.0 percent.
65.2(1.1)
66.6(1.9) 64.8
(1.1)66.7(1.8)60.7***
(1.1)***61.3*(1.7)* 53.8***
(1.2)***
56.9***(2.0)***
0
10
20
30
40
50
60
70
80
Urban(Cross-Sectional)
Rural(Cross-Sectional)
Urban(Longitudinal)
Rural(Longitudinal)
Per
cen
tag
e o
f H
ou
seh
old
s F
oo
d In
secu
re
New-Entrant Households Six-Month Households

SNAP Participation and Urban and Rural Food Security Mathematica Policy Research
15
Figure IV.2. Participating in SNAP for Six Months Was Associated with a Decrease in the Percentage of Households with Children with Food Insecurity Among Children in Urban and Rural Areas
Source: SNAP Food Security Survey 2012.
Note: Percentages shown are regression-adjusted for differences between new-entrant and six-month households in demographic, economic, and household characteristics. See Chapter II. Standard errors in parentheses.
Cross-sectional estimates are based on a data set with 2,717 households with children (1,195 new-entrant households and 1,522 six-month households). Longitudinal estimates are based on a data set with 1,195 new-entrant households with children interviewed at both baseline and six month follow up.
*, **, *** Significantly different from zero at the 0.10, 0.05, and 0.01 level, respectively.
34.2(1.4)
29.6(2.8)
32.8(1.4) 29.7
(2.9)25.9***(1.4)***
17.0***(2.5)***
22.8***(2.0)***
22.0*(2.6)*
0
10
20
30
40
50
60
70
80
Urban(Cross-Sectional)
Rural(Cross-Sectional)
Urban(Longitudinal)
Rural(Longitudinal)
Per
cen
tag
e o
f H
ou
seh
old
s F
oo
d
Inse
cure
New-Entrant Households Six-Month Households

This page has been left blank for double-sided copying.

SNAP Participation and Urban and Rural Food Security Mathematica Policy Research
17
V. CONCLUSIONS AND IMPLICATIONS FOR FUTURE RESEARCH
This chapter reviews the study objectives and the main findings. It also compares these findings to those of related studies of urban and rural food security. It then describes ideas for future research.
A. Research Objectives and Key Findings
The main research objectives of the study were to compare the percentage of households that were food insecure in urban areas with the percentage in rural areas and to estimate how the association between SNAP and food insecurity differs according to whether a household lives in an urban or rural area. In addition to household food insecurity, the study also examined child food insecurity.
The study found that living in an urban area was not associated with the percentage of households that were food insecure. This was true for each of the three groups of SNAP households (new-entrant households at baseline, six-month households at baseline, and new-entrant households at the six-month follow-up). The findings for child food insecurity were similar: living in an urban area was generally not associated with the percentage of households in which children were food insecure. While the percentage of urban households with children in which children were food insecure was larger for all three samples than the analogous percentage of rural households, only one of the differences (children in six-month households at baseline) was statistically significant at conventional levels.
For households in urban and rural areas, participating in SNAP for about six months was associated with a decrease in the percentage of households that were food insecure. In addition, the decreases were similar for households in urban and rural areas; the magnitudes were not statistically significantly different. For households with children in urban and rural areas, participating in SNAP for about six months was associated with a decrease in the percentage of households in which children were food insecure. Like household food insecurity, there were no statistical differences in the magnitude of the associations for households in urban and rural areas.
These findings provide strong evidence that SNAP is associated with an improvement in food security for households in both urban and rural areas. This evidence suggests SNAP is accomplishing one of its main goals, that of reducing food insecurity among low-income households, regardless of whether a household lives in an urban or rural area.
B. Comparison of Findings to Related Studies
As stated above, there were generally no associations between food insecurity and living in an urban or rural area. In addition, although SNAP participation was associated with a reduction in household and child food insecurity in both urban and rural areas, the magnitudes of the associations were not statistically significantly different in urban and rural areas. How do these findings compare to those in related studies?

SNAP Participation and Urban and Rural Food Security Mathematica Policy Research
18
Research studies have presented mixed evidence regarding whether the prevalence of household and child food insecurity differs for households living in urban or rural areas. Several descriptive studies have found higher rates of food insecurity for urban individuals than for rural individuals. Using Current Population Survey (CPS) data and a three-category metropolitan area classification,12 Coleman-Jensen et al. (2012) found that the prevalence of household food insecurity was about two percentage points higher for U.S. households located in urban areas (17.7 percent) than in rural areas (15.4 percent). Using CPS data from 2006 to 2007, Nord (2009) found slightly higher rates of child food insecurity (10.6 percent) for children living in households in urban areas relative to those in rural areas (9.2 percent). Coleman-Jensen et al. (2013), updating this study using CPS data from 2010 to 2011, also found slightly higher rates of child food insecurity for children living in households in urban areas (12.2 percent) relative to those in rural areas (10.1 percent). Two studies that examined whether there were statistical differences for households in urban and rural areas also found higher rates of food insecurity for urban households than for rural households. Using CPS data, Coleman-Jensen (2012) found that net of income and other household characteristics, suburban households were more likely to be food insecure than nonmetropolitan households and as likely to be food insecure as principal city (urban) households. Using data from food pantry clients in Iowa, Garasky et al. (2004) found statistically significantly higher rates of household food insecurity for clients in urban areas (84.3 percent) than in rural areas (58.7 percent).
Other studies have found lower rates of food insecurity for urban individuals, or have found no difference between urban and rural individuals. Haldeman et al. (2007) interviewed Hispanic individuals in North Carolina in urban and rural areas, collecting information on food security and dietary outcomes. The study found lower rates of food insecurity for individuals in urban areas (56.0 percent) than in rural areas (75.4 percent). Ziliak and Gundersen (2009) used CPS data from 2001 to 2007 to examine the determinants of food insecurity among elderly Americans. They found small, but statistically significant, differences for elderly individuals living in urban areas compared to those in rural areas. Based on descriptive tabulations, the percentage of elderly individuals who were food insecure was 5.5 percent in urban areas and 6.1 percent in rural areas—a -0.6 percentage point difference. Once they accounted for household differences in demographic and economic characteristics, they found that food insecurity rates among elderly individuals living in urban areas were 0.3 percentage points greater than for elderly individuals in rural areas. Given the magnitude of the difference, they concluded that there was no substantive effect of living in a rural area compared to an urban area.
The finding in the current study based on populations of new-entrant and six-month SNAP households that food insecurity is generally not associated with living in an urban area, relative to living in a rural area, is consistent with the findings in the studies above that considered the U.S. population and U.S. elderly individuals. It is at odds with the findings in Haldeman et al. (2007) and Garasky et al. (2004), although those studies are based on state-specific populations of North Carolina and Iowa.
We were not able to compare the second finding from the current study, that the association between SNAP participation and food insecurity was statistically similar in urban and rural areas, to related studies in the literature. The most recent studies that also found that SNAP was associated
12 Categories included households located in principal cities of metropolitan areas, in nonmetropolitan areas,
and in suburbs and other metropolitan areas outside principal cities.

SNAP Participation and Urban and Rural Food Security Mathematica Policy Research
19
with an improvement in food security, including Mabli et al. (2013), Ratcliffe et al. (2011), Mykerezi and Mills (2010), Yen et al. (2008), Nord (2011), and Nord and Golla (2009), as well as other studies that examine the association between SNAP and food insecurity,13 did not examine urban-rural differences in the effect of the program.
C. Implications for Future Research
Although it is reasonable to expect food insecurity rates to differ according to whether a household lives in an urban or rural area, it is unclear in which area food insecurity is likely to be more prevalent. For example, rural households may have more limited access to supermarkets and large grocery stores where prices are lowest, but urban households may have less income. In this study, the general lack of statistical differences between households in urban and rural areas in the prevalence of food insecurity, and the association between SNAP and food insecurity, suggest several substantive research directions. These include:
Use of an alternative measure of urbanicity to capture the degree to which an area is urban and whether it is adjacent to other urban areas. We chose to use data from ERS (2013) that were available at the census tract level and were based on 2010 Census data. An alternative data source is ERS’ Rural-Urban Continuum Codes for metropolitan and nonmetropolitan counties for 2013.14 These are also based on the 2010 decennial Census, but form a classification scheme that distinguishes metropolitan counties by the population size of their metro area, and nonmetropolitan counties by the degree of urbanization (population size) and adjacency to a metro area. There are nine codes (three for metropolitan counties and six for nonmetropolitan counties). Our findings were robust to using a county-based dichotomous definition of urban/rural status (Appendix D). However, given that other studies such as Coleman-Jensen et al. (2012), Nord (2009), and Coleman-Jensen et al. (2013) have found food insecurity differences between a three-category classification of urban, suburban, and rural areas, this may be a fruitful area of research, at the expense of accepting a larger geographic unit (county, rather than census tract) over which the degree of urbanicity is characterized.
Examination of how the association between SNAP and food security differs according to households’ physical access to food. Because SNAP households in urban and rural areas may face different food access environments, it is important to investigate whether the association between SNAP and improved food security differs by households’ geographic access to food. By linking measures of food access to the SNAPFS survey data file, one could examine whether the association between SNAP participation and household food security differs by access to SNAP retailers (Mabli 2014).
Examination of whether there are urban-rural differences in food security for SNAP households according to household characteristics, such as income or benefit size. This study examined household food security and child food security for all new-entrant and six-month SNAP households; examining differences across household subgroups such as household composition, income, and benefit size might reveal interesting differences.
13 Depolt et al. (2009); Bartfield and Dunifon (2006); Borjas (2005); Gibson-Davis and Foster (2006); Ribar and
Hamrick (2003); Gundersen and Oliveira (2001); Huffman and Jensen (2008); Wilde and Nord (2005).
14 See http://www.ers.usda.gov/data-products/rural-urban-continuum-codes.aspx.

SNAP Participation and Urban and Rural Food Security Mathematica Policy Research
20
Exploration of the role of education level in explaining urban-rural differences in the food security of SNAP households. There were few differences across urban and rural areas in the characteristics associated with food insecurity (Appendices B and C). An exception was education level. For new-entrant households in Chapter III, having more education was associated with reduced food insecurity in urban areas, but not in rural areas. Similarly, in Chapter IV, having more education was associated with reduced food insecurity in urban areas, but not rural areas, in both the cross-sectional and longitudinal samples. More research is needed to understand whether this reflects differences in labor markets in urban and rural areas.

SNAP Participation and Urban and Rural Food Security Mathematica Policy Research
21
REFERENCES
Bartfeld, J., and R. Dunifon.“State-Level Predictors of Food Insecurity Among Households with Children.” Journal of Policy Analysis and Management, vol. 25, 2006, pp. 921–942.
Borjas, G.J. “Food Insecurity and Public Assistance.” Journal of Public Economics, vol. 88, 2004, pp. 1421–1443.
Coleman-Jensen, Alisha, “Predictors of U.S. Food Insecurity across Nonmetropolitan, Suburban, and Principal City Residence during the Great Recession”, Journal of Poverty 16(4): 392-411, 2012.
Coleman-Jensen, Alisha, William McFall, and Mark Nord, 2013, Food Insecurity in Households with Children in 2010-11: Prevalence, Severity, and Household Characteristics, Economic Information Bulletin number 113, Economic Research Service, U.S. Department of Agriculture, May, 59 pp. http://ers.usda.gov/publications/eib-economic-information-bulletin/eib113.aspx
Coleman-Jensen, Alisha, Mark Nord, Margaret Andrews, and Steven Carlson. “Household Food Security in the United States in 2011.” ERR-141. U.S. Dept. of Agriculture, Economic Research Service, September 2012. Available at: http://www.ers.usda.gov/media/884525/err141.pdf.
DePolt, R.A., R.A. Moffitt, and D.C. Ribar. “Food Stamps, Temporary Assistance for Needy Families and Food Hardships in Three American Cities.” Pacific Economic Review, vol. 14, 2009, pp. 445–473.
Economic Research Service (ERS), U.S. Department of Agriculture (USDA). “Food Access Research Atlas.” 2013. Available at: http://www.ers.usda.gov/data-products/food-access-research-atlas.aspx.
Fox, M.K., W. Hamilton, and B. Lin. “Effects of Food Assistance and Nutrition Programs on Nutrition and Health: Volume 3 Literature Review.” Food Assistance and Nutrition Research Report No. 19-3. Economic Research Service, U.S. Department of Agriculture, 2004. Available at: www.ers.usda.gov/publications/fanrr19-3/.
Garasky, S., L.Wright-Morton, and K. Greder. “The Food Environment and Food Insecurity: Perceptions of Rural, Suburban, and Urban Food Pantry Clients in Iowa.” Family Economics and Nutrition Review, vol. 16, no. 2, 2004, pp. 41–48.
Gibson-Davis, C., and E.M. Foster. “A Cautionary Tale: Using Propensity Scores to Estimate the Effect of Food Stamps on Food Insecurity.” Social Service Review, vol. 80, 2006, pp. 93–126.
Gundersen, C., and V. Oliveira. “The Food Stamp Program and Food Insufficiency.” American Journal of Agricultural Economics, vol. 83, 2001, pp. 875–887.
Haldeman, Lauren, Kenneth, J. Gruber, and Kandis Ingram. “Determinants of Food Security and Diet Among Rural and Urban Latino/Hispanic. Journal of Hunger and Environmental Nutrition, vol. 2, no. 4, 2007, pp. 67–83.
Huffman, S.K., and H.H. Jensen. “Food Assistance Programs and Outcomes in the Context of Welfare Reform.” Social Science Quarterly, vol. 89, 2008, pp. 95–115.
SNAP Participation and Urban and Rural Food Security Mathematica Policy Research
22
Mabli, James. “Supplemental Nutrition Assistance Program (SNAP) Participation, Food Security, and Geographic Access to Food.” Prepared by Mathematica Policy Research for the U.S. Department of Agriculture, Food and Nutrition Service, January 2014.
Mabli, James, Jim Ohls, Lisa Dragoset, Laura Castner, and Betsy Santos. “Measuring the Effect of Supplemental Nutrition Assistance Program (SNAP) Participation on Food Security.” Prepared by Mathematica Policy Research for the U.S. Department of Agriculture, Food and Nutrition Service, August 2013.
Mykerezi E, and B. Mills. “The Impact of Food Stamp Program Participation on Household Food Insecurity.” American Journal of Agricultural Economics, vol. 92, 2010, pp. 1379–1391.
Nord Mark. “Food Insecurity in Households with Children.” Economic Information Bulletin Number 56. Alexandria, VA: USDA, Economic Research Service; September 2009.
Nord, Mark. “How Much Does the Supplemental Nutrition Assistance Program Alleviate Food Insecurity? Evidence from Recent Programme Leavers.” Public Health Nutrition, vol. 15, no. 5, 2011, pp. 811–817.
Nord, Mark, and Gary Bickel. “Measuring Children’s Food Security in U.S. Households, 1995-99.” FANRR-25. USDA, Economic Research Service, 2002.
Nord, Mark, and Anne Marie Golla. “Does SNAP Decrease Food Insecurity? Untangling the Self-Selection Effect.” Economic Research Report Number 85. Washington, DC: USDA, Economic Research Service, October 2009.
Ratcliffe, C., S. McKernan, and S. Zhang. “How Much Does the Supplemental Nutrition Assistance Program Reduce Food Insecurity?” American Journal of Agricultural Economics, vol. 93, no. 4, 2011, pp. 1082–1098.
Ribar, D.C., and K.S. Hamrick. “Dynamics of Poverty and Food Sufficiency.” Research report no. 36. Washington, DC: U.S. Department of Agriculture, Food and Nutrition Service, 2003.
Wilde, Parke. “Measuring the Effect of Food Stamps on Food Insecurity and Hunger: Research and Policy Considerations.” Journal of Nutrition, vol. 137, 2007, pp. 307–310.
Wilde, Parke, and Mark Nord. “The Effect of Food Stamps on Food Security: A Panel Data Approach.” Review of Agricultural Economics, vol. 27, 2005, pp. 425–432.
Yen, Stephen T., Margaret Andrews, Zhuo Chen, and David B. Eastwood. “Food Stamp Program Participation and Food Insecurity: An Instrumental Variables Approach.” American Journal of Agricultural Economics, vol. 90, 2008, pp. 117–132.
Ziliak, James, and Craig Gundersen. “Senior Hunger in the United States: Differences Across States and Rural and Urban Aareas.” University of Kentucky Center for Poverty Research Special Reports. September 2009. Retrieved September, 14 2013 from http://www.ukcpr.org/Publications/seniorhungerfollowup.pdf.

APPENDIX A
FINDINGS FOR VERY LOW FOOD SECURITY

This page has been left blank for double-sided copying.

Appendix A Mathematica Policy Research
A-3
Table A.1. Prevalence of Household Very Low Food Security and Children’s Very Low Food Security, for New-Entrant and Six-Month SNAP Households Living in Urban vs. Rural Areas
New-Entrant Households (Baseline)
Six-Month Households (Baseline)
New-Entrant Households
(Six-Month Follow-Up)
Household Very Low Food Security Urban 38.9 32.5 29.7 Rural 40.9 30.2 32.3
Children’s Very Low Food Security Urban 6.7 4.6 4.8 Rural 6.8 1.6 4.4
Source: SNAP Food Security Survey 2012.
Note: Descriptive tabulations of household very low food security are based on 3,275 new-entrant households observed at baseline and again at follow-up six months later, and 3,375 six-month households at baseline. Descriptive tabulations of child very low food security are based on 1,195 new-entrant households with children interviewed at both baseline and six-month follow-up and 1,522 six-month households with children interviewed at baseline.

Appendix A Mathematica Policy Research
A-4
Table A.2. Percentage of Households That Have Very Low Food Security, by New-Entrant and Six-Month SNAP Participation Status and Urban vs. Rural Location
Household Lives
in Urban Area Household Lives
in Rural Area Difference
New-Entrant Households at Baseline 37.5 (1.2) 38.6 (2.1) -1.1 (2.5)
Six-Month Households at Baseline 30.6 (0.9) 27.7 (1.6) 2.9 (2.1)
New-Entrant Households at Six-Month Follow-Up 27.5 (0.9) 28.9 (1.6) -1.4 (1.9)
Source: SNAP Food Security Survey 2012.
Note: Percentages shown are regression-adjusted for differences between urban and rural households in demographic, economic, and household characteristics. See Chapter II. Standard errors in parentheses.
Estimates are based on 3,275 new-entrant households observed at baseline and again at follow-up six months later, and 3,375 six-month households at baseline.
*, **, *** Significantly different from zero at the 0.10, 0.05, and 0.01 level, respectively.

Appendix A Mathematica Policy Research
A-5
Table A.3. Percentage of Households with Children with Very Low Food Security Among Children, by New-Entrant and Six-Month SNAP Participation Status and Urban vs. Rural Location
Household Lives
in Urban Area Household Lives
in Rural Area Difference
New-Entrant Households at Baseline 3.1 (0.8) 3.4 (1.3) -0.3 (1.1)
Six-Month Households at Baseline 1.7 (0.4) 0.8 (0.6) 0.9 (0.7)
New-Entrant Households at Six-Month Follow-Up 2.4 (0.6) 3.3 (1.6) -0.9 (1.8)
Source: SNAP Food Security Survey 2012.
Note: Percentages shown are regression-adjusted for differences between urban and rural households in demographic, economic, and household characteristics. See Chapter II. Standard errors in parentheses.
Estimates are based on 1,195 new-entrant households with children interviewed at both baseline and six-month follow-up and 1,522 six-month households with children interviewed at baseline.
*, **, *** Significantly different from zero at the 0.10, 0.05, and 0.01 level, respectively.
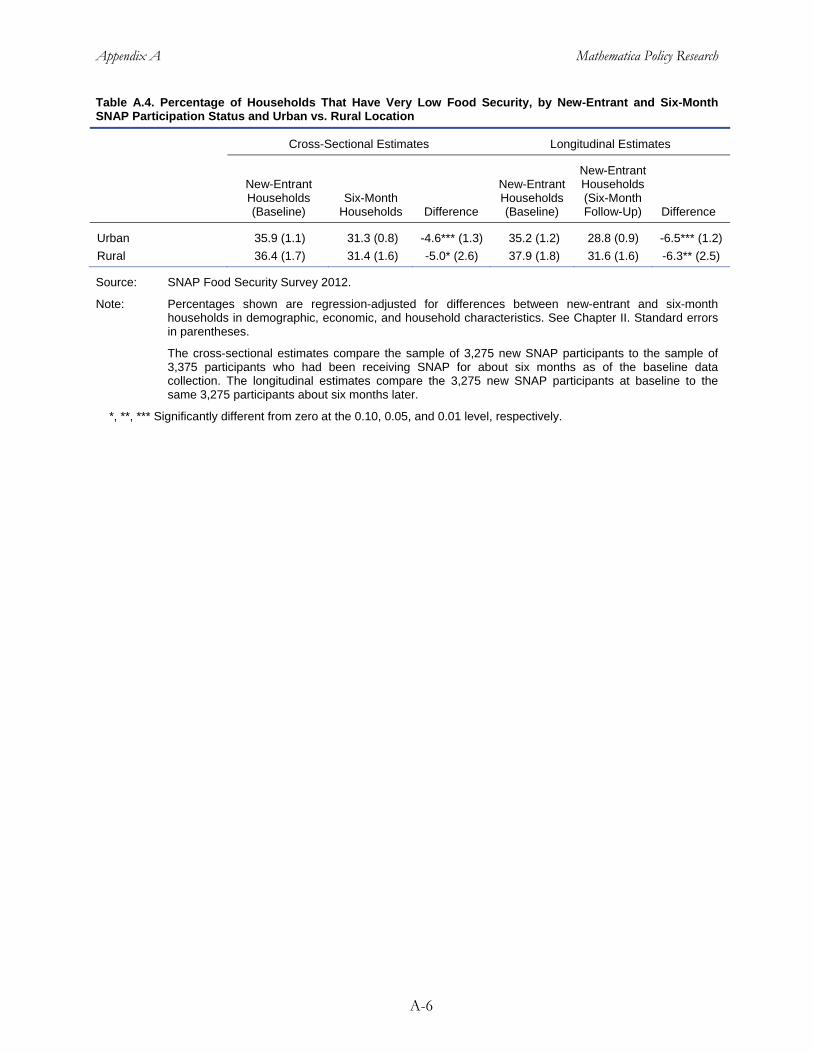
Appendix A Mathematica Policy Research
A-6
Table A.4. Percentage of Households That Have Very Low Food Security, by New-Entrant and Six-Month SNAP Participation Status and Urban vs. Rural Location
Cross-Sectional Estimates Longitudinal Estimates
New-Entrant Households (Baseline)
Six-Month Households Difference
New-Entrant Households(Baseline)
New-Entrant Households (Six-Month Follow-Up) Difference
Urban 35.9 (1.1) 31.3 (0.8) -4.6*** (1.3) 35.2 (1.2) 28.8 (0.9) -6.5*** (1.2)
Rural 36.4 (1.7) 31.4 (1.6) -5.0* (2.6) 37.9 (1.8) 31.6 (1.6) -6.3** (2.5)
Source: SNAP Food Security Survey 2012.
Note: Percentages shown are regression-adjusted for differences between new-entrant and six-month households in demographic, economic, and household characteristics. See Chapter II. Standard errors in parentheses.
The cross-sectional estimates compare the sample of 3,275 new SNAP participants to the sample of 3,375 participants who had been receiving SNAP for about six months as of the baseline data collection. The longitudinal estimates compare the 3,275 new SNAP participants at baseline to the same 3,275 participants about six months later.
*, **, *** Significantly different from zero at the 0.10, 0.05, and 0.01 level, respectively.

Appendix A Mathematica Policy Research
A-7
Table A.5. Percentage of Households with Children with Very Low Food Security Among Children, by New-Entrant and Six-Month SNAP Participation Status and Urban vs. Rural Location
Cross-Sectional Estimates Longitudinal Estimates
New-Entrant Households (Baseline)
Six-Month Households Difference
New-Entrant Households (Baseline)
New-Entrant Households (Six-Month Follow-Up) Difference
Urban 3.5 (0.7) 1.9 (0.5) -1.6** (0.7) 3.0 (0.7) 2.6 (0.9) -0.4 (0.6)
Rural 1.9 (1.3) 0.4 (0.5) -1.5 (0.9) 0.1 (0.2) 0.1 (0.1) 0.0 (0.1)
Source: SNAP Food Security Survey 2012.
Note: Percentages shown are regression-adjusted for differences between new-entrant and six-month households in demographic, economic, and household characteristics. See Chapter II. Standard errors in parentheses.
Cross-sectional estimates are based on a data set with 2,717 households with children (1,195 new-entrant households and 1,522 six-month households). Longitudinal estimates are based on a data set with 1,195 new-entrant households with children interviewed at both baseline and six month follow up.
*, **, *** Significantly different from zero at the 0.10, 0.05, and 0.01 level, respectively.

This page has been left blank for double-sided copying.

APPENDIX B
DETAILS FOR FOOD INSECURITY AND URBANICITY REGRESSIONS

This page has been left blank for double-sided copying.

APPENDIX C
DETAILS FOR FOOD INSECURITY AND SNAP PARTICIPATION REGRESSIONS

This page has been left blank for double-sided copying.

APPENDIX D
FINDINGS FOR FOOD INSECURITY USING AN ALTERNATIVE
DEFINITION OF URBAN/RURAL STATUS

This page has been left blank for double-sided copying.
Appendix D Mathematica Policy Research
D-3
This study used data from ERS (2013) that were available at the census tract level and were based on 2010 Census data. To determine whether the study’s findings were sensitive to using Census tract as the geographic unit in which to define urbanicity, we also used ERS’ Rural-Urban Continuum Codes for metropolitan and nonmetropolitan counties for 2013.15 These are also based on the 2010 decennial Census, but form a classification scheme that distinguishes metropolitan counties by the population size of their metro area, and nonmetropolitan counties by the degree of urbanization (population size) and adjacency to a metro area. They are available at the county level. Urban was defined for codes of 1, 2, or 3, corresponding to metropolitan counties. Rural was defined for codes of 4 through 9, corresponding to nonmetropolitan counties.
The findings in this study were robust to defining urban/rural status at the county level (Tables D.1 to D.5). In some cases, the estimates of food insecurity based on the county-level urban/rural status differed from the estimates based on the tract-level urban/rural status. However, the main findings remained true that (1) living in an urban area was not associated with the percentage of households that were food insecure or the percentage of households in which children were food insecure and (2) participating in SNAP was generally associated with improved food security in both urban and rural areas with no statistical difference in the size of the associations in urban and rural areas.
15 See http://www.ers.usda.gov/data-products/rural-urban-continuum-codes.aspx.

Appendix D Mathematica Policy Research
D-4
Table D.1. Prevalence of Household Food Insecurity and Children’s Food Insecurity, for New-Entrant and Six-Month SNAP Households Living in Urban vs. Rural Areas
New-Entrant Households (Baseline)
Six-Month Households (Baseline)
New-Entrant Households
(Six-Month Follow-Up)
Household Food Insecurity Urban 65.2 59.2 51.7 Rural 66.6 56.5 57.3
Children’s Food Insecurity Urban 38.0 28.4 24.9 Rural 32.6 20.0 23.5
Source: SNAP Food Security Survey 2012.
Note: Descriptive tabulations of household food insecurity are based on 3,275 new-entrant households observed at baseline and again at follow-up six months later, and 3,375 six-month households at baseline. Descriptive tabulations of child food insecurity are based on 1,195 new-entrant households with children interviewed at both baseline and six-month follow-up and 1,522 six-month households with children interviewed at baseline.

Appendix D Mathematica Policy Research
D-5
Table D.2. Percentage of Households That Are Food Insecure, by New-Entrant and Six-Month SNAP Participation Status and Urban vs. Rural Location
Household Lives
in Urban Area Household Lives
in Rural Area Difference
New-Entrant Households at Baseline 67.1 (1.1) 66.6 (2.0) 0.5 (2.1)
Six-Month Households at Baseline 59.8 (1.1) 56.5 (2.6) 3.3 (3.1)
New-Entrant Households at Six-Month Follow-Up 51.4 (1.0) 58.5 (2.5) -7.1*** (2.7)
Source: SNAP Food Security Survey 2012.
Note: Percentages shown are regression-adjusted for differences between urban and rural households in demographic, economic, and household characteristics. See Chapter II. Standard errors in parentheses.
Estimates are based on 3,275 new-entrant households observed at baseline and again at follow-up six months later, and 3,375 six-month households at baseline.
*, **, *** Significantly different from zero at the 0.10, 0.05, and 0.01 level, respectively.

Appendix D Mathematica Policy Research
D-6
Table D.3. Percentage of Households with Children with Food Insecurity Among Children, by New-Entrant and Six-Month SNAP Participation Status and Urban vs. Rural Location
Household Lives
in Urban Area Household Lives
in Rural Area Difference
New-Entrant Households at Baseline 35.2 (1.4) 28.9 (3.4) 6.3* (3.7)
Six-Month Households at Baseline 24.1 (1.5) 18.7 (2.9) 5.4* (2.9)
New-Entrant Households at Six-Month Follow-Up 20.8 (2.0) 22.0 (4.2) -1.2 (4.9)
Source: SNAP Food Security Survey 2012.
Note: Percentages shown are regression-adjusted for differences between urban and rural households in demographic, economic, and household characteristics. See Chapter II. Standard errors in parentheses.
Estimates are based on 1,195 new-entrant households with children interviewed at both baseline and six-month follow-up and 1,522 six-month households with children interviewed at baseline.
*, **, *** Significantly different from zero at the 0.10, 0.05, and 0.01 level, respectively.

Appendix D Mathematica Policy Research
D-7
Table D.4. Percentage of Households That Are Food Insecure, by New-Entrant and Six-Month SNAP Participation Status and Urban vs. Rural Location
Cross-Sectional Estimates Longitudinal Estimates
New-Entrant Households (Baseline)
Six-Month Households Difference
New-Entrant Households(Baseline)
New-Entrant Households (Six-Month Follow-Up) Difference
Urban 66.0 (1.8) 61.6 (2.0) -4.4*** (1.5) 67.2 (2.0) 60.4 (1.9) -6.8*** (1.5)
Rural 65.3 (1.1) 60.8 (1.1) -4.4 (3.0) 64.8 (1.1) 53.4 (1.0) -11.4** (2.7)
Source: SNAP Food Security Survey 2012.
Note: Percentages shown are regression-adjusted for differences between new-entrant and six-month households in demographic, economic, and household characteristics. See Chapter II. Standard errors in parentheses.
The cross-sectional estimates compare the sample of 3,275 new SNAP participants to the sample of 3,375 participants who had been receiving SNAP for about six months as of the baseline data collection. The longitudinal estimates compare the 3,275 new SNAP participants at baseline to the same 3,275 participants about six months later.
*, **, *** Significantly different from zero at the 0.10, 0.05, and 0.01 level, respectively.
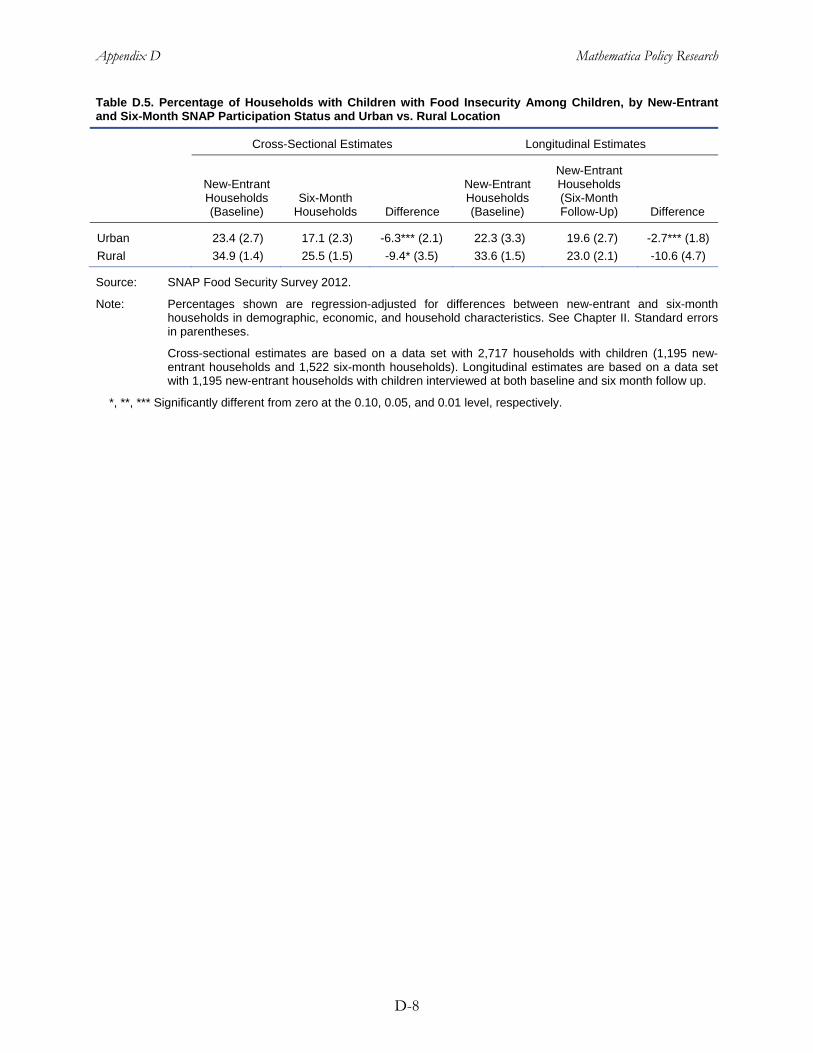
Appendix D Mathematica Policy Research
D-8
Table D.5. Percentage of Households with Children with Food Insecurity Among Children, by New-Entrant and Six-Month SNAP Participation Status and Urban vs. Rural Location
Cross-Sectional Estimates Longitudinal Estimates
New-Entrant Households (Baseline)
Six-Month Households Difference
New-Entrant Households (Baseline)
New-Entrant Households (Six-Month Follow-Up) Difference
Urban 23.4 (2.7) 17.1 (2.3) -6.3*** (2.1) 22.3 (3.3) 19.6 (2.7) -2.7*** (1.8)
Rural 34.9 (1.4) 25.5 (1.5) -9.4* (3.5) 33.6 (1.5) 23.0 (2.1) -10.6 (4.7)
Source: SNAP Food Security Survey 2012.
Note: Percentages shown are regression-adjusted for differences between new-entrant and six-month households in demographic, economic, and household characteristics. See Chapter II. Standard errors in parentheses.
Cross-sectional estimates are based on a data set with 2,717 households with children (1,195 new-entrant households and 1,522 six-month households). Longitudinal estimates are based on a data set with 1,195 new-entrant households with children interviewed at both baseline and six month follow up.
*, **, *** Significantly different from zero at the 0.10, 0.05, and 0.01 level, respectively.