Embed Size (px)
Citation preview

NBER WORKING PAPER SERIES
SMOKE GETS IN YOUR EYES:MEDICAL MARIJUANA LAWS AND TOBACCO USE
Anna ChoiDhaval Dave
Joseph J. Sabia
Working Paper 22554http://www.nber.org/papers/w22554
NATIONAL BUREAU OF ECONOMIC RESEARCH1050 Massachusetts Avenue
Cambridge, MA 02138August 2016, Revised February 2018
The authors thank Timothy Young, Thanh Tam Nguyen, Gokhan Kumpas, Zach Fone, and Brandyn Churchill for excellent research assistance. Dr. Sabia also acknowledges grant support from the Charles Koch Foundation, received while at San Diego State University and the University of New Hampshire. The views in this article are solely those of the authors and should not be regarded as stating official views of the OECD or the National Bureau of Economic Research.
NBER working papers are circulated for discussion and comment purposes. They have not been peer-reviewed or been subject to the review by the NBER Board of Directors that accompanies official NBER publications.
© 2016 by Anna Choi, Dhaval Dave, and Joseph J. Sabia. All rights reserved. Short sections of text, not to exceed two paragraphs, may be quoted without explicit permission provided that full credit, including © notice, is given to the source.

Smoke Gets in Your Eyes: Medical Marijuana Laws and Tobacco Use Anna Choi, Dhaval Dave, and Joseph J. SabiaNBER Working Paper No. 22554August 2016, Revised February 2018JEL No. D1,I1
ABSTRACT
The public health costs of tobacco consumption have been documented to be substantially larger than those of marijuana use. This study is the first to investigate the impact of medical marijuana laws (MMLs) on tobacco cigarette consumption. First, using data from the National Survey of Drug Use and Health (NSDUH), we establish that MMLs induce a 2 to 3 percentage-point increase in adult marijuana consumption, likely for both recreational and medicinal purposes. Then, using data from the NSDUH, the Behavioral Risk Factor Surveillance System (BRFSS), and the Current Population Survey Tobacco Use Supplements (CPS-TUS), we find that the enactment of MMLs leads to a 1 to 1.5 percentage-point reduction in adult cigarette smoking. We also find that MMLs reduce the number of cigarettes consumed by smokers, suggesting effects on both the cessation and intensive margins of cigarette use. Our estimated effect sizes imply substantial MML-induced tobacco-related healthcare cost savings, ranging from$4.6 to $6.9 billion per year.
Anna ChoiOrganization for Economic Cooperation and Development (OECD)[email protected]
Dhaval DaveBentley UniversityDepartment of Economics175 Forest Street, AAC 195Waltham, MA 02452-4705and IZAand also [email protected]
& Economic Self-S
Joseph J. SabiaUniversity of New HampshireDepartments of Economics10 Garrison AveDurham, NH 03824and San Diego State University, Institute of Labor Economics (IZA) [email protected]

2
1. INTRODUCTION
Tobacco smoking is the leading preventable cause of death in the United States (CDC
2014). Consumption of tobacco cigarettes has been causally linked to respiratory health
problems, heart disease, stroke, and a variety of cancers, including lung cancer, liver cancer, and
colorectal cancer (U.S. Department of Health and Human Services 2014). Tobacco smokers are
25 to 26 times more likely to suffer from lung cancer—the country’s most fatal cancer— than
their non-smoking counterparts (Thun et al. 1997a, b; Thun et al. 2013), and are also more likely
to suffer from Chronic Obstructive Pulmonary Disease (COPD), a rising cause of mortality in the
United States. In total, cigarette smoking is responsible for over 480,000 deaths annually (Xu et
al. 2015) and $170 billion in direct additional healthcare spending (Xu et al. 2015). Moreover,
exposure to secondhand tobacco smoke is associated with a substantial increase in the
probabilities of stroke and death from cardiovascular diseases (U.S. Department of Health and
Human Services 2006), adding more than $5 billion in direct medical costs and another $5
billion per year in lost productivity costs (Behan et al. 2005) to the total costs of cigarette
smoking.
In sharp contrast to tobacco consumption, marijuana use is linked to far lower risks of
mortality and morbidity and, in fact, has some well-documented health benefits. A recent report
by the National Academies of Sciences, Engineering, and Medicine (2017) concludes that while
smoking marijuana on a regular basis is associated with worse respiratory symptoms (chronic
cough and phlegm production) and more frequent chronic bronchitis episodes, it does not
increase the risk of cancers often associated with tobacco use – that of the lungs, head, and neck
– nor is there sufficient evidence to link marijuana use to an increased chronic risk of heart
3
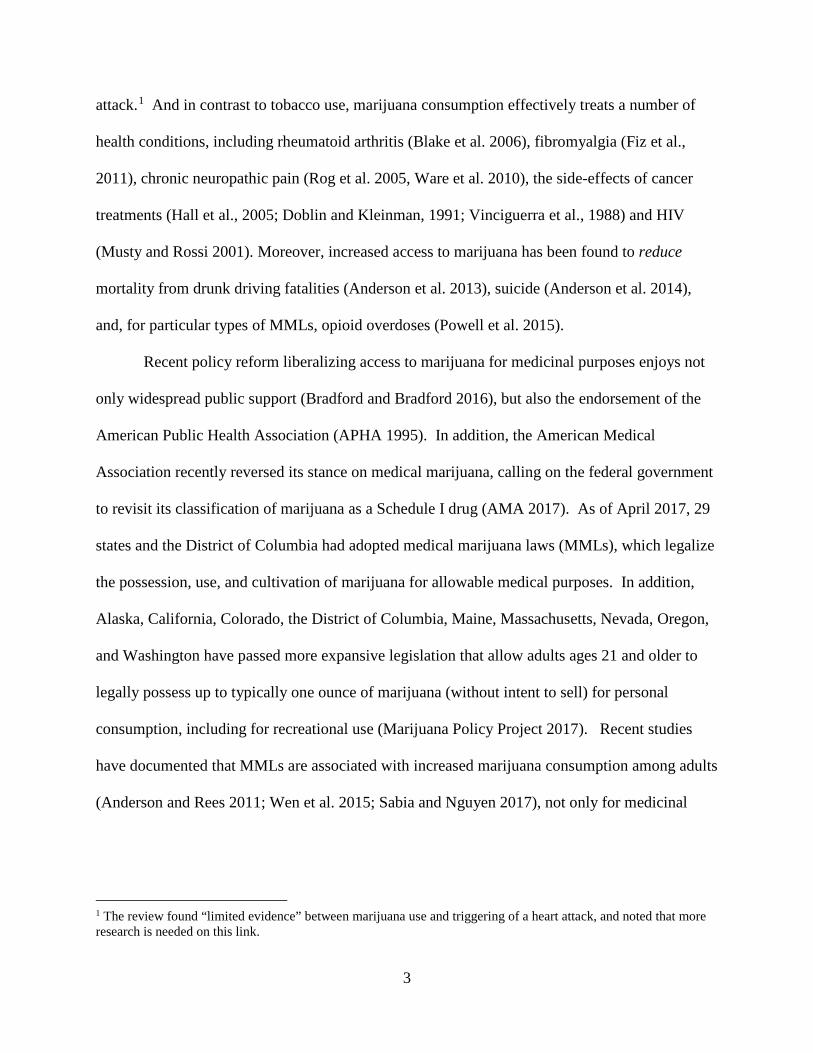
attack.1 And in contrast to tobacco use, marijuana consumption effectively treats a number of
health conditions, including rheumatoid arthritis (Blake et al. 2006), fibromyalgia (Fiz et al.,
2011), chronic neuropathic pain (Rog et al. 2005, Ware et al. 2010), the side-effects of cancer
treatments (Hall et al., 2005; Doblin and Kleinman, 1991; Vinciguerra et al., 1988) and HIV
(Musty and Rossi 2001). Moreover, increased access to marijuana has been found to reduce
mortality from drunk driving fatalities (Anderson et al. 2013), suicide (Anderson et al. 2014),
and, for particular types of MMLs, opioid overdoses (Powell et al. 2015).
Recent policy reform liberalizing access to marijuana for medicinal purposes enjoys not
only widespread public support (Bradford and Bradford 2016), but also the endorsement of the
American Public Health Association (APHA 1995). In addition, the American Medical
Association recently reversed its stance on medical marijuana, calling on the federal government
to revisit its classification of marijuana as a Schedule I drug (AMA 2017). As of April 2017, 29
states and the District of Columbia had adopted medical marijuana laws (MMLs), which legalize
the possession, use, and cultivation of marijuana for allowable medical purposes. In addition,
Alaska, California, Colorado, the District of Columbia, Maine, Massachusetts, Nevada, Oregon,
and Washington have passed more expansive legislation that allow adults ages 21 and older to
legally possess up to typically one ounce of marijuana (without intent to sell) for personal
consumption, including for recreational use (Marijuana Policy Project 2017). Recent studies
have documented that MMLs are associated with increased marijuana consumption among adults
(Anderson and Rees 2011; Wen et al. 2015; Sabia and Nguyen 2017), not only for medicinal
1 The review found “limited evidence” between marijuana use and triggering of a heart attack, and noted that more research is needed on this link.

4
purposes, but also for recreational use through supply side-induced reductions in the street price
of high-grade marijuana (Anderson et al. 2013).2
Given the proliferation of MMLs, a key concern is that these laws may generate
spillovers into the market for tobacco cigarettes and potentially undermine some of the public
health gains achieved through the reduction in cigarette smoking over the past three decades.
One of the most significant achievements of tobacco control has been to de-normalize the act of
smoking. Some health officials and policymakers have expressed concern that higher rates of
marijuana use, most of which is smoked (Schauer et al. 2016), may lead to a renormalization of
smoking (Schwartz 2017; Gorman 2016). Tobacco use may further increase if both marijuana
are tobacco are consumed together as a “spliff” (Hammersley and Leon 2006) or if marijuana
acts as a gateway for cigarette smoking. These spillovers may cause tobacco-related harms that
could outweigh any benefits associated with medicinal or recreational use of marijuana.
On the other hand, by reducing the cost of obtaining marijuana for both medicinal
and recreational use, MMLs may lead some tobacco smokers to substitute away from
cigarettes. This could be because marijuana and tobacco are often consumed via a
common method (smoking), serve a common purpose such as stress relief or enhancing
the taste of food, or because MMLs lead to improved physical and mental health, thereby
increasing the returns to healthier lifestyle choices. Moreover, even if MMLs do not
generate high rates of cessation, they may reduce days of smoking or number of
cigarettes consumed per day among smokers, which could generate important health
benefits. Because cigarette smoking generates over $170 billion in additional healthcare
costs (Xu et al. 2015), even modest MML-induced reductions in smoking would translate
2 There is also some evidence of heterogeneous effects of MMLs on marijuana consumption by type of MML (Pacula et al. 2015; Wen et al. 2015).

5
into a significant reduction in tobacco-related mortality and morbidity, easing the public
health burden of tobacco consumption.
The indirect effects of MMLs on tobacco cigarette use, which imposes
substantially higher health costs, could, in fact, generate benefits (or costs) that outweigh
those from the direct effects of MMLs on marijuana-related health outcomes.
Understanding policy-driven spillovers into other substance use is therefore integral for
designing optimal tax and regulatory policy (Pacula 1997),3 and studies that attempt to
evaluate the efficacy of liberalized marijuana policy almost always note the importance
of accounting for potential spillovers of such policies on other substances (Caulkins et al.
2015). Despite cross-sectional evidence that marijuana and tobacco consumption are
positively related (Agrawal et al. 2012), next to nothing is known about the effects of
MMLs on tobacco use. The current study addresses this gap.4
Using nationally representative data available from three large surveys — the National
Survey on Drug Use and Health (NSDUH), the Behavioral Risk Factor Surveillance Survey
(BRFSS), and the Current Population Survey Tobacco Use Supplements (CPS-TUS) — this
study comprehensively examines the effects of MMLs on marijuana and cigarette use. First,
using data from the NSDUH, we document that MMLs induce a 2 to 3 percentage-point increase
in adult marijuana use. Turning to cigarette smoking, data from all three datasets show that the
enactment of MMLs leads to an approximately 1 to 1.5 percentage-point decline in cigarette
3 While a wide body of research has examined the effects of cigarette taxes (Callison and Kaestner 2014; Cebula et al. 2014; Hansen et al. 2017; Carpenter and Cook 2008), informational campaigns (Adams et al. 2011; Liu and Tan, 2009), and smoking bans (Bruderl and Ludwig 2011; Demperio, 2013; Sari 2013) on tobacco use, increased attention has been paid to how changes in the prices of related substances may generate spillover effects on tobacco use. See, for example, Cameron and Williams (2002); Farrelly et al. (2001); Yoruk and Yoruk, (2011, 2013). 4 There is evidence that MMLs may generate other physical and mental health benefits. For instance, recent studies have examined the effect of MMLs on alcohol consumption (Anderson et al. 2013; Wen et al. 2015), suicides (Anderson et al. 2014), obesity (Sabia et al. 2017), and prescription drugs (Bradford and Bradford 2016; Kim et al. 2016).
6
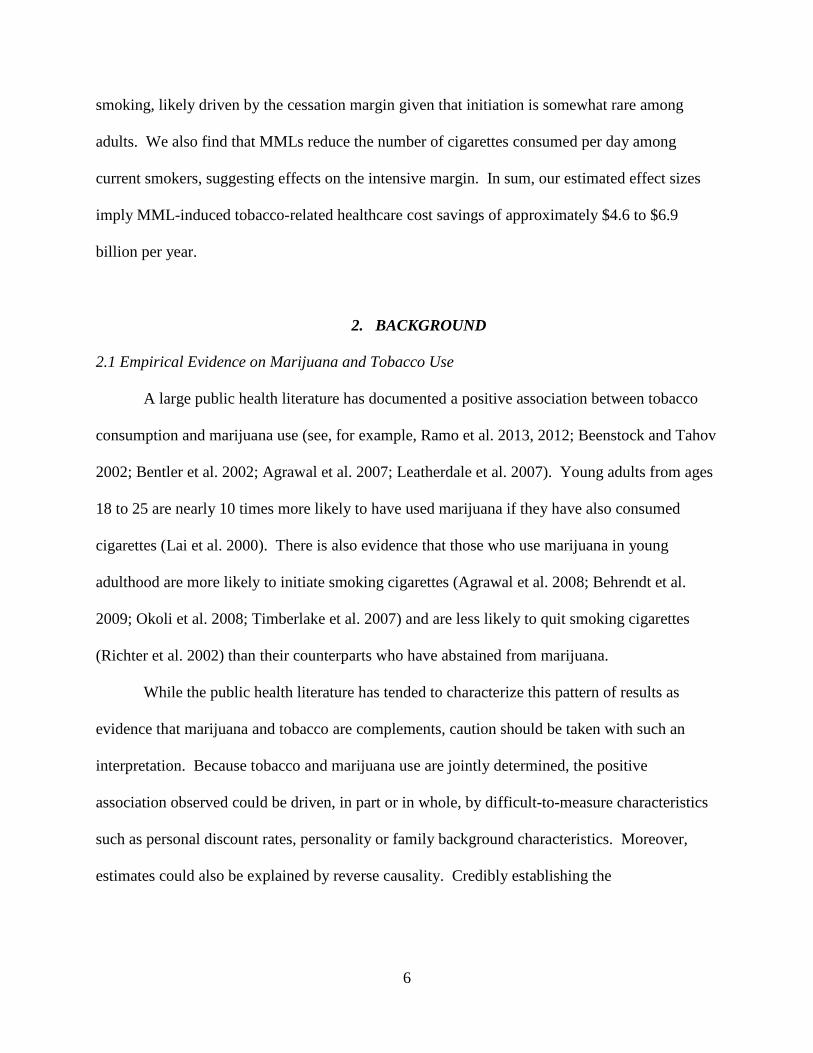
smoking, likely driven by the cessation margin given that initiation is somewhat rare among
adults. We also find that MMLs reduce the number of cigarettes consumed per day among
current smokers, suggesting effects on the intensive margin. In sum, our estimated effect sizes
imply MML-induced tobacco-related healthcare cost savings of approximately $4.6 to $6.9
billion per year.
2. BACKGROUND
2.1 Empirical Evidence on Marijuana and Tobacco Use
A large public health literature has documented a positive association between tobacco
consumption and marijuana use (see, for example, Ramo et al. 2013, 2012; Beenstock and Tahov
2002; Bentler et al. 2002; Agrawal et al. 2007; Leatherdale et al. 2007). Young adults from ages
18 to 25 are nearly 10 times more likely to have used marijuana if they have also consumed
cigarettes (Lai et al. 2000). There is also evidence that those who use marijuana in young
adulthood are more likely to initiate smoking cigarettes (Agrawal et al. 2008; Behrendt et al.
2009; Okoli et al. 2008; Timberlake et al. 2007) and are less likely to quit smoking cigarettes
(Richter et al. 2002) than their counterparts who have abstained from marijuana.
While the public health literature has tended to characterize this pattern of results as
evidence that marijuana and tobacco are complements, caution should be taken with such an
interpretation. Because tobacco and marijuana use are jointly determined, the positive
association observed could be driven, in part or in whole, by difficult-to-measure characteristics
such as personal discount rates, personality or family background characteristics. Moreover,
estimates could also be explained by reverse causality. Credibly establishing the

7
complementarity or substitutability of tobacco and marijuana requires estimation of cross-price
effects generated from plausibly exogenous shocks in prices.
A number of studies have relied on changes in cigarette taxes to identify such cross-price
effects. Using data from the National Household Survey on Drug Abuse, Farrelly et al. (2001)
find that increases in cigarette taxes are negatively related to (i) the probability of marijuana use
for 12 to 20 year-old males and (ii) the quantity of marijuana consumed by marijuana users.
Using a similar empirical approach with data from Monitoring the Future, Chaloupka et al.
(1999) find that cigarette taxes are negatively related to intensity of marijuana use among users.
There is mixed evidence on whether marijuana prices and decriminalization policies
affect tobacco use. Using data from the Australian National Drug Strategy Household Surveys,
Cameron and Williams (2002) find that higher cannabis prices are negatively related to tobacco
use, but marijuana decriminalization laws have little effect on tobacco smoking. Farrelly et al.
(2001) find that larger marijuana possession penalties are unrelated to tobacco consumption.
2.2. Medical Marijuana Laws, Marijuana Use, and Spillovers
A growing body of literature finds that MMLs are associated with increased marijuana
consumption among adults (Anderson and Rees 2011; Wen et al. 2015; Sabia and Nguyen 2017).
Using data from the National Survey for Drug Use and Health, Wen et al. (2015) find that
MMLs generate a nearly two percentage-point increase in marijuana use among adults. Sabia
and Nguyen (2017) and Anderson and Rees (2011) find a similar pattern of results in the
NSDUH. The presence of MML-induced increases in marijuana use among demographic groups
less likely to be using marijuana for medicinal purposes (those under age 30) suggests that there
are recreational spillovers of MMLs. Such an interpretation is supported by Anderson et al.

8
(2013), who find that MMLs lead to a 10 to 26 percent reduction in the street price of high-grade
marijuana and Chu (2014), who finds that MMLs induce a 10 to 20 percent increase in marijuana
possession arrests and admissions to rehabilitation centers.
In addition, health economists have also begun to explore possible spillover effects of
MMLs. A number of studies have examined the effects of MMLs on binge drinking (Pacula et
al. 2015; Anderson et al. 2014; Wen et al. 2015) and hard drugs (Wen et al. 2015; Choi 2015),
each of which could affect the demand for tobacco.5 Evidence on the impact of MMLs on
alcohol consumption is mixed. Anderson et al. (2013) and Sabia et al. (2017) find that MMLs
lead to a reduction in binge drinking, while Wen et al. (2015) find evidence of an increase in
drinking. However, given that these studies examine different state MMLs, differences in
findings could suggest that there are heterogeneous effects of MMLs across states (Pacula et al.
2015). There is little evidence that MMLs induce harder illicit drug use (Wen et al. 2015).
Finally, a newer set of studies have examined the impact of MMLs on prescription and
non-prescription drug use, as well as broader measures of physical and mental health. Bradford
and Bradford (2016) examine Medicare Part D patients and find that MMLs generate a reduction
in use of prescription drugs for illnesses for which marijuana could serve as an alternative
treatment. And Kim et al. (2016) find that MMLs are associated with a reduction in fatal
accidents involving opioids, also consistent with the hypothesis that medical marijuana and
opioids are substitutes. At the same time, there is little evidence that MMLs serve as a gateway
to harder illicit drug use (Wen et al. 2015). In fact, MMLs have been linked to broader
improvements in physical and mental health, including improved physical mobility and reduced
5 Clements et al. (2010), p. 204: “Empirical studies show that marijuana is closely related in consumption to at least two other goods, tobacco and alcohol…As argued by Pacula (1997)…such interrelations imply cross-commodity impacts of policy changes, so that changes in one drug market are likely to have spillover effects in related markets.”

9
obesity (Sabia et al. 2017), as well as diminished risk of suicide (Anderson et al. 2014).
However, the impact of MMLs on tobacco use, where prior studies and indications point to
perhaps the strongest interactions, remains unexplored.
2.3 Channels: MMLs and Cigarette Smoking
The effect of MMLs on cigarette smoking is theoretically ambiguous and can potentially
operate through both MML-induced increases in recreational and medicinal use of marijuana. If
marijuana and tobacco are consumed to achieve a similar objective, such as alleviating anxiety
(Bambico 2007) or enhancing the taste of food (Riggs et al. 2012; Soria-Gomez et al. 2014), then
the enactment of MMLs may reduce tobacco consumption. In addition, if increases in marijuana
use for medical purposes lead to improvements in physical mobility or psychological health
(Sabia et al. 2017), these positive health effects could increase the gains to avoiding tobacco.
Moreover, if alcohol and marijuana are substitutes (Anderson et al. 2013; Sabia et al. 2017; Crost
and Guerrero 2012), and alcohol and tobacco are complements (Tauchmann et al. 2013), MMLs
may reduce tobacco use via this channel. Time spent consuming marijuana may crowd-out time
spent smoking cigarettes.
Finally, the shared mode through which both marijuana and tobacco are consumed by the
majority of users may make it easier for some cigarette users to substitute toward marijuana.
Smoking is the most prevalent mode of consuming marijuana, with 89% of adult marijuana users
consuming marijuana in the form of smoking a joint (Schauer et al. 2016). Additionally,
smoking a joint is also the most common form of marijuana consumption among current (86%)

10
and former tobacco users (93%) (Singh et al. 2016). The experience of smoking may link both
cigarettes and marijuana as substitutes.6
While cigarette smoking remains the most common form of tobacco use, in the recent
decade, use of different tobacco products has increased—particularly electronic cigarettes (e-
cigarettes), smokeless tobacco, cigars, and hookah (Kasza et al. 2017).7 Thus, the shifting nature
of tobacco consumption could suggest a change in the nature of the relationship between
marijuana and tobacco use.
On the other hand, MMLs could increase cigarette smoking through several behavioral
pathways. If both substances are consumed together as a “spliff” (Hammersley and Leon 2006)
or if marijuana acts as a “gateway” substance for other risky health behaviors, including drinking
(Wen et al. 2015; Pacula et al. 2015; Yoruk and Yoruk 2011, 2013), MMLs could increase
tobacco use. Moreover, MML-induced improvements in health may cause individuals to indulge
in compensatory unhealthy behaviors (Radtke et al. 2011). Finally, as noted above, MML-
induced increases in recreational marijuana use could re-normalize smoking, and become a
gateway to cigarette smoking. Taken together, the net effect of MMLs on combustible cigarette
use depends on the mechanisms at work, the purpose of consumption (e.g. recreational or
medicinal), and the magnitudes of these potentially competing effects.
3. DATA
6 Descriptive evidence from the NSDUH (based on authors’ calculations from NSDUH 2014) also indicate some substitution at the intensive margin, with former marijuana users smoking cigarettes more frequently and intensively relative to those who currently use both cigarettes and marijuana. This suggests some crowding out of cigarettes for marijuana among current smokers. 7 Sales of pouched and flavored moist snuff (smokeless tobacco) increased by 333.8% and 72.1% respectively from 2005 to 2011 (Delnevo et al., 2014). Users of multiple tobacco products have also increased, particularly among young adults, where about 40% of tobacco users (both adults and young adults) reported using multiple products (Kasza et al., 2017). Adults who smoke cigarettes and smokeless tobaccos tend to be heavier cigarette smokers in terms of quantity and frequency (Cheng et al., 2017).

11
Our analysis draws upon three national data sets, each of which offers distinct advantages
designed to complement the others.
3.1 NSDUH
The NSDUH is an annual cross-sectional survey available from the Substance Abuse and
Mental Health Services Administration (SAMHSA) that collects data from about 70,000
individuals, ages 12 and older, randomly selected from the U.S. civilian non-institutionalized
population. The NSDUH collects data from residents of the households, and non-institutional
group quarters (dorm, rooming houses, shelters, etc.), but does not include homeless individuals
who do not use shelters or residents of institutional group quarters (jails and hospitals). This
survey is well-suited for this study because it contains detailed questionnaires about individuals’
illicit drug use including marijuana and tobacco consumption. State-level NSDUH data, for two-
year averages, are publicly available for the period from 2002 through 2015.8 These state
averages have been used by scholars in recent policy work examining the impact of state public
health regulations on tobacco use (Friedman 2015). Our data on adult marijuana and cigarette
consumption is generated from approximately 536,000 adult respondents (ages 18 and older) to
the NSDUH from 2002 to 2015.
We measure current (prior month) Marijuana Use using state-level data compiled from
the following NSDUH survey item:
“How many days did you use marijuana or hashish in the past 30 days?”
8 At present, SAMHSA does not permit individual-level restricted-use data to be made available to scholars examining the impacts of medical marijuana laws.

12
We set Marijuana Use equal to 1 if the respondent indicates a positive number of days of
marijuana use and 0 otherwise. As shown in Table 1, we find that 6.8 percent of NSDUH
respondents reported consuming marijuana or hashish on at least one day in the past month.
A comparable past-month state-level measure of Cigarette Use is generated from
responses to the following questionnaire item:
“How many days did you smoke cigarettes in the past 30 days?”
If the respondent reports a positive number of days smoking cigarettes during the prior 30 days,
we set Cigarette Use equal to 1 and set it equal to 0 otherwise. We find that 25.5 percent of
NSDUH respondents reported prior 30-day cigarette use over the sample period. The NSDUH
estimate of cigarette smoking is somewhat higher relative to other nationally representative
surveys, including the BRFSS and CPS-TUS (see below), but the confidence interval envelopes
the prevalence measures from these alternate data sources.9
While a key advantage of the NSDUH over other data sources is its inclusion of
information on both marijuana and cigarette use, there are some limitations. First, because
NSDUH data are only consistently available over the 2002 to 2015 period, early MML adopting
states in the Pacific region do not contribute to identifying variation (see Table 2). These states
disproportionately include MMLs with “collective cultivation” provisions that have been found
to generate important spillovers to recreational marijuana (Anderson and Rees 2014a,b). In
addition, state-aggregated measures do not permit an examination of heterogeneous treatment
effects by demographic characteristics of individuals. To address these limitations, we turn to
two alternate national datasets.
9 See state-level tobacco estimates and the confidence intervals for the 2014-2015 here: http://samhda.s3-us-gov-west-1.amazonaws.com/s3fs-public/field-uploads/2k15StateFiles/NSDUHsaePercents2015.pdf

13
3.2 BRFSS
The BRFSS is a nationally representative telephone survey conducted annually by the
Centers for Disease Control and Prevention (CDC) since 1984. While the BRFSS was
administered only via landline phones prior to 2011, beginning with the 2011 survey, the BRFSS
began adding cellular phones to their sample and weighted these respondents accordingly.
Respondents ages 18 and older are asked detailed questions about their health and health
behaviors, including cigarette consumption. Our analysis sample consists of approximately
seven million observations drawn from repeated cross-sections of the BRFSS from 1990 to 2015.
While the BRFSS do not contain information on adult marijuana use, these data do allow
us to measure Cigarette Use comparably to the NSDUH. To do this, we use survey responses
from two sequentially asked survey items:
“Have you smoked at least 100 cigarettes in your entire life?”
“Do you now smoke cigarettes everyday, some days, or not at all?”10
Following CDC guidelines (2009), we generate a dichotomous measure of current smoking
participation set equal to 1 if the respondent reported smoking at least 100 cigarettes in his or her
lifetime and smoking “everyday” or “some days” and equal to 0 if the respondent has not
smoked 100 cigarettes in his/her lifetime or does not currently smoke. A limitation of this
measure is that we cannot identify new current smokers because those who do not report
smoking at least 100 cigarettes in their lifetimes are not asked about current smoking. In the
weighted BRFSS sample, 20.8 percent of respondents report current tobacco use (see Table 1).
10From 1990 to 1995, this item read simply, “Do you smoke cigarettes now?”

14
3.3 CPS-TUS
The Current Population Survey Tobacco Use Supplements (CPS-TUS) are sponsored by
the National Cancer Institute and administered periodically as part of the Census Bureau’s CPS
since 1992. The CPS-TUS is based on a large nationally-representative sample containing
information on about 240,000 individuals within a given survey period; it provides a key source
of national, state, and sub-state level data regarding smoking and the use of other tobacco
products among adults aged 18 and older. Our analysis sample consists of approximately two
million adults ages 18 and older drawn from repeated cross-sections from 1992 to 2015.11
Smoking participation in the CPS-TUS is measured analogously to the BRFSS using
responses to the following survey items:
“Have you smoked at least 100 cigarettes in your entire life?”
“Do you now smoke cigarettes every day, some days, or not at all?”
Cigarette Use is set equal to 1 if respondents answered that they have smoked at least 100
cigarettes over their lifetime and either currently smoke every day or on somedays, and is set
equal to 0 otherwise. In our weighted CPS sample, 23.5 percent of respondents reported smoking
in the prior 30 days (see Table 1).
While the CPS-TUS have been used in a wide set of studies examining the effects of
tobacco control policies on adult smoking (Colman and Remler 2008; Liu 2010), offering large
samples and consistent information on smoking behaviors, and also permits measures of
smoking on the intensive margin (number of cigarettes consumed among everyday smokers), an
11 We use data from the following TUS fielded in July 2014, January 2015, and May 2015; in May 2010, August 2010 and January 2011; in May 2006, August 2006 and January 2007; in February, June and November 2003; in June 2001, November 2001 and February 2002; in September 1998, January 1999, and May 1999; in September 1995, January 1996, and May 1996; and in September 1992, January 1993, and May 1993. An abbreviated TUS was also conducted in January 2000 and May 2000.

15
important disadvantage is the staggered nature of the cross-sections. In addition, like the
BRFSS, the CPS surveys do not contain information on marijuana consumption.
4. METHODS
We begin by using state-level data from the NSDUH to estimate the first-stage effect of
MMLs on adult marijuana use. Because publicly available state-level NSDUH data are only
available in two-year averages, we estimate the following difference-in-differences model:
[Marijuana Usest + Marijuana Usest-1]/2 =
β0 + β1 [MMLst + MMLst-1]/2 + Φ’[Xst + Xst-1] / 2 + νs + ωt + εst (1)
Thus, for the NSDUH, each right hand side-variable is constructed as its state-specific two-year
average, and our estimate of β1 should not be contaminated by measurement error generated by
these two-year averages. In the above specification, Marijuana Usest measures marijuana use in
state s at survey wave t, MMLst is an indicator for whether state s had enacted an MML in year t,
and Xst is a vector of state-level time-varying controls. Included among these controls are state
economic trends (unemployment rate and per capita income), demographic characteristics (share
non-white, male, and college graduates), tobacco control policies (cigarette taxes, clean indoor
air laws), other marijuana policies (marijuana decriminalization laws and laws that legalize
marijuana use for recreational purposes), and alcohol policies (state beer tax and blood alcohol
content (BAC) 0.08 drunk driving laws). In addition, νs is a time-invariant state effect and ωt is a
state-invariant year effect. Equation (1) is estimated via ordinary least squares (OLS). An
analogous model is estimated for cigarette consumption using the NSDUH.
For analyses using the BRFSS and the CPS-TUS, for which we have individual-level
data, we estimate the following:

16
Cigarette Useist = β0 + β1 MMLst + Xst Φ + Zist ψ + νs + ωt + εist (2)
where Cigarette Useist measures prior 30-day cigarette use of individual i residing in state s in
year t and Zist is a vector of individual-level time-varying controls including age, gender,
race/ethnicity, marital status, and indicators for educational attainment. We also experimented
with including month-of-survey dummies as controls; with a similar pattern of results on our
estimated policy parameter. Our coefficient of interest, β1, is identified from state-specific
changes in MMLs, as noted in Table 2. During the NSDUH sample period (2002-2015), 15
states and the District of Columbia (DC) adopted MMLs. Over the sample for which we have
BRFSS and CPS-TUS data, 23 states and DC had enacted MMLs. We estimate equation (2) via
linear probability models; estimated marginal effects are similar across probit and logit models.
Obtaining an unbiased estimate of β1 requires that the common trends assumption of our
difference-in-differences model be satisfied. This may be a concern if (i) marijuana (or
cigarette) consumption was trending differently prior to the implementation of MMLs in
“treatment” versus “control” states, (ii) state-specific time-varying unobservables are correlated
with both the enactment of MMLs and cigarette smoking, and (iii) states implement MMLs in
response to risky health behaviors related to tobacco use.
We undertake several strategies to address this concern. First, as noted above, we control
for other substance use policies in the vector Xst, including beer taxes, cigarette taxes, clean
indoor air laws, and marijuana decriminalization and recreational legalization laws.12 Second,
we explicitly decompose the timing of the effect based on an event study framework that
controls for policy lags and leads. This specification allows us to assess whether marijuana use
12 In addition, we explore the robustness of our estimated MML effects to controls for per-capita state Master Settlement Agreement payments (see Jayawardhana et al. 2014 for a discussion of alternate indices). Our estimates remain robust to these controls, both in terms of magnitudes and significance.

17
(and cigarette use) was trending differently prior to the adoption of MMLs and thus examine the
robustness of estimated policy impacts to controls for MML leads. It also allows us to assess
potential lags in the policy response that may be indicated due to lags in the pricing response and
access to legal marijuana supply following the enactment of the MMLs.
In addition, we also explore the robustness of our findings to controls for state-specific
linear time trends and higher-order time trends. For instance, our model including state-specific
quadratic time trends is estimated as follows:
Cigarette Useist = β0 + β1 MMLst + Xst Φ + Zist ψ + νs + ωt + νs*t + νs*t2 + εist, (3)
where νs*t and νs*t2 reflect state-specific linear and quadratic time trends, respectively.
Finally, in supplementary analyses, we implement a synthetic control design approach,
following Abadie et al. (2010), to ensure that treatment and control states share common
pretreatment trends in cigarette smoking. The counterfactual synthetic control for each treatment
state is generated as a linear combination of donor states, where donor states include all states
that do not have MMLs enacted at any time between 1990 and 2015. The algorithm underlying
the synthetic control design, pioneered by Abadie et al. (2010), assigns a synthetically generated
weight to each donor state to minimize any pre-treatment differences in cigarette smoking and
state-level covariates between each treatment and the synthetic control.13 There are a few
important advantages to a synthetic approach. Expressly forcing MML counterfactuals to have
more similar pre-treatment trends may increase the probability of satisfying the common trends
assumption (Sabia et al. 2016). Moreover, because we construct a counterfactual to each MML
state, this approach more flexibly allows for heterogeneity in the impacts of MMLs across
13 We require pre-treatment cigarette use to be equivalent in each pre-treatment period and control for cigarette taxes and other marijuana policies. Alternate approaches, including requiring pre-treatment outcomes to be similar in every other year and controlling for additional state-specific covariates generated a similar pattern of results.

18
different states. Synthetic estimates are generated by regressing the difference in the tobacco
consumption rate between treatment and synthetic control states on a post-MML indicator and
generate standard errors following Donald and Lang (2007). Together, the approaches described
above should minimize the likelihood that our estimated policy impacts are contaminated by
endogenous policy adoption or state-specific time-varying unobservables correlated with both
MML adoption and tobacco cigarette use.14
Table 2 shows the effective dates of MMLs enacted since 1990, as well as information on
the date at which several provisions of MMLs were implemented. We also provide enactment
dates for provisions that allow for home collective cultivation of marijuana for multiple patients
(Anderson et al. 2013), the presence of at least one state-run dispensary (Pacula et al. 2015), use
of marijuana for non-specific pain (Sabia et al. 2017), and require registries of medical marijuana
patients (Wen et al. 2015; Sabia and Nguyen 2017).
5. RESULTS
Tables 3 through 8 below present our main findings. We focus on estimates of β1 for
ease of presentation; estimates on the coefficients of controls are presented in Online Appendix
Table 1. All regressions are weighted and standard errors are clustered at the state level to
account for arbitrary correlation in the error structure across individuals within states and over
time (Bertrand et al. 2004).
5.1 NSDUH Findings on Marijuana and Tobacco Use
14 In an additional robustness check available upon request, we find that estimated policy impacts are robust to controls for anti-marijuana legalization sentiment.

19
In Panel I of Table 3, we use NSDUH data to estimate equation (1). Column (1) shows a
parsimonious specification including only state and year fixed effects. We find that the
enactment of an MML leads to an 0.8 percentage-point increase in the rate of marijuana use.
Relative to the mean value of marijuana use, this represents an approximately 12 percent
increase. The inclusion of controls for socioeconomic and demographic factors (column 2), and
economic conditions in the state (column 3), and other marijuana, cigarette, and alcohol policies
(columns 4 and 5) has little impact on the magnitude of the estimated MML effect.
These findings do not appear to be explained by pre-existing trends. In Figure 1, we
show an event study analysis, presenting 95 percent confidence intervals (CIs) around estimates
of three years of leads up to MML adoptions, the year of the MML law change (year “0”), and
one, two and three years or more after enactment. Models that generate these CIs control for
only state and year fixed effects. The event study shows no evidence that marijuana use was
trending differently prior to the adoption of MMLs; lead effects are close to zero and statistically
insignificant. Furthermore, it is validating that any increases in marijuana use materialize only
after the adoption of the law, with the largest impacts occurring in the years following the
enactment of MMLs. This finding is consistent with evidence that MML-induced declines in the
street price of high grade marijuana (Anderson et al. 2013) and MML-permitted dispensary
openings (Pacula et al. 2015) often lag the enactment of state MMLs, resulting in a lagged
consumption effect.15
15 The access, availability and prices of marijuana will likely depend upon the risks associated with using, possessing, and cultivating or distributing marijuana, each of which is likely to occur with a lag (Pacula et al. 2015).

20
In Panel II of Table 3, we present estimated coefficients on leads and lags of MMLs in
two-way fixed effects models that include controls for the full set of observables.16 These
models confirm that MMLs induce a two to three percentage point increase in marijuana use
(Wen et al. 2015; Sabia and Nguyen 2017).17
Turning to tobacco cigarette smoking in Table 4, we find that MML-induced increases in
marijuana use may have substituted for cigarette smoking. Results in Panel I show that the
enactment of an MML leads to a statistically insignificant 0.3 percentage-point decline in prior
30-day cigarette use, representing about a one percent decline in the average rate of cigarette use.
However, this result masks an important lagged effect of MMLs on cigarette consumption. In
the years following the passage of an MML (see Figure 2 and Panel II of Table 4), there is
evidence that MMLs induce a significant decline in tobacco cigarette use. Estimated longer-run
effects of MMLs on cigarette smoking (based on fully-specified dynamic models in Panel II) are
closer to about 1.1 to 3.0 percentage points, consistent with important declines in smoking. The
event study analysis shows that this effect is not explained by differential smoking pre-trends.
In sum, results from the NSDUH indicate that MMLs have induced substitution toward
marijuana and away from tobacco cigarettes, which may yield important public health benefits.
Next, we turn to the BRFSS and CPS-TUS, which have the advantages of (i) allowing for greater
MML policy variation, (ii) permitting an examination of the intensive margin of tobacco use, and
16 It should be noted that coefficients in models including three years of leads and up to three or more years of lags are not identified from the same states. Alternate specifications based on such a “balanced panel” of states identifying all pre- and post-MML coefficients show that the effects of MMLs tend to occur with a lag, but with less evidence of jumps across post-treatment years. 17 These first-stage effects are important for gauging the credibility of spillover effects on other substances, including cigarette use and generally bound the smoking response in absolute magnitude. Because most adults are not affected by MMLs, the estimated reduced-form smoking response (an intent-to-treat or ITT response) is an average across two groups – those affected by the medicinal marijuana legislation and those who are not.

21
(iii) allowing an estimation of heterogeneous impacts of MMLs, each of which may inform the
recreational and medicinal mechanisms at work.
5.2 BRFSS and CPS-TUS Results
Panels I and II of Table 5 present estimates of equation (2), from the BRFSS and the
CPS-TUS respectively, for prior 30-day cigarette use. Consistent with results from the NSDUH,
we find consistent evidence that MMLs reduce tobacco cigarette smoking across both datasets,
with estimated marginal effects of 0.4 to 0.8 percentage points. It is validating that the magnitude
of the effect is stable with the addition of state-level economic and policy controls (columns 3-5),
consistent with the hypothesis that MML adoption is generally unrelated to these characteristics,
and similar across both datasets.18
Estimates from the BRFSS and the CPS-TUS translate into effect sizes of approximately
two to three percent relative to sample means. In principle, the MML-induced cigarette smoking
effects we observe at the extensive margin could reflect shifts on either the initiation or cessation
margin. However, given that the vast majority of ever smokers (84%) initiate tobacco use at age
18 or earlier and virtually no one initiates after age 21, our estimates likely reflects shifts on the
cessation margin.
The remaining panels of Table 5 show estimates of the effects of MMLs on other margins
of cigarette consumption. While imprecisely estimated, MMLs appear to reduce the probability
of being a daily smoker (Panel III) by about 1.2 to 2.3 percent relative to the sample mean. The
vast majority of current smokers (about 74%; Table 1) tend to be everyday smokers, and this
18 The confidence intervals overlap across both sets of estimates, and the point estimate for each dataset is contained in the confidence interval for the estimate based on the other dataset. Online Appendix Table 2 shows robustness of findings with controls for a smaller subset of controls (cigarette taxes and marijuana policies); the pattern of results is similar.

22
suggestive decline in everyday smoking could reflect a transition to non-smoking or non-daily
smoking.
Because measures of cigarettes smoked are not consistently available in all waves, we
turn to the CPS-TUS in Panels IV and V, to specifically assess whether MMLs affected cigarette
consumption at the intensive margin. Here we find stronger evidence that MMLs reduce the
intensity of smoking, as measured by the number of cigarettes consumed among everyday
smokers (Panel IV), rather than reduce days of smoking (Panel V). Specifically, we find that
MMLs reduce number of cigarettes consumed by about 0.3 to 0.4 cigarettes daily.19 This result
is consistent with descriptive evidence from the NSDUH that current co-users of both marijuana
and cigarettes smoke fewer cigarettes than current cigarette users only who had previously also
used marijuana.
The decline in smoking at the intensive margin may reflect the common mode through
which both cigarettes and marijuana are consumed, as MMLs cause some current cigarette users
to cut back on the number of cigarettes smoked as they raise their consumption of marijuana.
5.3 Sensitivity Checks
In Table 6, we examine the sensitivity of the above estimates to state-specific time-
varying characteristics that could be correlated with the enactment of MMLs and tobacco
consumption. First, we add controls for policy leads to address the concern that our estimated
policy impacts could have captured pre-treatment cigarette smoking trends. After controlling for
differential pre-treatment trends (up to 3 years and 5 years of policy leads in columns 1 and 2
respectively), the estimated association between MMLs and cigarette consumption actually
19 These are smokers in the CPS who are consistently asked the question about the number of cigarettes consumed.

23
increases slightly in absolute magnitude. MMLs are associated with about a one percentage-
point decline in past-month smoking for models based on the BRFSS (Panel I) and about a 0.6 to
0.9 percentage point decline in smoking for models based on the CPS-TUS (Panel II). Effects on
the number of cigarettes smoked among daily smokers (Panel III) remain virtually unchanged
when we control for the policy leads.
In columns 3 and 4, we further control for state-specific time-varying unobservables by
adding state-specific linear and quadratic time trends. These estimates should be interpreted with
caution given that the inclusion of parametric state-specific time trends will reduce identifying
variation available to estimate policy impacts, and may also be problematic if residual trends in
smoking do not strictly follow this parametric structure.20 Nevertheless, our main effects remain
robust. Across both the BRFSS and the CPS-TUS (Panel I and II respectively), these fully-
saturated models continue to indicate about a 0.7 to 0.9 percentage point decline in past-month
cigarette use. Effects at the intensive margin, however, while remaining negative, decrease in
magnitude and are less precisely estimated (Panel III, columns 3 and 4).
Next, to check whether our estimates are driven by differential pre-trends, we undertake a
synthetic control design following Abadie et al. (2010) to ensure that the treatment and control
states share common pre-treatment trends in cigarette smoking. Trends in tobacco cigarette use
in each MML state and its synthetic control are shown in Online Appendix Figures 1 through
24.21 These figures show common (often identical) tobacco cigarette consumption trends in the
pre-MML enactment period, after which a divergence in tobacco smoking occurs in the majority
20 The addition of state linear trends substantially reduces the identifying variation in the policy measure by almost 60%. In addition, Wolfers (2006) cautions against adding state-specific linear trends since such trends may confound both the state-specific time-varying unobservable as well as any dynamic effects of the policy itself. 21 Online Appendix Table 3 shows weights generated for donor states that comprise each MML state’s synthetic control.

24
of states. Table 7 presents the point estimates and inferential statistics based on Donald and Lang
(2007). Estimates of the effect of MMLs on past-month cigarette smoking are negative for
nearly all states, and in all cases but one (Montana) where the effects are statistically significant,
we find that MMLs are associated with a decline in smoking participation. While there is some
heterogeneity in the policy response across states, the effect magnitudes are centered around a
one to two percentage point decline, similar to the effect sizes discussed for prior specifications.
These findings suggest that the relationship between MMLs and cigarette use is not
contaminated by differential pre-trends.
5.4 Heterogeneity in Effects of MMLs
We explore heterogeneity in the effects of MMLs on cigarette use by age in Online
Appendix Table 4. This may be important given that MMLs have been found to have larger
effects on both younger adults under 30 (Anderson et al. 2013) and older adults over 50 (Sabia et
al. 2017), and use of marijuana by younger vs. older adults may differentially reflect use for
recreational vs. medicinal purposes. Comparing patterns across age groups, there is some
suggestive evidence of stronger effects among young adults ages 18 to 25, particularly for past
cigarette smoking at the extensive margin, which may reflect the relatively high prevalence of
marijuana use for this age group. Marijuana use for this age group is more likely to reflect
recreational (as opposed to medicinal) use,22 and the reduction in smoking likely reflects the
substitution from cigarettes to recreational marijuana use among these younger adults.23
22 About 64% of current marijuana users, ages 18-25, report being in excellent or very good health, compared to only 39% of older marijuana users (ages 50+) (NSDUH 2014). 23 Specifically, Sabia and Nguyen (2017) find that MMLs raise frequent marijuana use (defined as consumption on 20 or more of the last 30 days) by 10-20 percent, particularly for individuals under the age of 30.
25
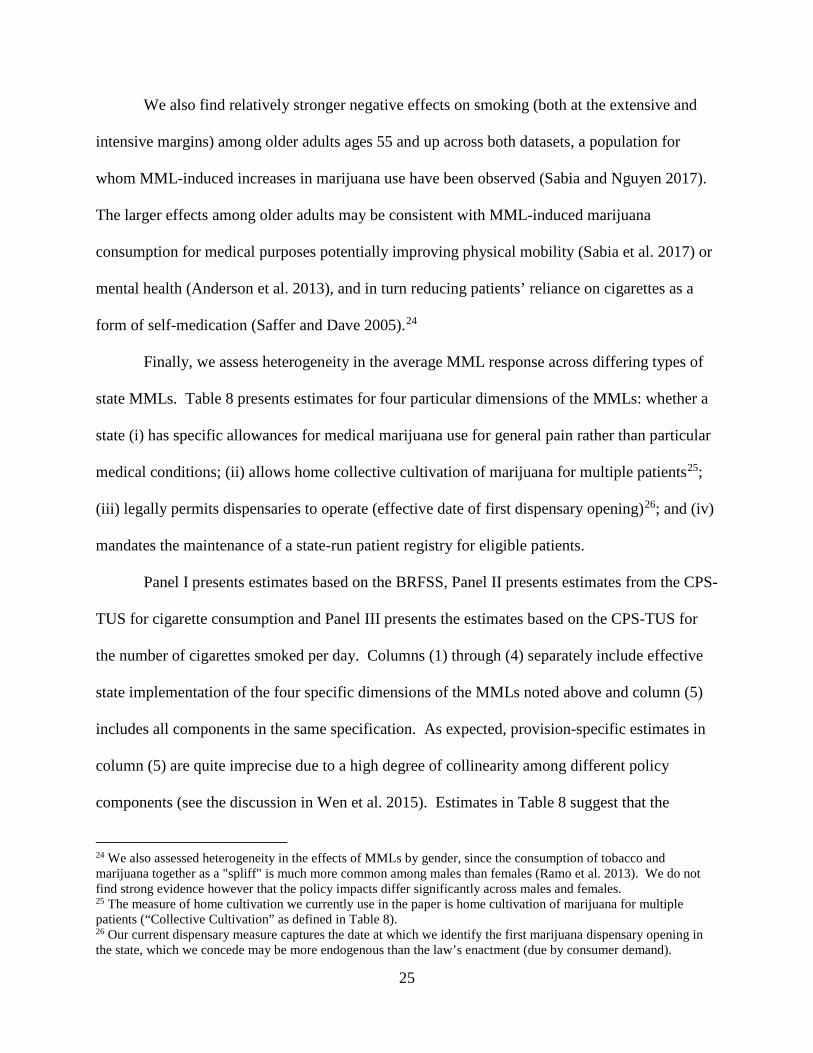
We also find relatively stronger negative effects on smoking (both at the extensive and
intensive margins) among older adults ages 55 and up across both datasets, a population for
whom MML-induced increases in marijuana use have been observed (Sabia and Nguyen 2017).
The larger effects among older adults may be consistent with MML-induced marijuana
consumption for medical purposes potentially improving physical mobility (Sabia et al. 2017) or
mental health (Anderson et al. 2013), and in turn reducing patients’ reliance on cigarettes as a
form of self-medication (Saffer and Dave 2005).24
Finally, we assess heterogeneity in the average MML response across differing types of
state MMLs. Table 8 presents estimates for four particular dimensions of the MMLs: whether a
state (i) has specific allowances for medical marijuana use for general pain rather than particular
medical conditions; (ii) allows home collective cultivation of marijuana for multiple patients25;
(iii) legally permits dispensaries to operate (effective date of first dispensary opening)26; and (iv)
mandates the maintenance of a state-run patient registry for eligible patients.
Panel I presents estimates based on the BRFSS, Panel II presents estimates from the CPS-
TUS for cigarette consumption and Panel III presents the estimates based on the CPS-TUS for
the number of cigarettes smoked per day. Columns (1) through (4) separately include effective
state implementation of the four specific dimensions of the MMLs noted above and column (5)
includes all components in the same specification. As expected, provision-specific estimates in
column (5) are quite imprecise due to a high degree of collinearity among different policy
components (see the discussion in Wen et al. 2015). Estimates in Table 8 suggest that the
24 We also assessed heterogeneity in the effects of MMLs by gender, since the consumption of tobacco and marijuana together as a "spliff" is much more common among males than females (Ramo et al. 2013). We do not find strong evidence however that the policy impacts differ significantly across males and females. 25 The measure of home cultivation we currently use in the paper is home cultivation of marijuana for multiple patients (“Collective Cultivation” as defined in Table 8). 26 Our current dispensary measure captures the date at which we identify the first marijuana dispensary opening in the state, which we concede may be more endogenous than the law’s enactment (due by consumer demand).

26
decline in tobacco consumption appears to persist across each type of MML, with no one specific
provision driving the result. This would suggest that both recreational and medicinal pathways
may be important drivers in the reduction in smoking.
6. CONCLUSIONS
With the proliferation of state laws allowing for medical marijuana use and several states
considering similar legislation, public health professionals and policymakers have expressed
concerns that these policies may have unintended spillovers that adversely affect health.27
Previous work has considered outcomes related to problematic alcohol use (Anderson and Rees
2011, 2013; Wen et al. 2015), illicit drug use (Wen et al. 2015), and body weight (Sabia et al.
2017), but this study is the first to examine the tobacco-related effects of MMLs.
First, using data from the NSDUH, we document that MMLs induce a 2 to 3 percentage-
point increase in marijuana use. Turning to cigarette smoking, data from all three datasets show
that the enactment of MMLs leads to a 1 to 1.5 percentage-point reduction in tobacco cigarette
smoking, consistent with the hypothesis that marijuana and tobacco cigarettes are substitutes.
Where we find negative effects on smoking, these are generally driven by both young adults (18
to 25) and older adults (55 and older), suggesting that there may be both recreational and
medicinal reasons for substitution into marijuana from cigarettes. We also find evidence that
MMLs are associated with a reduction in the number of cigarettes consumed per day among
current smokers, consistent with effects at the intensive margin as well as the extensive margin.
Among everyday smokers, MMLs are associated with a reduction of 0.3 to 0.4 cigarettes smoked
27 Twelve states (IN, IA, KY, MO, NE, NC, OK, SC, TN, TX, UT, WI) have pending legislation or amended ballot measures in 2017; WV passed legislation in 2017; and similar legislation failed in three states in 2017 (KS, MS, VA). See: http://medicalmarijuana.procon.org/view.resource.php?resourceID=002481

27
per day. Given that smoking is the most common mode to consume marijuana and tobacco, this
reduction in the intensity of smoking may indicate that some current smokers reduce the number
of cigarettes smoked as they raise marijuana consumption.
The potential health care cost savings from MML-induced reductions in cigarette
consumption are substantial. Xu et al. (2015) estimated annual health care costs related to
cigarette smoking of $170 billion, which translates to approximately $1,847 (deflated to 2014
dollars) in added health care costs each year per smoker. Our estimates suggest that MMLs
reduce smoking prevalence by 2.5 to 3.75 million, translating into tobacco-related healthcare
cost savings of about $4.6 to 6.9 billion per year, which represents a substantial public health
gain.28
Our study underscores the importance of quantifying and incorporating policy-driven
spillovers when attempting to evaluate the pros and cons of liberalized marijuana policy.
Though the average cigarette use response to MMLs is modest, it may still generate considerable
public health gains given the substantial mortality and morbidity costs imposed by tobacco use.
Our study adds to a growing body of evidence showing that the spillover effects of MMLs are
generally positive and health-promoting.
28 There are a number of assumptions underlying this estimate. First, the estimate from Xu et al. (2015) does not incorporate secondhand smoking costs, which represent important negative externality costs. Second, this estimate does not reflect the costs of reductions in smoking at the intensive margin. Finally, while there may be public health costs associated with increased marijuana use among some, particularly respiratory illness and (possibly) amotivation syndrome, there are also well-documented health benefits of marijuana use, as noted above.

28
References
Abadie, A., Diamond, A., & Hainmueller, J. (2010). Synthetic Control Methods for Comparative Case Studies: Estimating the Effect of California’s Tobacco Control Program. Journal of the American Statistical Association, 105(490), 493-505. Adams L, Faseur T, and Geuens M. (2011). The Influence of the Self-Regulatory Focus on the Effectiveness of Stop-Smoking Campaigns for Young Smokers. Journal of Consumer Affairs 45(2), 275-305.
Agrawal, A., Lynskey, M., Bucholz, K., Madden, P., & Heath, A. (2007). Correlates of cannabis initiation in a longitudinal sample of young women: The importance of peer influences. Preventive Medicine, 45, 31–34.
Agrawal, A., Madden, P., Bucholz, K., Heath, A., & Lynskey, M. (2008). Transitions to regular smoking and to nicotine dependence in women using cannabis. Drug and Alcohol Dependence, 95, 107–114.
Agrawal, A., Budney, A. J., & Lynskey, M. T. (2012). The cooccurring use and misuse of cannabis and tobacco: a review. Addiction, 107(7), 1221-1233.
American Medical Association. (2017). AMA Policy: Medical Marijuana. Available at: https://medicalmarijuana.procon.org/sourcefiles/AMA09policy.pdf
American Public Health Association (1995). Access to Therapeutic Marijuana/Cannabis. Available at: https://thecannabus.files.wordpress.com/2011/09/the-american-public-health-associations-endorsement-on-medical-marijuana.pdf
Anderson, D. M., & Rees, D. I. (2011). Medical marijuana laws, traffic fatalities, and alcohol consumption. IZA working paper no 6112. Available at: http://ftp.iza.org/dp6112.pdf
Anderson, D.M., Hansen, B., & Rees, D.I. (2013). Medical marijuana laws, traffic fatalities, and alcohol consumption. Journal of Law and Economics, 56(2), 333-369.
Anderson, D.M., Rees, D.I., & Sabia, J.J. (2014). Medical Marijuana Laws and Suicides by Gender and Age. American Journal of Public Health, 104(12), 2369-2376.
Anderson, D.M., & Rees, D.I., (2014a). The role of dispensaries: the devil is in the details. Journal of Policy Analysis and Management, 33(1), 235–240.
Anderson, D. M. & Rees, D. I. (2014b), The Legalization of Recreational Marijuana: How Likely Is the Worst-Case Scenario? Journal of Policy Analysis and Management, 33(1), 221–232.
Bambico, F. R., Katz, N., Debonnel, G., & Gobbi, G. (2007). Cannabinoids Elicit Antidepressant-like Behavior and Activate Serotonergic Neurons through the Medial Prefrontal Cortex. The Journal of Neuroscience, 27(43), 11700–11.

29
Beenstock, M., & Rahav, G. (2002). Testing Gateway Theory: Do cigarette prices affect illicit drug use? Journal of Health Economics, 21(4), 679–698.
Behan, D.F., Eriksen, M.P., Lin, Y. (2005). Economic Effects of Environmental Tobacco Smoke Society of Actuaries.
Behrendt, S., Wittchen, H., Höfler, M., Lieb, R., & Beesdo, K. (2009). Transitions from first substance use to substance use disorders in adolescence: Is early onset associated with a rapid escalation? Drug and Alcohol Dependence, 99, 68–78.
Bentler, P., Newcomb, M., & Zimmerman, M. (2002). Cigarette use and drug use progression: Growth trajectory and lagged effect hypotheses. In: Kandel D B, editor. Stages and pathways of drug involvement.Cambridge, England: Cambridge University Press, 223–253.
Blake, D R, P Robson, M Ho, R W Jubb, and C S McCabe. (2006). Preliminary Assessment of the Efficacy, Tolerability and Safety of a Cannabis-Based Medicine (Sativex) in the Treatment of Pain Caused by Rheumatoid Arthritis. Rheumatology 45 (1) (January): 50–2. doi:10.1093/rheumatology/kei183. http://www.ncbi.nlm.nih.gov/pubmed/16282192.
Bradford, A. C., & Bradford, W. D. (2016). Medical marijuana laws reduce prescription medication use in Medicare Part D. Health Affairs, 35(7), 1230-1236.
Bruderl, J., Ludwig, V. (2011). Does a Smoking Ban Reduce Smoking? Evidence from Germany. SchmollersJahrbuch: Zeitschrift Fur Wirtschafts- Und Sozialwissenschaften/Journal Of Applied Social Science Studies, 131(2), 41 9-429.
Callison, K., Kaestner, R. (2014). Do Higher Tobacco Taxes Reduce Adult Smoking? New Evidence of the Effect of Recent Cigarette Tax Increases on Adult Smoking. Economic Inquiry, 52(1), 155-172.
Cameron, L., & Williams, J. (2002). Cannabis, Alcohol, and Cigarettes: Substitutes or Complements? Economic Record, 77(236), 19-34.
Carpenter, C., Cook, P.J. (2008). Cigarette Taxes and Youth Smoking: New Evidence from National, State, and Local Youth Risk Behavior Surveys. Journal of Health Economics, 27(2), 287-299.
Caulkins, J.P., Kilmer, B., Kleiman M.A., MacCoun, R.J., Midgette, G., Olglesby, P., Pacula, R.L., & Reuter, P.H. (2015). Options and Issues Regarding Marijuana Legalization. https://www.rand.org/pubs/perspectives/PE149.html.
Cebula RJ, Foley M, Houmes R. (2014). “Empirical Analysis of the Impact of Cigarette Excise Taxes on Cigarette Consumption: Estimates from Recent State-Level Data.” Journal of Economics and Finance, 38(1), 164-180.

30
Centers for Disease Control and Prevention. (2009). State-specific secondhand smoke exposure and current cigarette smoking among adults―United States, 2008. MMWR Morb Mortal Wkly Rep 58:1232–1235.
Centers for Disease Control and Prevention. The Health Consequences of Smoking—50 Years of Progress: A Report of the Surgeon General. (2014). Surgeon General’s Report: Rockville, MD.
Cheng, Y.C., Rostron, B. L., Day, H. R., Stanton, C. A., Hull, L. C., Persoskie, A., … Borek, N. (2017). Patterns of Use of Smokeless Tobacco in US Adults, 2013-2014. American Journal of Public Health, 107(9), 1508–1514. https://doi.org/10.2105/AJPH.2017.303921 Choi, A. (2015). Three Essays in Health Economics (Doctoral Dissertation).
Chaloupka, F., Pacula, R., Farrelly, M., Johnston, L., O’Malley, P., & Bray, J. (1999). Do higher cigarette prices encourage youth to use marijuana? NBER working paper no 6939. Available at: http://www.nber.org/papers/w6939.pdf.
Chu, Y. W. L. (2014). The effects of medical marijuana laws on illegal marijuana use. Journal of Health Economics, 38, 43-61.
Clements, K., Lan, Y., & Zhao, X. (2010). The demand for marijuana, tobacco, and alcohol: inter-commodity interactions with uncertainty. Empirical Economics, 39, 203-239.
Colman, G. J., & Remler, D. K. (2008). Vertical equity consequences of very high cigarette tax increases: If the poor are the ones smoking, how could cigarette tax increases be progressive? Journal of Policy Analysis and Management, 376-400.
Crost, B., & Guerrero, S. (2012). The Effect of Alcohol Availability on Marijuana Use: Evidence from the Minimum Legal Drinking Age. Journal of Health Economics, 31(1), 112-121.
Delnevo, C. D., Giovenco, D. P., Steinberg, M. B., et al. Patterns of Electronic Cigarette Use Among Adults in the United States. Nicotine and Tobacco Research, 18(5), 715-719.
Demperio, S. (2013). Cigarette Taxes, Smoking Bans, and Smoking Behavior (Dissertation). University of Virginia, 161 pages; 3570854.
Doblin, R. E., & Kleinman, M. A. (1991). Marijuana as Antiemetic Medicine: A Survey of Oncologists' Experiences and Attitudes. Journal of Clinical Oncology, 9(7), 1314-1319.http://www.ncbi.nlm.nih.gov/pubmed/2045870
Donald, S. G., & Lang, K. (2007). Inference with Difference-in-Differences and Other Panel Data. Review of Economics and Statistics, 89(2), 221-233.
Bertrand, M, Duflo, E., & Mullainathan, S. (2004). How much should we trust difference in differences estimates? Quarterly Journal of Economics, 119(1), 249-275.

31
Elliott, Steve. 2009. “First Marijuana Dispensary To Open In Downtown Ypsilanti, Michigan.” Toke of the Town. Retrieve on 08/01/2016, from: http://www.tokeofthetown.com/2009/12/first_marijuana_dispensary_to_open_in_downtown_yps.php
Elliott, Steve. 2011. “First Medical Marijuana Dispensary Licensed In Michigan.” Toke of the Town. Retrieve on 08/01/2016, from: http://www.tokeofthetown.com/2011/06/first_medical_marijuana_dispensary_licensed_in_mic.php
Farrelly, M. C., Bray, J. W., Zarkin, G. A., & Wendling, B. W. (2001). The Joint Demand for Cigarettes and Marijuana: Evidence from the National Household Surveys on Drug Abuse. Journal of Health Economics, 20(1), 51-68.
Fiz, J., Durán, M., Capellà, D., Carbonell, J., & Farré, M. (2011). Cannabis Use in Patients with Fibromyalgia: Effect on Symptoms Relief and Health-Related Quality of Life. PloS One, 6(4), e18440.
Friedman, Abigail. (2015). How does electronic cigarette access affect adolescent smoking? Journal of Health Economics, 44, 300-308.
Gorman, Anna. (2016). Will Legal Marijuana Lead to More People Smoking Tobacco? NPR. Available at: https://www.npr.org/sections/health-shots/2016/11/18/502567273/will-legal-marijuana-lead-to-more-people-smoking-tobacco.
Hall, W., MacDonald, C., & Currow, D. (2005). Cannabinoids and Cancer: Causation, Remediation, and Palliation. The Lancet Oncology, 6(1), 35–42. http://www.ncbi.nlm.nih.gov/pubmed/15629274.
Hammersley, R., Leon, V. (2006). Patterns of cannabis use and positive and negative experiences of use amongst university students. Addiction Research & Theory, 14(2), 189–205.
Hansen, B., Sabia, J. J., & Rees, D. I. (2017). Have cigarette taxes lost their bite? New estimates of the relationship between cigarette taxes and youth smoking. American Journal of Health Economics, 3(1), 60-75.
Jayawardhana, Jayani, W. David Bradford, Walter Jones, Paul J. Nietert and Gerard Silvestri. 2014. “Master Settlement Agreement (MSA) Spending and Tobacco Control Efforts,” PLoS ONE 9(12): e114706. Doi.
Kasza, K. A., Ambrose, B. K., Conway, K. P., et al. (2017). Tobacco-Product Use by Adults and Youths in the United States in 2013 and 2014. New England Journal of Medicine, 376, 342-353.

32
Kim, J. H., Santaella-Tenorio, J., Mauro, C., Wrobel, J., Cerdà, M., Keyes, K. M., ... & Li, G. (2016). State medical marijuana laws and the prevalence of opioids detected among fatally injured drivers. American Journal of Public Health, 106(11), 2032-2037.
Lai, S., Lai, H., Page, J., McCoy, C. (2000) The association between cigarette smoking and drug abuse in the United States. Journal of Addictive Diseases, 19(4), 11–24.
Leatherdale, S., Hammond, D., Kaiserman, M., & Ahmed, R. (2007). Marijuana and tobacco use among young adults in Canada: Are they smoking what we think they are smoking? Cancer Causes & Control, 18(4), 391–397.
Liu, H., & Tan, W. (2009). The effect of anti-smoking media campaign on smoking behavior: the California experience. Annals of Economics and Finance, 10(1), 29-47.
Liu, F. (2010). Cutting through the smoke: separating the effect of price on smoking initiation, relapse and cessation. Applied Economics, 42(23), 2921-2939.
Marijuana Policy Project. (2015). State-by-State Medical Marijuana Laws. Available at: https://www.mpp.org/issues/medical-marijuana/state-by-state-medical-marijuana-laws/
Marijuana Policy Project. (2017). Legalization. Available at: https://www.mpp.org/issues/legalization/
Musty, Richard E., and Rita Rossi. 2001. “Effects of Smoked Cannabis and Oral ∆ 9 -Tetrahydrocannabinol on Nausea and Emesis After Cancer Chemotherapy : A Review of State Clinical Trials.” Journal of Cannabis Therapeutics, 1(1): 29–56. http://files.iowamedicalmarijuana.org/science/clincal/Musty-Rossi JCANT.pdf National Academies of Sciences, Engineering, and Medicine. (2017). The Health Effects of Cannabis and Cannabinoids: The Current State of Evidence and Recommendations for Research. Washington, DC: The National Academies Press. https://doi.org/10.17226/24625. Okoli, C., Richardson, C., Ratner, P., & Johnson, J. (2008). Adolescents’ self-defined tobacco use status, marijuana use, and tobacco dependence. Addictive Behaviors, 33(11), 1491–1499. Pacula, R.L. (1997). Economic Modelling of the Gateway Effect. Health Economics, 6(5), 521-524.
Pacula, R.L, Powell, D., Heaton, P., & Sevigny, E.L. (2015). Assessing the Effects of Medical Marijuana Laws on Marijuana Use: the Devil Is in the Details. Journal of Policy Analysis and Management, 34(1), 7-31.
Powell, D., Pacula, R. L., & Jacobson, M. (2015). Do Medical Marijuana Laws Reduce Addictions and Death Related to Pain Killers? National Bureau of Economic Research, Working Paper 21345.
33
Ramo, D., Delucchi, K., Hall, S., Liu, H., & Prochaska, J. (2013). Marijuana and Tobacco Co-Use in Young Adults: Patterns and Thoughts about Use. Journal of Studies on Alcohol and Drugs, 74(2), 301–310.
Ramo, D., Liu, H., & Prochaska, J. (2012). Tobacco and marijuana use among adolescents and young adults: A systematic review of their co-use. Clinical Psychology Review, 32(2), 105–121.
Radtke, T., Scholz, U., Keller, R., Knäuper, B., & Hornung, R. (2011). Smoking-Specific Compensatory Health Beliefs and the Readiness to Stop Smoking in Adolescents. British Journal of Health Psychology, 16, 610-625. doi:10.1348/2044-8287.002001
Richter, K., Ahluwalia, H., Mosier, M., Nazir, N., & Ahluwalia, J. (2002). A population-based study of cigarette smoking among illicit drug users in the United States. Addiction, 97(7), 861–869
Riggs, P.K., Vaida, F., Rossi, S.S, Sorkin, L.S., Gouaux, B., Grant, I., Ellis, R.J. (2012). A Pilot Study of the Effects of Cannabis on Appetite Hormones in HIV-Infected Adult Men. Brain Research, 1431(11), 46–52.
Ritter, E. (2010). One grower’s pains: pot profit elusive in Montana. NPR, June 10 Available at: http://www.npr.org/templates/story/story.php?storyId=127742176.
Rog, David J, Turo J Nurmikko, Tim Friede, and Carolyn A Young. 2005. “Randomized, Controlled Trial of Cannabis-Based Medicine in Central Pain in Multiple Sclerosis.” Neurology 65 (6) (September 27): 812–9. doi:10.1212/01.wnl.0000176753.45410.8b. http://www.ncbi.nlm.nih.gov/pubmed/16186518. Sabia, J. J., Swigert, J., & Young, T. (2017). The effect of medical marijuana laws on body weight. Health Economics, 26(1), 6-34.
Sabia, J.J. & T.T. Nguyen. (2017). The Effect of Medical Marijuana Laws on Labor Market Outcomes. Working Paper, University of New Hampshire.
Sabia, J. J., Burkhauser, R. V., & Hansen, B. (2016). When Good Measurement Goes Bad: New Evidence that New York State’s Minimum Wage Reduced Employment. Industrial and Labor Relations Review, 69(2), 312-319.
Saffer, H., & Dave, D. (2005). Mental Illness and the Demand for Alcohol, Cocaine, and Cigarettes. Economic Inquiry, 43(2), 229-246.
Saker, A. (2009) Oregon: Portland Will Soon Have Two Medical-Marijuana Smoking Lounges. The Oregonian, November 8 Available at: http://crrh.org/news/category/cannabis/anne-saker#sthash.ox2kvht8.dpuf
Sari, N. (2013). On Anti-smoking Regulations and Tobacco Consumption. Journal of Socio-Economics, 4360-67. doi:http://dx.doi.org.libproxy.sdsu.edu/10.1016/j.socec.2013.01.006

34
Schauer G. L., King B. A., Bunnell R. E., Promoff G., & McAfee T. A. (2016) Toking, vaping, and eating for health or fun: Marijuana use patterns in adults, U.S., 2014. American Journal of Preventive Medicine, 50(1): 1–8. Schwartz, D. (2011). Medical Marijuana superstore opens in Arizona. Reuters, June 1, Available at: http://www.reuters.com/article/us-marijuana-arizona-idUSTRE75108620110602 Schwartz, R. (2017). Legalize Marijuana without the Smoke. Canadian Medical Association Journal, 189(4): E137-E138. Singh, T., Kennedy, S. M., Sharapova, S. S., Schauer, G. L., & V. Rolle, I. (2016). Modes of ever marijuana use among adult tobacco users and non-tobacco users—Styles 2014. Journal of Substance Use, 21(6), 631-635. Soria-Gómez, E., Bellocchio, L., Reguero, L., Lepousez, G., Martin, C., Bendahmane, M., Ruehle, S. et al. (2014). The Endocannabinoid System Controls Food Intake via Olfactory Processes. Nature Neuroscience, 17(3) (March): 407–15.
Stucke, J. (2009) Marijuana dispensaries’ legal status remain in limbo. The Spokesman-Review, June 24, Available at: http://www.spokesman.com/stories/2009/jun/24/pot-establishing-medicinal-niche/
Tauchmann, H., Lenz, S., Requate, T., Schmidt, C.M. (2013). Tobacco and Alcohol: Complements or Substitutes? A Structural Model Approach to Insufficient Price Variation in Individual-Level Data. Empirical Economics, 45(1), 539-566.
Thun, M., Carter, B., Feskanich, D., Freedman, N., Prentice, R., Lopez, A., Hartge, P., & Gapstur, S. (2013). 50-year trends in smoking-related mortality in the United States. New England Journal of Medicine, 368(4), 351–364.
Thun, M., & Heath, C. Jr. (1997a). Changes in mortality from smoking in two American Cancer Society prospective studies since 1959. Preventive Medicine, 26(4), 422–426
Thun, M., Lally, C., Flannery, J., Calle E., Flanders, W., & Heath, C. Jr. (1997b).Cigarette smoking and changes in the histopathology of lung cancer. Journal of the National Cancer Institute, 89(21), 1580–1586.
Timberlake, D., Haberstick, B., Hopfer, C., Bricker, J., Sakai, J., Lessem. J., & Hewitt, J. (2007). Progression from marijuana use to daily smoking and nicotine dependence in a national sample of U.S.adolescents. Drug and Alcohol Dependence, 88, 272–281
U.S. Department of Health and Human Services. (2014). The Health Consequences of Smoking: 50 Years of Progress. A Report of the Surgeon General. Atlanta, GA: U.S. Department of Health and Human Services, Centers for Disease Control and Prevention, National Center for Chronic

35
Disease Prevention and Health Promotion, Office on Smoking and Health. Printed with corrections, January 2014.
US Department of Health and Human Services, (2006). “The Health Consequences of Involuntary Exposure to Tobacco Smoke: A Report of the Surgeon General.” Atlanta, GA: US Department of Health and Human Services, Centers for Disease Control and Prevention, Coordinating Center for Health Promotion, National Center for Chronic Disease Prevention and Health Promotion, Office on Smoking and Health, 709. Vinciguerra, V, T Moore, and E Brennan. (1988). “Inhalation Marijuana as an Antiemetic for Cancer Chemotherapy.” New York State Journal of Medicine, 88(10) (October): 525–527. http://www.ncbi.nlm.nih.gov/pubmed/3231372. Ware, M.A, Tongtong Wang, Stan Shapiro, Ann Robinson, Thierry Ducruet, Thao Huynh, Ann Gamsa, Gary J Bennett, and Jean-Paul Collet. (2010). “Smoked Cannabis for Chronic Neuropathic Pain: A Randomized Controlled Trial.” Canadian Medical Association Journal 182 (14) (October 5): E694–701. doi:10.1503/cmaj.091414. Wen, H., Hockenberry, J.M., & Cummings, J.R. (2015). The Effect of Medical Marijuana Laws on Adolescent and Adult use of Marijuana, Alcohol, and Other Substances. Journal of Health Economics, 42(3), 64-80.
Wolfers, J. (2006). Did Unilateral Divorce Laws Raise Divorce Rates? A Reconciliation and New Results. American Economic Review, 96(5), 1802-1820. Xu, X., Bishop, E.E., Kennedy, S.M., Simpson, S.A., & Pechacek, T.F. (2015). Annual Healthcare Spending Attributed to Cigarette Smoking: An Update. American Journal of Preventive Medicine, 48(3), 326-333. Yoruk, B. K., & Yoruk, C. (2011). The Impact of Minimum Legal Drinking Age Laws on Alcohol Consumption, Smoking, and Marijuana Use: Evidence from a Regression Discontinuity Design Using Exact Date of Birth. Journal of Health Economics, 30(4), 740–52.
Yoruk, B. K., & Yoruk, C. (2013). The Impact of Minimum Legal Drinking Age Laws on Alcohol Consumption, Smoking, and Marijuana Use Revisited. Journal of Health Economics, 32(2), 477-479.

36
Figure 1. Event-Study Analysis, Marijuana Consumption, NSDUH
Figure 2. Event-Study Analysis, Cigarette Consumption, NSDUH

37
Table 1. Means of Marijuana and Tobacco Use and Selected Controls, NSDUH, BRFSS, CPS-TUS
NSDUHa
(2002-2015) BRFSS
(1990-2015) CPS-TUS
(1992-2015) Marijuana and Tobacco Measures Marijuana Consumption 0.068 (0.020) . . Cigarette Consumption 0.255 (0.038) 0.208 (0.406) 0.235 (.424) Everyday Cigarette Consumption - 0.154(0.361) 0.156 (.363) Cigarettes Consumed Per Day - - 17.90 (9.29) Days of Smoking Per Month - - 27.90 (6.08) Selected Controls Medical Marijuana Law 0.250 (0.442) 0.178 (0.382) 0.180 (0.384) Cigarette Taxes (2015 $) 1.25 (0.892) 0.964 (0.813) 0.910 (0.760) Beer Taxes (2015 $) 0.299 (0.248) 0.312 (0.236) 0.311 (0.231) Marijuana Decriminalization Law 0.295 (0.454) 0.339 (0.473) 0.335 (0.472) Marijuana Legalization Law 0.011 (0.093) 0.005 (0.074) 0.005 (0.071) Zero Tolerance Law 1.00 (0.00) 0.819 (0.378) 0.849 (0.352) BAC08 Law 0.950 (0.197) 0.677 (0.461) 0.630 (0.469) Clean Indoor Air Law – Government Buildings 0.882 (0.320) 0.804 (0.397) 0.801 (0.399) Clean Indoor Air Law – Private Sector Buildings 0.692 (0.457) 0.600 (0.490) 0.585 (0.493) Clean Indoor Air Law -- Restaurants 0.750 (0.428) 0.665 (0.472) 0.659 (0.474) Clean Indoor Air Law – Shopping Center 0.573 (0.487) 0.403 (0.490) 0.372 (0.483) Clean Indoor Air Law – Public Schools 0.953 (0.207) 0.924 (0.265) 0.925 (0.363) Clean Indoor Air Law – Private Schools 0.756 (0.427) 0.704 (0.456) 0.698 (0.459) Per capita income (2015 $) 43,963.10
(6,777.31) 41,827.13 (6,725.96)
41,778.22 (6,573.62)
Unemployment Rate 6.36 (1.87) 6.16 (1.93) 5.81 (1.93) Male 0.492 (0.007) 0.483 (0.500) 0.476 (0.499) Education (HS/College) 0.294 (0.056) 0.286 (0.452) 0.318 (0.466) Black 0.125 (0.095) 0.109 (0.311) 0.113 (0.316) N 357* 6,970,691 2,044,577
*NSDUH data are available at the state-level in two-year averages, drawn from approximately 536,000 adult survey respondents over the sample period. Notes: Weighted means obtained using state-level data drawn from the National Survey for Drug Use and Health (2002 to 2013), individual-level data drawn from the Behavioral Risk Factor Surveillance System (1990 to 2015), and the Current Population Survey Tobacco Use Supplements (1992 to 2015).

38
Table 2. Effective Dates of Medical Marijuana Laws
State MML MML Provisions
Collective cultivation Dispensary
Non-specific pain Registry
(1) (2) (3) (4) (5) Alaska 03/1999 n/a n/a 03/1999 03/1999 Arizona 04/2011 04/2011 12/2012 04/2011 04/2011 Arkansas 11/2016 n/a n/a 11/2016 11/2016 California 11/1996 11/1996 11/1996 11/1996 n/a Colorado 06/2001 06/2001 07/2005 06/2001 06/2001 Connecticut 05/2012 n/a 08/2014 n/a 05/2012 Delaware 07/2011 n/a 06/2015 07/2011 07/2011 Washington, D.C. 07/2010 n/a 07/2013 n/a 07/2010 Florida 01/2017 n/a n/a n/a 01/2017 Hawaii 12/2000 n/a n/a 12/2000 12/2000 Illinois 01/2014 n/a 11/2015 n/a 01/2014 Maine 12/1999 n/a 04/2011 n/a 12/2009 Maryland 06/2014 n/a n/a 06/2014 06/2014 Massachusetts 01/2013 n/a 06/2015 n/a 01/2013 Michigan 12/2008 12/2008 12/2009 12/2008 n/a Minnesota 05/2014 n/a 07/2015 n/a 05/2014 Montana 11/2004 11/2004 04/2009 11/2004 n/a Nevada 10/2001 10/2001 08/2015 10/2001 10/2001 New Hampshire 07/2013 n/a 04/2016 07/2013 07/2013 New Jersey 10/2010 n/a 12/2012 10/2010 10/2010 New Mexico 07/2007 n/a 06/2009 n/a 07/2007 New York 07/2014 n/a 01/2016 n/a 07/2014 North Dakota 12/2016 n/a n/a 12/2016 12/2016 Oregon 12/1998 12/1998 11/2009 12/1998 01/2007 Ohio 08/2016 n/a n/a 08/2016 08/2016 Pennsylvania 05/2016 n/a n/a 05/2016 05/2016 Rhode Island 01/2006 01/2006 04/2013 01/2006 01/2006 Vermont 07/2004 n/a 06/2013 07/2007 07/2004 Washington 11/1998 07/2011 04/2009 11/1998 n/a Notes: Dates of effective MMLs are updated using Table 1 and Appendix Table 2A of Anderson et al. (2013) and Table 1 on p. 69 of Wen et al. (2015) using Elliott (2009, 2011); Marijuana Policy Project (2015); Ritter (2010); Saker (2009); Schwartz (2011) and Stucke (2009).
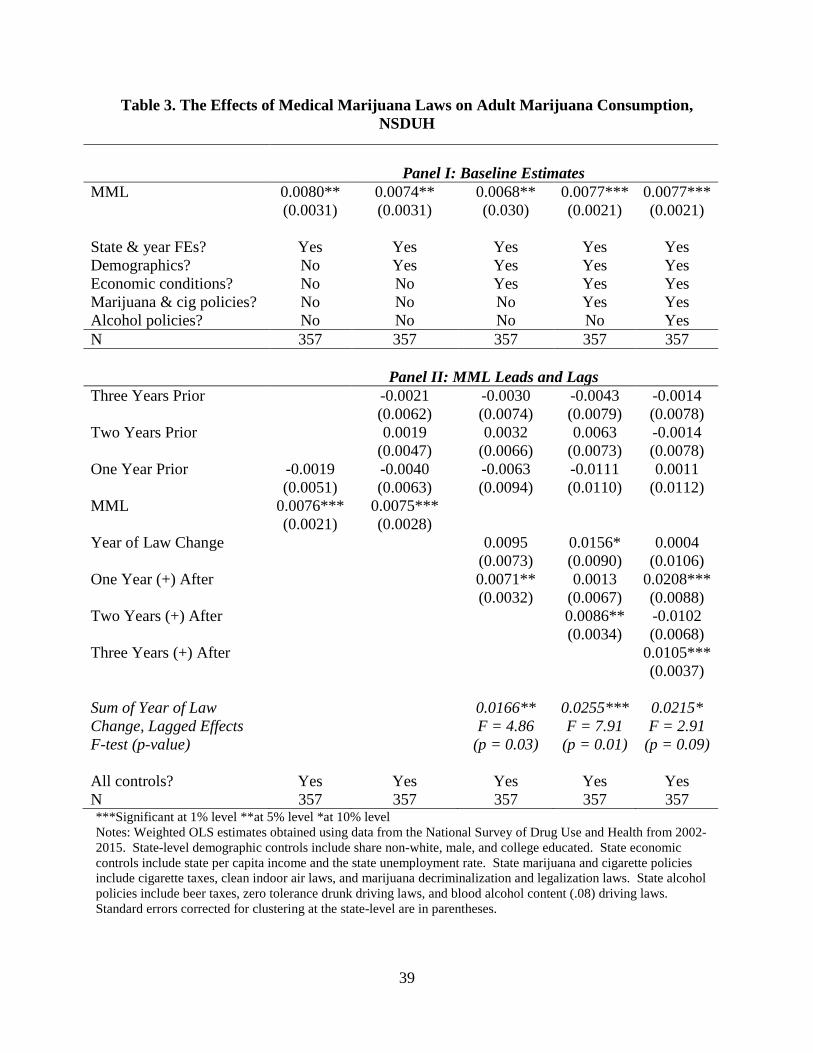
39
Table 3. The Effects of Medical Marijuana Laws on Adult Marijuana Consumption, NSDUH
Panel I: Baseline Estimates MML 0.0080**
(0.0031) 0.0074** (0.0031)
0.0068** (0.030)
0.0077*** (0.0021)
0.0077*** (0.0021)
State & year FEs? Yes Yes Yes Yes Yes Demographics? No Yes Yes Yes Yes Economic conditions? No No Yes Yes Yes Marijuana & cig policies? No No No Yes Yes Alcohol policies? No No No No Yes N 357 357 357 357 357
Panel II: MML Leads and Lags Three Years Prior -0.0021
(0.0062) -0.0030 (0.0074)
-0.0043 (0.0079)
-0.0014 (0.0078)
Two Years Prior 0.0019 (0.0047)
0.0032 (0.0066)
0.0063 (0.0073)
-0.0014 (0.0078)
One Year Prior -0.0019 (0.0051)
-0.0040 (0.0063)
-0.0063 (0.0094)
-0.0111 (0.0110)
0.0011 (0.0112)
MML 0.0076*** (0.0021)
0.0075*** (0.0028)
Year of Law Change 0.0095 (0.0073)
0.0156* (0.0090)
0.0004 (0.0106)
One Year (+) After 0.0071** (0.0032)
0.0013 (0.0067)
0.0208*** (0.0088)
Two Years (+) After
0.0086** (0.0034)
-0.0102 (0.0068)
Three Years (+) After 0.0105*** (0.0037)
Sum of Year of Law Change, Lagged Effects F-test (p-value)
0.0166** F = 4.86
(p = 0.03)
0.0255*** F = 7.91
(p = 0.01)
0.0215* F = 2.91
(p = 0.09) All controls? Yes Yes Yes Yes Yes N 357 357 357 357 357 ***Significant at 1% level **at 5% level *at 10% level Notes: Weighted OLS estimates obtained using data from the National Survey of Drug Use and Health from 2002-2015. State-level demographic controls include share non-white, male, and college educated. State economic controls include state per capita income and the state unemployment rate. State marijuana and cigarette policies include cigarette taxes, clean indoor air laws, and marijuana decriminalization and legalization laws. State alcohol policies include beer taxes, zero tolerance drunk driving laws, and blood alcohol content (.08) driving laws. Standard errors corrected for clustering at the state-level are in parentheses.
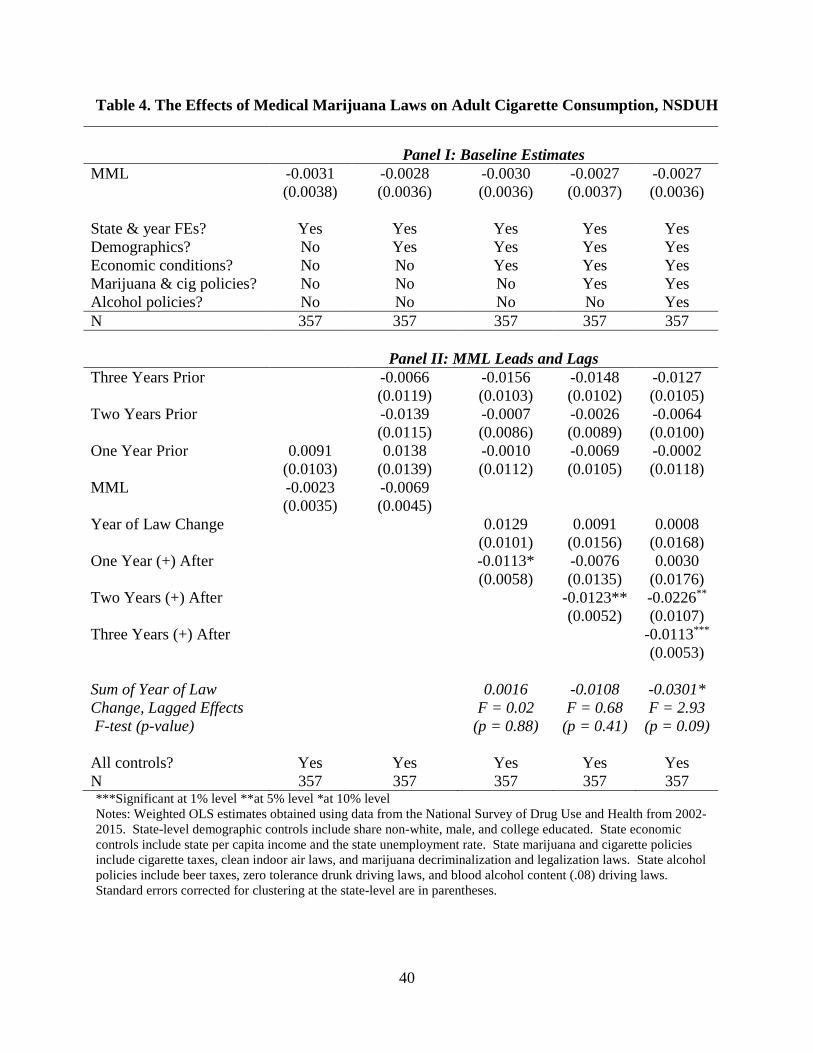
40
Table 4. The Effects of Medical Marijuana Laws on Adult Cigarette Consumption, NSDUH
Panel I: Baseline Estimates
MML -0.0031 (0.0038)
-0.0028 (0.0036)
-0.0030 (0.0036)
-0.0027 (0.0037)
-0.0027 (0.0036)
State & year FEs? Yes Yes Yes Yes Yes Demographics? No Yes Yes Yes Yes Economic conditions? No No Yes Yes Yes Marijuana & cig policies? No No No Yes Yes Alcohol policies? No No No No Yes N 357 357 357 357 357
Panel II: MML Leads and Lags Three Years Prior -0.0066
(0.0119) -0.0156 (0.0103)
-0.0148 (0.0102)
-0.0127 (0.0105)
Two Years Prior -0.0139 (0.0115)
-0.0007 (0.0086)
-0.0026 (0.0089)
-0.0064 (0.0100)
One Year Prior 0.0091 (0.0103)
0.0138 (0.0139)
-0.0010 (0.0112)
-0.0069 (0.0105)
-0.0002 (0.0118)
MML -0.0023 (0.0035)
-0.0069 (0.0045)
Year of Law Change 0.0129 (0.0101)
0.0091 (0.0156)
0.0008 (0.0168)
One Year (+) After -0.0113* (0.0058)
-0.0076 (0.0135)
0.0030 (0.0176)
Two Years (+) After
-0.0123** (0.0052)
-0.0226** (0.0107)
Three Years (+) After -0.0113*** (0.0053)
Sum of Year of Law Change, Lagged Effects F-test (p-value)
0.0016 F = 0.02
(p = 0.88)
-0.0108 F = 0.68
(p = 0.41)
-0.0301* F = 2.93
(p = 0.09) All controls? Yes Yes Yes Yes Yes N 357 357 357 357 357 ***Significant at 1% level **at 5% level *at 10% level Notes: Weighted OLS estimates obtained using data from the National Survey of Drug Use and Health from 2002-2015. State-level demographic controls include share non-white, male, and college educated. State economic controls include state per capita income and the state unemployment rate. State marijuana and cigarette policies include cigarette taxes, clean indoor air laws, and marijuana decriminalization and legalization laws. State alcohol policies include beer taxes, zero tolerance drunk driving laws, and blood alcohol content (.08) driving laws. Standard errors corrected for clustering at the state-level are in parentheses.

41
Table 5. The Effect of Medical Marijuana Laws on Adult Cigarette Consumption, BRFSS and CPS-TUS
Panel I: BRFSS, Any Cigarette Use
MML -0.0084*** -0.0075*** -0.0072*** -0.0064*** -0.0059*** (0.0026) (0.0020) (0.0021) (0.0022) (0.0022) N 6,970,691 6,970,691 6,970,691 6,970,691 6,970,691 Panel II: CPS-TUS, Any Cigarette Use
MML -0.0066*** -0.0040** -0.0037** -0.0037** -0.0039** (0.0020) (0.00155) (0.0017) (0.0017) (0.0017) N 2,044,577 2,044,577 2,044,577 2,044,577 2,044,577 Panel III: Everyday Smoking, BRFSS
MML -0.0027 -0.0035 -0.0025 -0.0021 -0.0019 (0.0024) (0.0022) (0.0022) (0.0022) (0.0022) N 6,109,297 6,109,297 6,109,297 6,109,297 6,109,297 Panel IV: Cigarettes Per Day, CPS-TUS
MML -0.425*** -0.367*** -0.363*** -0.300*** -0.303*** (0.104) (0.0846) (0.0788) (0.0903) (0.0901) N 235,159 235,159 235,159 235,159 235,159 Panel V: Days of Smoking Per Month, CPS-TUS
MML -0.158 -0.122 -0.120 -0.147* -0.142
(0.102) (0.0926) (0.0920) (0.0855) (0.0872)
N 376,761 376,761 376,761 376,761 376,761 State & year FEs? Yes Yes Yes Yes Yes Demographics? No Yes Yes Yes Yes Economic conditions? No No Yes Yes Yes Marijuana & cig policies? No No No Yes Yes Alcohol policies? No No No No Yes
***Significant at 1% level **at 5% level *at 10% level Notes: All estimates are weighted. Demographic controls include gender, age, educational attainment, race/ethnicity, marital status, and state-level share non-white and college educated. State economic controls include state per capita income and the state unemployment rate. State marijuana and cigarette policies include cigarette taxes, clean indoor air laws, and marijuana decriminalization and legalization laws. State alcohol policies include beer taxes, zero tolerance drunk driving laws, and blood alcohol content (.08) driving laws. Standard errors corrected for clustering at the state-level are in parentheses. All regressions include state fixed effects and year fixed effects.

42
Table 6. Sensitivity of Estimates to Controls for Policy Leads and State-Specific Time Trends
Added Controls
for 3 Years of Policy Leads
Added Controls for 5 Years of Policy Leads
Column (2) + State Linear
Trend
Column (2) + State Quadratic
Trend (1) (2) (3) (4)
Panel I: BRFSS, Any Smoking
MML -0.0098*** (0.0023)
-0.0114*** (0.0027)
-0.00605** (0.0025)
-0.00673** (0.0029)
N 6,970,691 6,970,691 6,970,691 6,970,691
Panel II: CPS-TUS, Any Smoking
MML -0.0057** -0.0085*** -0.0068*** -0.0085*** (0.0022) (0.0021) (0.0024) (0.0026) N 2,044,577 2,044,577 2,044,577 2,044,577
Panel III: CPS-TUS, Cigarettes Per Day
MML -0.3922*** -0.3531** -0.0744 -0.1340 (0.1148) (0.1357) (0.1954) (0.1882) N 235,159 235,159 235,159 235,159 ***Significant at 1% level **at 5% level *at 10% level Notes: All estimates are weighted. Demographic controls include gender, age, educational attainment, race/ethnicity, marital status, and state-level share non-white and college educated. State economic controls include state per capita income and the state unemployment rate. State marijuana and cigarette policies include cigarette taxes, clean indoor air laws, and marijuana decriminalization and legalization laws. State alcohol policies include beer taxes, zero tolerance drunk driving laws, and blood alcohol content (.08) driving laws. Standard errors corrected for clustering at the state-level are in parentheses. All regressions include state fixed effects and year fixed effects.

43
Table 7. Synthetic Control Estimates of the Effect of MMLs on Cigarette Smoking Alaska Arizona California Colorado MML -0.0101** -0.0151** -0.0058 -0.0299*** (0.0047) (0.0064) (0.0047) (0.0040)
N 25 26 26 26 Connecticut Delaware D.C. Hawaii MML -0.0039
(0.0063) -0.0071 (0.0077)
0.0052 (0.0075)
-0.0005 (0.0044)
N 26 26 25 26 Illinois Maine Maryland Massachusetts MML -0.0106*
(0.0058) -0.0087* (0.0045)
-0.0034 (0.0064)
-0.0040 (0.0057)
N 26 26 26 26 Michigan Minnesota Montana Nevada MML -0.0171
(0.0112) 0.0062
(0.0100) 0.0142*** (0.0039)
-0.0551*** (0.0079)
N 26 26 26 24 New Hampshire New Jersey New Mexico New York
MML -0.0073 (0.0089)
-0.0075* (0.0043)
0.0013 (0.0047)
-0.0066 (0.0092)
N 26 25 26 26 Oregon Rhone Island Vermont Washington MML -0.0041
(0.0037) -0.0131***
(0.0035) -0.0115***
(0.0026) -0.0200***
(0.0042) N 26 25 26 26 ***Significant at 1% level **at 5% level *at 10% level Notes: Estimates generated by regressing the difference in the treatment and synthetic control state on an indicator for an MML Standard errors generated following Donald and Lang (2007). Donor states include those states that did not implement an MML between 1990 and 2015.

44
Table 8. Exploring Heterogeneity in Effects of Tobacco Use by Different Types of Medical Marijuana Laws
Panel I: Cigarette Consumption, BRFSS (1) (2) (3) (4) (5)
MML-Pain -0.0045* -0.0046 (0.0025) (0.0051) MML-Collective Cultivation
-0.0028 0.0015 (0.0027) (0.0053)
MML-Dispensaries
-0.0012 0.0019 (0.0023) (0.0023)
MML-Registry -0.0061** -0.0047 (0.0024) (0.0030) N 6,970,691 6,970,691 6,970,691 6,970,691 6,970,691
Panel II: Cigarette Consumption, CPS-TUS
MML-Pain -0.0055** -0.0027 (0.0018) (0.0031) MML-Collective Cultivation
-0.0067*** -0.0046 (0.0024) (0.0026)
MML-Dispensaries -0.0035* 0.00049 (0.0018) (0.0026)
MML-Registry -0.0013 0.0006 (0.0024) (0.0025) N 2,044,577 2,044,577 2,044,577 2,044,577 2,044,577 Panel III: Cigarettes Per Day, CPS-TUS MML-Pain -0.3042*** -0.2433 (0.0904) (0.2370) MML-Collective Cultivation
-0.3168*** (0.0932)
-0.0708 (0.2880)
MML-Dispensaries
-0.2261** (0.0998)
-0.0349 (0.0927)
MML-Registry -0.1254 0.0179 (0.1440) (0.1387) N 235,159 235,159 235,159 235,159 235,159
***Significant at 1% level **at 5% level *at 10% level Notes: Weighted difference-in-difference estimates obtained from the Behavioral Risk Factor Surveillance Survey and the Current Population Survey Tobacco Use Supplements. The full period includes the years 1990 through 2015. State-specific time-varying controls include beer taxes, cigarette taxes, clean indoor air laws, zero tolerance laws, blood alcohol content (.08) driving laws, marijuana decriminalization and legalization laws, state per capita income, the unemployment rate, share of non-white population, and share of population graduating from college. Demographic controls include age, educational attainment, race/ethnicity, and marital status. All regressions include state fixed effects and year fixed effects.

45
Appendix Figures 1-6. Synthetic Control Analysis of the Effect of MML on Cigarette Smoking, BRFSS
Alaska (1991-2015) Notes: Donor states include those states that did not implement an MML between 1990 and 2015. Wyoming, Arkansas and Kansas excluded from donor states due to missing years in BRFSS.

46
Online Appendix Figures 7-12. Synthetic Control Analysis of the Effect of MML on Cigarette Smoking, BRFSS
Notes: Donor states include those states that did not implement an MML between 1990 and 2015. Wyoming, Arkansas and Kansas excluded from donor states due to missing years in BRFSS.

47
Online Appendix Figures 13-18. Synthetic Control Analysis of the Effect of MML on Cigarette Smoking, BRFSS
New Jersey (1991-2015), Nevada (1992-2015) Note: Donor states include those states that did not implement an MML between 1990 and 2015. Wyoming, Arkansas and Kansas excluded from donor states due to missing years in BRFSS.

48
Online Appendix Figures 19-24. Synthetic Control Analysis of the Effect of MML on Cigarette Smoking, BRFSS
Notes: Donor states include those states that did not implement an MML between 1990 and 2015. Wyoming, Arkansas and Kansas excluded from donor states due to missing years in BRFSS.

49
Appendix Table 1. Coefficients on Control Variables
***Significant at 1% level **at 5% level *at 10% level Notes: Weighted OLS estimates obtained using data from the National Survey of Drug Use and Health from 2002-2015. State-level demographic controls include share non-white, male, and college educated. State economic
NSDUH BRFSS CPS-TUS
Marijuana Use Cigarette Use Cigarette Use Cigarette Use Medical marijuana law 0.00770*** -0.00266 -0.0059*** -0.0039** (MML) (0.00213) (0.00373) (0.0022) (0.0017) Recreational marijuana 0.04104*** -0.01725* 0.0015 -0.0023 legalization law (RMLL) (0.01128) (0.00935) (0.0026) (0.0043) Marijuana decriminalization 0.01228*** -0.00295 -0.0033 -0.0011 law (MDL) (0.00366) (0.00584) (0.0048) (0.0038) Non-Whitea -0.05757 -0.20322 -0.198*** -0.176*** (0.07813) (0.12233) (0.0482) (0.0330) College Grada 0.04819 -0.06663 -0.0874** -0.139*** (0.05350) (0.09981) (0.0356) (0.0352) Malea -0.51006 2.54407** 0.0440*** 0.0483*** (0.85490) (1.17877) (0.0038) (0.0029) Clean indoor air (CIA) Law: 0.00241 0.00596 0.0064* -0.0002 Government building (0.00280) (0.00387) (0.0038) (0.0021) CIA Law: private sector 0.00271 0.00318 0.0020 0.0066*** buildings (0.00238) (0.00411) (0.0039) (0.0023) CIA Law: restaurants -0.00247 0.00440 -0.0010 0.0000 (0.00246) (0.00473) (0.0037) (0.0024) CIA Law: shopping centers -0.00101 -0.00778** 0.0008 -0.0018 (0.00184) (0.00344) (0.0038) (0.0015) CIA Law: public schools -0.00014 0.01116 0.0124*** 0.00151 (0.00318) (0.00722) (0.0034) (0.0025) CIA Law: private schools 0.00216 0.00140 -0.0056 -0.0011 (0.00205) (0.00338) (0.00400) (0.0028) Log Per Capita Income -0.04336* 0.00177 0.0338* 0.0343 (2015$) (0.02394) (0.04156) (0.0193) (0.0390) Log Unemployment Rate -0.00360 0.00588 -0.0050 0.0014 (0.00709) (0.00866) (0.0042) (0.0149) Log Beer Tax (2015$) -0.00062 -0.00845 0.0004 -0.0019 (0.00587) (0.00536) (0.0033) (0.0022) Log Cigarette Tax (2015$) -0.00218 -0.00427* -0.0020 -0.0033*** (0.00165) (0.00215) (0.0012) (0.0011) BAC08 Law -0.00033 0.00033 0.0040* -0.0012 (0.00237) (0.00536) (0.0021) (0.0018) Zero Tolerance Drunk -- -- -0.0018 0.0001 Driving Law (0.0030) (0.0023) N 357 357 6,970,691 2,044,577

50
controls include state per capita income and the state unemployment rate. State marijuana and cigarette policies include cigarette taxes, clean indoor air laws, and marijuana decriminalization and legalization laws. State alcohol policies include beer taxes, zero tolerance drunk driving laws, and blood alcohol content (.08) driving laws. Standard errors corrected for clustering at the state-level are in parentheses.
aThese variables are measured at the state-level for the NSDUH and range from 0 to 100; these variables are measured at the individual-level for the BRFSS and CPS-TUS and take on the values of 0 or 1.
Appendix Table 2. Estimated Effect of MMLs on Marijuana and Cigarette Use with Limited Controls
***Significant at 1% level **at 5% level *at 10% level
All models include controls for state fixed effects, year fixed effects, marijuana legalization and decriminalization laws, and cigarette taxes.
NSDUH BRFSS CPS-TUS
Marijuana Use
Cigarette Use
Cigarette Use Cigarette Use
MML 0.00754*** -0.00269 -0.0078*** -0.0058*** (0.00214) (0.00357) (0.0025) (0.0018) N 357 357 6,970,691 2,044,577

51
Appendix Table 3. Synthetic Weights on Cigarette Use, BRFSS
MML States AK AZ CA CO CT DE DC HI IL ME MD MA MI Donor States Alabama - - - - - - .466 - - - - - - Florida - .111 - - - - - - - .020 .289 .166 - Georgia - - - - - - - - - - - - - Idaho - - - - - - - - - - - - - Indiana - - - - - - - - .034 - - - - Iowa - .229 - - - - - - - - - - - Kentucky .296 - - - - - - - - - - - .176 Louisiana - - - - - - - .053 - - - - .103 Mississippi - - - .229 - - - - - - - - - Missouri - - - - - - - - - - - - - Nebraska - .027 - - - - .037 - - .238 .118 - .028 North Carolina .574 - - - - .315 - - .162 .055 - .063 .297 North Dakota - - - - - - - - - - - - - Ohio - - - - - - - .024 - - .036 - - Oklahoma - - .151 .203 - - - - - - - - - South Carolina .130 - - - - - - - - .121 - .075 .020 South Dakota - - - .043 .089 .169 .146 - - - .139 - .095 Tennessee - .256 - - - .135 - .046 - .321 - .099 .02 Texas - - - - .217 - - - .396 .003 .085 .058 - Utah - .246 .604 .094 .290 - .330 .468 - - .215 .355 - Virginia - .132 - .430 - .278 - - - - - - - West Virginia - - - - - - - - - - - - - Wisconsin - - .245 - .403 .104 .021 .409 .408 .242 .119 .204 .261

52
Appendix Table 3, Continued
MML States MN MO NV NH NJ NM NY OR RI VT WA Donor States Alabama - - - - - .036 - - - - - Florida .324 .126 - .203 .239 - .132 - .414 - - Georgia - - - - - .363 - - - - .025 Idaho - - - .206 - - - .354 - - - Indiana - - - - - - - .030 - - - Iowa - .229 - .197 - - - - - .209 - Kentucky - - .803 - - - - - - - - Louisiana - .030 - - .057 - - - - - - Mississippi - .091 - - - - - - - - - Missouri - - - - - - - - - - .247 Nebraska - - - - - - - - .071 - - North Carolina - - - - - - - - .174 - - North Dakota - - - - - .364 - .080 - .124 - Ohio - - - .100 .150 .152 - .264 - - - Oklahoma .138 - .197 - - - - - - - - South Carolina - - - - - - - - - - - South Dakota - .035 - - - - .071 - .007 - .233 Tennessee .026 - - - - - - - - - - Texas .034 - - - - - .546 .147 .178 - - Utah .247 .298 - .018 .327 .084 .056 .125 .002 .106 .150 Virginia - .034 - - .017 - - - - .325 - West Virginia - .114 - - - - - - - - - Wisconsin .231 .042 - .277 .210 - .196 - .171 .229 .318
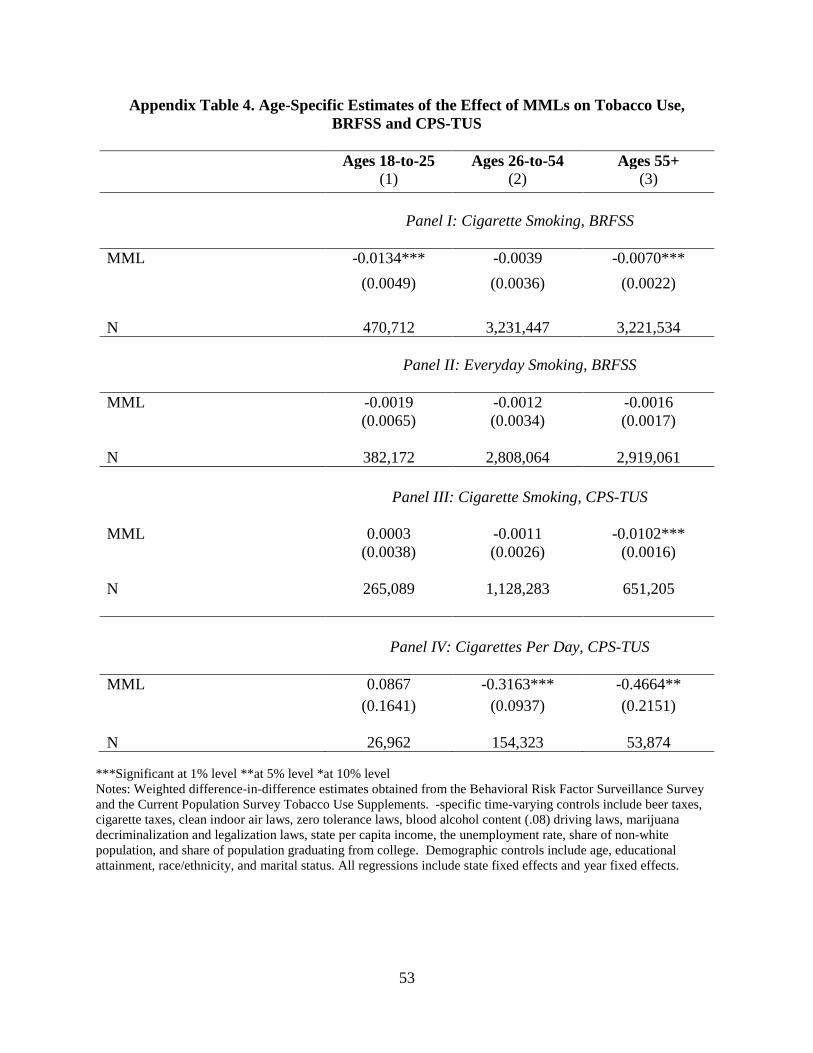
53
Appendix Table 4. Age-Specific Estimates of the Effect of MMLs on Tobacco Use, BRFSS and CPS-TUS
Ages 18-to-25 Ages 26-to-54 Ages 55+ (1) (2) (3)
Panel I: Cigarette Smoking, BRFSS
MML -0.0134*** -0.0039 -0.0070*** (0.0049) (0.0036) (0.0022) N 470,712 3,231,447 3,221,534
Panel II: Everyday Smoking, BRFSS
MML -0.0019 -0.0012 -0.0016 (0.0065) (0.0034) (0.0017) N 382,172 2,808,064 2,919,061
Panel III: Cigarette Smoking, CPS-TUS
MML 0.0003 (0.0038)
-0.0011 (0.0026)
-0.0102*** (0.0016)
N 265,089 1,128,283 651,205
Panel IV: Cigarettes Per Day, CPS-TUS
MML 0.0867 -0.3163*** -0.4664** (0.1641) (0.0937) (0.2151) N 26,962 154,323 53,874
***Significant at 1% level **at 5% level *at 10% level Notes: Weighted difference-in-difference estimates obtained from the Behavioral Risk Factor Surveillance Survey and the Current Population Survey Tobacco Use Supplements. -specific time-varying controls include beer taxes, cigarette taxes, clean indoor air laws, zero tolerance laws, blood alcohol content (.08) driving laws, marijuana decriminalization and legalization laws, state per capita income, the unemployment rate, share of non-white population, and share of population graduating from college. Demographic controls include age, educational attainment, race/ethnicity, and marital status. All regressions include state fixed effects and year fixed effects.