Embed Size (px)
Citation preview

iNii^LAU OF MINES NFORMAT/ON C IR C U L A R /I^
Smoke, Carbon Monoxide, and Hydrogen Chloride Production From the Pyrolysis of Conveyor Belting and Brattice Cloth
BV Margaret Ft. Egan
UNITED STATES DEPARTMENT«* THE INTERIOR

Information Circular 9304
Smoke, Carbon Monoxide, and Hydrogen Chloride Production From the Pyrolysis of Conveyor Belting and Brattice Cloth
By Margaret R. Egan
UNITED STATES DEPARTMENT OF THE INTERIOR Manuel Lujan, Jr., Secretary
BUREAU OF MINES T S Ary, Director

Library of Congress Cataloging in Publication Data:
Egan, Margaret R.Smoke, carbon monoxide, and hydrogen chloride production from the pyrolysis of
conveyor belting and brattice cloth / by Margaret R. Egan.
p. cm. — (Information circular; 9304)
Includes bibliographical references (p. 13).
Supt. of Docs, no.: I 28.27:9304.
1. Conveyor belts—Fire-testing. r 2. Plastic brattices (Mining)—Fire-testing. 3. Combustion gases—Analysis. 4.' Smoke—Analysis. I. Title. II. Series: Information circular (United States. Bureau of Mines); 9304.
TN295.U4 [TH9446.5.B44] 622 s-dc20 [621.8’675] 91-25937 CIP

CONTENTS
A bstract....................................................................................................................................................................................... 1Introduction................................................................................................................................................................................ 2Experimental equipm ent......................................................................................................................................................... 2
Intermediate-scale fire tu n n e l.......................................................................................................................................... 2Gas analyzers............................................................................................................................................. ........................... 2Smoke m onitors................................................................................................................................................................... 2
Materials and test procedures............................................................................................................................................... 3Calculations................................................................................................................................................................................ 4
Product generation ra tes .................................................................................................................................................... 4Smoke particle d iam eters.................................................................................................................................................. 5Smoke intensity parameters ............................................................................................................................................. 5
Results and discussion ............................................................................................................................................................ 6Gas concentrations.............................................................................................................................................................. 6Smoke characteristics......................................................................................................................................................... 8Detection l im i t s ................................................................................................................................................................... 10
Comparison of materials te s te d ............................................................................................................................................. 11Smoldering em ission s......................................................................................................................................................... 11Detectability........................................................................................................................................................................... 11
Conclusions ................................................................................................................................................................................ 13R eferences.................................................................................................................................................................................. 13Appendix.—Symbols used in this r e p o r t.............................................................................................................................. 14
ILLUSTRATIONS
1. Schematic of intermediate-scale tunnel and data-acquisition sy s tem .................................................................. 32. Appearance of PVC brattice after pyrolysis............................................................................................................... 63. Results of typical CO concentrations for PVC brattice and conveyor belting................................................... 74. Results of typical HC1 concentrations for PVC brattice and conveyor b e lt in g ................................................. 85. Results of typical OD levels for PVC brattice and conveyor b e lt in g .................................................................. 106. Detection limits for smoldering brattice cloths for initial s ta g e ............................................................................ 117. Detection limits for smoldering conveyor belts for initial stage............................................................................ 11
TABLES
1. Materials analyzed........................................................................................................................................................... 42. Mass loss and steady-state temperature ................................................................................................................... 63. Initial gas concentrations and ratios from smoldering brattice cloth and conveyor b e lt in g ........................... 74. Steady-state gas concentrations and ratios from smoldering brattice cloth and conveyor belting.................. 75. Initial generation rates from smoldering brattice ploth and conveyor belting .................................................... 86. Steady-state generation rates from smoldering brattice cloth and conveyor belting ....................................... 97. AS-V0A0 ratios for TLV and IDLH from initial and steady-state stages of smoldering brattice cloth and
conveyor belting ............................................................................................................................................................ 98. Initial smoke characteristics from smoldering brattice cloth and conveyor b e lt in g .......................................... 99. Steady-state smoke characteristics from smoldering brattice cloth and conveyor belting ............................... 9
10. Minimum requirements for sensor alarm thresholds from initial s t a g e .............................................................. 1011. Minimum requirements for sensor alarm thresholds from steady-state s ta g e .................................................... 1012. Gas concentrations and C 0 2-C 0 ratios from initial stage of smoldering com bustion..................................... 1113. Smoke characteristics from initial stage of smoldering combustion..................................................................... 1214. Relative levels of CO and smoke at respective alarm thresholds from initial stage of smoldering fires . . . 1215. Detectability ranking of initial stage from smoldering mine com bustibles......................................................... 12
Page

16. Relative levels of CO and smoke at respective alarm thresholds of steady-state stage from smolderingfires .................................................................................................................................................................................... 12
17. Detectability ranking of steady-state stage from smoldering mine combustibles................................................ 12
Page
UNIT OF MEASURE ABBREVIATIONS USED IN THIS REPORT
°c degree Celsius m2 square meter
cm centimeter m3/s cubic meter per second
g/cm 3 gram per cubic centimeter mg/m3 milligram per cubic meter
g/(m 3-ppm) gram per cubic meter times part per million min minute
g /s gram per second jum micrometer
g /(m 2-s) gram per square meter times second p/cm 3 particle per cubic centimeter
h hour pet percent
m meter ppm part per million
m 1 reciprocal meter V volt

SMOKE, CARBON MONOXIDE, AND HYDROGEN CHLORIDE PRODUCTION FROM THE PYROLYSIS OF CONVEYOR
BELTING AND BRATTICE CLOTH
By Margaret R. Egan1
ABSTRACT
In an underground mine fire, a toxic mixture of combustion product gases and particulate matter is transported by the ventilating system endangering everyone downstream. To determine the magnitude of the problem that these toxic combustion products pose, the U.S. Bureau of Mines is investigating the combustion products of typical materials found in underground mines. The total toxicity of the combustion products depends upon the evolving gas species and particulate matter, the amount of material involved, and the ventilation rate. In a simulated mine environment, the products from smoldering polyvinyl chloride (PVC) brattice and conveyor belting were analyzed for gas concentrations and smoke characteristics. The primary toxic gases are hydrogen chloride (HC1) and carbon monoxide (CO). Smoldering conveyor belts are more detectable than smoldering PVC brattice cloths. These results, combined with previous analyses, are used to estimate relative toxicities, product levels, and detectability of smoldering mine combustibles.
R esearch chemist, Pittsburgh Research Center, U .S . Bureau of M ines, Pittsburgh, PA .

INTRODUCTION
In a fire, smoke is the most important factor affecting life and property. It may be defined as the airborne products evolved when organic materials smolder or burn. It can obscure the route to safety by irritating the eyes and respiratory tract and can cause injury or death by inhalation. Smoke is not only the first sign of an impending disaster but also it can trigger an alarm saving lives and property. Developing sensitive and effective smoke detectors has been a challenge accepted by the U.S. Bureau of Mines.
Brattice cloth is used as a space divider or temporary partition installed to direct the airflow. Brattices were formerly made of untreated jute, but nylon-reinforced plastics or similar materials are more commonly used today. M ost conveyor belts used in mines today contain a halo- genated base polymer or are treated with a halogenated fire retardant.
Since the introduction o f synthetic components, the fire problem has taken on yet another dimension—that of the possible production of additional toxic gases. In ventilated
passageways, the risks from fires are compounded because the toxic gases and smoke can be transported throughout the mine endangering people far removed from the actual flames. The Bureau uses an intermediate-scale fire tunnel at the Pittsburgh Research Center to simulate a mine environment.
This report focuses on the smoldering combustion, its detection, and relative toxicity. Once the emission products o f combustible materials are known, more efficient detection, fire-suppression, and rescue equipment can be designed to improve health and safety conditions in underground mines.
The objectives of this study were to analyze the gas concentrations and particulate characteristics of smoldering brattice cloths and conveyor belting. The thermal decomposition results presented in this report, together with previous analyses of data for wood, transformer fluid, coal, conveyor belting, and ventilation ducting (i-5 )2 form a data base by which fiiture findings of other mine combustibles can be compared.
EXPERIMENTAL EQUIPMENT
INTERMEDIATE-SCALE FIRE TUNNEL
A schematic of the Bureau’s intermediate-scale fire tunnel with its data-acquisition system is shown in figure 1. A bidirectional flow probe (6) with a pressure transducer was used to determine velocity. The airflow was produced by the exterior exhaust fan and was detected by the flow probe centered in the air-intake cylinder.
Before each experiment, background readings were obtained after the material was positioned and the exhaust fan was started. Every minute throughout the experiment, the readings from each channel are scanned, stored, and displayed. After the experiment was completed, the data were plotted.
GAS ANALYZERS
The CO analyzer measures accurately within 1 pet of the range or ± 1 ppm. The carbon dioxide (C 0 2) analyzer measures accurately within 1 pet of the range or ±25 ppm. The HC1 analyzer has a sensitivity of 0.2 ppm. These analyzers were calibrated at the beginning of each experiment.
SMOKE MONITORS
The particle number concentration (N0) was obtained with a condensation nuclei monitor (CNM), manufactured
by Environment One Corp.,3 Schenectady, NY. This monitor uses a cloud chamber to measure the concentration of submicrometer airborne particles (p). The particulate cloud attenuates a light beam which ultimately produces a measurable electrical signal. The accuracy is stated as ±20 pet of a point above 30 pet o f scale within the linear range from 3,000 to 300,000 p /cm 3. Therefore, in these experiments, the calculated error could have been as great as ±18,000 p/cm 3.
The particle mass concentration (M 0) was obtained by a tapered-element oscillating microbalance (TEOM ) developed by Rupprecht & Patashnick Co., Inc., Voorheesville, N Y (7). It measures the mass directly by depositing the particles on a filter attached to an oscillating tapered element. The oscillating frequency of the tapered element decreases as the deposited mass increases. The apparatus is capable of measuring the particulate concentration with a better than 5 pet accuracy at the level used. According to the manufacturer, the filter collects at least 50 pet of all particles with a volume mean diameter of 0.05 fim, with increasing collection efficiency as the diameter increases. Actual data obtained by the Bureau using particles of volume mean diameter equal to 0.048 /im indicated a collection efficiency closer to 90 pet.
2Italic numbers in parentheses refer to items in the list of references preceding the appendix at the end of this report.
3Reference to specific products does not imply endorsement by the U .S. Bureau of Mines.

lOm 12 m./0.6|-m-diam duct
,*■ 2 m ^-Sample of*V combustible f0.8-m-square duct
Fire zone—| / material /
-0.305-irrdiam entrance duct
( hinged and movable)
Manually adjustable orifice plate
Ventilation fan
( 2-speed )
-■m Alr3D-*-t exhaust
Diffusing grid
Pressure transducer (flow probe) Differential pressure transducer 3 \ detector Thermocouples Sampling ports
K E YCALCOMP California computer products CNM Condensation nuclei monitorTEOM Tapered-element oscillating microbalanceVAX Virtual address extension
Figure 1.—Schem atic of interm ediate-scale tunnel (top) and data-acquisition system (bottom).
Since the diameter of average mass is calculated from the mass and number concentrations, its accuracy was dependent upon the precision of the TEOM and CNM. Considering the error estimates of the mass and number concentrations, the diameter of average mass could vary by ±0.05 jum.
A three-wavelength light-transmission technique (8) developed by the Bureau was used to measure particle
size and smoke obscuration. White light was transmitted through the smoke cloud to the detector. The beam was split into three parts, and each passed through an interference filter centered at wavelengths of either 0.45, 0.63, or 1.00 yum. Each photodiode output was amplified and recorded.
MATERIALS AND TEST PROCEDURES
Table 1 lists the materials studied with their chlorine content. Flaming combustion emissions of some of the same conveyor belts were studied using a natural gas burner as the ignition source. The results of these studies have been reported in reference 4.
Conveyor belts: A 23- by 30-cm section of each belt was tested in duplicate or triplicate depending on the amount of belting available. The belts were classified according to covering. They included six different PVC belts, one styrene-butadiene rubber (SBR) belt, and one

emissions were designated initial and steady state. After the strip heaters were turned on, the initial production occurred on average between the 9th and 19th min for the conveyor belting and the 13th and 16th min for brattice cloth. These results were usually the peak emission levels. After this period, the steady-state production occurred between the 21st and 30th min for conveyor belting and the 22nd and 30th min for brattice cloth. The ventilation rate (VoA,,) throughout all the experiments averaged0.16 m3/s .
Table 1.—Materials analyzed
Material Description Chlorine, pet Material Description Chlorine, petBRATTICE CLOTH CONVEYOR BELTING
A .......... Polymer component is PVC resin . . . . 22.99 P1 ___ Polymer component is PVC re sin .. 23.00B .......... . . d o ......................................................... 29.29 P1A . . . . . d o .................................................. 21.00C .......... . . d o ......................................................... 37.99 P 2 ___ 11.13D .......... . . d o ......................................................... 40.39 P3 . . . . . . d o .................................................. 18.34E .......... . . d o ......................................................... 34.59 P 4 ___ 4.40F .......... . . d o ......................................................... 37.59 P8 . . . . . . d o .................................................. 15.20G .......... . . d o ......................................................... 26.59 SBR . . . Polystyrene-butadiene rubber with 5.38H .......... . . d o ......................................................... 28.99 chlorinated additives.1............ . . d o ......................................................... 27.53 N P ___ Polymer component is neoprene 12.86Jute . . . Jute burlap with chlorinated additives 7.27 rubber.
neoprene (NP) belt. Three electric strip heaters were clamped on top of each belt sample. The power was set at 150 V for the 30 min duration of the experiment.
Brattice cloth: Nine different PVC brattice cloths and one sample of jute brattice (treated with fire retardant) were tested in duplicate. A double thickness of brattice measuring 23- by 30-cm was placed on a wire mesh which rested on three strip heaters. The power was set at 100 V for 5 min and increased to 175 V for the remaining 25 min of the experiment.
The pyrolysis of the conveyor belting and brattice cloth did not result in flaming combustion. The combustion
CALCULATIONS
It is necessary to measure certain parameters to compare the combustion products, hazard potential, and detectability of various fuels. The measurements include gas concentrations, smoke particle M0 and N0, and V ^ . Other combustion properties can be calculated once these values are known.
PRODUCT GENERATION RATES
The generation rate, Gx, of a product is related to its measured concentration and VoA0 by the general expression
G x = M x (V 0A 0)(A X ) , (1)
3 g / (m3"]
Mc o = 1.25 x 10"3 g /(m 3-ppm),
MHa = 1-63 x 10‘3 g /(m 3-ppm),
V0A0 = ventilation rate, m 3/s ,
where, for gases MCq2 = 1.97 x 10 g /(m *ppm),
and AX = measured quantity of a given gas.
To determine the amount of toxic gas generated from the combustion of a specific area of a sample, the following expression can be used
G’x - Gv/A;H> (2)
where A H is area of the strip heaters, 0.02 m2. The decomposition of the conveyor belts occurred only where the belt came into direct contact with the strip heaters. By contrast, the entire sample of PVC brattice cloth was destroyed. At any one time, this area measured between 0.02 m2 (the area of the strip heaters) and 0.07 m2 (the entire sample area). For the steady-state stage calculations, an average area of 0.045 m2 was chosen to represent the involved area of the brattice sample.
The concentrations of toxic gas can be predicted for a certain area and VoAa by the following expression
A X = .22M , V „A 0
(3)
where Ag is heated area of the sample, and Mx is density of a given gas.

To estimate the toxicity of the CO and HC1 emissions, two established levels will be considered. The first level is the threshold limit value (TLV), which represents the maximum average exposure that can be tolerated for an 8 -h period without suffering any adverse effects. The TLV for CO is 50 ppm and for HC1 is 5 ppm (9). The second level is the immediately dangerous to life and health (IDLH), which represents the level at which severe health effects and possibly death could occur. The ID LH for CO is 1,500 ppm (10) and for HC1 is 100 ppm (11). Assuming that the toxicities of combined CO and HC1 are additive (12), then if the sum of the following fractions
A CO AHC1 ^ .+ ---------< 1 ,50 ppm 5 ppm (4 )
the TLV of the mixture has not been exceeded (13). Similarly, when
A CO AHC11,500 ppm 100 ppm (5)
the ID LH level has not been exceeded, and the toxicity is not life-threatening. Then, when the following expression
(6)VoA0 G ’CO G’HC1
50 M c o 5 M HC1
is satisfied, the combined toxicity is within the TLV. Similarly, when the following expression is satisfied, the combined toxicity exceeds or is equal to the ID LH level.
SMOKE PARTICLE DIAMETERS
M easurem ents of both M 0 and N 0 of the smoke can be used to calculate the average size of the smoke particles, using the expression
7rd„(p p) N o = l x l 0 3 M o, (9)
where
and
dm = diam eter of a particle of average mass, fim,
Pp = individual particle density, g /cm 3,
N0 = num ber concentration, p /cm 3,
M 0 = mass concentration, m g/m 3.
If the value of pp = 1.4 g /cm 3, then the dm can be calculated in microm eters from
dm = 11.09M„ 1 /3
N„(10)
W hen the three-wavelength smoke detector is used, the transmission of the light, T, through the smoke can be calculated for each wavelength. The extinction-coefficient ratio can be calculated for each pair of wavelengths, A, from the following log-transmission ratios:
InTA =1.00 InTA =1.00 InT
InTA =0.63 InTor A =0.63
A =0.45 InTA =0.45
V 0A 0 G ’C O G’(7)
H Cl
1,500 M c o 100 M HC1
Early fire detection can minimize the toxic and irritating effects of combustion emissions and maximize the chances of escape or rescue. However, a balance must be reached between an alarm threshold that is low enough to be effective and still reliable. The minimum requirem ents for CO sensor alarm thresholds, COA, can be calculated by using the AS-V0A 0 ratio for TLV from equation 6 in the following expression,
G ’(C O
M C O V oA0(8)
A n evaluation of combustion toxicity and detectability would not be complete without considering the smoke intensity and particle size.
W hen these extinction coefficients and the curve in figure 11 of reference 8 are used, the surface mean particle size, d^, can be determined. (Calculation of the extinction-coefficient curves assumes spherical particles with an estimated refractive index.) The T must be less than 85 pet before reliable particle sizes can be calculated using this technique.
SMOKE INTENSITY PARAMETERS
A nother im portant factor of the particulate phase of smoke is visual obscuration. Smoke concentration is most often expressed in term s of optical density (O D) in reciprocal m eters. This characteristic provides a measure of fire hazard, in that escape and rescue depend on visibility. It is related to T by the following expression:
OD = J l ( l n T ) ,
where £ = path length, m.
(11)

M ost smoke detectors are triggered at an OD of0.1 m 1 or less. The probability of escape and rescue is reduced significantly once the critical level of smoke (OD = 0.5 m 1) has accumulated (14).4 The minimum requirem ents for smoke sensor alarm thresholds, ODA, can be determ ined in a similar m anner to COA (equation 6 ) by the following expression
O D A = G’c o f OD'M CO CO V A
(12)
Smoke density may be defined as the degree of light obscuration produced by the smoke from the burning
m aterial under given conditions of combustion. Some other factors influencing obscuration include the number, size, and refractive index of the particles and light frequency. The smoke obscuration is the percentage of light absorbed by the smoke or 1 00 pet of the light minus the percent T. I t is calculated using the following equation:
Obscuration = 100(1 - T). (13)
The obscuration values presented in this report are an average of the attenuation of the beam of light at two wavelengths in the visible range, 0.45 and 0.63 pm.
RESULTS AND DISCUSSION
Figure 2 shows the charred rem nant of a PVC brattice after pyrolysis. A t least two thirds of the brattice was consumed in the typical experiment. By contrast, the exterior of the conveyor belting was only scorched by the strip heaters with little damage to the interior fibers. The average PVC belt lost 14 pet of its mass while the NP belt lost 7 pet and the SBR belt lost only 3 pet. Table 2 lists the mass loss and steady-state tem perature for each belt and brattice. A probe located above, bu t not touching the test sample was used to determ ine tem perature. All the reported results are an average from all experiments for each belt and brattice. Figures 3, 4, and 5 illustrate the typical gas and smoke production as a function of time for PVC belt, P I, and PVC brattice, I.
GAS CONCENTRATIONS
These hydrocarbons were found in grab samples of the steady-state emissions of PVC brattices. They included: 8 ppm methane, < 2 ppm ethane and ethylene, and < 1 ppm propane and propylene. However, the concentrations of CO, C 0 2, and HC1 were continuously measured. These initial gas concentrations and ratios for each belt and brattice are listed in table 3. The same determinations for the steady-state stage are listed in table 4. ,•
For all belts, the CO production remains fairly constant throughout the experiments. However, for brattice, the CO production decreases as the cloth is consumed. Figure 3 compares the production of CO for a typical PVC belt and brattice. The amount of m aterial consumed must be considered when comparing the relative concentrations of CO produced. Initially, all brattices but A, F, G, and H produced CO above the detection level of 5 ppm.
4Reference 14 quotes a value o f OD = 0.218 m '1 for the critical value determined from the expression OD = - 1 / i log T. W hen the natural logarithm is used, as in equation 11, then OD = 2.303 x 0.218 = 0.5 m '1, the value used in the text.
Table 2.—M ass loss and steady-sta te tem peratu re
Material A m , g
BRATTICEA .............. 25.5B ............... 57.8C ............... 42.7D ............... 37.5E .............. 46.2F .............. 9.7G .............. 29.1H .............. 18.2I ................. 26.6J u t e .......... ND
CONVEYORP1 ............ 125.0P 1 A .......... 122.2P 2 ............ 142.2P 3 ............ 119.4P 4 ............ 118.3P 8 ............ 162.2S B R .......... 43.5N P ............ 61.3ND Not determined.
A m , pet Temp, *CCLOTH
43.144.948.445.2 47.040.9 39.836.4 42.7ND
BELTING14.213.712.813.3 13.017.3 3.2 6.9
330407344296281220266289219ND
94937777
12782
113214
Figure 2.—A ppearance of PVC brattice after pyrolysis.

Table 3.—Initial gas concentrations and ratios fromsmoldering brattice cloth and conveyor belting
Sample CO, c o 2> Ratio, HCI, Ratio,ppm ppm C 0 2-C 0 ppm HCI-CO
BRATTICE CLOTHA .......... 4 19 4.4 31 7.0B .......... 12 86 6.0 36 2.9C .......... 17 18 1.1 69 4.5D .......... 5 34 6.5 70 14.4E .......... 13 70 5.3 18 1.4F .......... 2 34 13.8 10 4.3G .......... 4 23 5.1 37 7.6H .......... 2 32 15.4 11 5.21 .......... 7 23 3.4 16 2.2Jute . . . 32 149 4.7 ND ND
CONVEYOR BELTINGP1 ___ 32 44 1.3 19 0.6P1A . . . 42 49 1.2 15 .4P 2 ___ 32 39 1.2 13 .4P 3 ___ 17 24 1.4 24 1.4P 4 ___ 20 13 .6 12 .6P 8 ___ 41 15 .4 20 .5SBR . . . 10 20 .5 5 .5N P ___ 12 24 1.4 17 1.4ND Not determined.
Table 4.—Steady-state g a s concentrations and ratios from sm oldering brattice cloth and conveyor belting
Sample CO,ppm
co2,ppm
Ratio,C 0 2-C 0
HCI,ppm
Ratio,HCI-CO
BRATTICE CLOTHA .......... 1 0 0.0 9 8.2B .......... 15 70 4.7 35 2.3C .......... 12 26 2.1 28 2.3D .......... 2 3 1.8 25 15.4E .......... 4 46 12.7 26 7.4F .......... 1 5 4.0 3 2.3G .......... 1 5 3.8 8 6.7H .......... 1 3 3.4 8 10.0I ........ 2 10 4.6 10 4.5Jute . . . 7 69 9.9 ND ND
CONVEYOR BELTINGP1 ___ 34 61 1.8 11 0.3P1A . . . 37 62 1.7 10 .3P 2 ___ 30 48 1.6 14 .5P3 . . . . 19 27 1.4 14 .7P 4 ___ 22 33 1.5 7 .3P 8 ___ 44 24 .6 12 .3SBR . . . 10 14 1.5 3 .3N P ___ 12 30 2.5 12 1.0ND Not determined.
The C 0 2 concentrations for the PVC and NP belts increased slightly from the initial stage to the steady-state stage. The SBR belt showed a slight decrease in C 0 2 production. For PVC and ju te brattice, the C 0 2 concentrations decreased. However, ju te brattice produced the
highest concentration of C 0 2 of all the materials. The C 0 2-C 0 ratios in both stages were higher for brattices than for belts. D uring the steady state, incomplete oxidation produces less C 0 2 lowering the C 0 2-C 0 ratios of both belts and brattices.
The main toxic risk from the pyrolysis of PVC is HC1 production. A s little as 5 to 10 ppm can cause irritation to the mucous m em branes (9). Some correlation between chlorine content and HC1 production was found. For example, brattices w ith high chlorine content tend to emit high concentrations of HC1 and conveyor belts with low chlorine content tend to emit low concentrations of HC1. F or bo th brattice and belting, the HC1 emissions are higher in the initial stage than the steady-state stage (fig. 4). The belts, at tem peratures averaging less than 100° C, release HC1 slowly showing an initial peak followed by a gently decreasing steady-state production of HC1. M ost of the HC1 is em itted as the polymeric m aterial is being consumed in the initial stage. A t this stage, the tem peratures averaged 300° C.
The greatest ratio variation between the belts and brattices is seen in HC1-CO ratios. T he brattices have high ratios averaging 6.5 in the initial stage and 5.5 in the steady-state stage. The PVC belts have much lower ratios averaging 0.6 in the initial stage and 0.4 in the steady-state stage.
Figure 3.—R esults of typical CO concentrations for PVC brattice and conveyor belting.
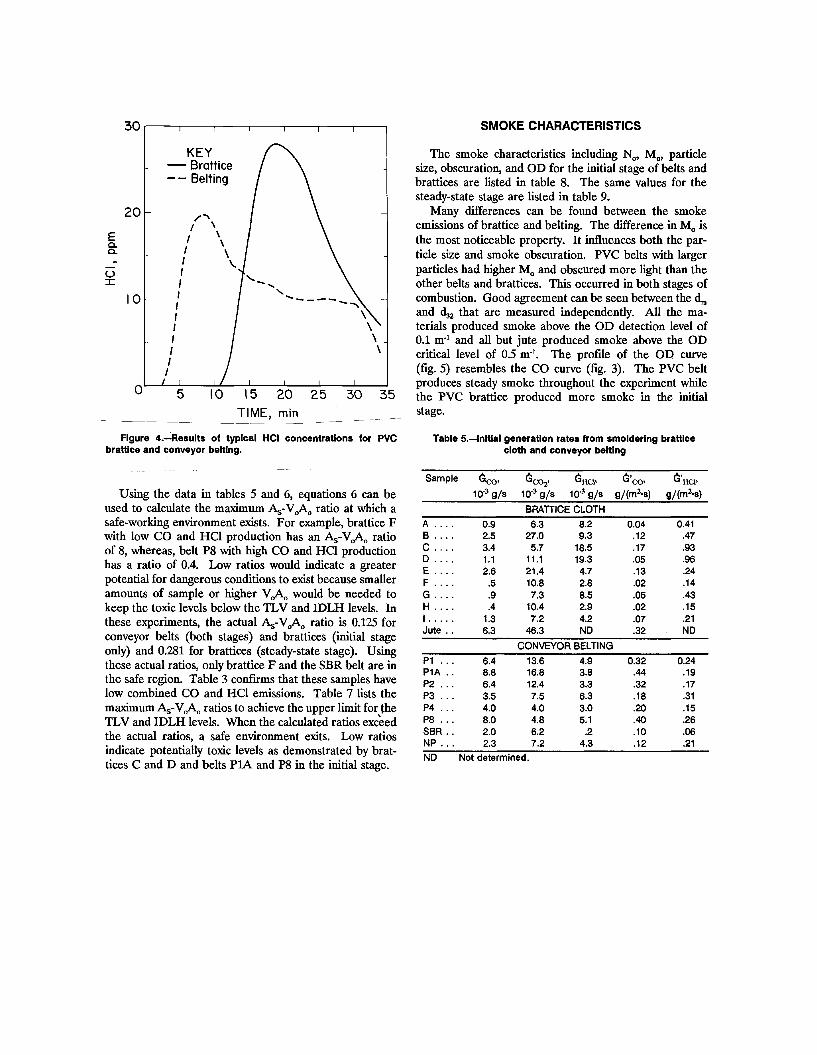
Figure 4.—R esults of typical HCI concen tra tio n s for PVC brattice an d conveyor belting.
U sing the data in tables 5 and 6 , equations 6 can be used to calculate the maximum A S-V 0A 0 ratio at which a safe-working environm ent exists. F or example, brattice F with low C O and H C I production has an A ^ V A o ratio of 8 , w hereas, belt P 8 with high CO and H CI production has a ratio of 0.4. Low ratios would indicate a greater potential fo r dangerous conditions to exist because smaller am ounts o f sam ple or higher would be needed to keep the toxic levels below the TLV and ID L H levels. In these experiments, the actual A S-V 0A 0 ratio is 0.125 for conveyor belts (both stages) and brattices (initial stage only) and 0.281 for brattices (steady-state stage). U sing these actual ratios, only brattice F and the SBR belt are in the safe region. T able 3 confirms tha t these sam ples have low com bined CO and HCI emissions. T able 7 lists the maximum A j - V ^ ratios to achieve the upper lim it for the TLV and ID L H levels. W hen the calculated ratios exceed the actual ratios, a safe environm ent exits. Low ratios indicate potentially toxic levels as dem onstrated by b ra ttices C and D and belts P1A and P8 in the initial stage.
The sm oke characteristics including N 0, M 0, particle size, obscuration, and O D for the initial stage of belts and brattices are listed in table 8 . T he sam e values for the steady-state stage are listed in table 9.
Many differences can be found betw een the smoke emissions of brattice and belting. The difference in M 0 is the m ost noticeable property. I t influences bo th the p article size and sm oke obscuration. PV C belts w ith larger particles had higher M 0 and obscured m ore light than the o ther belts and brattices. This occurred in bo th stages of combustion. G ood agreem ent can be seen betw een the dm and (I32 tha t are m easured independently. A ll the m aterials produced sm oke above the O D detection level of0.1 n r 1 and all bu t ju te produced sm oke above the O D critical level of 0.5 n r1. T he profile of the O D curve (fig. 5) resem bles the CO curve (fig. 3). T he PV C belt produces steady sm oke throughout the experim ent while the PV C brattice produced m ore sm oke in the initial stage.
SMOKE CHARACTERISTICS
Table 5.—Initial genera tion ra te s from sm oldering brattice cloth and conveyor belting
Sample ^CO’ ^co2> HC1> 6 ’0 CO» HC1>10‘3 g/s 10"3 g/s 10'3 g/s g/(m 2-s) g/(m 2-s)
BRATTICE CLOTHA ____ 0.9 6.3 8.2 0.04 0.41B ____ 2.5 27.0 9.3 .12 .47C . . . . 3.4 5.7 18.5 .17 .93D ____ 1.1 11.1 19.3 .05 .96E ____ 2.6 21.4 4.7 .13 .24F ____ .5 10.8 2.8 .02 .14G . . . . .9 7.3 8.5 .05 .43H ____ .4 10.4 2.9 .02 .151............ 1.3 7.2 4.2 .07 .21Jute . . 6.3 46.3 ND .32 ND
CONVEYOR BELTINGP1 . . . 6.4 13.6 4.9 0.32 0.24P1A . . 8.8 16.8 3.8 .44 .19P2 . . . 6.4 12.4 3.3 .32 .17P3 . . . 3.5 7.5 6.3 .18 .31P4 . . . 4.0 4.0 3.0 .20 .15PB . . . 8.0 4.8 5.1 .40 .26SBR . . 2.0 6.2 .2 .10 .06NP . . . 2.3 7.2 4.3 .12 .21ND Not determined.

Table 6.—Steady-state generation rates from smolderingbrattice cloth and conveyor belting
Table 8.—Initial sm oke characteristics from smoldering brattice cloth and conveyor belting
Sample ¿CO'IO'3 g/s
^C02’ HC1>10'3 g/s 10"3 g/s
6 CO'g/(m2-s)
6 ’hC1’g/(m2-s)
BRATTICE CLOTHA ____ 0.2 0.0 2.5 0.01 0.05B ____ 2.9 21.4 8.9 .06 .20C . . . . 2.3 8.3 7.5 .05 .17D . . . . .3 1.0 6.7 .01 .15E ____ .7 13.5 6.5 .02 .14F ____ .3 1.7 .7 .01 .01G . . . . .3 1.7 2.0 .01 .05H ____ .2 .9 2.0 <.01 .04I ....... .4 3.0 2.4 .01 .05Jute . . 1.3 20.4 ND .07 ND
CONVEYOR BELTINGP1 . . . 6.6 18.7 2.8 0.33 0.14P1A . . 7.7 21.0 2.6 .38 .13P2 . . . 6.0 15.2 3.7 .30 .18P3 . . . 3.8 8.4 3.6 .19 .18P4 . . . 4.3 10.3 1.9 .22 .09P8 . . . 8.4 7.4 2.9 .42 .15SBR . . 1.8 4.1 .7 .09 .04NP . . . 2.3 8.9 3.1 .12 .15ND Not determined.
SampleN0,106
p/cm3
Mo-mg/m3
dm,/*m
32’¡¡m
Obscuration,pet
OD,m-1
BRATTICE CLOTHA ........... 1.27 24.7 0.29 ND 3.0 0.3B ........... 1.49 67.7 .40 0.39 13.8 1.5C ........... 1.89 30.9 .28 .37 11.2 1.2D ........... 1.53 55.0 .37 .49 10.4 1.2E ........... 1.23 68.4 .42 .35 12.0 1.3F ........... 1.57 16.8 .25 ND 4.5 .5G ........... .92 51.6 .43 .42 8.0 .9H ........... 1.01 34.1 .37 ND 2.3 .2I ........ 1.45 30.3 .30 ND 7.3 .8Jute . . . .36 6.9 .29 ND 2.6 .3
CONVEYOR BELTINGP1 ____ 0.52 156.5 0.75 0.58 15.8 1.5P1A . . . .87 164.5 .77 .54 15.7 1.7P2 . . . . .52 116.6 .68 .57 17.1 1.8P3 . . . . 1.35 149.7 .55 .44 15.4 1.7P4 . . . . .50 74.9 .58 .52 13.0 1.4P8 . . . . .78 107.9 .51 .58 19.9 2.2SBR . . . .63 51.3 .47 .50 10.4 1.1N P ____ 1.49 47.6 .36 .21 9.9 1.0ND Not determined.
Table T .-A .-V ^ ratios for TLV and IDLH from initial and steady-state s ta g es of smoldering brattice
cloth and conveyor belting
Ratio, Ratio,SamP|e (As-VAKt.v (As-VA)mr.H
Initial Steady-state Initial Steady-state BRATTICE CLOTH
A ................. 0.020 0.147 0.39 2.96B .................................017 .040 .34 .80C .................................009 .047 .17 .96D ................................. 008 .055 .17 1.10E .................................032 .056 .66 1.11F .................................058 .537 1.17 10.10G .................................019 .177 .38 3.55H ................................. 055 .181 1.10 3.63I .................... .037 .147 .76 2.96
________________________ CONVEYOR BELTING_____________________P1 .............. 0.029 0.043 060 0.95P 1 A ........... .033 .044 .71 .99P2 ..............................039 .036 .84 .78P3 .............. .024 .039 .50 .83P4 ..............................046 .066 .97 1.45P8 .............. .026 .040 .56 .89S B R ........... .112 .172 2.38 3.80N P ..............................036 .048 .73 1.00
Table 9.—Steady-state sm oke characteristics from smoldering brattice cloth and conveyor belting
SampleN0.106
p/cm3
M0,mg/m3 Mm
32’Mm
Obscuration,pet
OD,m'1
BRATTICE CLOTHA ........... 0.82 2.7 0.15 ND 3.0 0.3B ........... 1.07 3.5 .14 ND 13.8 1.5C ........... 1.32 4.9 .17 ND 11.2 1.2D ........... 1.16 8.2 .21 ND 10.4 1.2E ........... 1.24 8.5 .21 0.33 12.0 1.3F ........... 1.55 3.2 .14 ND 4.5 .5G ........... .74 3.1 .16 .33 8.0 .9H ........... .91 5.2 .19 ND 2.3 .2I .............. .88 4.7 .20 ND 7.3 .8Jute . . . .39 .8 .14 ND .4 <.1
CONVEYOR BELTINGP1 ____ 0.74 68.0 0.49 0.48 13.3 1.4P1A . . . .60 70.9 .55 .44 12.2 1.2P 2 ____ .70 25.1 .34 .46 12.7 1.4P 3 ____ 1.57 69.4 .39 .35 12.5 1.3P 4 ____ .32 55.7 .64 .51 16.3 1.6P 8 ____ .69 18.0 .31 .54 17.3 1.8SBR . . . .49 34.4 .42 .37 8.6 .9N P ____ 1.54 40.7 .33 ND 7.0 .8ND Not determined.

DETECTION LIMITS Table 11.-—Minimum requirem ents for sensor alarm thresholds from steady-state stage
Smoldering m aterials that do not produce much smoke or toxic gas are less hazardous, bu t are also m ore difficult to detect. This can be dem onstrated by calculating the COA (equation 8) and ODA (equation 12) for smoldering brattice cloths and conveyor belts. Tables 10 and 11 list these values for the initial stage and steady-state stage. The lowest set point for a CO sensor to safely detect smoldering brattice cloths is below the alarm threshold of most CO sensors (5 ppm ). Smoldering conveyor belts are easier to detect and require slightly higher thresholds.
In a similar manner, the COA and ODA at the ID LH level would be required to w arn of extremely unsafe conditions. Figures 6 and 7 illustrate the effectiveness of sensors with specific threshold alarm levels. The nontoxic region would have a relative hazard level below the TLV. In this area, smoke detection for all belts and most brattices is effective. The potentially toxic region would have a relative hazard between the TLV and ID L H level. CO detection for some belts and all brattices lie in this area. Only smoldering brattices A , C, and D could not be detected in the nontoxic region by a 0 .1 -m 1 smoke sensor. Only smoldering belts P3 and N P could not be detected in the nontoxic region by a 5 ppm CO sensor. The combustion emissions from these belts may be less toxic, but m ore difficult to detect. Figures 6 and 7 confirm that smoke detection is m ore effective than CO detection. It is also clear that sm oldering conveyor belts are more detectable than smoldering PV C brattice cloths.
Table 10.—Minimum requirem ents for sensor alarm thresholds from initial stage
Sample COA, ppm ODA, m'1at TLV at IDLH at TLV at IDLH
BRATTICE CLOTHA ............ 0.70 14.11 0.049 0.97B ............ 1.66 33.75 .200 4.06C ............ 1.18 23.69 .084 1.70D ............ .36 7.29 .086 1.72E ............ 3.31 67.77 .328 6.71F ............ 1.14 23.00 .254 5.12G ..............................70 14.16 .146 2.93H ..............................93 18.79 .107 2.15I .............. 2.02 40.93 .232 4.71
CONVEYOR BELTINGP1 ____ 7.32 153.95 0.345 7.26P1A . . . 11.60 251.23 .461 9.98P 2 ____ 10.04 215.30 .580 12.45P 3 ____ 3.41 69.70 .332 6.79P 4 ____ 7.45 156.51 .504 10.59P 8 ____ 8.46 179.55 .445 9.44SBR . . . 8.78 186.51 .912 19.37N P ____ 3.28 66.95 .277 5.66
Sample COA, ppm ODa> m-1at TLV at IDLH at TLV at IDLH
BRATTICE CLOTHA ............ 0.62 12.53 0.160 3.21B ............ 2.02 51.06 .203 5.13C ............ 2.07 41.99 .200 4.06D ........... .33 6.53 .247 4.96E ............ .68 13.61 .211 4.25F ........... 2.60 49.00 1.044 19.64G ........... .92 18.45 .590 11.86H ........... .53 10.71 .150 3.00I ........ 1.09 21.86 .393 7.91
CONVEYOR BELTINGP1 ____ 11.41 250.79 0.478 10.51P1A . . . 13.64 305.45 .456 10.21P 2 ____ 8.68 186.38 .407 8.74P 3 ____ 5.93 124.29 .416 8.72P 4 ____ 11.36 249.60 .824 18.11P 8 ____ 13.31 297.39 .560 12.52SBR . . . 12.29 272.17 1.198 26.53N P ____ 5.32 92.20 .336 5.82
Figure 5.—Results of typical OD levels for PVC brattice and conveyor belting.

001 < N < XoX0
LU>
UJtc
KEY• 5.0 ppm CO sensor a 0 .1 m"l smoke sensor
_i___ 1___ u
Toxic
C0A, ppm or 0DA, m'1 at IDLH
Potentiallytoxic
C0A, ppm or 0DA , m"l at TLV
Nontoxic
aoc<N<XoXoI-UJ>
LlIOC
KEY• 5.0 ppm CO sensor a 0 .1 rrf I smoke sensor
I 1 I
Toxic
C0A, ppm or 0DA, m '1 at IDLH
Potentiallytoxic
C0A , ppm or 0Da , m'l at TLV
• •Nontoxic
A B C D E F G H IBRATTICE CLOTHS
▲ *J ____ I____I____L-
Pl PIA P2 P3 P4 P8 SBR NP
CONVEYOR BELTS
Figure 6.—Detection limits for smoldering brattice cloths for initial stage.
Figure 7.—Detection limits for sm oldering conveyor belts for initial stage.
COMPARISON OF MATERIALS TESTED
SMOLDERING EMISSIONS
A comparison of the gas concentrations and smoke characteristics of other smoldering combustible mine m aterials was reported previously (15). This report updates and expands those results. The tests were all conducted in the intermediate-scale fire tunnel and all materials were pyrolyzed using strip heaters. The tables combine the initial stage results from this report with the earlier smoldering data.
A summary of the updated gas concentrations can be found in table 12. Those materials with high gas production, jute brattice, and nonignitable ducting, have higher C 0 2-C 0 ratios indicating m ore complete combustion. Lower ratios, indicative of less efficient combustion, are usually produced from smoldering fires. PVC brattice, although it has low gas production, has a high C 0 2-C 0 ratio.
A summary of the smoke characteristics is in table 13. The particle size is a major factor in smoke density. Those materials with large particle size tend to produce thick smoke. For example, the particles, dm and d32,
produced from smoldering PVC belts resulted in dense smoke as m easured by the obscuration and OD.
Table 12.—G as concentrations and C02-C0 ratios from initial s tag e of
sm oldering com bustion
Material CO, co2, Ratio,ppm ppm co2-co
PVC brattice........... 7 37 6.9Jute brattice 32 149 4.6PVC b e lts................ 31 31 1.0SBR b e lts.............. 10 20 2.0NP b e lts................... 12 24 2.0W ood...................... 43 ND NDC o al......................... 15 19 1.3Nonignitable
28 139 5.0ND Not determined.
DETECTABILITY
To determine which type of fire sensor (smoke or CO) might be m ore effective for detection of smoldering PVC

brattice and belts, com pare figures 3 and 5 for onset of detectable smoke (O D = 0.1 m*1) and CO (5 ppm). The smoke from sm oldering PV C conveyor belts reaches the alarm threshold at the 5th m in while the smoke from PVC brattice reaches the alarm threshold at the 7th min. The same comparison for CO detection is even m ore striking. M ost brattices did not produce enough CO to reach the alarm threshold, but the PV C belting exceeded the alarm threshold at the 7th min. A comparison of the relative levels of CO and sm oke a t respective alarm thresholds for initial stage emissions of all the combustibles tested can be found in table 14. A smoke sensor is the obvious choice because the O D of the smoke is well above the alarm threshold by the tim e the CO threshold is reached. Jute brattice is the only exception with CO detection only slightly ahead of smoke detection. Table 15 ranks mine combustibles for ease of fire detection. The combustion emissions detected by a CO sensor are in reverse order of smoke detection, and that all the combustibles tested are m ore readily detected by smoke (O D ) than by CO production.
Table 13.—Sm oke characteristics from initial s ta g e o f sm oldering com bustion
Material dmi*m
d32nm
Obscuration,pet
OD,m'1
PVC brattice . . 0.35 0.41 8 0.89Jute brattice . . .29 ND 3 .30PVC b e lts____ .64 .54 16 1.94SBR belts . . . . .47 .50 10 1.06NP b e lts............ .36 .21 10 1.02W ood................. ND ND 12 1.36C o a l.................... .16 ND 9 .91Nonignitable
d u cts ............... .28 .36 11 1.20ND Not determined.
Table 14.—Relative levels of CO and sm oke a t respective alarm th resh o ld s from Initial
s ta g e of sm oldering fires
Material OD,15 ppm CO
CO,0.1 m 1 OD
PVC brattice............ 0.6 0.8Jute brattice............ <.1 10.6PVC b e lts................. .3 1.6SBR b e lts ................. .5 1.0NP b e lts .................... .4 1.2W ood.......................... .2 3.2C o a l... ......................... .3 1.7Nonignitable
ducting ................. .2 2.3
Table 15.—Detectability ranking of initial s ta g e from sm oldering mine
com bustib les
Material CO sensor Smoke sensorJute brattice . . . 1 8
2 7Nonignitable
3 6C o a l....................... 4 5PVC b e lts ............ 5 4
6 37 2
PVC brattice . . . 8 1
D uring the steady-state stage, the levels change slightly as seen in table 16. Ju te brattice has surpassed the alarm threshold of CO, but rem ains just below the smoke alarm threshold. The detectability ranking also changes (table 17) and is not quite in the reverse order for smoke sensors.
Table 16.—Relative levels of CO and sm oke a t respective alarm th resh o ld s of steady-
s ta te s ta g e from sm oldering fires
Material OD,15 ppm CO
CO,0.1 m 1 OD
PVC brattice............ 1.0 0.5Jute b rattice............ <.1 16.0PVC b e lts................. .4 .7
.9 1.0NP b e lts .................... .3 1.6
.3 3.2
.6 1.7Nonignitable
.4 2.3
Table 17.—Detectability ranking of steady- s ta te s ta g e from sm oldering m ine
com bustib les
Material CO sensor Smoke sensorJute brattice . . . . 1 8W ood....................... 2 7NP b e lts................. 3 4Nonignitable
ducting .............. 4 6PVC b e lts .............. 5 2C o a l.......................... 6 5SBR b e lts ............... 7 3PVC brattice . . . . 8 1

CONCLUSIONS
In a mine fire, all the burning materials combine to produce a wide variety of toxic or irritating gases and particles that can be transported by the ventilating system. Previous studies have identified and m easured the products of PVC combustion (id ). These toxic emissions may overcome their victims far removed from the actual fire. M ore effective sensing devices and smoke alarms would alert miners of dangerous situations while there is adequate time to take appropriate action.
Smoldering ju te brattice will alarm a 5 ppm CO sensor before a smoke sensor. A t the other end of the spectrum, a smoke sensor is the m ore efficient method of detecting smoldering PV C brattice. PV C brattice also had the highest C 0 2-C 0 and HC1-CO ratios. The combustion of these small samples has dem onstrated the potential for smoldering PVC brattices to produce toxic smoke levels before detection by most CO sensors. Smoldering conveyor belts are, by comparison, m ore detectable. However, smoke detectors are still m ore effective than CO sensors. The irony of the toxicity-detectability dilemma is that the materials producing low toxic emissions may be
less detectable. Fires involving these materials may smolder for a long period before emissions reach alarm thresholds levels. Therefore, emissions containing low smoke and CO concentrations could be considered less toxic, but still hazardous because they are m ore difficult to detect.
I t was not the intent of these experiments to judge which m aterial is the most hazardous. Each generates unique and dangerous combustion products. The pyrolysis of synthetic materials adds small, volatile, organic compounds which are highly flammable to the toxic CO, increasing the hazards of their emission products. In any fire, as fresh materials are engulfed the composition of the emissions changes. To determ ine the total toxicity of the mixture, the possible synergistic effect of the thermal decomposition and combustion products must be considered. In this series of experiments, each m aterial was studied independently to compare their combustion product emission rates, relative toxicities, and the detectability of their toxic products.
REFERENCES
1. Egan, M. R , and C. D . Litton. Wood Crib Fires in a Ventilated Tunnel. BuMines R I 9045, 1986, 18 pp.
2. Egan, M. R . Transformer Fluid Fires in a Ventilated Tunnel. BuMines IC 9117,1986,13 pp.
3. _____ . Coal Combustion in a Ventilated Tunnel. BuMinesIC 9169, 1987, 13 pp.
4. _____ . Emission Products from the Combustion of ConveyorBelts. BuMines IC 9205, 1988, 12 pp.
5. _____ . Thermal Decomposition of Ventilation Ducting. BuMinesIC 9263, 1990,12 pp.
6. McCaffrey, B . J ., and G . Heskestad. A Robust Bidirectional Low-Velocity Probe for Flame and Fire Application. Combust, and Flame, v. 26, No. 1, 1976, pp. 125-127.
7. Patashnick, H ., and G . Rupprecht. Microweighing Goes On-Line in Real Time. Res. and Dev., v. 28, No. 6, 1986, pp. 74-78.
8. Cashdollar, K . L ., C. K . Lee, and J . M. Singer. Three-Wavelength Light Transmission Technique To Measure Smoke Particle Size and Concentration. Appl. Optics, v. 18, No. 11, 1979, pp. 1763-1769. '
9. Hilado, C. J. (ed.). Flammability Handbook for Plastics. Tech- nomic Publ., 3d ed., 1982, pp. 56-59.
10. Parmeggiani, L . (ed.). Encyclopedia of Occupational Health and Safety. Int. Labour Organ., v. 1, 3d ed., 1983, p. 395.
11. Parmeggiani, L . (ed.). Encyclopedia of Occupational Health and Safety. Int. Labour Organ., v. 1, 3d ed., 1983, p. 1084.
12. Hartzell, G . E ., A . F . Grand, and W. G . Switzer. Modeling of Toxicological Effects of Fire Gases: V I. Further Studies on the Toxicity of Smoke Containing Hydrogen Chloride. J . Fire Sci., v. 5, No. 6,1987, pp. 368-391.
13. American Conference of Governmental Industrial Hygienists. Threshold Lim it Values for Chemical Substances and Physical Agents in the Workroom Environment with Changes. 1980, pp. 1-93.
14. Tewarson, A ., and J. S. Newman. An Experimental Investigation of the Fire Hazards Associated With Timber Sets in Mines. Paper in Underground Metal and Nonmetal Fire Protection. BuMines IC 8865, 1981, pp. 86-103.
15. Egan, M. R . Summary of Combustion Products from Mine Materials: Their Relevance to Mine Fire Detection. BuMines IC 9272, 1990,12 pp.
16. Ultrasystems, Inc. Coal Mine Combustion Products Identification and Analysis Procedures and Summary (contract H0133004), 1978,130 pp.

APPENDIX.—SYMBOLS USED IN THIS REPORT
Ax area of a given material, m 2
COA minimum requirem ent for CO sensor alarmthreshold, ppm
dm diam eter of a particle of average mass, jum
d32 surface m ean particle size, pm
Gx generation rate of a given combustion product,g /s
G ’x generation rate of a given combustion productfrom a given area of sample, g /(m 2-s)
i path length, m
In logarithm, natural
M 0 particle mass concentration, m g/cm 3
M x density of a given gas, g /(m 3*ppm)
N 0 particle num ber concentration, p /cm 3
OD optical density, m ' 1
ODa minimum requirem ent for smoke sensor alarmthreshold, m 1
p particle
T transmission of light
ventilation rate, m3/s
Am m easured change in mass, g
AX m easured quantity of a given gas, ppm
A wavelength of light source, pm
pp individual particle density, g/cm 3