Embed Size (px)
DESCRIPTION
Smoke and Fire Gases Ventilation
Citation preview

Smoke and Fire GasesVenting in Large IndustrialSpaces and Stores
Division of Building ServicesDepartment of Building and Environmental TechnologyLund Institute of TechnologyLund University, 2004Report TVIT--04/3001
Polina Gordonova

Lund UniversityLund University, with eight faculties and a number of research centresand specialized institutes, is the largest establishment for research andhigher education in Scandinavia. The main part of the University issituated in the small city of Lund which has about 101 000 inhabit-ants. A number of departments for research and education are, how-ever, located in Malmö. Lund University was founded in 1666 andhas today a total staff of 5 530 employees and 34 000 students at-tending 60 degree programmes and 850 subject courses offered by 89departments.

xxxxx
1
Smoke and Fire GasesVenting in Large Industrial
Spaces and Stores
Polina Gordonova
This report relates to Research Grant No 603-971 from the Swedish Fire ResearchBoard to the Department of Building and Architecture, Lund University, LundInstitute of Technology, Lund, Sweden.

Smoke and Fire Gases Venting in Large Industrial Space and Stores
2
Keywords
Industrial fires, smoke management, smoke vent, fire flow, firepressure, fire simulation, ventilation ducts.
© copyright Polina Gordonova and Division of Building Services, Lund University,Lund Institute of Technology, Lund, Sweden, 2004
The English language corrected by L. J. Gruber BSc(Eng) MICE MIStructE
Layout: Hans Follin, LTH, Lund
Printed by KFS AB, Lund 2004
Report TVIT--04/3001Smoke and Fire Gases Venting in Large Industrial Spaces and Stores
Lund University, Lund Institute of Technology,Department of Building and Environmental Technology
ISSN 1652-6783ISBN 91-85415-00-6
Lund University, Lund Institute of TechnologyDepartment of Building and Environmental TechnologyDivision of Building Services Telephone: +46 46 - 222 73 51P.O. Box 118 Telefax: +46 46 - 222 45 35SE-221 00 LUND E-mail: [email protected] Home page: www.hvac.lth.se

Abstract
3
Abstract
The present study is focused on the problem of smoke evacuation andthe possibility of operating the fans during different fires in large spacesand buildings. Various studies on fire hazards have shown that the pre-dominant cause of hazard is smoke, not the temperatures. Managementof smoke has the primary goal of facilitating safe egress in the event offire, but it is also important in surviving property that costs more nowa-days then the cost of the building itself. Thus, the control and removal ofsmoke and fire gases from the building is a vital component in any fireprotection scheme. Smoke control and smoke management are two ma-jor ways of dealing with the problem. The purpose of smoke manage-ment is to create a smoke layer above the occupied level. According tobuilding regulations and codes in different countries this can be achievedby providing buildings with roof mounted smoke and heat openings,which are opened by fusible links and also automatically after detectingfire with the help of different types of detectors, as well as by exhaustingsmoke with roof mounted fans. In Sweden, both types of smoke ventingare recommended depending on the fire class of the space. Additionalmechanical exhaust ventilation of the fire volume, providing from fourto six air changes per hour, is also recommended. It is expected that thisrate of air flow will remove smoke at approximately the same rate as it isproduced. This system is expected to maintain the interface between thesmoke layer and the breathing zone sufficiently high above floor level forpeople to leave the space. Makeup air can be introduced mechanically orin the natural way due to the under pressure in the compartment.
However, the possibility of using the ordinary ventilation systemsduring fire development has not been studied enough and it is just begin-ning to take a proper place as a fire protection tool.
Smoke ventilation combined with the use of ordinary ventilation sys-tems and opened doors in a single space was studied. The research isbased on calculations carried out using the computer programs PFS forstatic flow calculations and SIMNON for dynamic fire simulations.

Smoke and Fire Gases Venting in Large Industrial Space and Stores
4
The combination of wind pressure on the building and the airtight-ness of the building along with opening of doors, windows in the wallsand fire vents on the roof can result in great variations in pressure. Theresults of these simulations for the steady fires and t2-fires with heat re-lease rate of 2,5 MW, 5 MW and 25MW respectively are presented. Bothunsprinklered fires and sprinklered fires were studied. Method for esti-mating the resulting pressure in a building are presented. Up-to-dateknowledge about the external airtightness of the examined buildings, andthe results of the analyses of the function of natural smoke ventilators inthe case of fire are presented.
Different solutions for the evacuation of smoke with the help of ven-tilation systems are given. Thirteen different cases have been studied.These cases comprise different combinations of opened contra closedopenings on the windward and/or leeward sides of walls, roof smokevents of different areas exposed to different outdoor temperatures andwind velocities. Those thirteen cases were integrated with thirteen differ-ent variations in operating smoke fans, ordinary ventilation systems andtheir combined operation. The main resulting parameters of the analysisare interpreted in terms of “wrong”/reversed flow through smoke ventsand a combination of different measures for smoke evacuation is supple-mented with variations in ordinary fan function.
One of the most common problems in evacuating hot smoke with thehelp of the ventilation systems is the temperature endurance of the fans.The results of different tests on fan motors operating at high tempera-tures are presented.

Contents
5
Contents
KKKKKeyworeyworeyworeyworeywordsdsdsdsds 2
AAAAAbstractbstractbstractbstractbstract 3
ContentsContentsContentsContentsContents 5
List of symbols and definitionsList of symbols and definitionsList of symbols and definitionsList of symbols and definitionsList of symbols and definitions 9
PPPPPrrrrreface and acknoeface and acknoeface and acknoeface and acknoeface and acknowledgementswledgementswledgementswledgementswledgements 13
SSSSSummarummarummarummarummaryyyyy 15
SSSSSammanfattningammanfattningammanfattningammanfattningammanfattning 23
11111 IIIIIntrntrntrntrntroductionoductionoductionoductionoduction 31
1.1 Background 311.2 Some statistics on industrial fires 32
22222 SSSSStudy of the literaturtudy of the literaturtudy of the literaturtudy of the literaturtudy of the literatureeeee 35
2.1 Databases 35
33333 HHHHHistoristoristoristoristoryyyyy 37
3.1 Smoke control and smoke management systems 383.1.1 Smoke control system 383.1.2 Smoke management system 39
44444 DDDDDesign firesign firesign firesign firesign fireeeee 43
55555 SSSSSmoke filling conceptmoke filling conceptmoke filling conceptmoke filling conceptmoke filling concept 45
66666 SSSSSome statistics on rome statistics on rome statistics on rome statistics on rome statistics on roof mounted smoke voof mounted smoke voof mounted smoke voof mounted smoke voof mounted smoke vents functionents functionents functionents functionents function 51
77777 Case studyCase studyCase studyCase studyCase study 55
88888 FFFFFactors effecting building in case of firactors effecting building in case of firactors effecting building in case of firactors effecting building in case of firactors effecting building in case of fireeeee 57
8.1 Wind pressure on the roof, form factors 588.2 Smoke layer buoyancy 608.3 Pressure rise due to expansion 618.3.1 Constant rate of rise of temperature, B (traditional case) 618.3.2 Non-constant rate of rise of temperature, B 628.3.3 Pressure rise model 63
99999 AirAirAirAirAirtightness in industrial buildingstightness in industrial buildingstightness in industrial buildingstightness in industrial buildingstightness in industrial buildings 71
9.1 Assumed airtightness 72

Smoke and Fire Gases Venting in Large Industrial Space and Stores
6
1010101010 Calculation of rCalculation of rCalculation of rCalculation of rCalculation of resulting inner presulting inner presulting inner presulting inner presulting inner pressuressuressuressuressure in the spacee in the spacee in the spacee in the spacee in the spaceexposed to wind prexposed to wind prexposed to wind prexposed to wind prexposed to wind pressuressuressuressuressureeeee 73
10.1 Model: equivalent indoor wind factor 7310.1.1 “Cold” case without fire and ventilation 7410.1.2 The general case 7610.1.3 “Cold” case without fire and with ventilation 7810.1.4 Thermal case 79
10.2 PFS-program 7910.3 Models to estimate resulting pressure in the space exposed to wind
pressure with different openings in the walls and on the roof 8010.3.1 Studied cases to evaluate the resulting pressure in the space 82
1111111111 DDDDDesign parametersesign parametersesign parametersesign parametersesign parameters 87
11.1 Design space, leakage paths, roof type and ventilation systems 8711.2 Design weather data 8711.3 Design fire 8811.4 Design smoke layer 8811.5 Design Ventilation Fans 89
1212121212 MMMMModels and toolsodels and toolsodels and toolsodels and toolsodels and tools 91
12.1 Real and schematic models of the space 9112.2 General study of principal cases 9312.3 Study of principal cases for the ordinary conditions without fire 9412.4 Study of principal cases for the fire conditions (with buoyancy)
at the indoor temperature of 400°C 9512.5 Study of cases for the fire conditions with constant ventilation flows 96
1313131313 “ R“ R“ R“ R“ Real caseeal caseeal caseeal caseeal case” study” study” study” study” study 99
13.1 Evaluation of smoke vents function in buildings ventilated byeither supply or exhaust system with different type of regulation 99
13.2 Evaluation of smoke vents function in buildings ventilated bysupply-exhaust ventilation system along with or without roofmounted smoke fan 105
1414141414 Cooling effect of sprinklersCooling effect of sprinklersCooling effect of sprinklersCooling effect of sprinklersCooling effect of sprinklers 113
14.1 Improving the function of smoke vents with the help of sprinklers 117
1515151515 MMMMMaximum temperaturaximum temperaturaximum temperaturaximum temperaturaximum temperature of differe of differe of differe of differe of different vent vent vent vent ventilation fans,entilation fans,entilation fans,entilation fans,entilation fans,vvvvventilation ducts and ventilation ducts and ventilation ducts and ventilation ducts and ventilation ducts and ventilation systemsentilation systemsentilation systemsentilation systemsentilation systems 119
15.1 Maximum temperature of ventilation fans 11915.1.1 Ball bearing 12015.1.2 Belt 12015.1.3 Motor 120
15.2 Exhaust airflow temperature and thermal endurance of a motor 12115.3 Dynamic temperature endurance of a motor 12315.4 Motors thermal endurance 12415.5 Summary 125

Contents
7
15.6 Maximum temperature of different ventilation ducts 126
1616161616 DDDDDiscussions and conclusionsiscussions and conclusionsiscussions and conclusionsiscussions and conclusionsiscussions and conclusions 129Introduction 129Computer programs 130Fire scenario and fire size 130Buoyancy 130Pressure rise due to expansion 131Airtightness in industrial buildings 131Equivalent indoor wind factor 131Design parameters 132Study of cases 132Cooling effect of sprinklers 133Improving the function of smoke vents with the help of sprinklers 134Maximum temperature of ventilation systems 134Exhaust airflow temperature and thermal endurance of a motor 135Maximum temperature of different ventilation ducts 136
Application 136Important results 136Future research 137
RRRRReferefereferefereferencesencesencesencesences 139

Smoke and Fire Gases Venting in Large Industrial Space and Stores
8

List of symbols and definitions
9
List of symbols and definitions
SymbolsUnless otherwise started, the following symbols are used throughout thisdocument:
A area, [m2]b width, [m]c specific heat of incompressible substance, [J/kg K]C flow coefficient, [-]d diameter, [m]D optical density per meter, [m-1]Ey elastic (Young’s) modulus, [N/m2]E energy, [J]f coefficient of volumetric expansion, [(m3/s)/MW]h heat transfer coefficient, [W/m2K]l length, [m]mb mass flow rate, [kg/s]p pressure, [Pa]q volume flow rate, [m3/s]Q heat rate, [kW]R resistance, [-]s visibility range, [m]t time, [s]T temperature, [°C (K)]v velocity, [m/s]V volume, [m3]z height, [m]Re Reynolds number, [-]∆M mass loss of sample, [g]

Smoke and Fire Gases Venting in Large Industrial Space and Stores
10
Greek letters
α characteristic value for a certain fire progress, [kW/s2]β thermal expansion, [K-1]η viscosity, [N s/m2]λ thermal conductivity, [W/mK]ν kinematic viscosity, [m2/s]ρ density, [kg/m3]σ thermal stress, [N/m2]∆ increment of
DefinitionsFor the purpose of this dissertation, [The SFPE Handbook of Fire Pro-tection Engineering, 7th edition] was used as the main material to de-scribe research in this domain. Nevertheless, some other terms has beenused in order to express more recent concepts. The definitions of thisdissertation are as follows:
Air leakage:The uncontrolled flow of air through a component of the building, orthe building envelope itself, when a pressure difference is applied acrossthe compartment.
Air tighteness:A general descriptive term for the air permeability resistance of a build-ing.
Building envelope:The inside of the exterior surfaces of the building.
Buoyant flow:A gas flow which is caused directly or indirectly by gravity.
Compartment fire:Fire in enclosed spaces, which are commonly thought as rooms in a build-ing.

List of symbols and definitions
11
Constrained fire:The availability of both fuel and oxygen are considered.
Fire flow:Fire gas flow caused by temperature expansion of the heated gas in thefire room in the case of fire.
Fire plume:The generally turbulent buoyant flow, which includes any flames.
Forced (mechanical) ventilation:Ventilation by means of fans.
Natural ventilation:Ventilation using only natural driving forces such as differencesin air temperature and density, wind pressure.
Overflash:The transition from a growing fire to a developed fire in which all com-bustible items in the compartment are involved in fire.
Smoke control system:Is an engineered system using fans providing pressure differences and airflows in order to limit smoke movement across barriers.
Smoke management system:Is an engineered system using different methods in order to modify ordrive smoke movement singly or in combination.
Steady fire:Fuel is burning at a constant rate.
Ventilation:The process of supplying and removing air intentionally by natural orforced (mechanical) means to and from any space.
Unconstrained fire:Fuel is burned without regard for oxygen availability.

Smoke and Fire Gases Venting in Large Industrial Space and Stores
12

Preface and acknowledgements
13
Preface andacknowledgements
Work on this thesis began in 1999 at the Department of Building Sci-ence, Lund Institute of Technology, Lund University.
I would like to express my sincere thanks to my supervisor Lars Jensenand to the staff of the Department of Building Science.
In particular, I want to thank Sven Eric Magnusson, Göran Holmstedt,Björn Karlsson, Håkan Franzich and the staff of the Department of FireSafety Engineering for their support, good ideas and help in supplyingdata and information.
I would like to express my sincere thanks to Tor Aurell, the consult-ant, who helped me in searching through certain databases.
I would also like to express my sincere thanks to Sören Samefoss andLeif-Roger Fechner from AB Åkerlund & Rausing for their help in gath-ering data on smoke venting in the company buildings.
I would also like to address my warmest thanks to the members of thereference group: Staffan Bengtsson, Sven Palmkvist, Claes Malmqvist ochHauker Ingasson for their support and long-term interest.
This work was funded by the Swedish Fire Research Board, which isgratefully acknowledged.

Smoke and Fire Gases Venting in Large Industrial Space and Stores
14

Summary
15
Summary
The following study examines the problem of smoke evacuation throughroof vents and the possibility of operating the ordinary fans during dif-ferent fires in large spaces and buildings. Various studies on fire hazardshave shown that the predominant cause of hazard is smoke, not the tem-peratures. Management of smoke has the primary goal of facilitating safeegress in the event of fire, but it is also important in surviving propertythat costs more nowadays then the cost of the building itself. Thus, thecontrol and removal of smoke and fire gases from the building is a vitalcomponent in any fire protection scheme. Smoke management is theway of dealing with the problem in the single space. There are two majortypes of smoke evacuation - roof mounted smoke and heat openings (socalled smoke vents) and roof-mounted fans. In Sweden, both types ofsmoke venting are recommended depending on the fire class of the space.The reliability of such smoke vents has been discussed in the profession.Poor operation as well as the failure of the smoke vents to open have beenoften reported. These faults depend partly on insufficient control andmaintenance and wrong control, and, partly, on complicated pressureconditions due to wind, fire, ventilation and buoyancy. Smoke vents donot manage this situation. The same factors affect the operation of smokefans. Although the problem is well known, the probability of this and theconditions which lead to such a phenomenon have not been fully exam-ined yet. However, the proper operation of roof mounted smoke ventsand the possibility of using the ordinary ventilation systems during firedevelopment have not been studied enough and they are just beginningto take a proper place as a fire protection tool.
Ordinary ventilation systems normally shut down in the event of fire.The main goal of this study is to examine the ability of roof mounted
vents to evacuate smoke and to evaluate the effectiveness of roof fans inthe single industrial or storage building. Smoke ventilation combinedwith the use of ordinary ventilation systems and opened doors for make-up air in a single space were studied.

Smoke and Fire Gases Venting in Large Industrial Space and Stores
16
The results are analyzed in terms of right/wrong airflow directionthrough the roof vents.
Whether or not smoke will be evacuated from the space is determinedby:
• the heat released by fire,• wind pressure on the space as a whole,• the operation of the sprinkler system,• the airtightness of buildings along with• the area and layout of smoke vents and openings in the walls and,
if needed,• the layout and properties of ventilation systems and roof mounted
smoke fan(s).
In this connection it is extremely significant to assess the relationshipbetween all the factors described above in order to evaluate the resultingpressure in the typical space. The point is to give recommendations ongood practice to diminish or even eliminate the risk of reversed air-smokeflow through roof vents or to replace them with roof mounted fan(s).The possibility of using the fan(s) of the ordinary ventilation system isalso taken into account in the analysis.
The research is based on calculations carried out using the computerprograms PFS for static flow calculations and SIMNON for dynamicfire simulations.
The state of knowledge and research publications in this regard havebeen searched through different databases in science and technology andvia several search programs on the Internet. In addition, current publica-tions on this matter in different scientific and technical periodicals werefollowed. As the study is interdisciplinary in nature and comprises differ-ent fields of engineering knowledge such as fire protection engineering,building services and building science, publications within both the fireprotection and building science periodicals have been followed.
Owing to the variety of different possible fire scenarios in the studiedtypes of spaces, it is necessary to evaluate those that are most probable. Inorder to assess the resulting fire mass flow, steady fires with heat releaserates of 2,5 MW, 5 MW and 25MW respectively were examined. Twodifferent ways of fire flow evaluation according to Takeyoshi Tanaka,Toshio Yamana and Heskestad are complemented with my own simpli-fied equation.

Summary
17
Some statistics on natural smoke vents in different industries in Swe-den are presented in the report. The proportion of roof mounted smokevents that opened during the control varies between 67% and 93% of thetotal number. The usual causes of the failure of smoke vents to open areanalysed and compiled in the study.
The results of these simulations for the steady fires and t2-fires withheat release rate of 2,5 MW, 5 MW and 25MW respectively are pre-sented.
The combination of wind pressure on the building and the airtight-ness of the building along with opening of doors, windows in the wallsand fire vents on the roof can result in great variations in pressure.
Evaluation of the resulting pressure is based on the analysis of all pres-sures inside and outside the examined space, such as:
• fire pressure due to expansion;• bouyancy;• wind pressure;• the cooling effect of sprinklers on the indoor temperature and,
thus, on the fire pressure and• ventilation fan pressure and the layout of the ventilation system(s).
As usual the pressure rise is described as a function of the mean tempera-ture in the space and the temperature rise.
Rate of rise of temperature, B, is assumed to be a constant value in thisequation. As a matter of fact, B (K/s) is not a constant as it also dependson heat released by the fire and, thus, on temperature rise. Analysis ofthis phenomenon is presented in the study. A model to estimate pressuredue to expansion and computer simulations for both the t2-fires and thesteady fires are introduced here. A computer program SIMNON is usedfor this purpose.
SIMNON is a computer program for the simulation of mathemati-cal, non-linear relationships between the input and output signals in asystem, as well as the integration of several dynamic subsystems into onetotal system. SIMNON is made by SSPA Systems, a group within SSPAMaritime Consulting AB. Time dependant changes in temperature, pres-sure and mass flow for steady and t2-fires with heat release rates of 1MW, 2.5 MW and 5 MW are presented in the paper.
For the purpose of this study the sizes of air leakage paths in industrialbuildings constructed in different countries are complicated. There is anessential difference in such data from one country to another. Swedishconstruction traditions and airtightness requirements differ from thosein the USA. Airtightness requirements in USA industrial spaces can befive to ten times greater than those in corresponding spaces in Sweden.

Smoke and Fire Gases Venting in Large Industrial Space and Stores
18
For the purpose of this study the size of air leakage paths for Swedishbuildings is determined by requirements in the Swedish Building Regu-lations, i.e. air leakage is assumed to be 6 m3/h, m2 relating to the surfacearea of the buildings envelope.
The resulting internal pressure determines flow direction through asmoke vent. A model evaluating this phenomenon is presented in thestudy. The resulting internal pressure determines flow direction throughthe vent. The study estimates this internal pressure as a function of aresulting internal wind factor called here equivalent indoor wind factor.A new term “equivalent indoor wind factor”, a model for its evaluationand theoretical equations are introduced in this analysis. If the equiva-lent internal wind factor is smaller than any wind factor outside close toan opening or a leakage path then there will be an inflow into the space,and if it is larger, then an outflow from the space. The equation presentedhere can only be solved analytically for two surfaces; for other surfacesnumerical methods have to be used. Analysis begins with evaluation ofthe resulting pressure in a space without fire and ventilation. Further,two more cases were studied: a fire case with some imbalance in ventila-tion.
The resulting internal pressure in a real space in case of fire, withordinary ventilation systems in operation and opened smoke vents onthe roof and openings in the walls for make-up air was examined. Ventsof different areas were tested.
The method focuses on simulation of pressure conditions around andinside a space of a certain airtightness exposed to wind at different out-door temperatures during a fire. The ordinary ventilation systems arerunning. For this purpose a computer program PFS, which treats arbi-trary flow systems, was used. This program, developed and written byLars Jensen, is based on the semi graphical circuit drawings and treatsarbitrary flow systems of any structure and layout, any media, and anyproblem: design or investigation. A “real” and a schematic models arepresented in the study. The examined space has doors in the walls formake-up air, smoke vents on the roof, roof mounted smoke fan and sup-ply and exhaust ventilation systems.
The study was made “step-by-step”:
• step 1 - “cold” case without ventilation system,• step 2 - fire case with some ventilation imbalance,• step 3 - fire case with either supply or exhaust ventilation system
in operation,• step 4 - real fire case with the ordinary supply-exhaust ventilation
system along with variations in the opening of the smoke ventsand/or roof mounted fan.

Summary
19
Different design parameters were chosen for the study. These parametersinclude
• size of the space examined, area of leakage paths, type of fan,number and area of smoke vents, smoke fan characteristics, ex-haust and supply ventilation systems, weather data, fire and smokelayer characteristics, and values of ventilation system characteris-tics,
• climatic data (outdoor temperatures, wind velocities),• fire behaviour (fire scenario, maximal heat released rate),• smoke layer parameters (height and maximal temperature),• exhaust, supply and smoke fans (fan curve).
An important parameter in this study is the cooling effect of sprinkler onthe ambient air. There are numerous studies on the interaction betweensprinklers and the operating of smoke vents. The focus of these studies issprinklers, and they analyse negative and positive claims in this connec-tion for sprinkler operation.
The most common negative claims are as follows:
• smoke vents can delay sprinkler activation and as a result can causelarge fires by diminishing gas temperatures at ceiling level,
• smoke vents can increase the number of activated sprinklers as theresult of the above presented cause,
• smoke vent flow rates can be insufficient due to diminished buoy-ancy and thus are not cost effective.
There are studies that prove the above-presented issues, and also studiesthat question them.
In this study an attempt was made to evaluate this issue inversely.Smoke vents in operation are the focus here. The cooling effect of sprin-klers on ambient air and the smoke layer seems to be the most importantexpected result to be evaluated from this point of view. The resultinglower indoor temperatures give rise to lower buoyancy values and lowerpressure due to expansion. Different studies have examined a single sprin-kler of varied capacity and the results of these studies have been pre-sented and analysed. Rregression analysis has resulted in equations. Alpert’sequation for temperature difference between the smoke layer and ambi-ent indoor air is limited to the steady fire case.

Smoke and Fire Gases Venting in Large Industrial Space and Stores
20
Another phenomenon due to the cooling effect of sprinklers on theambient air and smoke is a reversed flow through smoke vents as a resultof the indoor temperature being somewhat lower than the outdoor tem-perature. This can be expected during spring/summer.
The possibility of using a modified and upward straightened sprin-kler in order to improve the smoke-extraction function of a smoke ventis studied in the report. The problem with an upward straightened sprin-kler is that airflow slows down and stops at some range due to gravity.Water drops fall down through this upward going airflow. The result ofthis interaction is examined and presented in the study.
The possibility of using ordinary ventilation systems for smoke ex-traction is analysed in this report. The ability of the ventilation system toevacuate fire gases is limited by its own maximum service temperature.This problem was analysed here. The most characteristic parameters fordifferent parts of a motor such as windings, ball bearing, belt etc. arepresented in this study. The problem of thermal endurance of a motor isexamined with the help of three models:
• at constant mass airflow,• at constant volume airflow and• at constant pressure drop.
Analysis with constant mass airflow through the fan results in an overes-timate because under constant mass airflow conditions density is halvedand velocity doubles when temperature doubles.
Under constant volume airflow conditions the mass airflow from thefire room is underestimated because density and therefor mass airflow, aswell as pressure, are halved when temperature doubles.Analysis of the problem based on constant pressure drop assumes thatrv2 is similar both for an ordinary operation and in case of fire.
The temperature-dependent power demand of a fan is analyses herefor an uncontrolled, air-volume controlled and pressure-drop controlledventilation fan.
The report examines the static and the dynamic thermal endurance ofa motor with the help of a model.Some of the results from three different laboratory tests, with fan motorsoperating at high temperatures, are presented.
One of the ways to improve the function of smoke vents is to ensurethat pressure in a space is positive. This could be achieved by running thesupply ventilation system by displacement (not of the mixing type) only.In the case with the mixing supply ventilation, smoke may possibly spreaddown to the floor. The layout of the ventilation system could be adjusted

Summary
21
for the purpose of using it as smoke ventilation system. A simple measurein this connection is to choose an exhaust fan with a higher than usualtemperature endurance. Increasing the speed of the fan for a relativelyshort period can also be a possible measure.
Alternatively, ordinary exhaust fans may be replaced by special smokefans, the pressure loss in the exhaust ventilation plant including filter andheat exchange unit can be considerable, and the ordinary air flow can betoo low.
One more method can be to use the supply duct network for thepurpose of smoke extraction. This can be reasonable for the mixed venti-lation system but is less suitable for the ventilation system by displace-ment. In this case both ventilation ducts can be connected to one orseveral smoke fans. In this way the new airflow could be double the ordi-nary airflow.
Another opportunity is to treble the ordinary airflow by choosing asuitable smoke fan. This means that an ordinary ventilated space with anair change rate of two -/h can be ventilated in ten minutes. The size of theventilation ducts can be made somewhat bigger than in the ordinary case.
All the above cases were examined in the study. Operation of ordinaryventilation systems in combination with smoke fans and smoke vents ofvariable area, at different outdoor temperatures, is presented here. Allthese measures, applied in the design space at different outdoor climaticparameters, were studied and are presented in the report. The resultsshow that there is longer time for egress and less damage to equipmentbecause the smoke layer rises slowly due to improved smoke extinction.
The resulting parameters from simulations are airflow, pressure andpressure loss and airflow direction through a smoke vent. This providesgreater opportunities for further and more detailed analysis of pressureversus airflow conditions in a certain studied space.
The problem examined in the present study appears complex, and theassumptions, made with a certain lack of knowledge and a paucity ofempirical data, cannot diminish the uncertainty of the results obtained.The results should not therefore be interpreted as some sort of total solu-tion to the elimination of inverted smoke flow through a smoke vent, butshould be considered as a guidance and help in such types of analysis.
In this particular study a simple method and a model were examined.This method is a tool to evaluate which combination of different meas-ures for smoke management is the optimum for the particular space lo-cated at the particular site.

Smoke and Fire Gases Venting in Large Industrial Space and Stores
22

Sammanfattning
23
Sammanfattning
Projektet undersöker rökevakuering via termiska rökventilatorer ochmöjligheter att utnyttja befintliga ventilationssystem i stora industri- ochlagerbyggnader. Rökgasutvecklingen i en brinnande byggnad är en storfara och ett stort problem. Rök- och brandgaser hindrar utrymning, skadarbyggnader och dess innehåll samt försvårar släckarbetet och är farliga förbåde personer som normalt vistas i den brinnande lokalen samt förräddningspersonalen. Brandventilation rekommenderas i industri- ochlagerbyggnader av de Svenska Byggreglerna. Det finns två olika systemför brandgasventilation: ett termiskt (via brandventilatorer) och ettmekaniskt (med hjälp av brandgasfläktar). Icke fungerande eller dåligtfungerande brandventilatorer beskrivs ofta i olika rapporter. Brister ibrandventilation beror delvis på dåligt underhåll och delvis påkomplicerade vindtryck, brandtryck, ventilationstryck och termiskt tryckkring och i byggnaden. Brandventilatorerna räcker inte till. Sammafaktorer påverkar brandgasfläktsfunktion också. Trots att problemet ärvälkänt, är sannolikheten av att fenomenet inträffar och villkor som ledertill detta inte utforskat än. Normalt stänger man av befintligaventilationssystem i den brinnande byggnaden så fort branden upptäcks.Projektets syftet är att utreda hur termiska brandventilatorer, öppning avportar och befintliga ventilationssystem kan samverka för att ge bästaeffekt. Uppgiften är också att undersöka om och i så fall hur en avvägningmellan termiska brandventilatorer, brandgasfläktar och ett eventuelltförstärkt ventilationssystem skall göras. Resultat redovisas i form av andel”felfungerande” (inströmning istället för utströmning) brandventilatoreri procent.
Hur rökevakuering kommer att ske beror på
• utvecklad värmeeffekt,• vindtryck on byggnaden i sin helhet,• sprinkler,• byggnadens läckage och area av termiska brandventilatorer och
öppningar i väggar för ersättningsluft, och

Smoke and Fire Gases Venting in Large Industrial Space and Stores
24
• brandgasfläktar och ventilationssystemets egenskaper.
I detta sammanhang är det viktigt att uppskatta ett samband mellan allade ovan beskrivna typiska faktorerna för att värdera resulteraderökevakuering samt att ge rekommendationer för minskning elleruteslutning av risk för omvänt flöde via rökgasventilatorer.
Den här analysen är baserat på databeräkningar gjord med hjälp av tvådataprogram: PFS för statiska flödesberäkningar och SIMNON fördynamiska simuleringar.
Olika databaser i vetenskap och teknologi genomsöktes, vetenskapligaartiklar har genomlästs samt olika sökprogram i Internet har använts föratt skaffa information om kunskaper berörande brandgasevakuering vidhändelse av en brand. Dessutom har vetenskapliga och tekniska tidskrifterinom aktuellt ämnesområde följts.
Många olika tänkbara brandscenario i de undersökta lokaltyperna ledertill uppskattning av de mest sannolika. För uppskattningen av utveckladebrandflöde konstanta bränder med 2.5 MW, 5 MW och 25 MW utvecklatvärmeeffekt har studerats. Två olika sätt att beräkna brandflöde enligtTakeyoshi Tanaka, Toshio Yamana’s och Heskestad har kompletterats meden egen förenklad ekvation.
Statistisk uppskattning av brandgasventilatorers funktion i några utavbefintliga industrianläggningar i Sverige är presenterat i rapporten. Mellan67% och 93% av alla testade brandventilatorer har öppnats underkontrolltillfällen. Orsaker till detta har också sammanställs.
Båda t2 och konstanta brandscenario för 2.5 MW, 5 MW och 25MW och även 1 MW utvecklat värmeeffekt har studerats.
Uppskattning av de resulterande tryckförhållanden bygger på analysav olika tryck inom och omkring en brinnande anläggning såsom
• brandtryck p g a termik expansion,• bouayncy (tryckskillnad som resultat av temperaturskillnad inne
och ute),• vindtryck,• sprinklers inverkan på inre temperatur och, som foljd, på
brandtryck och• ”ventilationstryck”, d v s tryckförhållande inom anläggning p g a
ventilationsobalans skapat av fläktar.
Uppskattning av brandtryck vanligtvis görs enligt antagande om att dettaberor på medel innetemperatur, konstant ökning av temperatur ochförhållande mellan olika geometriska mått av öppningar, själva lokalenoch brandgaslager. Ökning av temperatur, B, antas vara ett konstantvärdei detta sammanhang. Parameter B är inte konstant i själva verket och i sin

Sammanfattning
25
tur också beror på brandeffektutveckling. Egen analys av detta fenomenpresenteras i rapporten. En modell för att uppskatta tryck p g aexpansionen och databeräkningar för båda konstanta och t2-bränder medhjälp av dataprogram SIMNON baserade på denna modell presenterashär.
SIMNON är ett dataprogram för simuleringar av matematiska ickelinjära problem och för koppling ihop flera dynamiska undersystem i ettsystem. SIMNON är markerat av SSPA Systems, en grupp inom SSPAMaritime Consulting AB. Tryck-, temperatur- och massflödesförändringarpresenteras för konstanta och t2-bränder med 1 MW, 2.5 MW och 5MWutvecklad brandeffekt.
För att uppskatta yttre och inre täthet av analyserade lokaler har ensammanställning av kunskap beträffande läckage av hus byggda i olikaländer genomförts. Det råder stor skillnad mellan olika länder i läckagearea av anläggningar av samma typ. Läckage area av industriellaanläggningar i USA, till exempel, kan vara fem till tio gånger större änläckage area i motsvarande byggnader i Sverige. För den här analysen,BBR 99:s krav på hur stor en icke bostadsbyggnads otäthet högst fårvara, tillämpad på hela omslutande klimatskala, antas dimensionerandeför det här projektet.
Den resulterade flödesriktningen via brandventilatorer beror på detresulterande tryckförhållandet inom anläggningen gentemot det fria.Analysen börjar med undersökningen av det resulterade trycket inomicke brinnande anläggning utsatt för vindpåverkan. En egen modell föratt uppskatta fenomenet presenteras i rapporten. En ny term ”ekvivalentinre vind faktor”, en modell och teoretiska ekvationer för dennaintroduceras här. Ifall den ekvivalenta inre vind faktorn är mindre ännågon utav yttre vind faktorer, kommer uteluft att strömma in ianläggningen genom alla sorts öppningar. Ekvationen kan tillämpasanalytiskt för två ytor, för fler ytor numeriska metoder bör användas.Ekvationen och modellen är framtagna för ett kallt fall och ventilation ibalans eller utan ventilation alls. Ytterligare två fall, ett för brandfall medventilation i balans och ett för brandfall med ventilation i obalans, harstuderats.
Det resulterande tryckförhållandet i en verklig anläggning vid händelseav en brand med ordinarie ventilationssystem i drift och öppnadebrandventilatorer på tak och portar i väggar har testats. Areor av dessaöppningar har varierats.
Arbetsmetoden bygger på att simulera tryckförhållandena kring ochinom en byggnad av viss täthet vid händelse av en viss brand utsatt förvindtryck och vissa inom- och utomhus temperaturskillnader parallelltmed fungerade befintliga från– och tilluftsventilationssystem. Detta har

Smoke and Fire Gases Venting in Large Industrial Space and Stores
26
gjorts med hjälp av beräkningsprogrammet PFS. PFS är ett statiskthalvgrafiskt datorprogram för beräkning av diverse flöde. Programmet ärskrivit och utvecklat av Lars Jensen, professor på Lunds Tekniska Högskola,Lunds universitet, Sverige. ”Verklig” och dataanpassad modell av enbyggnad presenteras i rapporten. Den studerade byggnaden har dörraroch portar för ersättningsluft, brandventilatorer på tak, brandgasfläkt ochtill- och frånlufts ventilationssystem.
Analysen är gjord enligt ”steg efter steg” principen för
• steg 1 - ett kallt fall utan ventilation,• steg 2 - ett brandfall med ventilationsobalans,• steg 3 - ett brandfall med antingen till- eller frånluftssystem i drift,• steg 4 - ett brandfall med ordinarie till- och frånluftssystem i drift
kombinerad med variationer av öppning av brandventilatorer och/eller brandgasfläkt i drift.
Ett antal dimensionerande parametrar är valda för att genomföra dennaanalys. Dimensionerande parametrar omfattar
• anläggnings parametrar (mått, läckage area, typ av tak, antal ocharea av brandventilatorer, brandfläkt, till- och frånluftssystem),
• klimat data (ute temperaturer, vindhastigheter),• brandförlopp (brandscenario, maximal utvecklad brandeffekt),• brandgaslager (höjd och maximal temperatur),• till- och frånluftsfläktar, brandgasfläkt (fläktkurva).
En viktig parameter i det studerade fenomenet är avkylnings effekt påinneluft i sprinklade anläggningar. De finns mängder av studier om sprin-klers funktion med samtidig öppning av brandventilatorer. Dessa studierär inriktade på sprinkler och de samlar och analyserar fördelar ochnackdelar med att öppna brandgasventilatorer vid fungerande sprinkler.De mest vanliga nackdelarna är att brandgasventilatorer
• kan försena tidpunkt då sprinkler sätts igång och således orsakastörre bränder tack vare minskning av temperatur under tak,
• kan bidra till ökad antal sprinkler tack vare ovan beskrivenmekanism,
• kan släppa igenom otillräckligt ventilationsflöde tack vare minskadbouayncy och brandtryck och kan bli kostnadssätt inte effektivt.
Det finns både studier som bevisar ovan nämnda påstående och somifrågasätter dem.

Sammanfattning
27
I denna studie ett försök med en omvänd analys var gjord.Brandventilators effektivitet i sprinklade anläggningar sätts i fokus här. Idet här avseendet är uppskattning av avkylningseffekt på rums temperaturvid sprinkler i drift verkar vara avgörande. De lägre resulterandetemperaturerna inom anläggning orsakar mindre brandtryck p g a ex-pansion och mindre bouayncy p g a minskad temperaturskillnad mellanbrandgaslager och det fria. Det finns ett antal undersökningar av enfungerande sprinkler med varierande kapacitet samt kartlistning avresulterade parametrar. I dessa undersökningar en rad empiriska ekvationerpresenteras. Alperts ekvation som beskriver resulterandetemperaturskillnad mellan brandgaslager och inneluft är begränsad tillen konstant brand.
Ett fenomen med omvänd flödesriktning via brandgasventilatorerorsakad av lägre inre temperaturer (som är resultat av avkylning medsprinkler) än ute temperaturer är även av intresse för den här studien.
Ett sätt att använda en modifierad och uppåtriktad sprinkler för attöka utflödet genom en brandgasventilator undersöks i studiet. Problemetmed uppåtriktad sprinkler är att luftflödet kommer att avstanna på enviss höjd över sprinkler på grund av tyngdkraften. Vattendroppar frånsprinkler kommer också att falla ner mot sprinklers huvud genom detuppåtgående luftströmmen. Hur detta skall återspeglas i utflöde genomen brandventilator presenteras i rapporten.
Möjlighet att kunna utnyttja vanliga ventilationssystem för att evakuerabort brandgaser har också studerats i analysen. Ventilationssystemetsförmåga att transportera bort brandgaser med förhöjda temperaturer kanockså begränsas av hur uthålliga själva ventilationsinstallationer är. Ensammanställning och analys av detta problem är gjort i rapporten. Demest karakteristiska parametrarna för olika delar av motorer, såsomstartanordningar, lager, remdrift m m presenteras här. Termisk uthållighetav motorer studeras med hjälp av tre modeller:
• med konstant massflöde,• med konstant volymflöde och• med konstant tryckfall.
Analys för ett fall med ett konstant massflöde genom fläkt innebäröverskattning av massflöde från brandrummet, eftersom fördubbling avtemperaturen medför en halvering av densiteten och fördubbling avhastigheten.
Konstant volymflöde innebär en underskattning av massflöde frånbrandrummet, eftersom fördubbling av temperaturen medför en halveringav densiteten och därmed också massflödet.

Smoke and Fire Gases Venting in Large Industrial Space and Stores
28
Konstant tryckfall utgår från att produkten ρv2 är lika i normal driftoch brand drift. Detta fall motsvarar ett frånluftsventilationssystem medsugkammare till vilken alla ventilationskanaler är anslutna.
Fläktens temperaturberoende effektbehov diskuteras för oreglerad,tryckreglerad och flödesreglerad fläkt.
Motors statiska och dynamiska temperaturuthållighet analyseras medhjälp av en modell.
Några slutsatser från laborationsundersökning av motors temperatur-uthålligheten från tre labbförsök diskuteras i rapporten.
Ett sätt att förbättra brandgasevakueringen genom termiska brand-ventilatorer är att skapa ett övertryck i byggnaden. Detta kan ske genomatt köra enbart tilluftsystemet om det är deplacerande och inte om-blandande, eftersom röken annars sprids ner till golvnivå.
Ett ventilationssystem kan utformas för att även kunna användas förbrandventilation. En enkel åtgärd är att välja frånluftsfläktar som tål enhögre temperatur än normalt. Möjligheter att forcera fläktar under kortaretid är också en möjlig åtgärd.
Ett alternativ kan vara att sätta in särskilda brandgasfläktar eftersomventilationsaggregatets frånluftsdel har vissa strömningsmotstånd i formav filter och återvinningsbatterier och att det normala flödet är för litet.
En tredje metod kan vara att utnyttja även tilluftkanalsystemet förbrandgasventilation. Detta kan gå bra för system med omblandande ven-tilation men passar inte för deplacerande ventilation med lågt placeradetilluftsdon. De båda kanalsystemen för tilluft och frånluft kopplas sammantill en eller flera brandgasfläktar. På detta sätt borde det nyaventilationsflödet kunna bli grovt två gånger större än det normalaventilationsflödet.
Det borde också vara möjligt att öka flödet till tre gånger det normalaflödet genom att välja en lämplig brandgasventilationsfläkt. Detta innebäratt i en lokal med normalt 2 omsättningar/h så kan hela rumsvolymenventileras ut på 10 min. Ventilationskanalsystemen kan också göras någotstörre än vad som krävs för den normala driften.
Alla de ovan beskrivna lösningar har testats i rapporten. Kompletteringav ordinarie ventilationsfläktar i drift, fungerande brandgasfläktar medöppningen av brandgasventilatorer under olika klimatiska förutsättningarpresenteras här. Alla dessa åtgärder tillämpade på en dimensionerandeanläggning under vissa dimensionerande klimatiska parametrar har testatsoch redovisats i rapporten. Resultatet bidrar till längre utrymningstider,för att brandgaslagret sjunker långsammare på grund av att brand-gasevakueringen förbättras och till att minimera korrosionsskador pådyrbar utrustning.
Sammanfattning
29
Resultat från simuleringar får man som numeriska värden för flödeoch tryck samt tecken på flödesriktning via en öppning. Detta ger störremöjligheter för ytterligare fördjupade och med detaljerade analys av tryck/flödesförhållande i konkreta studerade utrymme.
Problemet som undersöks i denna rapport verkar komplicerad ochantaganden, gjorda med viss kunskapsbrist och brist av empiriska data,kan inte minska osäkerheten av resultat. Resultaten kan, alltså, inte tolkassom en slags generell rekommendation för uteslutning av omvänt flödegenom brandventilatorer eller som en generell lösning, utan skall betraktassom en hjälp vid analyser inom detta område.
I den här studien en metod och en modell har skapats, testats ochpresenterats för att kunna optimera de bästa möjliga lösningar angåendebrandgasevakueringsåtgärder i deras helhet integrerade med an vissklimatdata.

Smoke and Fire Gases Venting in Large Industrial Space and Stores
30

Introduction
31
1 Introduction
The problem of smoke evacuating from large places and buildings hasbeen studied in different ways. Diverse studies on fire hazards have shownthat the predominant cause of hazard is smoke, not the temperatures. Aprimary goal of all smoke removal measurements is to facilitate safe egressin the event of fire. Handling of smoke is also important for fire fightingoperations and in surviving property in the event of fire. Nowadays, thecosts of the industrial equipment sensitive to smoke and soot are usuallyeven higher then the cost of the building itself. Thus, the control andremoval of smoke and fire gases from the building is a vital componentin any fire protection schemes. Smoke control and smoke managementare two major ways dealing with the problem. In cases with large volumespaces the problem is focused on physical separation of fire and smokefrom occupants within the same compartment, maintaining tenable con-ditions to leave the building safely and reducing damage of contents, andfacilitating fire fighting operations after the threat to occupants has beeneliminated. However, the possibility of using the ordinary ventilationsystems for this purpose during fire progression has not been studiedenough and it is just beginning to take a proper place as a fire protectiontool. Smoke ventilation interconnected with the use of ordinary ventila-tion systems is the major point of this study.
1.1 BackgroundAccording to building regulations and codes in different countries firesmoke evacuation from large spaces can be achieved by providing build-ings with roof mounted smoke and heat openings, which are opened byfusible links and also automatically after detecting fire with the help ofdifferent types of detectors, as well as by exhausting smoke with roofmounted fans. In Sweden, both types of smoke venting are recommendeddepending on the fire class of the space. Additional mechanical exhaustventilation of the fire volume, providing from four to six air changes per

Smoke and Fire Gases Venting in Large Industrial Space and Stores
32
hour, is also recommended. This rate of air expects to remove smokeapproximately the same rate as it is produced. This system is expected tomaintain the interface between the smoke layer and the breathing zonesufficiently high above floor level for people to leave the space. Makeupair can be introduced mechanically or in natural way due to the under-pressure in the compartment.
1.2 Some statistics on industrial firesAll statistics on the industrial fires in Sweden is based on the annualreports from the Swedish Insurance Union. There is some uncertainty inthe reported values because of the long time of the fire investigation.During all 1980’s compensatory fire damages have been increasing andreached 3,7 billion SEK in 1990. In the early 1990’s, on the contrary,diminishing of these damages was typical. From the beginning of 1996up to now the trend have changed once again and 1996 reported 30%total compensatory fire damages increasing in comparison with 1995,while 1997 reported 13% total compensatory fire damages increasing incomparison to 1996’s reports. In general, about 70% of the total firedamages reported are fire damages as a result of fires in industrial andtrade buildings. Large damages provide between 1 and 2% of the totalnumber of damages, while they are responsible for nearly 40-50% of thetotal costs. Lowest limit of large damage counted has been also changedfrom 800 million SEK in 1986, through 1 billion SEK in 1991, and upto 1,5 billion SEK in 1997. The total compensatory fire damages for 10largest industrial fires in 1994-1996 and in 1996-1997 respectively canbe shown in the Table 1.1.
Table 1.1 Total compensatory fire damages for 10 largest industrial firesin 1994-1996 and in 1996-1997 respectively. [Brand&RäddningN 6-7/97, N 6-7/98]
N Year Total compensatory firedamages, MSEK
1 1994-1996 4692 1996-1997 468

Introduction
33
A very interesting study of hidden costs in addition to compensatory firedamages made by ABB-concern is presented in Brand&Räddning NR 71999. The ABB-concern studied how much (besides costs covered byinsurance) have 19 concern’s different companies paid itself in order torepair damages caused by different fires. They called these costs “hiddencosts”. According to the results reported these hidden costs could axceedeup to 20-50% of company’s annual turnover.
Table 1.2 Results from the study of total and hidden compensatory firedamages in 8 largest companies. [Brand&Räddning NR 7 1999]
Com Annual Hidden Total Hidden Hiddenpany turnover, Costs, insurance Costs, Costs,Nr compen- % of the % of the
sation, annual totalturnover, insurance
compen-sation,
MSEK MSEK MSEK
1 2270 900 1400 40 642 1100 450 1800 41 253 780 350 1600 45 224 550 250 625 46 405 950 210 700 22 306 900 190 460 21 417 310 170 420 55 408 250 100 340 40 29
As the Table 1.2 shows, even the best insurance can not cover all damagecosts caused by the industrial fire. Hence, the real total compensatoryfire damages can be 1.2 – 1.65 times higher then those reported.
The problems that are common to all large volume spaces are: type offuel, quantity of fuel, arrangement of the fuel package, effectiveness ofthe fire sprinkler system, and ability to provide safe and timely egress.

Smoke and Fire Gases Venting in Large Industrial Space and Stores
34

Study of the literatur
35
2 Study of the literature
In order to determine the current state of knowledge regarding smokeremoval from the large spaces by all special measures along with usingordinary ventilation systems, the following study was made. The state ofknowledge and research publications in this regard have been searchedthrough different databases in science and technology and via severalsearch programs in Internet. In addition, current publications on thismatter in different scientific and technical periodicals were followed. Asthe study is interdisciplinary in nature and comprises different fields ofengineering knowledge such as fire protection engineering, building serv-ices and building science, publications within both the fire protectionand building science periodicals have been followed. The following sur-vey is written as a summary of different literature sources.
2.1 DatabasesAll in all seven major databases were searched through twice with a one-year interval. These databases are as follows:
- IBSEDEX, which covers all aspects of building services world-wide, published since 1960. It includes informationon technical books, reports, conference papers, jour-nal articles and standards,
- ICONDA, which covers the world-wide literature on all fieldsof building construction and design, energy conser-vation, civil and structural engineering, architectureand town planning, published since 1976. Sourcesof information are technical books, conference pa-pers and journal articles,

Smoke and Fire Gases Venting in Large Industrial Space and Stores
36
- COMPENDEX, which is a comprehensive interdisciplinary engineer-ing database, covering different areas of engineering,civil, energy, mechanical, environmental, etc. Sourcesof information are technical reports, conference pa-pers and proceedings, published since 1970,
- NTIS, (National Technical Information Service), which is amultidisciplinary bibliographic database. The sourcesare publications, especially unrestricted reports, onresearch, development and engineering projects,sponsored by US and non-US governments from1964 to the present,
- PASCAL, which is a multilingual, multidisciplinary, biblio-graphic data base covering the core of world litera-ture in Science, Technology and Medicine. Compu-terised since 1973, the PASCAL database now in-cludes over 11 million references,
- AIRBASE, which is the Bibliographic Database of the Interna-tional Energy Agency’s Air Infiltration and Ventila-tion Centre. It contains abstracts of articles and pub-lications relating to energy efficient ventilation andincludes topics on ventilation strategies, design andretrofit methods, calculation techniques, standardsand regulations, measurement methods, indoor airquality and energy implications. Entries are based onarticles and reports published in journals, internalpublications and research reports.
The information search showed that there are many articles on this issuetreating the problem of fire smoke evacuation from large spaces in gen-eral. Some of these are comparatively old, from the 60s and early 70s,which makes them nearly unobtainable.
Although much of the information presented concerns atria, it actu-ally applies to any large volume space, including convention centers andcovered malls.

History
37
3 History
A series of fires in high-rise buildings in 1960’s in different countries inEurope and in USA waked up attention to the problem associated withsmoke in them. Since then it has been widely acknowledged that han-dling of smoke is extremely important in surviving lives and property inthe event of fire. As modern building designs evolved, fire smoke evacu-ation became increasingly complicated, and became larger and larger fac-tor in the design of ventilation systems in buildings. At the same timerunning ordinary ventilation systems role as a fire smoke-evacuating toolin case of fires in different types of buildings increased.
Originally, the most common way of smoke venting during fires was anatural venting through windows broken at high temperatures. This wastotally uncontrolled and unpredictable way of smoke venting. Besidesthat, the fire itself in the space must be large enough and hot enough tocause collapse of the glass. Such smoke venting systems seem to be insuf-ficient in protecting of large buildings with substantial areas distant fromwindows. Such buildings were provided with roof mounted smoke andheat openings (so called smoke vents), which would be opened by fusiblelinks and also automatically after detecting fire with the help of differenttypes of detectors. Another type of smoke venting is exhausting smokewith roof-mounted fans. In Sweden, the both types of smoke venting arerecommended depending on fire class of the space. Sprinklers, which arewidely used in industrial and storage spaces could also affect detectingand, hence, smoke venting. Handling of smoke in buildings can be madewith the help of smoke control and smoke management systems.

Smoke and Fire Gases Venting in Large Industrial Space and Stores
38
3.1 Smoke control and smokemanagement systems
One should differ between the smoke control and smoke managementsystems. Although, they share a primary goal of facilitating safe egress inthe event of fire, there are essential differences between them:
• Smoke control system is an engineered system using fans provid-ing pressure differences and air flows in order to limit smoke move-ment across barriers,
• Smoke management system is an engineered system using differ-ent methods in order to modify or drive smoke movement singlyor in combination.
Besides this, fire fighting operations and reduce loss of property shouldbe facilitated.
3.1.1 Smoke control systemSmoke control system comprises all kinds of measures providingcompartmentation and exclusion of smoke and heat from selected com-partments comprising the route of egress, or imprisonment of smoke inthe compartment of origin along with maintaining tenable conditions inthe surrounding spaces. This is done by exhausting smoke from the firecompartment while supplying air to the surrounding compartments. Suchmeasures are not intended to maintain or restore tenable conditions withinthe compartment of fire origin. It is considered that reducing of initialsmoke density to such extent that it makes an exit sight visible duringsome ten or fifteen minutes to be sufficient. Complexity of smoke con-trol systems varies a lot evolving relatively simple systems replacing airvia broken windows and roof vents and more complicated systems ex-cluding smoke from all places except for fire compartment and even pres-surisation of certain places (stairwells). The aim of all measures is to sepa-rate smoke from other places excluding fire origin place, i.e. to keep smokeand occupants in a different enclosed volumes, thus providing tenableconditions for the egress and for use as a base for fire fighting operations.At the same time it means that the compartment of fire origin can befilled with smoke and so far, untenable.

History
39
3.1.2 Smoke management systemThe main goals of smoke management in large volume spaces is to physi-cally separate fire and smoke from occupants within the same compart-ment, maintaining tenable conditions to leave the building safely andreducing damage of contents, and to facilitate fire fighting operationsafter the threat to occupants had been eliminated. The purpose with thesmoke management is to create a smoke layer above the occupied level.Figure 3.1 shows the main principal of the smoke management system.
Figure 3.1 The smoke exhaust system in large spaces allows smoke to accumu-late up high, keeping occupied level clear from egress [Kenneth M.Elovitz, P.E; David M. Elovitz, P.E. 1993].
According to building regulations and codes in different countries in-cluding Sweden this can be achieved by providing buildings with roofmounted smoke and heat openings, which are opened by fusible linksand also automatically after detecting fire with the help of different typesof detectors, as well as by exhausting smoke with roof mounted fans.
According to the building regulations and codes in USA (BOCA 1987)additional mechanical exhaust ventilation of the fire volume, providingfrom four to six air changes per hour is recommended. This rate of airexpects to remove approximately the same rate as smoke produced. Thissystem is expected to maintain the interface between the smoke layer andthe breathing zone sufficiently high above floor level for people to leavethe space. Makeup air can be introduced mechanically or in natural waydue to under-pressure in the compartment. This measure is regarded tobe questionable and insufficient.
The problem with smoke management is rather complex and thereare an amount of problems to be solved. Some of the problems are:

Smoke and Fire Gases Venting in Large Industrial Space and Stores
40
• The combination of internal contra external pressures in the spacecan result in reversed/“wrong” flow direction through the smokevents. Internal pressure can be less then external pressure on theroof thus forcing outdoor air flow into the space instead of smokeevacuating.
• The velocity of makeup air has been estimated to be in order of 1m/s. Velocities higher than that may cause drawing down smokefrom the smoke layer by induction and mixing it with the ambientair. A makeup air jet with the velocity of approximately 1 m/s cancause drawing of smoke out of a smoke layer above and mixing itthroughout the space.
• ”Plugging” effect of a roof mounted smoke exhaust fan which causeclear air from below the smoke layer to be drawn up through thesmoke layer and into exhaust. This can induce smoke from thebottom of the layer down in the occupied level and mixing itthroughout the space.
• The required air change rate of 6 /h seems to be questionable (in-capable) parameter (large for large volumes and little for the littleones).
• Smoke stratification can be a problem because smoke may notreach ceiling-mounted detectors. During the summer a hot layerof air can form under the large volume space ceiling (especially inthe case with the old ceilings without sufficient insulation). Undercertain conditions a smoke plume may not have sufficient buoy-ancy to penetrate such a hot air layer due also to the fact thattemperature in the plume decreases with height.
• A sprinkler system installed in many of studied places is a com-mon measure suppressing fires. This system effects the smoke layercooling it and driving it to the floor (by the water momentum),thus effecting both the buoyancy and smoke management meas-ures. The height of the buildings makes effectiveness of fire sprin-kler protection questionable. Because of delayed response, sprin-klers may not be effective in suppressing fires in spaces with ceil-ing heights greater than 11 to 15 m (Degenkolb 1975, 1983) or incontrolling fires in atria exceeding 20 m in height (Tamura 1995).Smoke temperatures after been evaporatively cooled by sprinklerspray can be sometimes even below ambient temperatures (Lui1977). In this connection the problem of strong negative responsefrom people been immersed in any smoke regardless of its toler-able properties can be discussed.

History
41
• Localised geometric irregularities disturb the airflow and createlocal zones of turbulence, which result in unexpected smoke move-ments and mixing. Smoke discharging from the smoke exhaustfan can re-appear through makeup air, smoke at dead spots withno source of makeup air.
• In some high spaces, the smoke layer can even be allowed to growdown towards the floor as long as the smoke will not reach theoccupied level in less time than people need to leave the space.Such level can vary according to different sources.

Smoke and Fire Gases Venting in Large Industrial Space and Stores
42

Design fire
43
4 Design fire
The starting point for smoke management system is determining of thefire size. The great variety of possible fire scenarios in such spaces leads tothe necessity to describe the fire progress in more general terms.
Q t t n( ) = α W (4.1)
where Q is in W and t is in seconds, α is in W/sn and is specific for acertain fire progress. The fire can be generally considered a steady, n=0,or an unsteady fire, n >0. An unsteady fire is the fire that varies withrespect to time. A steady fire has a constant heat release rate as a result oflimitations of fuel and combustion air. The real fire is unsteady in itsnature, but the steady fire is a useful idealisation in many cases. In theabsence of specific heat release rate data it is recommended to assume asteady fire. This will result in a more conservative consequence than us-ing an unsteady fire. An average heat release rate for the design fuel areacould be estimated.
Design based on unsteady fire results in lower ventilation rates then incase with steady fire. Large spaces are usually not restricted by lack ofcombustion air. In spite of this fact the steady fire can be assumed for thepresent study. So, the designed steady fire design results in somehow over-estimated flows that are on the safe side.
Vast variations in heat release rates of fires in large spaces leads tocertain assumptions of the designed fire size.
There are some assumptions for typical spaces protected by sprinklersin different sources. In BOCA and ICBO recommends 4640 kW (afterbeen conversed from BTU units) for mercantile, storage and industrialoccupancies. In each case, the assumed fire size is 9.3 m2, which is areasonable assumption for typical spaces protected by automatic sprin-klers. This design fire is similar to recommend by Klote and Mike: 5MW, 1992. In some sources fires as large as 25 MW have been discussed.

Smoke and Fire Gases Venting in Large Industrial Space and Stores
44
The initial period of time for the fire to reach the steady heat release ratecan be questioned for different fires and spaces. Fast t-squared growth upto steady fire of 2 MW, 5 MW and 25 MW is shown in the Figure 4.1.
Figure 4.1. Fire growth for fast t-squared fires up to steady fire of 2 MW, 5MW and 25 MW [John H. Klote, 1997].
"T-squared" fires are classed after α by speed of growth, as ultra-fast, fast,medium and slow, based on the time to reach a heat release rate of 1 MW.For the purpose of this study a steady fires of 2.5 MW, 5 MW and 25MW are chosen.

Smoke filling concept
45
5 Smoke filling concept
Here, the discussions on smoke filling will be concentrated on the sim-pler problems. The concept of a smoke filling a space with a smoke ventand smoke inlet is shown in Figure 5.1.
Figure 5.1 The conceptual diagram of smoke filling with a vent at the top andan opening on the wall side [Takeyoshi Tanaka, Toshio Yamana,1985].
Both the smoke layer density ρs and horizontal section area of the spaceA and level of smoke are constant, and the fire is steady.
The simple mass balance equation yields
••••=== mmmm epd (5.1)
where
dm•
mass flow through an opening, kg/s;
pm•
mass flow of a fire plume, kg/s;
em•
mass flow through a vent, kg/s.

Smoke and Fire Gases Venting in Large Industrial Space and Stores
46
The temperature elevation of the interior surfaces that can contact withthe smoke layer is neglected.
Takeyoshi Tanaka, Toshio Yamana’s, 1985 equation for the mass fireflow is
3/53/13/12
)( zQTc
gcm
ap
am
ρ=
•
(5.2)
where
•m mass fire flow, kg/s;
Q heat release rate of fire, kW;z height of smoke layer above the fire, m;Ta air temperature, K;ρa air density, kg/m3;g acceleration due to gravity, m/s2;cm = 0.21; andcp specific heat of gas, kJ/kg K.
And after substituting of ρa, g, cm, cp and Ta =293K
3/53/10765.0 ZQm =•
(5.3)
The heat balance
)()( aswassp TTAhTTmcQ −+−=•
(5.4)
where
Q heat release rate of fire, kW;Ta air temperature, K;Ts smoke layer temperature, K;h heat transfer coefficient, kW/m2K;Aw area of the interior surface that contacts with smoke layer,
m2.
Thus, smoke layer temperature
wsp
as
Ahmc
QTT
++= • (5.5)

Smoke filling concept
47
Takeyoshi Tanaka, Toshio Yamana, 1985 proposed a trial and error methodbased on the above-mentioned equations 5.2 - 5.5 for figuring out massfire flow and temperature of the smoke layer.
Toshio Yamana and Takeyoshi Tanaka, 1985 made experiments withsteady fire with the heat release rate of 1.3 MW in a large space with floorarea of 720 m2 and 26.3 m height. Different types of venting were tested.Experiments comprised
• natural smoke filling of the space,• natural smoke venting through openings on the upper part of the
wall,• mechanical venting with exhaust flow of 6.0 m3/s (1.1 1/h), 4.5
m3/s (0.85 1/h) and 3.2 m3/s (0.6 1/h) respectively; and• lower part pressurisation with air supply rate of 20.4 m3/s (3.8 1/
h) and 23.4 m3/s (4.45 1/h) respectively.
Comparison between test results and results predicted by the above-men-tioned simple model showed comparatively good agreement. Unfortu-nately, conclusions regarding effectiveness of tested smoke control/man-agement systems could not been drawn due to initial air venting datainequality.
Some of the mass flows calculated according to above mentioned sim-ple method for the steady fires with heat release rate of 2.5 MW, 5 MWand 25 MW respectively are shown in the following Table 5.1.
Table 5.1. Mass flows for the steady fires with heat release rate of 25, 5 and2.5 MW respectively.
Smoke layer Mass flow m, kg/sheight Z, m Heat release rate, MW
2.5 5.0 25.0
1 1.0 1.3 2.22 3.3 4.1 7.14 10.4 13.1 22.56 20.5 25.8 44.28 33.1 41.7 71.3
10 48.1 60.5 103.4

Smoke and Fire Gases Venting in Large Industrial Space and Stores
48
According to the equation 5.5, smoke layer temperature Ts dependsstrongly on the area of the interior surface that contacts with smoke layerAw. For the fire in a space of a certain area the temperature depends onthe smoke layer level above the floor. For unsprinklered fires the prod-ucts of combustion are commonly in the range of 1200 K (Kenneth M.Elovitz, David M. Elovitz, 1993) while for sprinklered fires temperatureof 351 K is commonly used (BOCA, 1993).
Heskestad’s (1984) equation for the mass flow is
])(1[)( 3/50
3/22
3/50
3/11
−•
−+−= zzQczzQcm CC(5.6)
where
•m mass flow in plume at height z, kg/s;
Qc convective heat release rate of fire, kW;z height above top of fuel or height of the first indication of smokeabove the fire, m;zo virtual origin of the plume, m;c1 =0.071; andc2 =0.026.
According to John H. Klote’s (1997), the commonly used virtual origincorrection of the plume equations are not needed for large spaces smokemanagement, so the deviations of fire plume mass flow due to omittingthe virtual origin correction can be neglected (Figure 5.2).
Figure 5.2 Mass flow production with and without correction for virtual ori-gin for q=400 kW/m2 [John H. Klote, 1997].

Smoke filling concept
49
Hence, equation 5.1 becomes
CC QczzQcm 83/5
03/1
1 )( +−=•
(5.7)
where
c1 =0.071; andc8 =0.0018.
So, after substituting coefficients and zo=0
CC QzQm 00185.0071.0 3/53/1 +=•
(5.8)
Comparison between equations 5.3 and 5.8 shows, that result is nearlythe same with the assumption that in the equation 5.7 Qc=Q. The lastassumption can be questioned as the convective part of the total heatrelease rate can vary between 50 and 70% with the resulting mass flowfault of 3 and 4% respectively.
A simple picture of a building filled with smoke with a vent in theroof is shown in the Figure 5.3.
h
vρa
Ts , ρs
Figure 5.3 Building filled with smoke with a vent in the roof.
Pressure balance in this case yields
2/)( 2vhg ssa ρρρ =− (5.9)
5.0)(2
−=s
sa hgv
ρρρ
(5.10)
where

Smoke and Fire Gases Venting in Large Industrial Space and Stores
50
ρa air density, kg/m3;ρs smoke density, kg/m3;g acceleration due to gravity, m/s2;h height above the floor, m andv velocity, m/s.
Hence, mass flow
( )[ ] 5.022 AhgAvm ssas ρρρρ −==•
(5.11)
where•m mass flow, kg/s;A area of the outlet, m2
Mass fire flow increases along with increased smoke layer temperature,TS, but only if TS< 2 Ta, and decreases along with decreasing increasedsmoke layer temperature, TS, but only if TS > 2 Ta. This is illustrated inthe Figure 5.4. Meanwhile, volumetrical fire flow increases along withincreased smoke layer temperature, TS.
Figure 5.4 Mass flow fraction of maximum as a function of smoke temperatureabove ambient (SFPE 1995).
The above-presented equations for mass fire smoke flow evaluating arevery simplified and are based only on the fire itself. They pay no atten-tion to other parameters/factors influencing the studied spaces. The studyof resulted fire smoke flow out from the building through different ventsis presented further in Chapters 10-14.

Some statistics on roof mounted smoke vents function
51
6 Some statistics on roofmounted smoke ventsfunction
As it was described earlier, one of the common ways of smoke evacuationis providing building with roof mounted smoke openings/vents, whichwould be opened by fusible links and also automatically after detectingfire. There are several different types of smoke vents:
• With outwards opened two sheets (usually made of steel)• With outwards opened one sheet (usually made of tree with the
lid of steel or acrylic)• With downwards opened single hatch (usually made of tree with
the hatch of steel or acrylic)• Facade shutters (installed in facades with steel frame glass parti-
cles).
There can be mentioned several different types of opening devices:
• Melting type (opens automatically at high temperatures),• Combined melting type and magnetic type (can opens both auto-
matically at high temperatures and manual from the ground level),• Combined melting type and wire (can opens both automatically
at high temperatures and manual from the ground level).
Almost all the types could be furnished with a handle for outdoor opera-tion.
The reliability of such smoke vents has been discussed in the branch.Some study on the smoke vents function is made. With the permissionof Carl-Gunnar Jacobsson from BV-Service, certificate service of fire

Smoke and Fire Gases Venting in Large Industrial Space and Stores
52
smoke vents, Landskrona, Sweden, the following results of the naturalsmoke vents function analyses are presented in the Table 6.1. The servicecontrol of smoke vents was made in 1995-1998.
Table 6.1 Results from the natural smoke vents function study.
Company Total amount Amount of In % of totalof controlled opened smoke amount ofsmoke vents vents vents
Åkerlund and 414-428 379-388 91-93Rausing Group,Lund
Alfa-Laval AB, 107 80 75Lund
Barsebäck nuclear 75 50 67power station,Barsebäck
As the Table 6.1 shows, the amount of roof mounted smoke vents thatdid not opened during the control can reach up to 33% of the totalamount of them.
The usual cause of the smoke vents not opening are as following:
• a melting hatch is replaced with a wire,• weak opening device springs,• inertia in moving parts of an opening device,• a fixed lock (e.g. tapped when painted),• wrong steel fittings placement,• handles for outside operation have got rusty,• swallowed frame tree locks,• wrong done reparations,• opening springs have been taken down,• transport safety devices have not been taken down after delivery,• wrong installation (e.g. wrong size),• pipes, ventilation systems network, cables, etc. placed directly un-
der the downward opened smoke vents.
Many faults depend on the following:
Some statistics on roof mounted smoke vents function
53
• fire staffs lack of knowledge,• insufficient control and maintenance,• wrong made control (e.g. only manual device control without au-
tomatic function control).
Furthermore, there is lack of rules on how often the smoke vents shouldbe controlled. The only one existing recommendation in Sweden yields,that 1/6 of all smoke ventilators should be controlled every sixths month(i.e. all the smoke vents should be controlled in a three-year period). Inreality, control routine can very from the each year control to no controlat all during the lifetime. There are cases reported with no smoke ventscontrol or maintenance during 20-25 years.

Smoke and Fire Gases Venting in Large Industrial Space and Stores
54

Case study
55
7 Case study
In order to gather some data on smoke venting systems in existing largeindustrial buildings an attempt was made to contact some of the indus-tries in the Southern Sweden. Unfortunately, due to objective reasons itfailed. The only one industry that the author was able to visit wasÅkerlund&Rausing Group in Lund.
Åkerlund &Rausing Group, Lund
Ventilation system in all storage and workshops is of the supply-exhausttype. Supply ventilation is of both mixing-type and displacement typewhile exhaust ventilation is of local type with different hooks both sta-tionary and built into the process equipment. All the ventilation systemsare VAV (variable are volume) systems and are regulated after out- andindoor temperatures as well as after the technological process required airvolume. Circulation air is also used in the ventilation systems. Exhaustair from some of the workshops is cleaned before it is used as a circula-tion (return) air or before it is thrown out.
Workshops are sprinkled, there are smoke detectors in all spaces andnatural ventilators with both manual and melting type of opening forsmoke evacuation. The total area of the natural ventilators is 2% of theprotected floor area.

Smoke and Fire Gases Venting in Large Industrial Space and Stores
56

Factors effecting building in case of fire
57
8 Factors effecting buildingin case of fire
Smoke management can be interpreted as a successful smoke ventingfrom space effected by different factors in the fire case. These factors are:
• wind pressure around the whole building (the roof included),• buoyancy due to temperature difference,• fire thermal volume expansion,• ventilation pressure,• sprinklers.
Resulting buildings internal pressure is a function of all these factors.Combination of wind pressure on building and airtightness of the
building along with opening of doors, windows in the walls and smokevents on the roof can result in great variations of pressure. Different open-ings can be opened at the windward and leeward sides of building androof at the same time. In order to evaluate indoor pressure under differ-ent circumstances the following study was done.
The flow direction through any leakage or opening is determined bythe pressure difference between outside and inside. The wind creates bothover and under pressure on the surfaces that is relative to the normalpressure far off the building. The internal pressure is not equal to thisnormal pressure but mostly somewhat less. This internal under pressureoccurs for a building with even leakage distribution and due to the factthat most of the surfaces have negative wind factor and thereby underpressure. The only surfaces with the over pressure are those exposed todirect wind attack. This means for a cubic building that only one sidewill have over pressure if the wind is perpendicular to that side. Theother four surfaces (roof included) all have under pressure.

Smoke and Fire Gases Venting in Large Industrial Space and Stores
58
8.1 Wind pressure on the roof, formfactors
For large roof areas the wind can reattach to the roof downstream fromthe cavity and thus reverse the airflow in the ordinary cases. Streamlinepatterns are independent of the wind speed and depend mainly on theshape of the building and upwind conditions. The distance of approxi-mately 1.5 buildings scaling length R (m) above the roof level influencesthe flow. The roof pitch begins to affect flow when it exceeds about 15°;at 20° the flow remains attached to the upwind pitched roof and pro-duces a re-circulation region downwind from the roof ridge. In additionto the flow patterns, the turbulence of the approaching and the unsteadycharacter of the flows cause surface pressures to fluctuate. It is usual todiscuss the time-average values (the average period is about 600 s).
The peak wind pressures can be two-three times higher then the aver-age ones:
25.0 ρνµ ×=p (8.1)
where
p the local wind pressure, Pa,µ the building surface local wind pressure coefficient, -,ρ the outdoor air density, kg/m3,
(ρ=1.25 kg/m3 at ambient temperature of 10°C and oceanlevel),
ν approach wind speed at the upward height, m/s.
Values of the local wind pressure coefficient µ generally depend on thebuildings shape, wind direction, the influence of the nearby structures,vegetation, and terrain features. In order to calculate wind pressures dueto different conditions characteristically for the particular place one usesνref instead of ν in (8.1). Other factors effecting wind pressure are theheight of the building, the height over the ground and terrain features.The resulting equation is
cpp ×= µ (8.2)
where
pc the characteristic wind pressure, Pa.
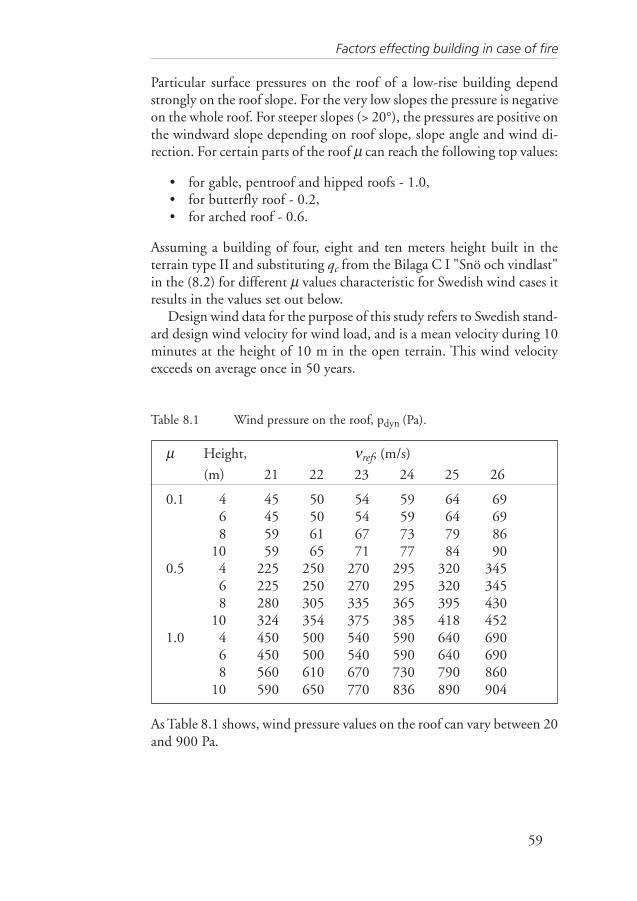
Factors effecting building in case of fire
59
Particular surface pressures on the roof of a low-rise building dependstrongly on the roof slope. For the very low slopes the pressure is negativeon the whole roof. For steeper slopes (> 20°), the pressures are positive onthe windward slope depending on roof slope, slope angle and wind di-rection. For certain parts of the roof µ can reach the following top values:
• for gable, pentroof and hipped roofs - 1.0,• for butterfly roof - 0.2,• for arched roof - 0.6.
Assuming a building of four, eight and ten meters height built in theterrain type II and substituting qc from the Bilaga C I "Snö och vindlast"in the (8.2) for different µ values characteristic for Swedish wind cases itresults in the values set out below.
Design wind data for the purpose of this study refers to Swedish stand-ard design wind velocity for wind load, and is a mean velocity during 10minutes at the height of 10 m in the open terrain. This wind velocityexceeds on average once in 50 years.
Table 8.1 Wind pressure on the roof, pdyn (Pa).
µ Height, νref, (m/s)
(m) 21 22 23 24 25 26
0.1 4 45 50 54 59 64 696 45 50 54 59 64 698 59 61 67 73 79 86
10 59 65 71 77 84 900.5 4 225 250 270 295 320 345
6 225 250 270 295 320 3458 280 305 335 365 395 430
10 324 354 375 385 418 4521.0 4 450 500 540 590 640 690
6 450 500 540 590 640 6908 560 610 670 730 790 860
10 590 650 770 836 890 904
As Table 8.1 shows, wind pressure values on the roof can vary between 20and 900 Pa.

Smoke and Fire Gases Venting in Large Industrial Space and Stores
60
8.2 Smoke layer buoyancyThe difference in pressure between the hot smoke layer and the outsidein ceiling level is
hB T
dTgp
∆ρ0= (8.3)
where
pB pressure due to buoyancy, Pa,ρo density of the ambient air, kg/m2,d depth of layer of smoke, m,Th temperature of hot layer, K and∆T temperature difference between the hot layer temperature
and temperature of ambient air, K.
Assuming a building of four, six, eight and ten meters height filled withsmoke and smoke layer temperature varying between 400 and 1200 Kand ambient temperature of 293 K results in the values set out below.
Table 8.2 Pressure as the result of buoyancy for the studied space filledwith smoke, Pa.
Height, (m) Smoke layer temperature Th, K400 600 800 1000 1200
4 13 24 30 33 366 19 36 45 50 538 25 48 60 67 71
10 31 60 75 83 89
As Table 8.2 shows pressure difference due to buoyancy varies here be-tween 13 and 89 Pa under the assumption that the whole height of thebuilding is filled with smoke. Maximal pressure due to smoke layer buoy-ancy can never exceed 12 Pa/m (for the infinite ambient temperature).For the temperature doubled from 300 K to 600 K this pressure is equalto 6 Pa /m.
It is well known that wind pressures applied to whole building can begreater than pressure due to buoyancy in many situations. Comparisonbetween the Table 8.1 and the Table 8.2 illustrates this statement applied

Factors effecting building in case of fire
61
to certain parts of the roof. Pressure due to buoyancy in smoke filledbuildings at very high inside temperatures is slightly comparable withthe lowest wind pressure values for low slope roofs and the weak windvelocities. Other wind pressure values for other combinations of slopeangle and wind speed are incomparably larger then arbitrary values ofpressure due to buoyancy. Furthermore, the above-presented case with abuilding filled with hot smoke is not appropriate for this particular re-search, as it relates to very violent phase of fire.
8.3 Pressure rise due to expansionPressure rise due to expansion can become a determining factor in in-door pressure assessment.
8.3.1 Constant rate of rise of temperature, B(traditional case)
According to The SFPE Handbook, 1995 the pressure rise is related tothe mean temperature in the space and the temperature rise by the fol-lowing equation
322 /)(500 hlcf TAAhBp =∆ (8.4)
where
B rate of rise of temperature, K/s;h height of the space, m;Ac area of the space, m2;Al area of the openings (including the leakage path), m2;Th smoke layer temperature, K.
According to SFPE 1995 the recommended value of B is equal to 4 K/s.According to the Swedish Building Codes BBR 94, the permitted leak-
age counted in leakage path's area (Gordonova P. 1998) should not ex-ceed 2.5 cm2/m2. The requirement relates to the area of the buildingenvelope. The building envelope area is defined as the area exposed to theoutside air. According to Polina Gordonova (1998), the assumption, thatthe air leakage according to BBR 94 in the compartments, hotels, officesand hotels can be applied to the whole buildings envelope, inner con-structions included, was accepted as a suitable and probable. The samelogic can be applied to the industrial buildings (in particular to the old

Smoke and Fire Gases Venting in Large Industrial Space and Stores
62
ones) as data on the airtightness of such spaces is not sufficient and thedifferences in building codes and construction traditions abroad differfrom those in Sweden.
A case with space area of 100 m2, height of 10 m and B=4 K/s (SFPE1995) was studied here. Standard leakage path in this case is equal to~0.15 m2. Larger opening, Al, of 1 m2 (half-opened standard door) wasalso studied. Pressure rise in the assumed space with leakage paths, Al, of1 m2 and 0.15 m2 respectively is presented in the Table 8.3. According toLundin L. I. 1986 "Air leakage in industrial buildings - description ofequipment" the air leakage in nine examined industrial buildings in Swe-den varied between 2.7 m3/h m2 and 10.2 m3/h m2 at pressure differ-ence of 75 Pa. This is equivalent to interval of 2.2 m3/h m2 and 8.3 m3/h m2 at pressure difference of 50 Pa.
Table 8.3 Pressure rise due to expansion during fire as a function of tem-perature rise, Pa (according to The SFPE Handbook, 1995).
Leakage Smoke layer temperature Th, Karea, m2
400 600 800 1000 1200
0.15 5555 1644 693 356 2041.0 125 37 15.6 8 4.6
As it is seen from the Table 8.3, pressure rise due to expansion decreaseswith temperature increasing.
8.3.2 Non-constant rate of rise of temperature, BAs a matter of fact, B (K/s) is not a constant. It also depends on tempera-ture rise that can be shown below
VcTTPVcPB poohph ρρ // == (8.5)
and
hooh TT /ρρ = (8.6)
The equation 8.4 can be rewritten as follows
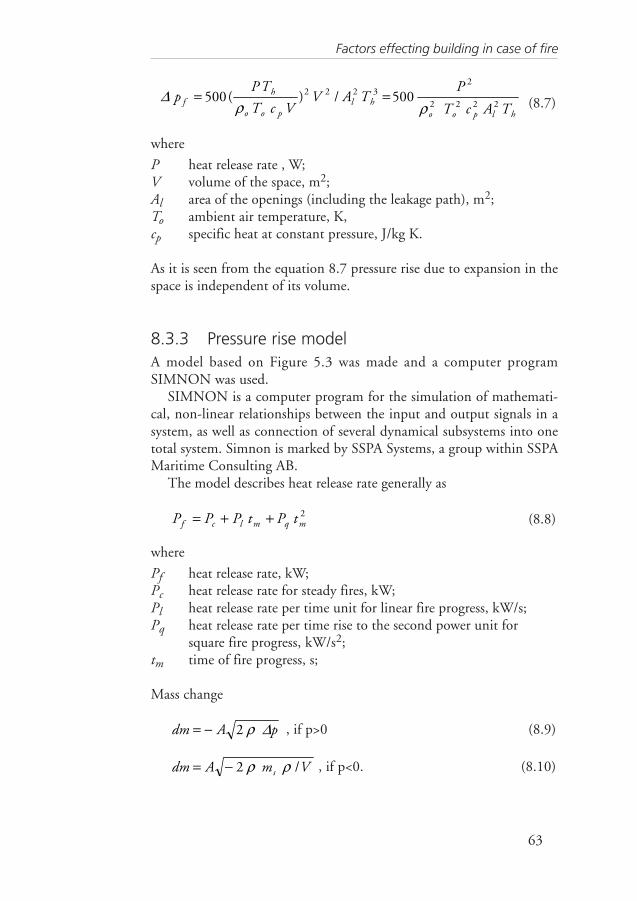
Factors effecting building in case of fire
63
hlpoo
hlpoo
hf
TAcT
PTAV
VcT
TPp
2222
23222 500/)(500
ρρ∆ == (8.7)
where
P heat release rate , W;V volume of the space, m2;Al area of the openings (including the leakage path), m2;To ambient air temperature, K,cp specific heat at constant pressure, J/kg K.
As it is seen from the equation 8.7 pressure rise due to expansion in thespace is independent of its volume.
8.3.3 Pressure rise modelA model based on Figure 5.3 was made and a computer programSIMNON was used.
SIMNON is a computer program for the simulation of mathemati-cal, non-linear relationships between the input and output signals in asystem, as well as connection of several dynamical subsystems into onetotal system. Simnon is marked by SSPA Systems, a group within SSPAMaritime Consulting AB.
The model describes heat release rate generally as
2mqmlcf tPtPPP ++= (8.8)
where
Pf heat release rate, kW;Pc heat release rate for steady fires, kW;Pl heat release rate per time unit for linear fire progress, kW/s;Pq heat release rate per time rise to the second power unit for
square fire progress, kW/s2;tm time of fire progress, s;
Mass change
pAdm ∆ρ2−= , if p>0 (8.9)
VmAdm s /2 ρρ−= , if p<0. (8.10)

Smoke and Fire Gases Venting in Large Industrial Space and Stores
64
where
dm mass flow derivative, kg/s;A area of the openings (including the leakage path), m2;ρ density, kg/m3;∆p pressure difference, Pa;tm time of fire progress, s;V place volume, m3;ms start mass, kg
Temperature change is
cm
PdT
f= , K/s (8.11)
where
dT temperature derivative, K;m mass, kg andc specific heat, kWs/kg K.
Pressure rise in the space due to expansion is
−= 1
sss T
T
m
mpp∆ (8.12)
where
∆p pressure rise due to expansion, Pa;ps start (atmospheric) pressure rise, Pa;T smoke layer temperature, K andTs start (ambient) temperature, K.
Simulations based on the above-presented model were made for both thesteady fires and t2-fires with heat release rate of 1 MW, 2,5 MW and5MW respectively in a 1000 m3 space. The simulations is interruptedwhen the temperature in the space exceeds 1200 K.
The results of this simulations of temperature rise rate, B, for the steadyfires and t2-fires with heat release rate of 1 MW, 2,5 MW and 5MWrespectively is shown in Figures 8.1 and 8.2.

Factors effecting building in case of fire
65
B (K/s)
Time, t (s)
Figure 8.1 Temperature rise rate, B, / time for different steady fires with heatrelease rate of 5 MW, 2,5 MW and 1 MW respectively counteddownwards.
B (K/s)
Time, t (s)
Figure 8.2 Temperature rise rate, B, / time for different t2 fires with heat re-lease rate of 5 MW, 2,5 MW and 1 MW respectively at 300 scounted downwards.

Smoke and Fire Gases Venting in Large Industrial Space and Stores
66
As it is seen from Figures 8.1 and 8.2 B exceeds 17 K for both steadyand t2-fires. Velocity of temperature rise rate, as it is expected, is lowerfor t2-fires. This observation will be discussed further in the presentsubchapter in terms of resulted pressure rise due to expansion.The resultsof simulations of pressure rise for the steady fires with heat release rate of1 MW, 2,5 MW and 5MW respectively is shown in Figure 8.3 (Al =0.15m2) and Table 8.4 (Al =0.15 m2 and Al =1 m2).
Pressure, p (Pa)
Time t (s)
Figure 8.3 Pressure change / time for different steady fires in the studied spacewith leakage area of 0.15 m2 with heat release rate of 5 MW, 2,5MW and 1 MW respectively counted downwards.
Table 8.4 Pressure rise during fire with heat release rate of 5 MW as afunction of temperature rise, Pa (according to the model).
Leakage Smoke layer temperature, Karea, m2
400 600 800 1000 1200
0.15 4000 2700 1900 1500 13001.0 100 50 40 25 10
As it can be seen from the Table 8.3 and Table 8.4 there is one commoncharacteristic trend in pressure behaviour during a steady fire, i.e. thepressure reduction. However, the pressure values differ - lower in the

Factors effecting building in case of fire
67
dynamic model case then in the static case and the velocity of pressurereduction is less in the dynamic model case according to the equation8.12 as in the comparison with the static model. These can depend onthe more precise estimation of the fire progress in a space, where chang-ing temperature velocity is counted.
Some more results concerning pressure/temperature changes in thedesigned space are presented in Figures 8.4 and 8.5.
Pressure p (Pa)Temperature T (K)
Time t (s)
Figure 8.4 Pressure and temperature change / time for a steady fire with heatrelease rate of 5 MW and leakage area of 0.15 m2.

Smoke and Fire Gases Venting in Large Industrial Space and Stores
68
Pressure p (Pa)Temperature T (K)
Time t (s)
Figure 8.5 Pressure and temperature change / time for a steady fire with heatrelease rate of 5 MW and leakage area of 1.0 m2.
One more simulation was made for the case with a “real” design indus-trial building in Sweden of 100x100x10m with standard even distrib-uted leakage area of 3.5 m2 and for a fire with heat release rate of 5 MW,2,5 MW and 1 MW. Resulting pressure change is presented in the Figure8.6.
As it is seen from the above-presented simulations for a “real” indus-trial building in Sweden of 100x100x10m with leakage area of 3.5 m2
even distributed, the peak pressures expected here are essentially smallerthen in the “little” space (Figure 8.3). Peak pressures reach 900 Pa, 230Pa and 40 Pa for the fires with heat release rate of 5 MW, 2,5 MW and 1MW respectively.
In order to compare pressure rise and mass change out of a room forthe designed space a simulation for t2-fires with the similar heat releaserates was made. The results are presented in the Figure 8.7.
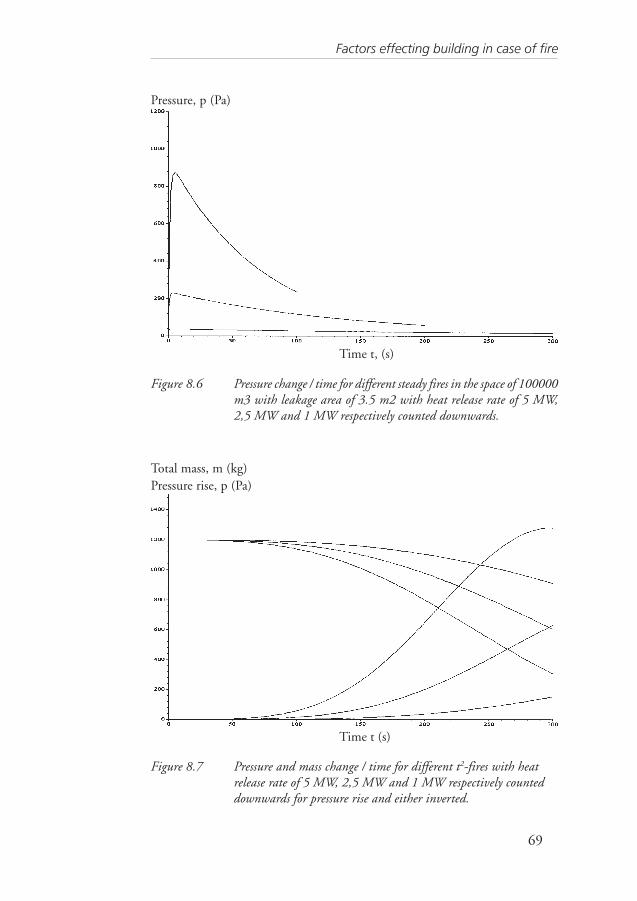
Factors effecting building in case of fire
69
Pressure, p (Pa)
Time t, (s)
Figure 8.6 Pressure change / time for different steady fires in the space of 100000m3 with leakage area of 3.5 m2 with heat release rate of 5 MW,2,5 MW and 1 MW respectively counted downwards.
Total mass, m (kg)Pressure rise, p (Pa)
Time t (s)
Figure 8.7 Pressure and mass change / time for different t2-fires with heatrelease rate of 5 MW, 2,5 MW and 1 MW respectively counteddownwards for pressure rise and either inverted.

Smoke and Fire Gases Venting in Large Industrial Space and Stores
70
As it is seen from the Figure 8.7, it takes longer time for a t2-fire toproduce high pressure in the burning space in comparison with steadyfires with the same heat release rate. The trend in pressure development ishowever the same: pressure increases during some time and then beginsto decrease. Mass flow decreases during fire.
In order to evaluate pressure in the burning building wind pressureincluded, the following study was done.
Resulting pressure in a building effected by the wind with combina-tion of opened smoke vents and windows/doors on the windward and/orleeward sides of the space along with fire pressure and/or buoyancy canbe estimated with the help of the following method.
The problem is not linear and the computer program PFS was used asa tool. General description of the PFS is presented in subchapter 10.2.

Airtightness in industrial buildings
71
9 Airtightness in industrialbuildings
Airtightness as a concept and as typical values for small buildings wasdiscussed in Gordonova (1998). The analysis furthermore describes thisproblem for the large spaces.
The expansion of gas caused by heat released during the fire increasesthe pressure in the compartment and drives some gas out of the roomthrough leakage paths. All openings through which gas flows out arecalled vents. If a window is open in the room of fire origin little flowoccurs through the remainder of the building. When doors and windowsare closed and there are no ventilation openings, flow will move towardscracks and leaks wherever they may be in the room. All these flows areinitially nonbuoyant. As the fire grows, hot gas flows buoyantly out ofthe place of origin, while cold gas flows in below. To evaluate gas flux(mass flow) out of the burning room and pressure circumstances in theroom with the help of the simulation programs, it is essential to knowthe sizes of such vents.
Air leakage occurs as a consequence of building design, workmanshipand materials used. The amount of air leakage depends on the magnitudeof the driving forces in combination with the size and shape of the leak-age paths. In the normal case, these driving forces are pressure differencesacross the structure, temperature differences between the inside and out-side of the structure and, if there is one, the ventilation system.
For new non-residantial buildings, the standard requirements speci-fied in Swedish Building Regulations, BBR 94, must be followed. Ac-cording to BBR 94, air infiltration should not exceed 1.6 l/s,m2 (6 m3/h,m2) for these types of buildings at 50 Pa pressure difference. This re-quirement relates to the area of the building envelope. The building en-velope area is defined as the area exposed to outside air.
The objective of this evaluation is to summarise knowledge about thereal magnitude of leakage for the industrial and large spaces, built atdifferent times.

Smoke and Fire Gases Venting in Large Industrial Space and Stores
72
In different investigations, made both in Sweden and abroad, the prob-lem of air leakage in different houses was analysed and air infiltrationunder different conditions was measured (Andrew K. Persily, 1999). Thisparticular study presented air tightness data from a number of differentstudies as well in Sweden as abroad. The studies of the US industrialbuildings relate to comparatively newly built houses of mean age of ap-proximately 25 years. The age of buildings in the corresponding Swedishstudy was not available. In the Table 9.1 summary of air tightness datafor the studied industrial buildings is presented.
Table 9.1 Summary of airtightness data.
Air leakage at 50 Pa, m3/h, m2
Dataset Mean Standard Minimum Maximumdeviation
Industrial, 4.65 2 2.2 8.3SwedenIndustrial, 33.8 21.77 10.3 79.3US
As it is seen from the table, Swedish construction traditions and airtight-ness requirements differ from those in the USA. All the presented airleakage in Swedish constructions converted into units of l/s,m2 showgood agreement with those required by the Swedish building codes.
A little bit older data for halls with steel building constructions ispresented in Arne Elmroth’s (1985). Mean air leakage in this study was4.3 m3/h, m2 at the pressure difference of 50 Pa.
9.1 Assumed airtightness
For the purpose of this study the size of air leakage paths for Swedishbuildings is determined by requirements in the Swedish Building Regu-lations, i.e. air leakage is assumed to be 6 m3/h, m2 relating to the area ofthe building’s envelope. In order to have large-scaled outline, the casebased on the above presented air leakage in the industrial buildings in theUSA is studied. For this case air leakage of 60 m3/h, m2 relating to thearea of the building envelope is chosen.

Calculation of resulting inner pressure in the space ...
73
10 Calculation of resultinginner pressure in the spaceexposed to wind pressure
Resulting pressure in a space in case of a fire is effected by different pres-sures due to buoyancy, thermal expansion of indoor air and wind pres-sure on the building. The study presented in this chapter estimates thisinternal pressure as a function of resulting internal wind factor calledhere equivalent indoor wind factor. The resulting internal pressure deter-mines flow direction through it. The study was made step-by-step:
– for the “cold” case without fire and ventilation,– for the “cold” case without fire and with ventilation,– for the fire case with somewhat ventilation unbalance.
10.1 Model: equivalent indoor wind factorThe flow direction for any leakage or opening is determined by the pres-sure difference between outside and inside. The wind creates both overand under pressure relative to the normal pressure far off the building.The internal pressure is not equal to this normal pressure but mostlysomewhat less. This internal under pressure occurs for a building witheven leakage distribution and due to the fact that most of the surfaces hasnegative wind factor and thereby under pressure. The only surfaces withthe over pressure are those exposed to direct wind attack. This means fora cubic building that only one side will have over pressure if the wind isperpendicular to that side. The other four surfaces (roof included) allhave under pressure.

Smoke and Fire Gases Venting in Large Industrial Space and Stores
74
Building internal pressure is a function of the external wind pressureon building surfaces. Combination of wind pressure on building andairtightness of the building along with opening of doors, windows in thewalls and fire vents on the roof can result in great variations of pressure.Different openings can be opened at the windward and leeward sizes ofbuilding and roof at the same time. In order to evaluate indoor pressureunder different circumstances the following model was done.
10.1.1 “Cold” case without fire and ventilationAssume a building with a single space and n surfaces with wind factor mjand leakage area of Aj, where index j=1,n. All outside external pressuresrelative to a point far off the building can be stated as
cjj pp µ= (10.1)
where
pc the characteristic wind pressure calculated as the dynamic
pressure of the wind with the characteristic velocity vc .
2/2cc vp ρ= (10.2)
The inside internal pressure pi is defined as
cii pp µ= (10.3)
with its equivalent wind factor µi which is unknown and has to be calcu-lated.
If the equivalent internal wind factor µi is less than any wind factoroutside close to an opening or a leakage path then there will be an inflowinto the space, and if larger, then an outflow from the space.
Each leakage flow qj independently of its direction can now be calcu-lated assuming that the pressure drop for a leakage or an opening area isequal to the dynamic pressure for the flow velocity
jjj Aqv /= (10.4)
A positive flow qj is defined as an inflow into the building.This gives the relation
2/)(2/ 22cijj vv µµρρ −= (10.5)

Calculation of resulting inner pressure in the space ...
75
The flow qj and the velocity vj can be calculated regarding the sign asfollows
cijjjjj vfAvAq )( µµ −== (10.6)
where the function f(x) = f(µj-µi) with x = µj-µiis defined as
<−−
=>
=
0
00
0
)(
xx
x
xx
xf(10.7)
The total leakage balance flow q(µi) can be stated as the sum of all leak-age flows which are a function of the internal wind factor µi
∑=
−=n
jcijji vfAq
1
)()( µµµ (10.8)
The densities are equal for inflows but can differ somewhat for outflows.For the sake of simplicity, the densities in the equation 10.8 are assumedto be equal.
For an unventilated building the total leakage flow q(µi) has to be zero(flow balance). This gives a possibility to solve the internal wind factorµi. The equation 10.8 can only be solved analytical for two surfaces (n=2),else numerical methods have to be used.
Assume a case with only two wind factors µa and µb and the corre-sponding areas Aa and Ab which could be sums of leakage areas with thesame wind factor. Assume the leakage inflow and outflow is equal to q.The two pressure relations for the flow q in leakage or opening a and bbecomes
22
22)(
=−
a
cia A
qv ρρµµ (10.9)
22
22)(
=−
bbi A
qv c ρρµµ (10.10)
The equivalent inside wind factor becomes then
22
22 )(
ba
bbaai
AA
AA
++
=µµ
µ (10.11)

Smoke and Fire Gases Venting in Large Industrial Space and Stores
76
Assuming that µb= 0 and µa= 1 this can be shown with the help of Figure10.1.
µi
Aa/(Aa+Ab)
Figure 10.1 The equivalent internal wind factor as a function of envelope ar-eas.
ExampleAssume a cubic building with side area of 1 and with only one windwardside with the wind factor of 0.8 and remaining four other sides with thewind factor of –0.4. The internal wind factor becomes then
33.0)41/()4.048.0( 22 −=+×−=iµ
10.1.2 The general caseThe general case with more then two surfaces has to be solved numeri-cally by a simple interval reduction scheme. The “µi” must be limited bythe minimum and maximum wind factors, which gives
)(maxmax jµµ = (10.12)
)(minmin jµµ = (10.13)

Calculation of resulting inner pressure in the space ...
77
Compute the middle value of the search interval (µmin, µmax) as
2/)( minmax' µµµ += (10.14)
Calculate the total flow balance q(µ ´) and update the search interval asfollows. Flow in/out in the building, q
if 0)( ' >µq , then 'min µµ = (10.15)
if 0)( ' <µq , then 'max µµ = (10.16)
What pressure can one expect inside the building - negative or positive?If µ' = 0, so
if 0)0( <q , then µi<0 negative pressure, as expected
if 0)0( >q , then µi>0 positive pressure, and
jjij Avq µΣ=)0(
ExampleAssume the layout of a building with a flow balance as it is presentedbelow. Assuming that area of one side of the space is equal to Aa with µa,while each of three other sides has area Ab with µb
Aa µa
Ab µb
Ab µb
Ab µb
3q q
q
µi
q
then
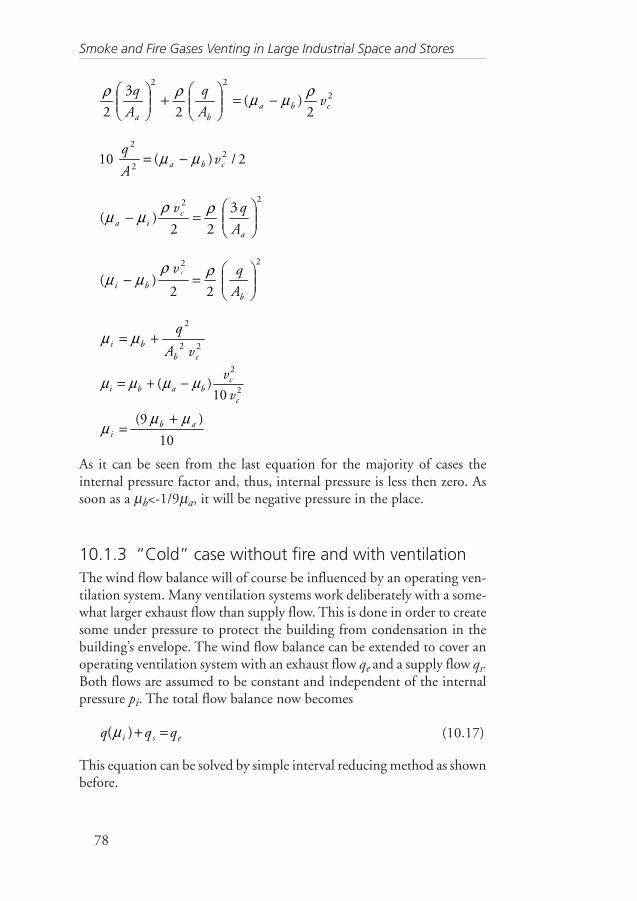
Smoke and Fire Gases Venting in Large Industrial Space and Stores
78
2
22
2)(
2
3
2 cbaba
vA
q
A
q ρµµρρ −=
+
2/)(10 22
2
cba vA
qµµ −=
22 3
22)(
=−
a
cia A
qv ρρµµ
22
22)(
=−
bbi A
qv c ρρµµ
22
2
cbbi
vA
q+= µµ
10
)9( abi
µµµ
+=
As it can be seen from the last equation for the majority of cases theinternal pressure factor and, thus, internal pressure is less then zero. Assoon as a µb<-1/9µa, it will be negative pressure in the place.
10.1.3 “Cold” case without fire and with ventilationThe wind flow balance will of course be influenced by an operating ven-tilation system. Many ventilation systems work deliberately with a some-what larger exhaust flow than supply flow. This is done in order to createsome under pressure to protect the building from condensation in thebuilding’s envelope. The wind flow balance can be extended to cover anoperating ventilation system with an exhaust flow qe and a supply flow qs.Both flows are assumed to be constant and independent of the internalpressure pi. The total flow balance now becomes
esi qqq =+)(µ (10.17)
This equation can be solved by simple interval reducing method as shownbefore.
2
2
10)(
c
cbabi v
vµµµµ −+=
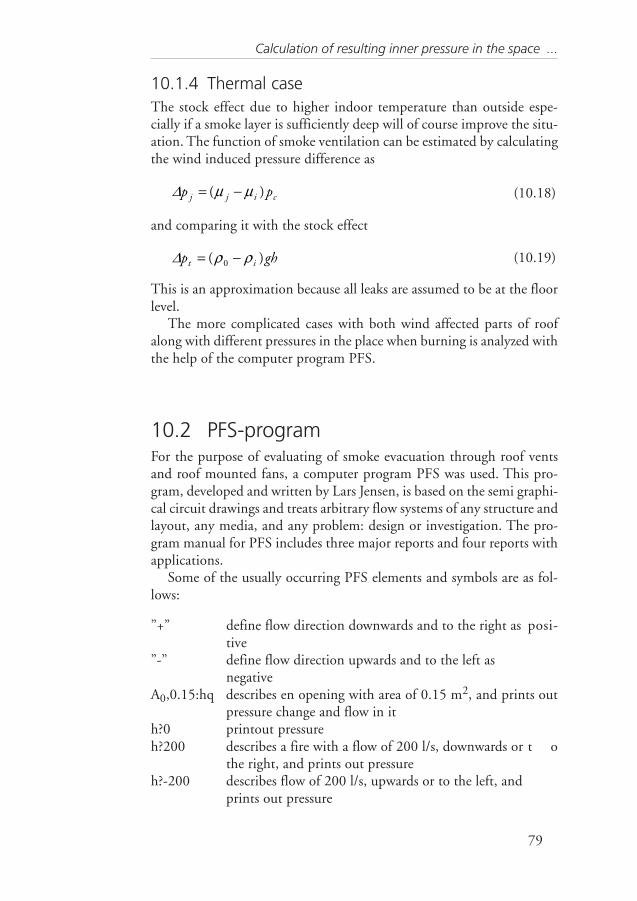
Calculation of resulting inner pressure in the space ...
79
10.1.4 Thermal caseThe stock effect due to higher indoor temperature than outside espe-cially if a smoke layer is sufficiently deep will of course improve the situ-ation. The function of smoke ventilation can be estimated by calculatingthe wind induced pressure difference as
cijj pp )( µµ∆ −= (10.18)
and comparing it with the stock effect
ghp it )( 0 ρρ∆ −= (10.19)
This is an approximation because all leaks are assumed to be at the floorlevel.
The more complicated cases with both wind affected parts of roofalong with different pressures in the place when burning is analyzed withthe help of the computer program PFS.
10.2 PFS-programFor the purpose of evaluating of smoke evacuation through roof ventsand roof mounted fans, a computer program PFS was used. This pro-gram, developed and written by Lars Jensen, is based on the semi graphi-cal circuit drawings and treats arbitrary flow systems of any structure andlayout, any media, and any problem: design or investigation. The pro-gram manual for PFS includes three major reports and four reports withapplications.
Some of the usually occurring PFS elements and symbols are as fol-lows:
”+” define flow direction downwards and to the right as posi-tive
”-” define flow direction upwards and to the left asnegative
A0,0.15:hq describes en opening with area of 0.15 m2, and prints outpressure change and flow in it
h?0 printout pressureh?200 describes a fire with a flow of 200 l/s, downwards or t o
the right, and prints out pressureh?-200 describes flow of 200 l/s, upwards or to the left, and
prints out pressure

Smoke and Fire Gases Venting in Large Industrial Space and Stores
80
h,100:q describes pressure of 100 Pa and prints out flowh,ps describes pressure of ps Pa, computed before and prints out
flowh?:q describes boundary case conditions and prints out pressure
and flow in a roomq,0 describes boundary case’s zero flows,value describes some initial flow for calculation, which
facilitates convergenceFF:hq< describes a fan with flow direction upwards and to the left,
and prints out pressure change and flow produced by thisfan
FF:hq> describes a fan with a flow direction downwards and to theright, and prints out pressure change and flowproduced by this fan
t,10,50:q describes an unit with quadratic pressure loss of 10 Pa atflow of 50 l/s and prints out flow
d,200,6 describes 6 m long ventilation duct of 200 mmdiameter
UD notation for outdoor air intakeTD notation for transfer air device:t resulting inner pressure in the studied space.
10.3 Models to estimate resulting pressurein the space exposed to wind pressurewith different openings in the wallsand on the roof
Typical values for a wind blowing perpendicular to one side of an iso-lated, low, square building with a flat roof (Figure 10.2) is recommendedby the SFPA Handbook of Fire Protection Engineering to be +0.7 towindward, -0.5 on the sides.

Calculation of resulting inner pressure in the space ...
81
Figure 10.2 Square coefficients for an isolated, low, square building [The SFPAHandbook of Fire Protection Engineering].
The corresponding “schematic”-layout of a space with one windwardwall, three leeward walls and windward half of the roof and leeward halfof the roof is presented in Figure 10.3.
Windward wall
Three leeward walls
Winward part of the roof
Leeward part of the roof
Figure 10.3 The “ schematic ” layout of the space
For the case of this study, the positive values for roofs are of interest. Forpitched roofs one side (windward) would be 0.2, while the other one -0.2.
The corresponding PFS-layout of a building presented above with theordinary leakage paths of 1.5 cm2/m2 exposed to different wind pres-sures at the wind speed of 5 m/s is presented in Figure 10.4.

Smoke and Fire Gases Venting in Large Industrial Space and Stores
82
begin my1w.1a1parameter r=1.25 v=5parameter m1=0.7 m2=-0.4 m3=-0.4 m4=-0.4 m5=0.2 m6=-0.2compute pv=r*v*v/2compute p1=m1*pvcompute p2=m2*pvcompute p3=m3*pvcompute p4=m4*pvcompute p5=m5*pvcompute p6=m6*pvset Ao=t,0.6
end
Figure 10.4 PFS-layout of the schematic model. (Se page 77).
10.3.1 Studied cases to evaluate the resulting pressurein the space
Six cases were studied:
– with closed doors, inlet openings and smoke vents,– with opened smoke vent of 1 m2 on the leeward roof side– with opened smoke vent of 1 m2 on the windward roof side– with opened smoke vents of 1 m2 each on the both leeward and wind-
ward roof sides– with opened smoke vents of 1 m2 each on the both leeward and wind-
ward roof sides plus an opened door of 1 m2 on the windward wall– with opened smoke vents of 1 m2 each on the both leeward and wind-
ward roof sides plus an opened door of 1 m2 on the leeward wall
All the studied cases are presented in Table 10.1

Calculation of resulting inner pressure in the space ...
83
Table 10.1 List of the studied cases
Cases Doors Inlet openings Smoke vents
1 Closed Closed Closed2 Closed Closed 1 m2 on the leeward side3 Closed Closed 1 m2 on the windward side4 Closed Closed 1 m2 each on the windward
and leeward sides5 1 m2 on the Closed 1 m2 each on the windward
windward wall and leeward sides5 1 m2 on the Closed 1 m2 each on the windward
leeward wall and leeward sides

Smoke and Fire Gases Venting in Large Industrial Space and Stores
84
begin my1w.1a1parameter r=1.25 v=5parameter m1=0.7 m2=-0.4 m3=-0.4 m4=-0.4 m5=0.2 m6=-0.2compute pv=r*v*v/2compute p1=m1*pvcompute p2=m2*pvcompute p3=m3*pvcompute p4=m4*pvcompute p5=m5*pvcompute p6=m6*pvset Ao=t,0.6
Case 1All openings are closed (airtighteness is 15 cm2/m2)
Case 2All openings are closed besides on the leeward roof side (airtighteness is15 cm2/m2)
Case 3All openings are closed besides windward roof side (airtighteness is 15cm2/m2)
Case 4All openings are closed besides two openings on the both windward andleeward roof sides (airtighteness is 15 cm2/m2)
Case 5All openings are closed besides one opening in the windward wall and twoopenings on the both windward and leeward roof sides (airtighteness is 15cm2/m2)
Case 6All openings are closed besides one opening in the leeward wall and twoopenings on the both windward and leeward roof sides (airtighteness is 15cm2/m2)
end
Figure 10.5 PFS-layout of the schematic model.

Calculation of resulting inner pressure in the space ...
85
begin c:\bind\my1.1a1parameter r=1.25 v=5parameter m1=0.7 m2=-0.4 m3=-0.4 m4=-0.4 m5=0.2 m6=-0.2compute pv=r*v*v/2 = 15.625000compute p1=m1*pv = 10.937500compute p2=m2*pv = -6.250000compute p3=m3*pv = -6.250000compute p4=m4*pv = -6.250000compute p5=m5*pv = 3.125000compute p6=m6*pv = -3.125000set Ao=t,0.6
Case 1All openings are closed (airtighteness is 15 cm2/m2)
Case 2All openings are closed besides leeward roof side (airtighteness is 15cm2/m2)
Case 3All openings are closed besides leeward roof side (airtighteness is 15cm2/m2)
Case 4All openings are closed besides two openings on the both windward andleeward roof sides (airtighteness is 15 cm2/m2)
Case 5All openings are closed besides one opening in the windward wall and twoopenings on the both windward and leeward roof sides (airtighteness is 15cm2/m2)
Case 6All openings are closed besides one opening in the leeward wall and twoopenings on the both windward and leeward roof sides (airtighteness is 15cm2/m2)
end 1 6 problems 78 elements 0 errors 0 warnings 2000-09-14 16.12.02
Figure 10.6 PFS-result of the schematic model.

Smoke and Fire Gases Venting in Large Industrial Space and Stores
86
Parameter “:t” shows resulting inner pressure in the studied space. Itsvalue varies from under pressure of –3.1 Pa to over pressure of 2.5 Padepending on place and area of opening.
As this study shows, a single opening can change the internal pressurecompletely. Wind factor is mostly negative which also means that theequivalent internal wind factor is negative and can be less then windfactor over the roof. This means that smoke ventilation will not functionas designed.

Design parameters
87
11 Design parameters
For the purpose of this study design parameters should be estimated.These parameters include space examined, weather data, fire and smokelayer characteristics, and values for ventilation systems.
11.1 Design space, leakage paths, roof typeand ventilation systems
Size 100×100×10 m3.
Air leakage area 3.5 m2.
Roof type Gable, pentroof, hipped, butterfly, arched(windward side µ=0.2, leeward side µ=-0.2).
Ventilation systems Smoke vents, exhaust, supply, smoke fan(combination).
11.2 Design weather data
There are little weather data for the design of smoke control and smokemanagement systems. For the purpose of this study some extreme out-door temperatures and extreme wind velocities are chosen as the validparameters. Such low (winter case)/high (summer case) outdoor tem-peratures as well as extreme wind velocities occur for short periods oftime. However, they can cause problems with smoke management, asthere is no time lag for smoke dealing systems. Problems from stack ef-fect wintertime and reverse stack effect summertime may result. For thatreason, outdoor temperatures of -20°C, 0°C and 20°C are chosen in this

Smoke and Fire Gases Venting in Large Industrial Space and Stores
88
study. Extreme wind velocity of 25 m/s is chosen as the max referencewind velocity. The above presented assumption coincide with the 1999ASHRAE Handbook, Heating, Ventilation and Air-Conditioning Ap-plications, Chapter 51, where extreme outdoor winter and summer tem-peratures and extreme wind data are recommended as design parametersfor smoke management. Such data presented in 1997 ASHRAE Hand-book, Fundamentals is very close, if not the same, to the values assumedhere.
Along with these extreme parameters, more usual temperature of 0°Cand wind velocities of 5 and 10 m/s were also tested.
11.3 Design fireIdeally the design fire should show the physical size and heat output ofthe fire increasing with time, allowing the threat to occupants to be cal-culated as time increases. The variety of variations of fire growth curvesmakes it practically impossible to choose a reasonable fire size and firegrowth velocity. Hence, the steady fire of some maximum size a fire canbe expected to reach during the escape period seems to be a reasonableassumption here. A vast variations in heat release rates of fires in largespaces leads to certain assumptions of the designed fire size. The fire sizechosen here is similar to recommended by Klote and Mike: 5 MW, 1992.
Fire type Steady fire
Released Heat Rate 5 MW
11.4 Design smoke layer
Temperature 400°CDepth of layer (under the roof ) 6 m

Design parameters
89
11.5 Design Ventilation FansAn average characteristic air change rate of 2 1/h with correspondingairflow of 60 m3/s is chosen for the study. Hence, design ventilation fanshave the following capacity:
Supply fan 60 m3/s at 444 PaExhaust fan 60 m3/s at 444 Pa
Both the exhaust and supply ventilation systems have duct network. Theabove-presented parameters were chosen according to average fan capac-ity for ventilation systems of this size.
Additional mechanical exhaust ventilation should provide airflow ap-proximately the same rate as smoke produced. For the heat released rateof 5 MW the maximum expected fire flow never exceeds 15 m3/s. Thisairflow is a maximum theoretically possible airflow due to expansionunder assumption that all heat released warms the air volume in space.As a matter of fact, heat loss due to convection, radiation, etc can vary alot. The most realistic value of such losses can vary from 70% to 50%.Hence, the expected fire flow due to expansion can vary from 5 m3/sthrough 10 m3/s to 15 m3/s. For the study en average value of 10 m3/s ischosen. Design smoke fan has following capacity:
Smoke fan 10 m3/s at 60 Pa.
The above-presented parameters were chosen according to average fancapacity for ventilation systems of this size.

Smoke and Fire Gases Venting in Large Industrial Space and Stores
90

Models and tools
91
12 Models and tools
The study presented in these chapter estimates the resulting internal pres-sure in terms of flow direction in/out via smoke vents.An analysis of the schematic models, evaluation of the wrong/rightfunction of smoke vents in the studied space with/without fire and withrunning/non-running ordinary ventilation systems is presented in thischapter.
12.1 Real and schematic models of thespace
The main principals of describing the fire space with openings on theleeward and windward parts of the walls and the roof along with therunning ventilation system(s), and its analyses are presented in this chap-ter. The real and schematic layouts of the analysed space are shown inFigures 12.1 and 12.2.

Smoke and Fire Gases Venting in Large Industrial Space and Stores
92
Openings
Openings
Fire
Wind
Smoke vents
Exhaust ventilationsystem
Smoke layer
Supply ventilationsystem
Figure 12.1 The “real” layout of the space.
Ventilationflow
Openingswindward
Openingsleeward
Smoke ventleeward
Smoke ventwindwardFire flow
Figure 12.2 The “ schematic ” layout of the space.
The study comprises:
• general study of principal cases, i.e. evaluation of smoke vents func-tion in unventilated buildings with no thermal forces (cold case),
• study of principal cases for the ordinary conditions without fire(without buoyancy) at the indoor temperature of 20°C, i.e. evalu-ation of smoke vents function in unventilated buildings with in-door temperature of 400 °C (fire case),

Models and tools
93
• evaluation of smoke vents function in buildings ventilated by ei-ther supply or exhaust system with indoor temperature of 400 °C(fire case),
• evaluation of smoke evacuation with the help of roof mountedsmoke fans with or without roof vents in buildings ventilated bysupply-exhaust system and with indoor temperature of 400 °C(fire case).
12.2 General study of principal casesThe purpose of this study is to evaluate resulting equivalent internal pres-sure in the space versus outdoor pressure and as a result of it the amountof roof vents with reversed flow (inlet flow instead of outlet).
Nine different cases have been studied. These cases comprise differentcombination of opened versus closed openings on the windward and/orleeward sides of walls, roof smoke vents of different areas exposed todifferent outdoor temperatures and wind velocities. Ventilation system’sinfluence has also been evaluated here in a simplified way as a ventilationbalance versus unbalance in the examined space.
Table 12.1 List on the studied cases with different combination of opened/closed openings in the walls and smoke vents on the roof in thestudied space.
N case Opened area, m2
Walls Smoke vents
Windward Leeward Windward Leeward
1 - - - -2 2 - - 23 6 - - 24 12 - - 25 - - 2 26 2 - 2 27 2 2 2 28 - 2 2 29 2 - 2 -

Smoke and Fire Gases Venting in Large Industrial Space and Stores
94
Above presented cases were studied at
• different climatic conditionswith outdoor air temperatures of –20°C,0 °C and 20°C andwind velocity of 5 m/s, 10 m/s and 25m/s; along with
• different indoor air temperatures of 20 °C and 400°C (fire case).
Besides that the model was studied with
• positive ventilation balance flow (running supply ventilation sys-tem only),
• zero ventilation balance (not running ventilation systems) and• negative ventilation balance flow (running exhaust ventilation sys-
tem only).
12.3 Study of principal cases for theordinary conditions without fire
The purpose of this study is to evaluate outflow/inflow via smoke ventsunder above described conditions. Smoke vents are located on the bothleeward and windward sides of the roof. It means that indicated case withinlet flow through the roof vents could occur through one or both ofthem. This is reflected in the resulted percentile amount of “fault” smokevents.
Results for the studied cases for a space at the ordinary indoor tem-perature of 20°C are shown in Table 12.2.

Models and tools
95
Table 12.2 Number of roof vents with inlet flow in percent versus amountof cases with inlet flow via the roof vents in percent for the de-sign case with variations in airflow (cold case).
Wind Ventilation To = 20°C To = 0°C To = -20°Cvelocity, flow,m/s m3/s
5 0 40/70 25/50 15/3025 0 40/70 40/70 40/70
5 5 22.5/40 15/30 5/025 5 37.5/70 30/70 35/70
5 -5 47.5/70 35/70 20/4025 -5 40/70 40/70 40/70
As it is seen from the Table 12.2 temperature difference between insideand outside air influences the amount of reversed (inlet) flow throughthe roof vents only at the wind velocity of 5 m/s. Obviously, the deter-mining factor in reversed function of the roof vents is wind velocity. Inthe “summer” case with the same amount of inlet roof vents for bothwind velocities, the numerical values of inlet flows were considerablyhigher for 25 m/s.
At the same time, difference between values of inlet flows via the roofvents at different outdoor temperatures are negligible for wind velocityof 25 m/s. As it can be seen, positive ventilation balance (supply ventila-tion system in operation) reduces the amount of inlet flows in the roofvents in comparison with a case with no ventilation at all.The results of this study is of interest for the case when buoyancy isinsufficient, for example at low fire smoke temperatures or after the firesmoke been chilled by sprinklers.
12.4 Study of principal cases for the fireconditions (with buoyancy) at theindoor temperature of 400°C
The purpose of this study is to evaluate outflow/inflow via smoke ventsin the case of fire with a 400°C smoke filled space.
Results of studied cases are shown in Table 12.3.

Smoke and Fire Gases Venting in Large Industrial Space and Stores
96
Table 12.3 Number of roof vents with inlet flow in percent versus amountof cases with inlet flow via the roof vents in percent for the casewith a smoke filled building, Ts=400°C.
Wind No ventilation Supply ventilation in Exhaust ventilationvelocity, operation, stopped system in operation,m/s exhaust ventilation stopped supply
system, airflow of ventilation system,5 m3/s airflow of -5 m3/s
5 0/0 0/0 0/025 25/50 25/50 25/50
As it is seen from the Table 12.3, both the exhaust and the supply venti-lation systems separately in operation, along with high indoor tempera-ture have no effect on the amount of roof vents with reversed flow. Nev-ertheless, even in this special case increasing wind velocity results in in-creased “error” roof vent’s behavior. Numerically, these undesirable inletflows through the roof vents are somewhat higher in the case with theexhaust ventilation system in operation than with the supply ventilationsystem in operation, that is on its part higher then without ventilationsystem at all. The pattern is characteristic to all cases.
Comparison between the Table 12.2 and Table 12.3 shows that buoy-ancy has undoubtedly valuable effect on the resulting pressure condi-tions and therefore on the amount of inlets through the smoke vents.
12.5 Study of cases for the fire conditionswith constant ventilation flows
The purpose of this study is to examine the above studied space filledwith 400°C smoke more detailed when ventilated with constant ordi-nary ventilation flow. The above-presented study was completed withadditional cases No 6, 11, 12, 13. All in all, thirteen cases were studied.Case 6 corresponds to the smoke vents area of 200 m2 even distributed(2% of the floor area of the space). This case corresponds to the require-ments in the Swedish Building Codes, BBR.

Models and tools
97
Table 12.4 List on the studied cases with different combination of opened/closed openings in the walls and smoke vents on the roof in thestudied space.
N case Opened area, m2
Walls Smoke vents
Windward Leeward Windward Leeward
1 - - - -2 3 - - 23 6 - - 24 12 - - 25 - - 2 26 - - 100 1007 2 - 2 28 2 2 2 29 - 2 2 2
10 2 - 2 -11 - 2 - 212 12 - - -13 - 11 - -
Cases were studied with either constant supply ventilation flows or simi-lar constant exhaust ventilation flows of about 2 l/h – 60 m3/s and 3 l/h– 80 m3/s.
However, it is important to notice, that these cases do not cover theentire range of possible variations in areas of openings, nor do they com-prise all thinkable variations in their combinations.

Smoke and Fire Gases Venting in Large Industrial Space and Stores
98
Table 12.5 Number of roof vents with inlet flow in percent contra amountof cases with inlet flow via the roof vents in percent for the de-sign case with a smoke filled building and either supply or ex-haust ventilation system in operation with permanently con-stant air flow.
Wind Ventila- Ventilation system in operationvelocity, tionm/s systems
stoppedSupply ventilation Exhaust ventilationsystem in operation system in operationFlow: Flow: Flow: Flow:60 m3/s 80 m3/s -60 m3/s -80 m3/s(2 l/h) (3 l/h) (2 l/h) (3 l/h)
5 4/8 4/8 4/8 42/62 62/6925 27/54 15/31 8/15 46/77 50/77
As it is seen from the Table 12.5 exhaust and supply ventilation systemseach along with high indoor temperature have clear effect on the amountof reversed flow through the roof vents. Nevertheless, even in this specialcase increasing wind velocity results in increased “error” smoke vent’sbehavior. Numerically this undesirable inlet flows through the roof ventsare somewhat higher in the case with the supply ventilation system inoperation, but the pattern is characteristic to the both “positive” and“negative” ventilation flows.
The above studied cases with smoke filled space are extreme cases.They were important for evaluating of upper limit for result values. Suchcases are interesting neither for fire fighting operations, nor for safe egress.The case with a height of smoke layer that is 2/3 of the height of thebuilding is more appropriate and correct for the smoke management.The studies similar to the above-presented analyses were made for thisreduced height of the smoke layer (6 m). The results differ from theabove-presented value inessential and therefore are not showed here.
Six meters smoke layer height under the roof (four meters of clear airabove the floor), along with wind velocity of 25 m/s are assumed to bedesign parameters for the further analyses.

“Real case” study
99
13 “ Real case” study
The study presented in previous Chapter 12 refers to a somewhat simpli-fied ventilation system with positive (supply) and negative (exhaust) ven-tilation with constant flows. In this chapter, the problem of smoke move-ments through smoke roof vents will be evaluated regarding the ventila-tion systems installed.
13.1 Evaluation of smoke vents function inbuildings ventilated by either supply orexhaust system with different type ofregulation
In spite of the fact that a great variety of different ventilation systems isused in the large spaces, three major types depending on the type of regu-lation were studied:
• without any control,• with a constant air flow (air volume control) and• with a constant pressure drop in the ventilation system (pressure
control).
Ventilation fan curve is described by a simplified equation
22 qcqnbnap ++=∆ (13.1)
where
∆p pressure, Paa, b, c coefficients, -q air flow, m3/sn revolution, -/min

Smoke and Fire Gases Venting in Large Industrial Space and Stores
100
Calculations were made for the fan with the following characteristics.
Pressure, Pa 500 444 100Air flow, l/s 0 60 160
The model tested here illustrates the designed space of 105 m3 with fireexpansion flow of 10 m3/s and with the ordinary ventilation flow, bothsupply and exhaust, equal to 60 m3/s (approximately two 1/h). The smokelayer is six meters high under the roof (four meters of clear air above thefloor) with the temperature of 400°C. Designed wind velocity is 25 m/s.The schematic and corresponding PFS - layouts of the analysed space areshown in Figures 13.1 and 13.2.
Ventilationflow
Openingswindward
Openingsleeward
Smoke ventleeward
Smoke ventwindwardFire flow
Figure 13.1 The “ schematic ” layout of the space.
In the fire case increasing pressure in the space results in decreasing sup-ply airflow in the supply duct-network and increasing airflow in the ex-haust duct-network. If both ventilation systems have air flow control,then in the supply ventilation system it appears that pressure in the sys-tem will increase in order to restore diminishing duct flow, while theexhaust ventilation system on the opposite will throttle air flow in orderto compensate for increasing fire flow. Pressure control can be of twomajor different types: with pressure detectors in the system’s plenum –outdoor and with pressure detectors in the fire room – in the system’splenum. Ventilation systems with pressure control of the first type wereexamined here. Pressure drop control of the second type results as a mat-ter of fact in constant airflow. Results are presented in the Table 13.1 andin the Figure 13.3.

“Real case” study
101
smoke smokw117beginformat - - - - 1control rsaee=1e-5parameter v=25.0 qtf=10 Ti=400 To=20 g=9.81 r=1.25parameter f1=0.8 f2=-0.4 f3=0.2 f4=-0.2parameter pd=444 qd=60 n=1.7 nm=0.4compute s6=1.2*(273+Ti)*(1/(273+Ti)-1/(273+To))*g*6compute p1=f1*r*v*v/2compute p2=f2*r*v*v/2compute p3=f3*r*v*v/2compute p4=f4*r*v*v/2set 1m2=t,0.6,1:h 3m2=t,0.6,3:h 0.5m2=t,0.6,0.5:hset 6m2=t,0.6,6:h 12m2=t,0.6,12:h 100m2=t,0.6,100:hset 0m=h,0 6m=h,s6 tryck=h?qtf:qfan FF 500:0 pd:qd 100:160set agg=g,pd,qd,n
Case 1 “leakage”
Case 2 “windward 1w+1r”
Case 3 “windward 2w+1r”
Case 4 “windward 4w+1r”
Case 5 “roof”
Case 6 “roof200m2”
Figure 13.2 PFS-layout of the tested model (beginning).

Smoke and Fire Gases Venting in Large Industrial Space and Stores
102
Case 7 “roof+windward”
Case 8 “open”
Case 9 “roof+leeward”
Case 10 “wwrf+www”
Case 11 “lwrf+lww”
Case 12 “windward 4w+leakage”
Case 13 “windward 4l+leakage”
end
Figure 13.2 PFS-layout of the tested model (end).

“Real case” study
103
smoke c:\bind\smoke117beginformat - - - - 1control rsaee=1e-5parameter v=25.0 qtf=10 Ti=400 To=20 g=9.81 r=1.25parameter f1=0.8 f2=-0.4 f3=0.2 f4=-0.2parameter pd=444 qd=60 n=1.7 nm=0.4compute s6=1.2*(273+Ti)*(1/(273+Ti)-1/(273+To))*g*6 = -91.604645compute p1=f1*r*v*v/2 = 312.500000compute p2=f2*r*v*v/2 = -156.250000compute p3=f3*r*v*v/2 = 78.125000compute p4=f4*r*v*v/2 = -78.125000set 1m2=t,0.6,1:h 3m2=t,0.6,3:h 0.5m2=t,0.6,0.5:hset 6m2=t,0.6,6:h 12m2=t,0.6,12:h 100m2=t,0.6,100:hset 0m=h,0 6m=h,s6 tryck=h?qtf:qfan FF 500:0 pd:qd 100:160set agg=g,pd,qd,n
Case 1 “leakage”
Case 2 “windward 1w+1r”
Case 3 “windward 2w+1r”
Case 4 “windward 4w+1r”
Case 5 “roof”
Case 6 “roof200m2”
Figure 13.3 PFS-results of the tested model (beginning).

Smoke and Fire Gases Venting in Large Industrial Space and Stores
104
Case 7 “roof+windward”
Case 8 “open”
Case 9 “roof+leeward”
Case 10 “wwrf+www”
Case 11 “lwrf+lww”
Case 12 “windward 4w+leakage”
Case 13 “windward 4l+leakage”
end 1 14 problems 197 elements 0 errors 1 warning 2001-01-25 11.49.51
Figure 13.3 PFS-results of the tested model (end).
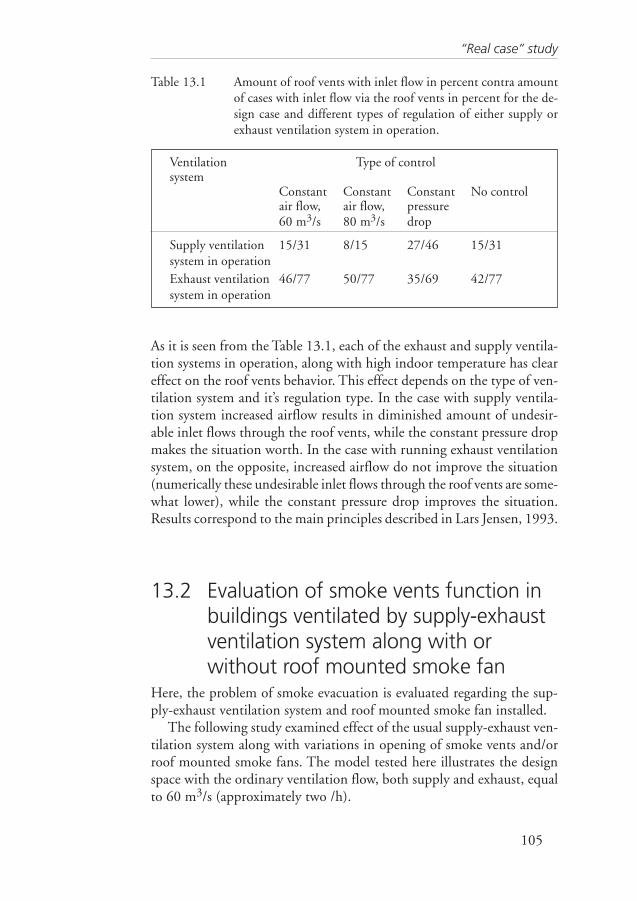
“Real case” study
105
Table 13.1 Amount of roof vents with inlet flow in percent contra amountof cases with inlet flow via the roof vents in percent for the de-sign case and different types of regulation of either supply orexhaust ventilation system in operation.
Ventilation Type of controlsystem
Constant Constant Constant No controlair flow, air flow, pressure60 m3/s 80 m3/s drop
Supply ventilation 15/31 8/15 27/46 15/31system in operationExhaust ventilation 46/77 50/77 35/69 42/77system in operation
As it is seen from the Table 13.1, each of the exhaust and supply ventila-tion systems in operation, along with high indoor temperature has cleareffect on the roof vents behavior. This effect depends on the type of ven-tilation system and it’s regulation type. In the case with supply ventila-tion system increased airflow results in diminished amount of undesir-able inlet flows through the roof vents, while the constant pressure dropmakes the situation worth. In the case with running exhaust ventilationsystem, on the opposite, increased airflow do not improve the situation(numerically these undesirable inlet flows through the roof vents are some-what lower), while the constant pressure drop improves the situation.Results correspond to the main principles described in Lars Jensen, 1993.
13.2 Evaluation of smoke vents function inbuildings ventilated by supply-exhaustventilation system along with orwithout roof mounted smoke fan
Here, the problem of smoke evacuation is evaluated regarding the sup-ply-exhaust ventilation system and roof mounted smoke fan installed.
The following study examined effect of the usual supply-exhaust ven-tilation system along with variations in opening of smoke vents and/orroof mounted smoke fans. The model tested here illustrates the designspace with the ordinary ventilation flow, both supply and exhaust, equalto 60 m3/s (approximately two /h).

Smoke and Fire Gases Venting in Large Industrial Space and Stores
106
Moreover, the study comprises the above-presented cases of the smokevents opening (Table 12.4) with additional variations in ventilation sys-tems function.
Calculations were made for the supply and exhaust fans with the samecharacteristics as in Subchapter 13.1 and for the fire smoke fan with thefollowing characteristics.
Pressure, Pa 100 60 10Air flow, l/s 0 10 20
The schematic and PFS - layouts of the analysed space are shown inFigures 13.4 and 13.5. Results are presented in Table 13.2.
Openingswindward
Openingsleeward
Smoke ventleeward
Smoke ventwindwardFire flow
Supplyfan
Exhaust fan
Smoke roof fan
Figure 13.4 The “ schematic ” layout of the space.

“Real case” study
107
smoke smokw130beginformat - - - - 1control rsaee=1e-5parameter v=25.0 qtf=10 Ti=400 To=20 g=9.81 r=1.25parameter f1=0.8 f2=-0.4 f3=0.2 f4=-0.2parameter pd=444 qd=60 n=1.7 nm=0.4compute s6=1.2*(273+Ti)*(1/(273+Ti)-1/(273+To))*g*6compute p1=f1*r*v*v/2compute p2=f2*r*v*v/2compute p3=f3*r*v*v/2compute p4=f4*r*v*v/2set 1m2=t,0.6,1:h 3m2=t,0.6,3:h 0.5m2=t,0.6,0.5:hset 6m2=t,0.6,6:h 12m2=t,0.6,12:h 100m2=t,0.6,100:hset 0m=h,0 6m=h,s6 tryck=h?qtf:qfan FS 100:0 60:10 10:20fan FF 500:0 pd:qd 100:160set agg=g,pd,qd,n
Case 1 “leakage”
Case 2 “windward 1”
Case 3 “windward 2w+1r”
Case 4 “windward 4w+1r”
Figure 13.5 PFS-layout of the tested model (beginning).

Smoke and Fire Gases Venting in Large Industrial Space and Stores
108
Case 5 “roof”
Case 6 “roof200m2”
Case 7 “roof+windward”
Case 8 “open”
Case 9 “roof+leeward”
Figure 13.5 PFS-layout of the tested model (continuing).

“Real case” study
109
Case 10 “wwrf+www”
Case 11 “lwrf+lww”
Case 12 “windward 4w+leakage”
Case 13 “windward 4l+leakage”
end
Figure 13.5 PFS-layout of the tested model (end).

Smoke and Fire Gases Venting in Large Industrial Space and Stores
110
Table 13.2 Data regarding the examined cases and the resulting number ofsmoke vents/cases with inlet flow in percent for smoke egress inthe studied space.
Case Supply fan Exhaust fan Fire smoke Number of smokefan vents/cases with
inlet flow, %
1 Normal Normal - 27/542 Closed Closed - 19/383 Closed Normal - 39/774 Normal Closed - 15/315 Forced to 200 Closed - 8/15
m3/s (6 l/h)6 Normal Normal Normal 35/707 Normal Normal Normal 22/43 (7fall)(7fall)(7fall)(7fall)(7fall)
(without roofvents)
8 Closed Closed Normal 22/43 (7fall)(7fall)(7fall)(7fall)(7fall)(without roofvents)
9 Normal Closed Normal 7/14 (7 fall)(7 fall)(7 fall)(7 fall)(7 fall)(without roofvents)
10 Normal Closed Normal 15/3011 Closed Normal Normal 36/72 (7 fall)(7 fall)(7 fall)(7 fall)(7 fall)
(without roofvents)
12 Closed Normal Normal 35/7013 Closed Closed Normal 23/46
As seen in Table 13.2 the minimum amount of inlets via the smoke roofvents in case 9 almost coincides with those in case 5.
The best results regarding smoke evacuation efficiency occur on thewhole with working supply ventilation system regardless of type of smokeevacuating measures (cases 4, 5, 9, 10). Hence, the combination of work-ing supply fan along with different combination of smoke evacuatingmeasures can be considered as an effective measure. Supply ventilationoutlets are supposed to be placed near the floor.
Difference between the smoke evacuating devices such as the ordinarysmoke vents, smoke fan(s) and both of them along with not runningventilation systems is marginal. The efficiency of the chosen measureshould be evaluated for the particular space under the particular condi-tions.

“Real case” study
111
Using running supply and exhaust ventilation systems along with dif-ferent combination of smoke evacuating devices showed slightly worseresults then corresponding cases with shut down fans. The worst measureis combination of the shut down supply fan, working exhaust fan alongwith smoke evacuating devices.
Above presented analysis was made in terms of smoke vents reversed/“wrong” function. It does not comprise more detailed analysis of flow’sdistribution between different air terminal devices, nor does it estimatefan’s capacity to manage new “fire flow” conditions. In some of studiedcases pressure condition in the simulated space was beyond fan’s per-formance curve.

Smoke and Fire Gases Venting in Large Industrial Space and Stores
112

Cooling effect of sprinklers
113
14 Cooling effect of sprinklers
The interaction between sprinklers and the operation of smoke vents hasbeen studied and discussed in numerous research and studies. The mailgoal of all studies was to evaluate how sprinklers operation is affected bysmoke vents operation. This is commonly analyzed in terms of positivecontra negative claims of combined usage of sprinklers and smoke vents.
The most common positive claim in this connection is that smokevents prevent an excessive number of sprinklers from operating by limit-ing the spread of heat and smoke.
The most common negative claims in this connection are as follows:
• smoke vents can delay sprinkler activation and as a result can causelarge fires by diminishing gas temperatures at ceiling level,
• smoke vents can increase the number of activated sprinklers as theresult of above presented cause,
• smoke vent flow rates can be insufficient due to diminished buoy-ancy and thus are not cost effective.
There are studies that prove the above-presented issues along with stud-ies that question them.
The focus of such studies is sprinklers, not smoke vents.Here the attempt was made to evaluate this issue inversely, i.e. with
the focus on smoke vents affected by sprinklers. The most importantexpected result of sprinkled fire contra unsprinklered fire from this pointof view is cooling effect of sprinklers on ambient air and smoke layer.The resulting parameters are lower temperature equally distributed inthe studied space, lower buoyancy and pressure due to expansion. Hence,effectiveness of smoke vents might diminish as a result of lower internalpressure.
The study of evaporative cooling by corridor sprinkler system madeby Liu Stanley T., 1977 shows that

Smoke and Fire Gases Venting in Large Industrial Space and Stores
114
• spray with a smaller weight mean droplet diameter is more effec-tive in cooling down the hot combustion products,
• it is possible for the spray to create a recirculating flow so that thecombustion products will flow back into the burning room,
• a smaller sprinkler that produces a smaller mean droplet size un-der the same water flow rate is more effective than a larger sprin-kler in the cooling of the combustion products.
This can be illustrated with the following algorithm. For the same vol-ume of water V from sprinklers with droplets of different diameter, d,yields
322
311 dndnV == (14.1)
if d2 = d1/2, so
8/312
311 dndn = (14.2)
and n2 = 8 n1, the contact area for both cases will be as follows
2111 dnA = (14.3)
12
11
2
12
2222 22
2Adn
dndnA ==
== (14.4)
Thus, the contact area doubles when the droplet diameter goes half.The study of sprinklers/hot layer interaction made by Heskestad,
Gunnar, 1991 at the Mutual Factory Research Corporation, Boston, USAshows the following. The model based on the two-layer zone model and25 tests with sprinkled room fires shows that:
• the water drops contribute significantly to evaporation and cool-ing in the hot layer and are in the thermodynamic equilibriumwith the environment, i.e. all heat transferred to the drops is ab-sorbed in vaporising drops,
• the effective cooling diameter of the drops in the spray was indi-cated at 70% of the volume mean diameter,
• ratio heat absorption of spray Qs contra actual heat release rate Qawas about 0.5 for 11.1 mm diameter sprinkler at the dischargedrate of 68.2 l/min. Some numbers for it are presented in the Table14.1. These parameters were chosen as the most usual sprinklerparameters.

Cooling effect of sprinklers
115
Table 14.1 Conditions for tests presented in Heskestad, Gunnar, 1991.
Test D Vw Qa Qs Qs/Qa TaNo. (mm) (l/min) (kW) (kW) K
15 11.1 68.2 137 75.9 0.55 29719 11.1 68.2 282 134.8 0.48 30123 11.1 68.2 460 229.6 0.50 30424 11.1 68.2 474 240.6 0.51 301
where
D nozzle diameter;VW volumetric water discharge rate of spray nozzle;Qa actual heat release rate;Qs heat absorption rate of spray;Qs/Qa ratio heat absorption of spray Qs contra actual heat release rate
Qa;Ta temperature of ambient air.
With a certain uncertainty one can assume that the ratio heat absorptionof spray is 50% of the actual heat release rate.
The fractional change in droplet diameter is proportional to 1/3 powerof the decrease of mass. A reduction of the droplet mass by evaporationto one half of its original value will reduce the droplet diameter by only20%.
It seems to be important to notice that both of above presented stud-ies examined the cooling effect for only one sprinkler of different typesand diameters under steady-state conditions. The model in both studiesassumes two-zone model with hot upper and cool lower layers of uni-form temperatures and no direct interactions with a fire plume.
Another phenomenon due to the cooling effect of sprinklers on theambient air and smoke is a reversed flow through smoke vents as a resultof the indoor temperature being somewhat lower than the outdoor tem-perature. This can be expected during spring/summer. This can causebackflow through smoke vents.
The most common way to assess conditions causing this phenom-enon is as follows. To prevent smoke backflow, an empirical equationlimiting air velocity between two spaces is recommended by Heskestad(1989):
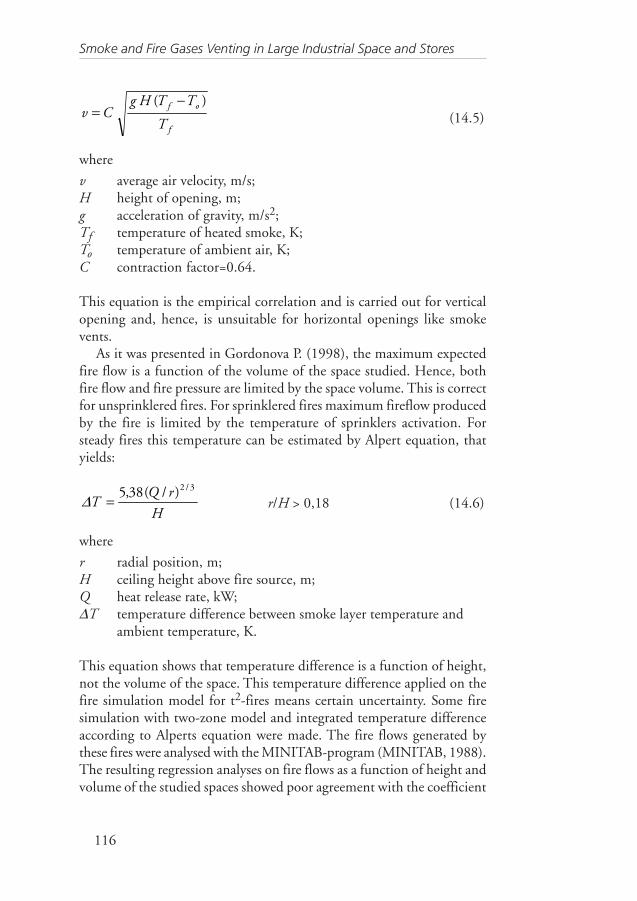
Smoke and Fire Gases Venting in Large Industrial Space and Stores
116
f
of
T
TTHgCv
)( −= (14.5)
where
v average air velocity, m/s;H height of opening, m;g acceleration of gravity, m/s2;Tf temperature of heated smoke, K;To temperature of ambient air, K;C contraction factor=0.64.
This equation is the empirical correlation and is carried out for verticalopening and, hence, is unsuitable for horizontal openings like smokevents.
As it was presented in Gordonova P. (1998), the maximum expectedfire flow is a function of the volume of the space studied. Hence, bothfire flow and fire pressure are limited by the space volume. This is correctfor unsprinklered fires. For sprinklered fires maximum fireflow producedby the fire is limited by the temperature of sprinklers activation. Forsteady fires this temperature can be estimated by Alpert equation, thatyields:
H
rQT
3/2)/(38,5=∆ r/H > 0,18 (14.6)
where
r radial position, m;H ceiling height above fire source, m;Q heat release rate, kW;∆T temperature difference between smoke layer temperature and
ambient temperature, K.
This equation shows that temperature difference is a function of height,not the volume of the space. This temperature difference applied on thefire simulation model for t2-fires means certain uncertainty. Some firesimulation with two-zone model and integrated temperature differenceaccording to Alperts equation were made. The fire flows generated bythese fires were analysed with the MINITAB-program (MINITAB, 1988).The resulting regression analyses on fire flows as a function of height andvolume of the studied spaces showed poor agreement with the coefficient

Cooling effect of sprinklers
117
of determination of approximately 92%. The main purpose of this evalu-ation was to assess fire flow produced by unsprinklered fire contrasprinklered fires in the same spaces. The right answer could be expectedin large spaces, where the temperature difference activating sprinklersoccurs before the maximum fire flow could be expected otherwise (be-fore lack of oxygen occurs).
Due to lack of studies comprising all variables effecting the phenom-enon the correct result can hardly be estimated. The problem seams to bea rather complicated one and more research obviously is needed.
14.1 Improving the function of smoke ventswith the help of sprinklers
Possibility of improving the smoke extraction function of a vent with thehelp of ejecting water flow (spray) from a sprinkler is examined in thissubchapter. Sprinkler in this case can be of a special design and straightenupwards.
Commonly, sprinklers can be installed upwards, downwards or can bearbitrarilly straightened. A common phenomenon of a downward straight-ened sprinkler is that it pulls down air and smoke towards the floor bythe action of the water droplets due to the momentum. Airflow increaseswith increasing distance from the sprinkler. Flow from a sprinkler, itsinitial velocity and drop diameter affect airflow.
Sprinkler diameter and flow determine initial droplet velocity (theordinary initial velocity is about 10 m/s). This velocity diminishes essen-tial by slowing down of sprinklers distributor. After this drop velocityreduces somewhat and becomes constant in proportion to the airflowvelocity rather quickly. This difference in velocities is equal to dropletvelocity for a free fall that is a function of drop diameter. Initial dropvelocity is, hence, of less importance because of the fact that drop veloc-ity becomes equal to a free fall velocity rather quick. Airflow is, thus,determined by water flow, sprinklers distribution and the vertical dis-tance under the nozzle.
The problem with upward straightened sprinklers is that airflow slowsdown and stops at some range due to gravity. Water drops fall downthrough this upward going airflow. In the case of airflow/sprinkler drop-let interaction above the roof level, wind can also affect the phenom-enon.

Smoke and Fire Gases Venting in Large Industrial Space and Stores
118
A simple estimation of energy required for driving water spray up-wards is presented in Jensen Lars, 2002. Analysis has shown that airflowvelocity diminishes with increasing spray ejection. Comparison of dropvelocity with the air flow velocity through a roof mounted smoke venthas shown that for air flow velocities exceeding 5 m/s the ejector force ofsprinkler spray straightened upwards can be neglected. This statementmakes the expected advantage of this method even less interesting.Momentum exchange calculations have shown the same result.
A model for friction between spray drops and air has been used. Threedifferent spray directions have been examined: upwards, downwards andhorizontal. Twenty-seven calculations with different combination of threevariables: full-cone spray angle, spray flow and direction are presented.Results show that upward straightened spray has relatively short rangesand airflow. Drops slow down at distances less than 1m. Analysis did nottake into account drops falling down. This means that the presented re-sults for the upward straightened sprays are overestimated.
High initial spray velocities are essential for achieving high airflowbecause of the ejecting. In the ordinary sprinklers the resulting drop ve-locity is moderate and usually does not exceed 5 m/s. A solution could bea special designed sprinkler or an ordinary sprinkler without distributor.
To sum up the results of the study, the smoke evacuating function ofa smoke vent can hardly be improved with the help of using upwardstraightened sprinkler.

Maximum temperature of different ventilation fans, ...
119
15 Maximum temperature ofdifferent ventilation fans,ventilation ducts andventilation systems
The ability of a ventilation system to evacuate fire gases is limited by itsown maximum service temperature. The problem is more characteristicfor exhaust systems (fans) then for supply systems because of the delu-sion of hot air. The problem can be divided into two major issues: maxi-mum temperature of ventilation ducts and maximum temperature of ven-tilation fans. The problem is that the motor and the belt can be placedinside the ventilation plant and therefore can be cooled down by thesame air flow that is transported by the fan itself.
The following analysis is the summary of two reports on the issue ofLars Jensen: Lars Jensen, 1998. “Ventilationssystemets uthållighet vidbrand”, Rapport TABK--98/7046, Lund University (in Swedish) and LarsJensen, 1999. “Elmotorers uthållighet vid höga temperatur”, RapportTABK--99/7056, Lund University (in Swedish).
15.1 Maximum temperature of ventilationfans
Three different cases are possible regarding fans lifetime:
1. The simplest case, when increased temperature is less then thatprescribed for the fan;
Smoke and Fire Gases Venting in Large Industrial Space and Stores
120
2. Increased temperature is beyond boundary permitted parameterswithout direct damage of the fan, but it shorts its lifetime consid-erably;
3. Fan goes broken during abnormal operation.
Fire loads time is much shorter then fans lifetime. Fire resistance timedefined for buildings is applied to ventilation system also.
The most sensitive parts of a fan are the motor winding, bearing andbelt. Hence, winding, ball bearing and belt determine thermal enduranceof a fan.
15.1.1 Ball bearingUsually, bearings normal operation temperature is approximately 10-15°Chigher then surrounding temperature. Steel changes its characteristicsafter one-month exploitation at 150°C and after only four hours at 350°C.Seal protects bearing against external contamination and keeps grease.Seal consists of nitric rubber, which sets the limits for temperature rise to160°C.
Greases temperature limits do not exceed 130°C.Ball bearing should stand temperature of 200°C during at least 120
min for the highest fire resistance.
15.1.2 BeltUsually, a belt should stand normal operation at 80°C external tempera-ture. A belt operating at 150°C is estimated to stand during maximum10 hours. Operation at 200°C is considered to be impossible becauserubber vulcanises once more time and becomes fragile.
15.1.3 MotorOrdinary motors are classified to operate at 40°C. The most sensitivepart of a motor is insulation of windings. Threads are covered with lac-quer. Their thermal resistance manages up to 300°C. Special materialsseparating windings manage between 130 and 160°C ambient tempera-ture.
A motor can be fabricated with different insulation in order to man-age different high winding temperature caused by high ambient tem-perature. The highest permitted windings temperature varies between105°C and 180°C.
Hence, winding determines thermal endurance of a motor.

Maximum temperature of different ventilation fans, ...
121
15.2 Exhaust airflow temperature andthermal endurance of a motor
Report examines different parameters, which are important for thermalresistance and, hence, for lifetime of a fan:
• ambient temperature;• exhaust airflow temperature;• power demand as a function of temperature;• static thermal endurance of a motor and• dynamic thermal endurance of a motor.
The problem of thermal endurance of a motor is examined with the helpof three models: at constant mass airflow, at constant volume airflow andat constant pressure drop.
The analysis is based on the fact that power demand of a motor/fan isindirectly affected by the temperature depended air density and that fansthermal endurance is influenced directly by the temperature of the ambi-ent air.
Analysis with constant mass airflow through the fan results in an over-estimate because under constant mass airflow conditions density is halvedand velocity doubles when temperature doubles.
Under constant volume airflow conditions the mass airflow from thefire room is underestimated because density and therefor mass airflow, aswell as pressure, are halved when temperature doubles.
Analysis of the problem based on constant pressure drop assumes thatρv2 is similar both for an ordinary operation and in case of fire. Modeltests a two-branch exhaust ventilation system with different ratio of air-flow from fire room (0.2 – 0.5) and for fire airflow of 738, 841, 945 and1 049°C, which corresponds to four different fire resistance classifica-tions.
Exhaust airflow temperature is always less then 128°C for the fire flowratio up to 0,2 with fire airflow temperature of 1 049°C according to thehighest fire resistance classification.
Exhaust fire flow with ratio of 0.3 does not exceed temperature limitof 192°C.
Fire flow ratios of 0,4 and 0,5 mean that approximately half of thebuilding is burning, that is an extreme case.

Smoke and Fire Gases Venting in Large Industrial Space and Stores
122
Pressure produced by an uncontrolled fan with a constant number ofrevolutions is proportional to air density and inverted proportional totemperature. Volume airflow does not change because pressure drop isalso proportional to density.
A pressure-controlled fan means that parameter ρv2 is also constantbecause pressure drop in ducts is also proportional to ρv2.
An air volume controlled fan can be regulated according to changingin dynamic pressure ρv2, which is the same as for a pressure-controlledfan. Required effect, P, is proportional to ρv3 and, thus, increased tem-perature results in less density of the airflow and increased velocity aswell as in increased effect. Following connection is valid for pressure-and air-volume controlled fans: P~ρv3~V~ρ-0.5~T0.5.
Ordinary permitted windings temperature at nameplate power rat-ings is approximately 70°C higher then ambient temperature. It meansthat there is some margin to the highest permitted winding temperatureand therefore it can be raised to 155°C and 180°C for surrounding tem-perature of 85°C and to 110°C respectively.
Winding temperature is determined by the power of the motor. Amotor with at nameplate power ratings can therefore manage higher am-bient temperature. All motors are classified to manage 40°C ambienttemperature. Some more values are presented in Table 15.1
Table 15.1 Changed power of a motor according to different ambient tem-peratures, °C.
Ambient temperaturAmbient temperaturAmbient temperaturAmbient temperaturAmbient temperature, e, e, e, e, °CCCCC RRRRRelativelativelativelativelative poe poe poe poe powwwwwer of the motorer of the motorer of the motorer of the motorer of the motor
30 1.0740 1.0050 0.9360 0.86570 0.7980 0.70
As it is seen from the Table 15.1 decreased relative power of the motor(0.7) manage ambient temperature of 80°C. Thus, a motor can manage40°C higher ambient temperature and therefore have 40°C lower wind-ing temperature then ordinary one at nameplate power ratings.
Inner temperature of a motor can be according to the Table 15.1 sim-plified and described as a lineal function of the relative power of themotor, pr, as follows

Maximum temperature of different ventilation fans, ...
123
)1)(3.0/40(70 rfm pTT −−+= °C (15.1)
The relative power of the motor, pr, depends on the surrounding tem-perature.
For uncontrolled ventilation fan it results in reduction of required fanpower at increasing ambient (exhaust airflow) temperature.
For controlled ventilation fan it results in lower allowed exhaust air-flow temperature compared to unregulated fan along with higher thenone relative power of the motor, pr.Hence, allowed highest ambient air temperature is much more limitedfor controlled ventilation fan because the fan is in directly controlledby the dynamic pressure.
Lifetime analysis presented in Lars Jensen, 1998, show connectionbetween windings temperature and lifetime. According to this, windingis expected to manage 190°C ambient temperature for at least 10 hours.At the same time, corresponding windings temperature is approximately260°C. It means that motors lifetime should be longer then belt’s life-time.
Ordinary measures protecting motor against overload do not work inthe fire case because power of the fan decreases for uncontrolled fans.There is, however, certain risk for overload for pressure- and airflow con-trolled fans.
15.3 Dynamic temperature endurance of amotor
A motor can manage short periods of time with temperature overload oncondition that inner temperature of a motor is beyond certain tempera-ture limits for materials used. This is possible because a motor ordinaryworks with a certain temperature margin. A simplified dynamic modelfor evaluation of these margins is presented in Lars Jensen, 1998. Themodel describes inner temperature of motor as a function of equilibriumtemperature and motors thermal characteristics.
Results show that time lag of a motor increases along with increasingmotor size and temperature endurance of a motor is directly propor-tional to time lag of a motor.
Theoretical results showed good agreement with experiment resultspresented in Gunnar Kylander, 1995.

Smoke and Fire Gases Venting in Large Industrial Space and Stores
124
15.4 Motors thermal enduranceIn order to examine thermal endurance of motors three motors were testedat the Department of Fire Safety, Lund University of Technology. De-scription and results of this study are presented in Lars Jensen, 1999.
Table 15.2 Data on the motor examined (EEx e II T3, ABB Motor).
PPPPParameterarameterarameterarameterarameter UUUUUnitnitnitnitnit
Motor power kW 1.3Efficiency - 0.8Nameplate current A 2.9Mass kg 13
The idling case was studied. Motors inner temperature is somewhat lessthen that for an ordinary operation because power loss is less with idling.All tests showed that operation could be maintained during limited timewith winding temperature of approximately 300°C. Endurance/time fromstart (both cold and warm) of the motor to the point, when windingtemperature reaches 300°C, is presented in Table 15.3.
Table 15.3 Motors endurance at different ambient temperatures
TTTTTemperaturemperaturemperaturemperaturemperature, e, e, e, e, °CCCCC D D D D Durabilityurabilityurabilityurabilityurability, min, min, min, min, minCold start Warm start
200 ∝ (291 °C) ∝ (291 °C)250 50 43300 34 27350 24 19400 19 16
Ambient temperature at which winding temperature reaches 300°C atcertain time intervals from start (both cold and warm) of the motor ispresented in Table 15.4.

Maximum temperature of different ventilation fans, ...
125
Table 15.4 Ambient temperature at given motors endurance
EEEEEndurance, minndurance, minndurance, minndurance, minndurance, min Ambient temperaturAmbient temperaturAmbient temperaturAmbient temperaturAmbient temperature, e, e, e, e, °CCCCCCold start Warm start
15 445 39530 309 28260 234 226
120 212 212240 211 211
At ordinary operation and ordinary axle load rotor temperature expectedcould be higher then winding temperature, but rotor is short-circuitedand, thus, is assessed to have high thermal endurance.
Ball bearing managed over 250°C for several hours.Axle seal managed over 250°C and became somewhat fragile.Motor cooled fans and their air inlet plastic cover melted totally at
160°C. It could be to advantage if ambient air is warmer then covertemperature, and it could be to disadvantage, if opposite.
15.5 SummaryAir temperature influences exhaust ventilation systems fans indirectlythrough the changing density of the airflow and hence, affecting powerrequired, and directly affecting thermal resistance of the fan. Higher tem-perature of exhaust airflow diminishes required power of the fan and atthe same time shortens down lifetime.
Evaluation of thermal endurance of exhaust ventilation system (LarsJensen, 1999) showed that an unregulated fan with a belt stands 150°Cambient temperature for maximum 10 hours. This is much longer thenthat required for highest fire resistance classification (120 min). An axialfan is better then a centrifugal in this regard. Pressure- and air volume-controlled fans can diminish the highest permitted operation tempera-ture because of the increasing power demand and temperature increasecan, if the worst increase the motor loading the power.
The fact that a fan stands certain fire load does not mean that its parts,such as motor or belt, remain undamaged.
Motors thermal time lag is often shorter then 40 min and operationduring 120 minutes means that stationary state attains and there is noneed of a dynamic analysis.

Smoke and Fire Gases Venting in Large Industrial Space and Stores
126
Exhaust airflow temperature according to the Table 15.2 is always lessthen 128°C with fire flow ratio up to 0,2 and temperature of 1 049°C(according to the highest fire resistance classification).
Temperature limit of 192°C does not exceed for fire flow ratio of 0,3.Fire flow ratio of 0,4 and 0,5 mean that approximately half of the
building is burning, that is an extreme case.An assumed simple connection between relative motors power, ambi-
ent temperature and inner motor temperature (equation 15.1) is quiteuncertain. Motors overheating temperature disappears at the relative motorpower of 0.475. Only idling causes overheating of motor with 30°C.
15.6 Maximum temperature of differentventilation ducts
The most frequently used material in ducts in industrial buildings is gal-vanized steel. The base metal is hot-rolled or cold-rolled steel. Differentcoatings may be used sometimes: zinc, aluminum-zinc alloy, aluminum,polyvinyl chloride (PVC) and fiber-reinforced (FRP). In some chemistryindustries stainless steel is used and in swimming pools aluminumductwork could be found. Cold-rolled copper ducts are not so usual, butoccasionally they are used in i.e. lobbies and atria. The above-presentedcases do not cover the whole range of the ventilation duct’s materialsused. Data concerning maximum prescribed service temperatures for someof materials mentioned here is presented in the Table 15.5. This tempera-tures are prescribed by the American Standards, ASTM, (and by the com-parable ISO 3575), and Swedish Standards SS.

Maximum temperature of different ventilation fans, ...
127
Table 15.5 Prescribed service temperatures for different ventilation ductmaterials according to American Standards, ASTM, and Swed-ish Standards, SS.
No Type of material Maximum service temperatures, Diverse °CAccording to According toASTM SS
1 Steel 121 120 Usual2 Hot-rolled and 343 300 For industrial
cold-rolled steel use withoutstress
3 Zinc coated steel 204 200-2504 Aluminum coated 482-538 315 Discoloration
steel occurs over428°C
5 PVC and FRP 65-93 60coated steel
6 Stainless steel 427 500-7007 Aluminum 204 200-300 Aluminum
becomes softerafter two yearsoperation at200°C
8 Copper unknown 300°C

Smoke and Fire Gases Venting in Large Industrial Space and Stores
128

Discussions and conclusions
129
16 Discussions andconclusions
IntroductionThe theoretical studies and computer simulations have provided knowl-edge regarding smoke evacuation from large spaces with the help of dif-ferent measures in combination with the use of ordinary ventilation sys-tems. Application of this basic knowledge totally depends on the internalpressure in the building. This internal pressure is a function of differentfactors.
Smoke management can be interpreted as successful smoke ventingfrom a space effected by different factors in the fire case. These factorsare:
• wind pressure around the whole building (the roof included);• buoyancy due to temperature difference;• fire expansion;• ventilation fan pressure and• sprinklers.
The model created and presented here takes into account all these factorsand provides a means of analyzing pressure distribution and resultingflows in/out of the examined space.
All combinations of theoretically possible smoke management meas-ures such as opening of smoke vents and openings for make-up air, run-ning roof mounted smoke fans along with running ordinary ventilationsystems are embraced by the presented model.Results of the studied cases are described in terms of right/wrong functionof the smoke vents. This phenomenon is the prevalent parameter for thepresent study.
The study is interdisciplinary and comprises different fields of knowl-edge: fire protection engineering, building science and building services.

Smoke and Fire Gases Venting in Large Industrial Space and Stores
130
Computer programsSIMNON is a computer program for the simulation of mathematical,non-linear relationships between the input and output signals in a sys-tem, as well as integration of several dynamic subsystems into one totalsystem. Simnon is made by SSPA Systems, a group within SSPA Mari-time Consulting AB. The program was used in evaluating different mod-els, e.g. pressure rise due to expansion.
For the purpose of evaluating smoke evacuation through roof ventsand roof mounted fans, a computer program PFS was used. This pro-gram, developed and written by Lars Jensen, is based on the semi graphi-cal circuit drawings and treats arbitrary flow systems of any structure andlayout, any media, and any problem: design or investigation. The pro-gram manual for PFS includes six major reports and four reports withapplications (Lars Jensen, 1995, 1996).
Fire scenario and fire sizeWith reference to all information on possible fire scenarios in large spacespresented in different sources and due to the absence of specific heatrelease rate data, it was assumed that the design fire is steady. A steady firehas a constant heat release rate as a result of limitations of fuel and com-bustion air. Due to the fact that such fires result in somehow overesti-mated ventilation rates in comparison with unsteady fires, this idealiza-tion results in parameters on the safe side.
In this study the design fire size is assumed to have a heat released rateof 5 MW. For several estimations other fire sizes were also examined: 2.5MW and 25 MW.
BuoyancyThe difference in pressure between the hot smoke layer and the outsideat ceiling level, as it is well known, is a function of smoke layer depth,temperature difference between hot smoke layer temperature and ambi-ent air temperature. Some pressure values characteristic for ordinary largespaces at different smoke temperatures are evaluated. The maximum theo-retically possible buoyancy never exceeds 12 Pa/m.

Discussions and conclusions
131
Pressure rise due to expansionPressure rise due to expansion can become a determining factor in in-door pressure assessment. The usual way to evaluate this parameter isbased on the assumption that rate of temperature rise, B (K/s), is con-stant. As a matter of fact it is a function of temperature rise. A pressurerise model was construsted and some results of computer simulationswith the program SIMNON are presented. Both steady and t2- fires aretested. The results show some difference between two models.
Airtightness in industrial buildingsValidation of the magnitude of internal and external leakage paths in thestudied spaces is an important issue for evaluation of both fire develop-ment in the room and predicted parameters.
The study of relevant literature both in Sweden and abroad has shownthat the air leakage rate according to Swedish Building Regulations BBR(6 m3/h,m2 for other buildings than dwellings), applied to the wholebuilding envelope, can be accepted as a suitable and probable value forSwedish industrial buildings. The corresponding air leakage in industrialbuildings in the USA is 60 m3/h, m2 relating to the area of the buildingenvelope. This case has also been examined.
The analysed data is not sufficient, as it does not cover all possiblecombinations of leakage area with the mean age of the buildings.
Equivalent indoor wind factorIn order to evaluate indoor pressure as a function of the external windpressure on building surfaces under different conditions, a model wasconstructed. The combination of wind pressure on a building and theairtightness of the building along with opening of doors, windows in thewalls and fire vents on the roof can give rise to great variations in pres-sure. The resulting indoor pressure can be defined as a function of dy-namic wind pressure multiplied by some resulting indoor wind factor.This indoor wind factor was defined here as an equivalent indoor windfactor.

Smoke and Fire Gases Venting in Large Industrial Space and Stores
132
In order to evaluate indoor pressure as a function of the resultingequivalent indoor wind factor, a model was constructed. The model cansolve the problem analytically for two surfaces (n=2); in other cases nu-merical methods have to be used.
The more complicated cases with different areas of openings on thewindward and/or leeward sides of the space and the roof are analyzedwith the help of the computer program PFS.
Design parametersFor the purpose of this study design parameters were estimated. Theseparameters include space examined, weather data, fire and smoke layercharacteristics, and values for ventilation systems.
The study was made for the space of 100x100x10 m3 with total eventlydistributed air leakage area of 3.5 m. The design roof was of arbitrarytype with windward side wind factor µ = 0.2 and leeward side wind fac-tor µ = -0.2.
Outdoor temperatures of -20°C, 0°C and 20°C are chosen for thisstudy. Extreme wind velocity of 25 m/s is chosen as the max referencewind velocity. Along with these extreme parameters, the more usual tem-perature of 0°C and wind velocities of 5 and 10 m/s were also tested.
The design fire is a steady fire with heat release rate (RHR) of 5 MW.The design smoke layer with depth of 6 m has temperature of 400°C
and buoyancy of 36 Pa.
Ventilation fans are as follows:
supply fan - 60 m3/s at 444 Pa;exhaust fan - 60 m3/s at 444 Pa andsmoke fan - 10 m3/s at 60 Pa.
Study of casesAn analysis of the schematic models, evaluation of the wrong/right func-tion of smoke vents in the studied space with/without fire and with work-ing/non-working ordinary ventilation systems is presented in this study.These cases were analyzed with the help of the computer program PFS.
The study was made “step-by-step”:
Discussions and conclusions
133
• “cold” case without ventilation (indoor temperature 20°C),• fire case with some ventilation imbalance (smoke layer tempera-
ture 400°C),• fire case with either supply or exhaust ventilation system in opera-
tion (smoke layer temperature 400°C),• real fire case with the ordinary supply-exhaust ventilation system
along with variations in the opening of the smoke vents and/orroof mounted smoke fan (smoke layer temperature 400 °C).
The study comprises up to thirteen cases of variation in smoke/inlet ventopening along with additional variations in studied cases.
Cooling effect of sprinklersThe obvious dependence of inner parameters on sprinkler operation andthe resulting operation of smoke vents should be described in numericalterms based on theoretical grounds. The series of different studies hadthe aim of elucidating the influence of smoke venting on the operatingcharacteristics of sprinklers. Apart from that, the theoretical basis forsuch evaluations can hardly be considered as sufficient. The attempt wasmade to evaluate the problem inversely. The cooling effect of sprinklerslowers temperature of ambient air, as the smoke layer mixes with the restof the air due to the absence of temperature difference. The rate of heatabsorption by the spray and, hence, the heat which remains to warm theambient air could be assessed according to some results of the study pre-sented in Heskestad, 1991. According to this study, the ratio of absorp-tion by the spray can be assumed to be 50%. It should be noted that thestudy was made for only one spray and under very special conditionswith forced direction of airflow out of the box tested. The problem ofbackflow, if any, through smoke vents due to reverse temperature differ-ence over the opening could not be solved with the help of the equationproposed for the vertical opening between two spaces.
Regression analyses made on the fire simulation results regarding fireflow showed poor agreement. This could be partly explained by integra-tion of Alpert’s equation for steady fires on the t2-fires and by the insuf-ficient number of spaces tested.

Smoke and Fire Gases Venting in Large Industrial Space and Stores
134
Improving the function of smoke vents withthe help of sprinklersCommonly, sprinklers can be installed upwards, downwards or can bearbitrarily straightened.
The problem with upward straightened sprinklers is that airflow slowsdown and stops at some range due to gravity. Water drops fall downthrough this upward going airflow. In the case of airflow/sprinkler drop-let interaction above the roof level, wind can also affect the phenom-enon.
Analysis has shown that airflow velocity diminishes with increasingspray ejection. Comparison of drop velocity with the air flow velocitythrough a roof mounted smoke vent has shown that for air flow veloci-ties exceeding 5 m/s the ejector force of sprinkler spray straightened up-wards can be neglected. This statement makes the expected advantage ofthis method even less interesting.
Momentum exchange calculations have shown the same result.A model for friction between spray drops and air has been used. Three
different spray directions have been examined: upward, downward andhorizontal. Results show that an upward straightened spray has relativelyshort ranges and airflow. Drops slow down at distances less then 1m.Analyses did nor take into the account drops falling down. This meansthat the results presented for the upward straightened sprays are overesti-mated.
High initial spray velocities are essential for achieving high airflowbecause of the ejection. In the ordinary sprinklers the resulting drop ve-locity is moderate and usually does not exceed 5 m/s. A solution could bea specially designed sprinkler or an ordinary sprinkler without a spreaderplate.
To sum up the results of the study, the improvement in the smokeevacuating function of a smoke vent due to an upward straightened sprin-kler is negligible.
Maximum temperature of ventilation systemsThe ability of a ventilation system to evacuate fire gases is limited by itsown maximum service temperature. The problem can be divided intotwo major issues: maximum temperature of ventilation ducts and maxi-mum temperature of ventilation fans. The problem is that the motor and

Discussions and conclusions
135
belt can be placed inside the ventilation plant and therefore can be cooleddown by the same airflow that is transported by the fan itself. The maxi-mum temperature of ventilation fans depends on the thermal enduranceof its components: ball bearing, belts and motor itself. An evaluation ofpossible maximum operating temperatures for different parts of a fan ispresented.
Exhaust airflow temperature and thermal endurance ofa motorThe problem of thermal endurance of a motor is examined with the helpof three models: constant mass airflow, constant volume airflow and con-stant pressure drop. Different parameters that are important for thermalresistance and, hence, for the lifetime of a fan are also taken into account:ambient temperature, exhaust airflow temperature, power demand as afunction of temperature and static thermal endurance of a motor.
The analysis is based on the fact that the power demand of a motor/fan is indirectly affected by temperature dependent air density and thatthe fan’s thermal endurance is influenced directly by ambient tempera-ture.
The relative power of the motor depends on the ambient temperature.For an uncontrolled ventilation fan this results in a reduction in re-
quired fan power at increasing ambient (exhaust airflow) temperature.For a controlled ventilation fan it results in a lower allowed exhaust
airflow temperature compared with an unregulated fan, along with higherthan one relative power of the motor, pr.
Hence, the highest allowed ambient air temperature is much morelimited for a controlled ventilation fan because the fan is indirectly con-trolled by the dynamic pressure.
A lifetime analysis presented in Lars Jensen, 1998, shows the connec-tion between winding temperature and lifetime. According to this, thelifetime of the motor should be longer than the belt’s lifetime.
Ordinary measures protecting the motor against overload do not workin the event of fire because the fan power decreases for uncontrolled fans.There is, however, a certain risk of overload for pressure- and airflowcontrolled fans.
In addition to analytical evaluations of the problem some results fromthe examination of the thermal endurance of three motors that were testedat the Department of Fire Safety, Lund University of Technology, arepresented in the report.

Smoke and Fire Gases Venting in Large Industrial Space and Stores
136
Maximum temperature of different ventilation ductsThe maximum temperature of different ventilation ducts depends on theduct’s material and the coating used. An evaluation of this for some com-monly used materials is presented in the study.
ApplicationThe model presented can be used to evaluate the effectiveness and area ofroof vents in comparison with the ordinary ventilation system. This canbe evaluated step-by-step with the help of computer programs as follows:
step 1 the space studied is described with the help of a computer pro-gram,
step 2 any smoke vents and make up air openings are described in thecreated model,
step 3 the fire flow is evaluated,
step 4 the characteristic of dangerous wind velocities are estimated,
step 5 the ventilation system studied is described with the help of acomputer program,
step 6 the model studied is tested for fire smoke evacuation.
The results can be analysed in terms of fault (reversed) airflow directionor in greater detail as numerical values of flows in/out of the studiedspace.
Different measures for reducing the undesired (reversed) airflowthrough the roof vents, such as the ordinary ventilation system(s) in op-eration and/or smoke fans instead of smoke vents could then be tested.
Important resultsThe most important result is the method produced in the study. Thismethod is a simple tool to evaluate the optimum combination of differ-ent measures for smoke management that is best for the particular spacelocated at the particular site. As a result of this analysis ordinary ventila-tion systems operating along with optimum airflow through the roofmounted smoke fan or the optimum area and siting of the smoke ventscould be determined.

Discussions and conclusions
137
A motor manages maximum 180°C and the motor’s thermal time lagis shorter than 40 min. Exhaust airflow temperature is always less then128°C with fire flow ratio up to 0,2 and temperature of 1 049°C (ac-cording to the highest fire resistance classification). In extreme cases motorsmanage temperatures exceeding 250°C for several hours. This does notmean that they remain undamaged.
Fans without control manage ambient temperature of 150°C for atleast 10 h. This is a much longer time than that required by the highestfire classification (2 h).
On the whole, the best results regarding smoke evacuation efficiencyoccur with a working supply ventilation system and a shut down exhaustventilation system regardless of the type of smoke evacuating measures.Hence, the combination of working supply fan along with different com-binations of smoke evacuating measures can be considered as an effectivemeasure. Supply ventilation outlets are supposed to be placed near thefloor.
Sprinklers influence the effectiveness of smoke management due totheir cooling effect on the ambient air.
Future researchOwing to some uncertainty in the assumptions made, the paucity of ex-perimental data and lack of knowledge regarding certain fire processes,sprinkler influence and wind data, it seems to be necessary to investigatethe problem further.
The fire scenario in the buildings studied, with characteristicburning items involved, is of interest. Such “real” fires can producefireflows different from those predicted in this work.
The possibility of using ordinary ventilation systems along withother safety measures (smoke venting, sprinklers, etc.) in the event offire in such buildings can improve safety, and the economicconsequences of this are far from negligible.
The problem of sprinkler influence on the operation of smoke ventsmust be studied in greater detail. This matter needs further research.
The results of the problem studied predict the operation of smokevents in terms of right/wrong airflow through these. As a matter of fact,the resulting parameters obtained from simulations are airflow, pressureand pressure loss, and airflow direction through a smoke vent. This factprovides a greater opportunity for further and more detailed analysis ofpressure versus airflow conditions in a certain studied space.

Smoke and Fire Gases Venting in Large Industrial Space and Stores
138
It seems necessary to investigate the results further in numerical terms.

References
139
References
ASHRAE Handbook, (1997). Fundamentals, SI Edition, ISBN: 1-883413-72-9 USA.
ASHRAE Handbook (1999). Heating, Ventilation and Air-Condition-ing Applications, SI Edition, ISBN: 1-883413-45-1 USA.
BBR 94. (1993). Boverkets Byggregler, Foreskrifter och allmänt råd, BFS1993:57, Boverket (in swedish).
BOCA (1993). The BOCA National Building Code. Country Club Hills,IL: Building Officials & Code Administrators International, Inc.
Brand&Räddning NR 6-7 1997, NR 6-7 1998 (in Swedish).
Brand&Räddning NR 7 1999 (in Swedish).
Degenkolb, J.G. (1975). Fire safety for atrium type buildings. BuildingStandards 44: 16-18.
Degenkolb, J.G. (1983). Atriums. Building Standards 52: 7-14.
Dillon, M. E. (1994). “Determining effectiveness of atria smoke controlsystems”, ASHRAE Journal, April 1994.
Elmroth, A. (1985). “Energisnåla stålhallar, Byggnadstekniska lösningarför god lufttäthet och effektiv värmeisolering”, SPI-publikations 95– 1985 (in Swedish).
Elovitz, D. M. (1996). “Evaluating smoke control and smoke manage-ment systems”, ASHRAE Journal, March 1996.
Elovitz, K. M. & Elovitz, D. M. (1993). “Understanding smoke man-agement and control”, ASHRAE Journal, April 1993.
Gordonova, P. (1998). “Spread of Smoke and Fire gases via the VentilationSystem”, Report TABK--97/1011, Lund University, Lund Institute ofTechnology, Department of Building Science, Sweden.

Smoke and Fire Gases Venting in Large Industrial Space and Stores
140
Heskestadt, G. (1984). Engineering relations for fire plumes, Fire SafetyJournal 5(2):109-114.
Heskestadt, G. (1991). “Sprinkler/Hot Layer Interaction”, NIST-GCR-91-590, National Institute of Standards and Technology.
ICBO. 1994. The Uniform Building Code. Whittier, CA: InternationalConference of Building Officials.
Jensen, L. (1993). “Spridning av rök och brandgaser i ventilationssystem”,Rapport TABK--93/3011, Lund University (in Swedish).
Jensen, L. (1995a). ”Beskrivningsspråk för PFS”, Rapport TABK--95/7020, Institutionen för byggnadskonstruktionslära, LTH, Lund(1995) (in swedish).
Jensen, L. (1995b). ”Beräkningsuttryck för PFS”, Rapport TABK--95/7022,Institutionen för byggnadskonstruktionslära, LTH, Lund (1995) (inswedish).
Jensen, L. (1995c). ”Tillämpningsexempel med PFS”, Rapport TABK--95/7023, Institutionen för byggnadskonstruktionslära, LTH, Lund(1995) (in swedish).
Jensen, L. (1995d). ”Brandtekniska beräkningar med PFS”, Rapport TABK--95/7024, Institutionen för byggnadskonstruktionslära, LTH, Lund(1995) (in swedish).
Jensen, L. (1995e). ”Brandtekniska övningsexempel med PFS”, RapportTABK--95/7025, Institutionen för byggnadskonstruktionslära,LTH, Lund (1995) (in swedish).
Jensen, L. (1996). ”Arbetsbänk för PFS”, Rapport TABK--96/7033,Institutionen för byggnadskonstruktionslära, LTH, Lund(1996) (in swedish).
Jensen, L. (1998). “Ventilationssystemets uthållighet vid brand”, RapportTABK--98/7046, Lund University (in Swedish).
Jensen, L. (1999). “Elmotorers uthållighet vid höga temperatur”, RapportTABK--99/7056, Lund University (in Swedish).
Jensen, L. (2002). “Förbättrad brandgasventilation med hjälp av sprinkler”,Rapport TABK--02/7065, Lund University (in Swedish).
Klote, J. H. (1997). “Prediction of smoke movement in atria: part I andII”, ASHRAE Transactions: Symposia, BN-97-5-2, 3.

References
141
Klote, J. K., & Milke, (1992). “Design of smoke management systems”.Atlanta: American Society of Heating , Ventilation and Air-Condi-tioning Engineers, Inc.
Kylander, G. (1995). “Thermal modelling of small cage induction mo-tors”. Chalmers University of technology, Department of ElectricalMachines and Power Electronics, Technical Report No. 265.
Lougheed, G. D., & Hadjisophocleous, G. V. (1997). “Investigation ofatrium smoke exhaust effectiveness”, ASHRAE Transactions: Sym-posia, BN-97-5-1.
Lui, S.T. (1977). Analytical and experimental study of evaporative cool-ing and room fire suppression by corridor sprinkler system. NBSIR77-1287. Gaithersburg, Md.: National Bureau of Standards (nowNIST).
Lundin L. I. (1986). “Air leakage in industrial buildings – description ofequipment”. Measured Air Leakage of Buildings, ASTM STP 904,H.R.Treschel and P.L. Lagus, Eds., American Society for Testing andMaterials, pp. 101-05.
Minitab Handbook, (1988). Second Edition. Boston, Minitab Inc.: PWSPublishes (1988).
Persily, A. K. (1999). “Myths About Building Envelopes”, ASHRAE Jour-nal, March 1999.
RUS 120:4. Regler för automatisk vattensprinkleranläggning, FSABFörsäkringsbranschens Serviceaktiebolag, 199? (in Swedish).
Simnon for Windows, version 1.0, May 1993. SSPA Systems, Box 24001400 22 Göteborg, Sweden.
“Snö och vindlast”, Utgåva 2, Boverkets handbok om Snö och vindlast,BSV 97, BOVERKET 1997 (in Swedish).
Stratton, J. H. (2000). “Metal Duct Selection And Application”, ASHRAEJournal, June 2000.
Tamura, G.T. (1995). Smoke movement and control in high-rise buildings.Quincy, Mass.: National Fire Protection Association.
Tanaka, T., & Yamana, T. (1985a). “Smoke Control in Large Scale Spaces(part 1: Analytic Theories for Simple Smoke Control Problems)”.Building Research Institute, Ministry of Construction, Japan, July,1985.

Smoke and Fire Gases Venting in Large Industrial Space and Stores
142
Tanaka, T., & Yamana, T. (1985b). “Smoke Control in Large Scale Spaces(part 2: Smoke Control Experiments in a Large Scale Space)”. Build-ing Research Institute, Ministry of Construction, Japan, July, 1985.
The SFPA Handbook of Fire Protection Engineering, 2nd edition, ISBN:0-87765-354-2, USA (1995).
William, A., & Webb, P. E. (1995a). “Development of Smoke Manage-ment Systems”, ASHRAE Journal, April 1995.
William, A., & Webb, P. E. (1995b). “Development of smoke manage-ment systems”, ASHRAE Journal, August 1995.

References
143

Smoke and Fire Gases Venting in Large Industrial Space and Stores
144


ISSN 1652-6783ISBN 91-85415-00-6