Embed Size (px)
Citation preview

SMASHING THE AVOCADO DEBATEAUSTRALIA’S YOUTH UNEMPLOYMENT HOTSPOTSMARCH 2019
In recent years the avocado has acquired a mythical status in what passes for the public
debate about Australia’s young people: it is a popular motif that has come to represent
the alleged excesses of an emerging generation. Young people, according to this line of
prosecution by stereotype, are entitled, pampered by parents and overindulging – to their
detriment – in their usage of both social media and various permutations of an overpriced
brunch food item.
How simplistic.
More than a decade after the global financial crisis, the national youth unemployment rate
remains stubbornly high at 11.2 per cent (December 2018). Although now below the post-GFC
peak of 14.1 per cent in November 2014, youth unemployment today is mired at levels similar to
those observed in the early 2000s.
Across Australia, this translates to a quarter of a million young people who remain
unemployed. In the Queensland Outback region, a perennial recent hotspot, a quarter of
young people in the regional labour force remain unemployed. And, as this analysis reveals,
the tale of two Australias persists, with regional and outer suburban locations bearing the
heaviest burden of the youth unemployment challenge.
In reality, Australia’s 15 to 24 year olds are making a highly sensitive transition to adulthood
while, as a nation, we are navigating a period of testing social and economic change as a
result of interconnected challenges posed by globalisation, technology, climate change and
demographic change. While the modern economy presents new opportunities for jobseekers,
it poses particular risks for young people, who often have little or no work experience. Young
people without training opportunities or higher educational qualifications face a double
jeopardy.

BROTHERHOOD OF ST LAURENCE 67 Brunswick Street, Fitzroy, Victoria 3065 02
16%
0%
Dec-2000
Dec-2001
Dec-2002
Dec-2003
Dec-2004
Dec-2005
Dec-2006
Dec-2007
Dec-2008
Dec-2009
Dec-2010
Dec-2011
Dec-2012
Dec-2013
Dec-2014
Dec-2015
Dec-2016
Dec-2017
Dec-2018
12%
10%
14%
8%
6%
4%
2%
NATIONAL SNAPSHOT
At 11.2 per cent in December 2018, the youth unemployment rate remains more than twice
Australia’s overall unemployment rate (5 per cent) and is almost three times the unemployment
rate of those aged 25 and over (Figure 1).
Figure 1: Unemployment rates (%) in Australia for selected age groups, December 2000 – December 2018
Unemployment rate15–24 years
Unemployment rate25+ years
Unemployment rate 15+ years
Source: ABS 2019, Labour force, Australia, January 2019, cat. no. 6202.0, trend data

BROTHERHOOD OF ST LAURENCE 67 Brunswick Street, Fitzroy, Victoria 3065 03
20 YOUTH UNEMPLOYMENT ‘HOTSPOTS’ IDENTIFIED
A striking feature of Australia’s youth unemployment story is that the rates are far from uniform.
In the 20 regions with the highest youth unemployment rates, the risk of unemployment is well
above the national average.
In the Queensland – Outback region, with over a quarter of young people in the labour market
unable to obtain work, the youth unemployment rate has improved from a year ago but remains
the highest in Australia at 25.7 per cent. The Coffs Harbour – Grafton region in New South Wales
has the second highest rate at 23.3 per cent.
While there has been some improvement in the number of regions with very high youth
unemployment, with only two regions across the country having rates above 20 per cent
compared with four regions in December 2017, high rates of youth unemployment continue, more
commonly in regional areas.
The conclusion is that the prosperity dividend from 28 years of continuous economic growth is
deeply uneven, and many young people are locked out.
Table 1: 20 regions with highest youth unemployment rates in Australia
Rank Region State/territory Youth unemployment rate (%)
1 Queensland – Outback Qld 25.7
2 Coffs Harbour – Grafton NSW 23.3
3 Wide Bay Qld 19.8
4 Moreton Bay – North Qld 18.8
5 Bendigo Vic. 18.3
6 South East Tas. 17.8
7 Shepparton Vic. 17.5
8 Townsville Qld 17.3
9 Hobart Tas. 16.9
10 Perth – North West WA 16.7
11 Moreton Bay – South Qld 16.1
12 Logan – Beaudesert Qld 16.0
13 Western Australia – Wheat Belt WA 15.9
14 Melbourne – West Vic. 15.5
15 Barossa – Yorke – Mid North SA 15.3
16 West and North West Tas. 15.0
17 Perth – South East WA 14.9
18 Sunshine Coast Qld 14.7
19 Perth – North East WA 14.6
20 New England and North West NSW 14.3
Data source: LMIP calculations, 12-month average of ABS Labour Force Survey data to December 2018

BROTHERHOOD OF ST LAURENCE 67 Brunswick Street, Fitzroy, Victoria 3065 04
YOUTH UNEMPLOYMENT STICKS
Unemployment among 15 to 24 year olds has persisted at high levels in some regions. Nine of the
regions with the highest levels of youth unemployment in December 2018 had also been in the
top 20 regions in December 2017. These regions are listed below:
Queensland
• Queensland – Outback
• Wide Bay
• Logan – Beaudesert
• Townsville
WA
• Perth – North West
• Perth – North East
NSW
• Coffs Harbour – Grafton
• New England and North West
Victoria
• Melbourne – West
Among the other regions in the top 20 a year earlier, most still had rates higher than the national
youth unemployment rate of 11.2 per cent.

BROTHERHOOD OF ST LAURENCE 67 Brunswick Street, Fitzroy, Victoria 3065 05
FOCUS ON STATES AND TERRITORIES
Each state or territory has its own hottest spot for youth unemployment (Figure 2).
Figure 2: The worst hotspots state by state
Youth unemployment rates vary markedly between states and territories (Table 2).
Table 2: Youth unemployment rates for each state and territory
Region Youth unemployment rate (%)
Australian Capital Territory 9.0
New South Wales 10.3
Northern Territory 10.8
Queensland 12.8
South Australia 12.7
Tasmania 15.1
Victoria 11.4
Western Australia 14.5
Australia 11.2
Data source: LMIP calculations, 12-month average of ABS Labour Force Survey data to December 2018

BROTHERHOOD OF ST LAURENCE 67 Brunswick Street, Fitzroy, Victoria 3065 06
VARIATION WITHIN STATES
There is significant variation in youth unemployment rates within states. Table 3 shows the
national top 20 regions, comparing each with their state’s youth unemployment rate.
For instance, in the Coffs Harbour – Grafton region, youth unemployment rates were 13
percentage points higher than the NSW average. In Victoria, both Bendigo and Shepparton
experienced youth unemployment rates of more than 17 per cent, well above the state rate of 11.4
per cent. In the Queensland Outback region the 25.7 per cent youth unemployment rate is the
highest in Australia, and much higher than the rate for Queensland as a whole. It is important to
note that the overall unemployment rate (for people aged 15–64 years) for this region is also high,
at 13.6 per cent compared with the rate for Australia (5 per cent). This holds for most of the 20
regions, with a high youth unemployment rate reflecting overall unemployment that’s higher than
the national average.
Table 3: Top 20 hotspots compared with state youth unemployment rates
Region Youth unemployment rate (%)
New South Wales 10.3
Coffs Harbour – Grafton 23.3
New England and North West 14.3
Queensland 12.8
Queensland – Outback 25.7
Wide Bay 19.8
Moreton Bay – North 18.8
Townsville 17.3
Moreton Bay – South 16.1
Logan – Beaudesert 16.0
Sunshine Coast 14.7
South Australia 12.7
Barossa – Yorke – Mid North 15.3
Tasmania 15.1
Hobart 16.9
South East 17.8
West and North West 15.0
Victoria 11.4
Bendigo 18.3
Shepparton 17.5
Melbourne – West 15.5
Western Australia 14.5
Perth – North West 16.7
Western Australia – Wheat Belt 15.9
Perth – South East 14.9
Perth – North East 14.6
Note: Australian Capital Territory and Northern Territory regions are not among the top 20 worst hotspots nationally
Data source: LMIP calculations, 12-month average of ABS Labour Force Survey data to December 2018

BROTHERHOOD OF ST LAURENCE 67 Brunswick Street, Fitzroy, Victoria 3065 07
TOWARDS REGIONAL SOLUTIONSGiven the regional variations illustrated by these findings, structural solutions are needed which are finely attuned to local labour markets and infrastructure.
The expertise of industry and employers needs to be harnessed, and combined with the expertise
of government and community sector agencies that work with young people. Employment
services staff need knowledge of local labour markets and must build strong local networks to
ensure that their services can adapt to variable local conditions. The Brotherhood of St Laurence’s
experience of delivering employment programs has found no shortage of goodwill from
employers: they are ready to play an increased role in providing jobs for young people, if they are
given the right support.
The Brotherhood and a network of not-for-profit groups working in 13 regions around Australia
have formed a Transition to Work Community of Practice and developed an innovative, regional
approach through the formation of local Community Investment Committees.
Each committee, chaired by a local employer, brings together partners across sectors – from
business, education providers, local councils, youth employment services and other community
organisations. They work together to develop and implement a local economic development
strategy for young people tailored to the needs of the region.
BROTHERHOOD OF ST LAURENCE 67 Brunswick Street, Fitzroy, Victoria 3065 08
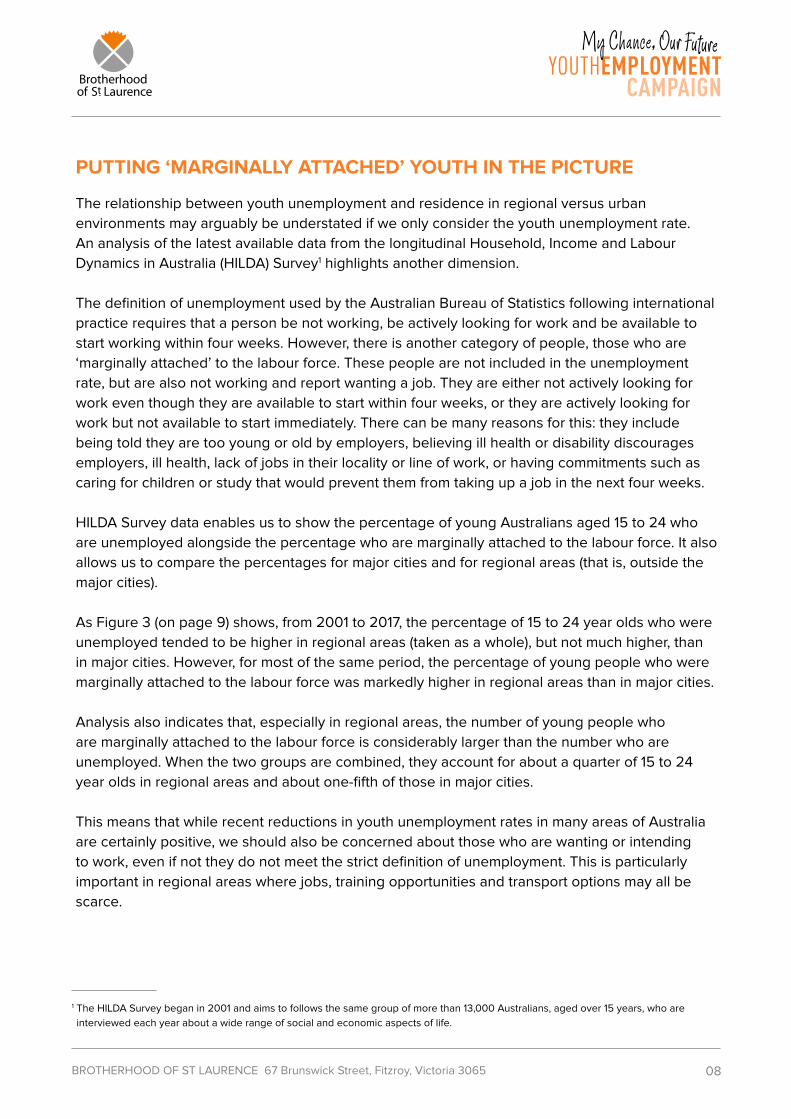
PUTTING ‘MARGINALLY ATTACHED’ YOUTH IN THE PICTURE
The relationship between youth unemployment and residence in regional versus urban
environments may arguably be understated if we only consider the youth unemployment rate.
An analysis of the latest available data from the longitudinal Household, Income and Labour
Dynamics in Australia (HILDA) Survey1 highlights another dimension.
The definition of unemployment used by the Australian Bureau of Statistics following international
practice requires that a person be not working, be actively looking for work and be available to
start working within four weeks. However, there is another category of people, those who are
‘marginally attached’ to the labour force. These people are not included in the unemployment
rate, but are also not working and report wanting a job. They are either not actively looking for
work even though they are available to start within four weeks, or they are actively looking for
work but not available to start immediately. There can be many reasons for this: they include
being told they are too young or old by employers, believing ill health or disability discourages
employers, ill health, lack of jobs in their locality or line of work, or having commitments such as
caring for children or study that would prevent them from taking up a job in the next four weeks.
HILDA Survey data enables us to show the percentage of young Australians aged 15 to 24 who
are unemployed alongside the percentage who are marginally attached to the labour force. It also
allows us to compare the percentages for major cities and for regional areas (that is, outside the
major cities).
As Figure 3 (on page 9) shows, from 2001 to 2017, the percentage of 15 to 24 year olds who were
unemployed tended to be higher in regional areas (taken as a whole), but not much higher, than
in major cities. However, for most of the same period, the percentage of young people who were
marginally attached to the labour force was markedly higher in regional areas than in major cities.
Analysis also indicates that, especially in regional areas, the number of young people who
are marginally attached to the labour force is considerably larger than the number who are
unemployed. When the two groups are combined, they account for about a quarter of 15 to 24
year olds in regional areas and about one-fifth of those in major cities.
This means that while recent reductions in youth unemployment rates in many areas of Australia
are certainly positive, we should also be concerned about those who are wanting or intending
to work, even if not they do not meet the strict definition of unemployment. This is particularly
important in regional areas where jobs, training opportunities and transport options may all be
scarce.
1 The HILDA Survey began in 2001 and aims to follows the same group of more than 13,000 Australians, aged over 15 years, who are
interviewed each year about a wide range of social and economic aspects of life.

BROTHERHOOD OF ST LAURENCE 67 Brunswick Street, Fitzroy, Victoria 3065 09
Figure 3: Unemployed and marginally attached young people as percentage of the 15–24 year old population, major cities and regional areas, 2001 to 2017
35
30
25
20
15
10
5
0
2001 2002 2003 2004 2005 2006 2007 2008 2009 2010 2011 2012 2013 2014 2015 2016 2017
Source: HILDA Survey data, Waves 1 to 17. Author’s calculations from detailed current labour force status. These figures are based on the entire 15–24 year old population, so they differ from the youth unemployment rate, which only considers those in the labour force.
Unemployed + marg. attached, regional areas
Unemployed + marg. attached, major cities
Marginally attached, major cities
Marginally attached,regional areas
Unemployed, regional areas
Unemployed, major cities
NOTE:This paper uses unit record data from the Household, Income and Labour Dynamics in Australia (HILDA) Survey. The HILDA Project was initiated and is funded by the Australian Government Department of Social Services (DSS) and is managed by the Melbourne Institute of Applied Economic and Social Research (Melbourne Institute). The findings and views reported here, however, are those of the authors and should not be attributed to either DSS or the Melbourne Institute.

BROTHERHOOD OF ST LAURENCE 67 Brunswick Street, Fitzroy, Victoria 3065 10
Table 4: Postcodes for 20 regions with highest youth unemployment rates in Australia, December 2018
Rank Region Postcodes
1 Queensland – Outback (Qld) 446744684470447144724474447544774478
447944804481448244884489449044914492
449347244725472647274728473047314732
473347354736480948164821482248234824
482548284829483048714872487448754876
48804887489048914895
2 Coffs Harbour – Grafton (NSW) 237024412448
244924502452
245324542455
245624602462
246324642465
24662469
3 Wide Bay (Qld) 430644054563457045744580
458146004601460546064608
461046114612461346144615
462046214625462646274630
465046554659466046624670
467146734674
4 Moreton Bay – North (Qld) 4019402040214022
4306431345044505
4506450745084510
4511451245144515
451645214552
5 Bendigo (Vic.) 33643435343734403442344434463447
34483450345134533458346134623463
34723475347735153516351735183520
35233525352735373550355135553556
35573558355935673570357135723573
357535763579
6 South East (Tas.) 700170127017702670277030
705471097112711371167117
711971207139714071507155
716271637172717771787179
718071827183718471857186
71877190721372157304
7 Shepparton (Vic.) 271435233551355735583559356135623563
356435653566357235733608361036123614
361636173618362036213622362336243629
363036313633363436353636363736383639
364036413644364636473649366936753678
3685372737283730
8 Townsville (Qld) 480648074808
480948104811
481248134814
481548164817
481848194820
4850
9 Hobart (Tas.) 7000700470057007700870097010
7011701270157016701770187019
7020702170227023702470257026
7030705070527053705470557109
7140715071707171717271737174
717571767177

BROTHERHOOD OF ST LAURENCE 67 Brunswick Street, Fitzroy, Victoria 3065 11
Rank Region Postcodes
10 Perth – North West (WA) 601460156017601860196020
602160226023602460256026
602760286029603060316032
603360346035603660376038
605060526059606060616062
60646065607760786079
11 Moreton Bay – South (Qld) 40354037
40534054
40554500
45014502
45034509
45204521
12 Logan – Beaudesert (Qld) 4114411741184119
4123412441254127
4128412941304131
4132413342054207
4270427542804285
4287
13 Western Australia – Wheat Belt (WA) 6041604260436044608360846207621362256244630263046306630863096311631263136315631663176318632063216322
6323632463266327632863306333633563366337633863416343635063516352635363556356635763586359636163636365
6367636863696370637263736375638363846385638663906391639263936394639563966397640164036405640764096410
6411641264136414641564186419642064216422642364246425642664276428646064616462646364656466646764686470
6472647364756476647764796480648464856487648864896490650165026503650465056506650765096510651165126513
651665216558656065626564656665676568656965716572657465756603660566066608660966126613
14 Melbourne – West (Vic.) 30113012301330153016
30183019302030213022
30233024302530263027
30283029303030323036
30373038321133353337
3338334033413427
15 Barossa – Yorke – Mid North (SA) 52355320535053515352535353555356536053715372537353745381
54005401541054115412541354145415541654175418541954205421
54225431543254335440545154525453545454555460546154625464
54705471547254735480548154825483548554905491549354955501
55025510552055215522552355405550555255545555555655585560
557055715572557355755576557755805581558255835710

BROTHERHOOD OF ST LAURENCE 67 Brunswick Street, Fitzroy, Victoria 3065 12
Rank Region Postcodes
16 West and North West (Tas.) 7256727573047305
7306730773107315
7316732073217322
7325733073317466
7467746874697470
17 Perth – South East (WA) 60576058607661006101
61026103610461056106
61076108610961106111
61126121612261236124
61256126614761486149
6151615261556182
18 Sunshine Coast (Qld) 45174518451945504551
45524553455445554556
45574558455945604561
45624563456445654566
45674568456945714572
457345744575
19 Perth – North East (WA) 60506051605260536054
60556056605960626063
60646066606760686069
60706071607260736074
60766079608160826083
60846090655665586560
20 New England and North West (NSW) 2338233923402341234223432344234523462347
2350235123522353235423552356235823592360
2361236523692370237123722379238023812382
2386238723882390239723982399240024012402
2403240424052406240824092410241124532469
24752476283343834385