Embed Size (px)
Citation preview

Smart Urban Low Voltage Network
Low Carbon Network Fund Tier 1 Project
UK Power Networks & TE Connectivity

Improved safety
Enhanced network
modelling / planning
Project Background
• Follow-on project after successful IFI trials.
• IFI project aims: Develop a new solid-state switching technology for use on the LV distribution network.
• LV Remote control and automation system utilising retrofit switching devices to be installed and trialled on LPN LV network.
• Project registered in July 2012 – Project aims:
- Undertake a large scale demonstration of technology developed in the IFI project.
- Explore the benefits provided by an integrated LV remote control and automation system.
Maximise utilisation of
plant
Quality of Supply
improvements
Active Network Management
LV Remote Control & Automation– System Component Devices
Installed to LV Link Boxes
Load-break / fault-make switches replace solid links in LV Link Boxes
Local control of switches provided by a control panel (fits under LB lid).
Switches being installed to a link box in place of standard links.
RTU (Remote Terminal Unit) provides remote control of the LV devices.
Single phase fault-break / fault-make circuit breakers (CB) retrofitted in place of the existing LV fuses.
At the distribution substation
LV CBs installed to a LV distribution board at a UKPN IFI trial site.
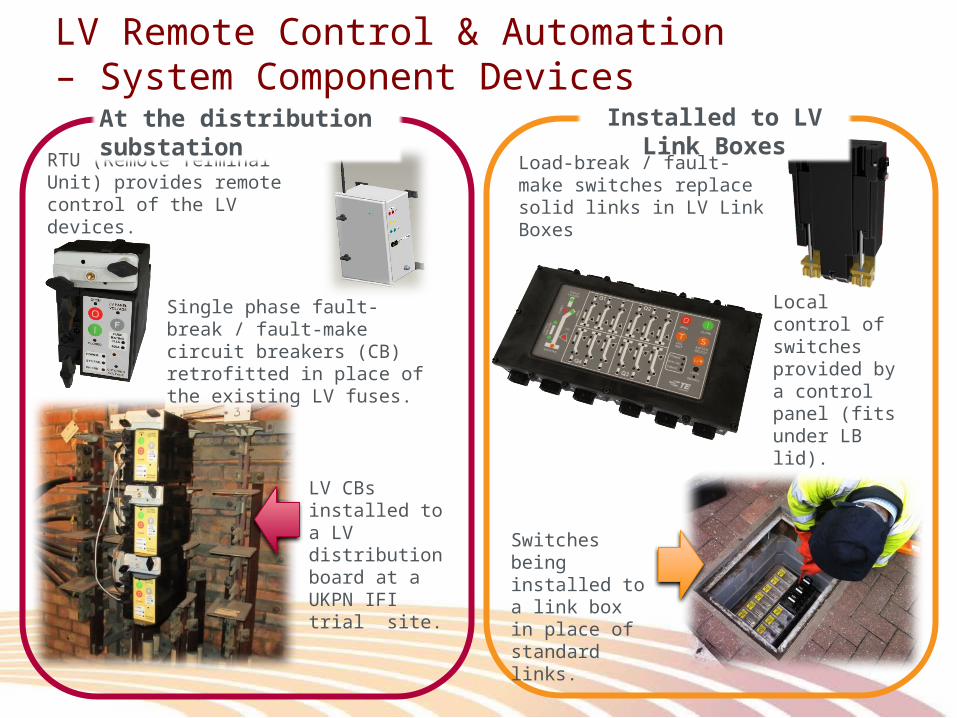
LV Remote Control & Automation - Smart LV Network Overview

Project Scope & Key Objectives:
Evaluate and demonstrate the benefits of the technology over a 24 month trial/demonstration phase.
Industrialise existing technology supplied for a small scale IFI project.
Integrate the LV remote control technology with our existing control platforms (via DNP3, and PLC)
Implement active network management tools.
Strategically populate 2 selected areas within the LPN LV network with the LV Remote Control & Automation devices (54 secondary substation sites).
Actively manage the LV network to improve network performance.
Industrialisation & control integration Deployment
Use highly granular visibility of the LV network to improve our understanding and management of the LV network.

LCNF Tier 1 - Project Location
Area 1 – City Rd B South West Feeder Group.
Area 2 – City Rd B North West 1 & North West 4 feeders.
Trial will covers a total of 54 secondary substations supplying approximately 8400 customers.

LCNF Tier 1 - Project Location & Scale (Area 1)
7
Area 1 – SW Feeder Group Secondary Substations
•3 Feeder Group, with 38 distribution substations (27 to be populated).
•Area is experiencing loading issues (inc load related fuse operations).
•65 link boxes to be populated with LV remote control devices.
City Rd B South West feeder group; evaluate proactive management of the LV network.
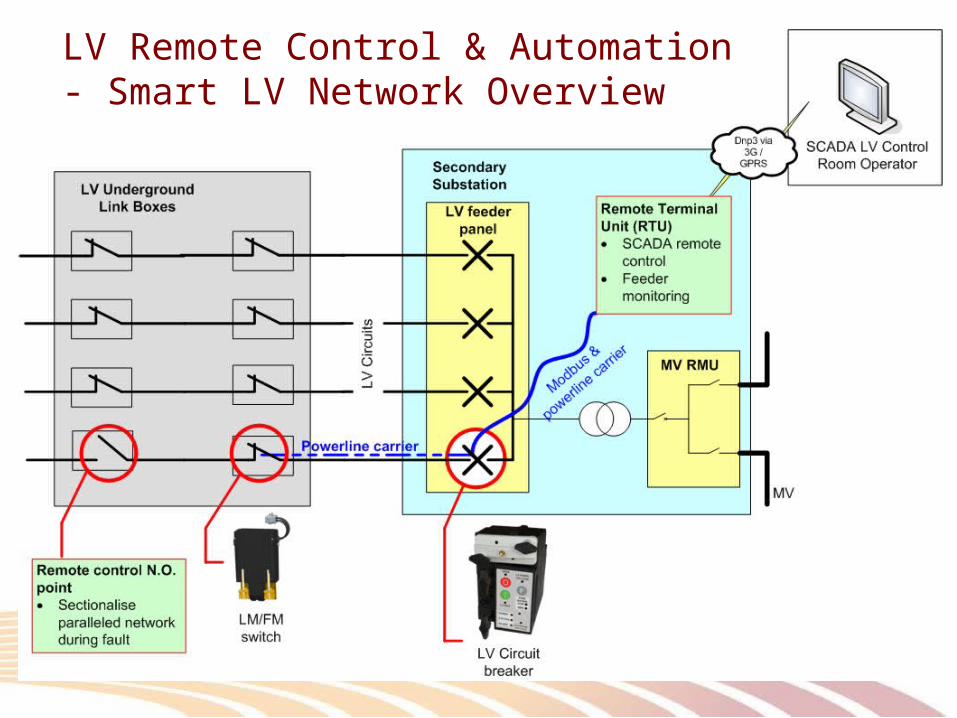
LCNF Tier 1 - Project Location & Scale (Area 2)
8
Area 2 – NW 1 & 4 Feeders
•25 distribution substations, covering area of approx 2km Sq.
•Consistently worse feeders from CI/CML perspective.
City Rd B North West 1 & North West 4 feeders; evaluate benefits to network performance, offered by remote control and automated switching.
•101 link boxes to be populated with LV remote control devices.
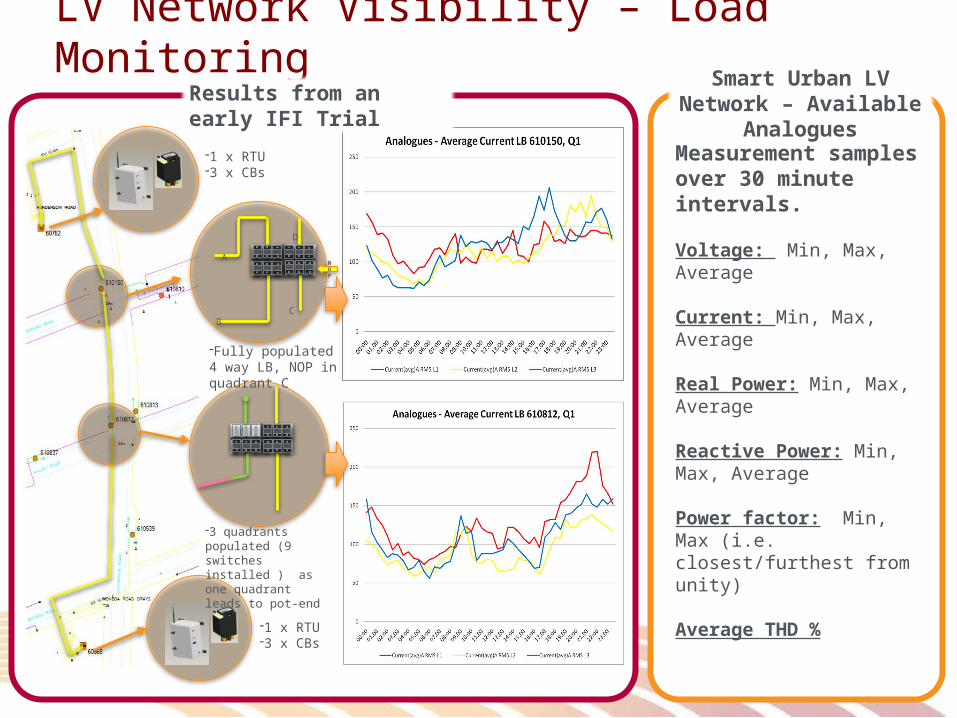
LV Network Visibility – Load Monitoring
A
BC
D
NOP
-1 x RTU-3 x CBs
-1 x RTU-3 x CBs
-Fully populated 4 way LB, NOP in quadrant C
-3 quadrants populated (9 switches installed ) as one quadrant leads to pot-end
Results from an early IFI TrialSmart Urban LV Network –
Available Analogues
Measurement samples over 30 minute intervals.
Voltage: Min, Max, Average
Current: Min, Max, Average
Real Power: Min, Max, Average
Reactive Power: Min, Max, Average
Power factor: Min, Max (i.e. closest/furthest from unity)
Average THD %
Voltage harmonics: Max % harmonics up to 50th harmonic (available on demand from direct request to RTU)

LV Network
Faults
LV Network Visibility
Safety
• Response and isolation can take a number of hours
• Penalties incurred & high operational costs to resolve
Remote Control
• Reduce operating costs for fault response
• Faster restoration of supply to customers
• Improve reliability statistics
• Feeder overloading due to EV, heatpumps, etc.
• Voltage or harmonic issues due to renewable generation
Load monitoring
• Feeder and network voltages• Load current and direction• Peak fault current and direction• Enables integration of distributed
generation and EV
• Hazardous manual operations• Contact arcing• High fault currents• Damage to transformers &
cables
Solid state switching
• Arc-less current switching• Fault sensing technology• Intelligent load make/ fault make
technology• Phase-Phase voltage fault
verification / alarms
Key problems and solutionsTraditional LV Network Smart LV Network

Reliable communication to underground LB for control and load monitoringPower line carrier communications• Power line carrier reliability and performance critical
especially during LV faults –Existing solutions for smart metering inadequate for LV
network automation–Design of end to end communication layers above plc
networking layer critical to success• G3 plc offers improved bandwidth and network formation
–Higher bandwidth necessary for load monitoring–Lab test benches to simulate LV network environment–Validate performance during field trials
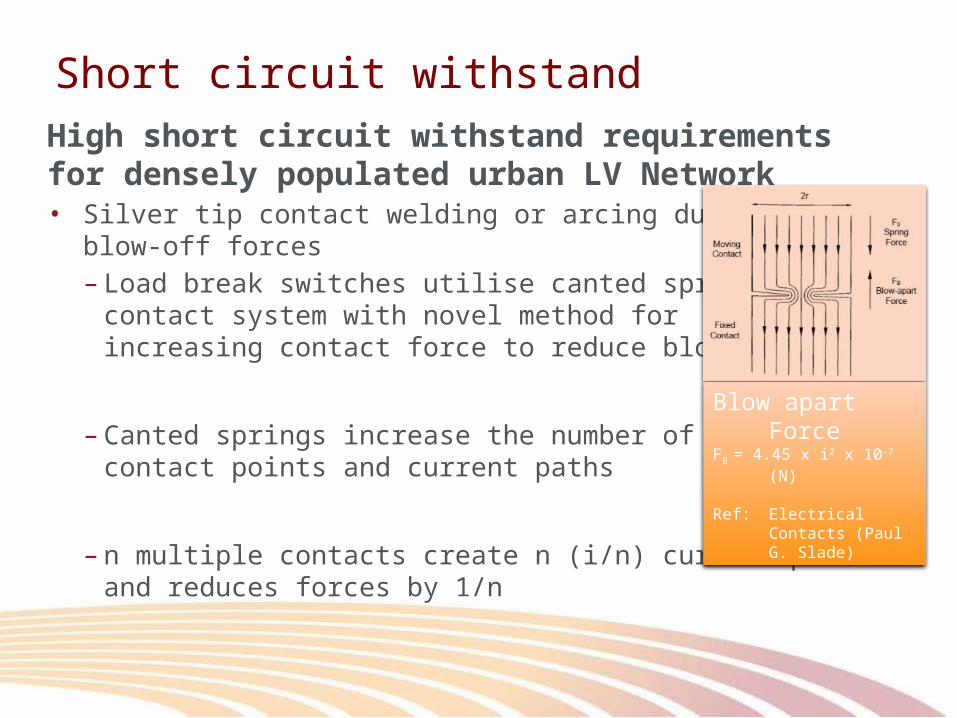
Short circuit withstandHigh short circuit withstand requirements for densely populated urban LV Network• Silver tip contact welding or arcing due to
blow-off forces– Load break switches utilise canted spring
contact system with novel method for increasing contact force to reduce blow-off force
– Canted springs increase the number of contact points and current paths
– n multiple contacts create n (i/n) current paths and reduces forces by 1/n
Blow apart ForceFB = 4.45 x i2 x 10-7 (N)
Ref: Electrical Contacts (Paul G. Slade)

Compact switching technology
• Thyristors gate drives are switched on just prior to zero crossing
• Pulse peak current measured
• Progressively increase pulse duration
• Analyse peak currents• Determine if current is
due to load or a fault
Thyristor module
Solenoid actuator Mechanicaly
operated switch
Cur
rent
Vol
tage
Load Make
Fault threshold levelswitch will not close
Fault Make
Solid state switching technology

Usability Challenges & Solutions• Retrofit solution
– Space constraints within link boxes– Optimising design to work with wide variety of installed LV
switchgear
• Safety and operator issues– Introduce safety features to prevent un-intentional operations– Regular design review meeting using rapid prototypes to address
installation and safety issues– Improvements to remote control functionality and usability based
on user feedback
• Load monitoring– Optimisation of parameters monitored to match bandwidth
available– Harmonic data storage and transfer separate from SCADA
system

Progress• Site selection and surveys complete.• Demonstration area preparation underway.• Next Gen PLC technology trialled and evaluated.• Tier 1 hardware industrialisation underway.
• Approach to control integration (dynamic LB movement agreed)
First 14 site deployment planned for Jun 2013

Thank You
Any Questions?
Contact Details
Alexander Di Donato:[email protected] Development Engineer
Brendan Normoyle: [email protected] Connectivity R&D Manager
Matthieu Michel : [email protected] Innovation & Co-ordination Manager