Embed Size (px)
Citation preview

Smart Investments in Minnesota’s Students
Presented by Angie Eilers, Ph DResearch and Policy Director

2
What is Growth & Justice?
A progressive voice on state economic issues.
A non-partisan advocate for fair taxation and "smart" public investment that advances prosperity for all Minnesotans.
We believe a sustainable economy provides the foundation for a just society.

3
Our process for change
Start with the facts
Reframe the issue
Engage the public and specialistsEngage the public and specialists
Propose strategic frameworks and policies
Initiate statewide discussions
Work toward change

4
Growth & Justice Agenda for Real Prosperity
Smart Investments in
Minnesota’s People & Places
Infrastructure & economic
development
Comprehensive education
Healthy communities
Government accountability
Fair ShareTaxation

Why Invest Now?
We’re losing our economic edge — and the trends are heading the
wrong direction

6
We weren’t always above average
85%
90%
95%
100%
105%
110%
1930 1940 1950 1960 1970 1980 1990 2000 2007p
Per Capita Income
Per Capita DisposableIncome
Minnesota’s income growth followed investment

7
Investment impact
When we invested more, our economy did better
Minnesota’s compound annual growth rate vs. US average
5.24%
4.40%3.69% 3.66%
1991-1998 1998-2005

8
But we’re no longer above average
• State real per capita GDP growth• Academic R&D spending• Employment rate• Employment growth• Personal income growth

Where would get the money?
A penny on the dollar roughly equals $1 billion per year
10
Current tax situation
Household Income
$100,000 $460,000 +$65,000
10%
Effective tax rate (% of income)
5%
12.3% 12.4%
9.3%
3-point gap
between top &
middle earners

11
Real Prosperity Proposal
Household Income
$100,000 $460,000 +$65,000
10%
Impact of a penny on the dollar increase
5%
more or less
more or less
Most households
would pay half a penny or less
or less

12
Prosperity grows from education
Economists, educators and business leaders agree:
A well-educated population has been one of Minnesota’s chief economic
advantages.
13
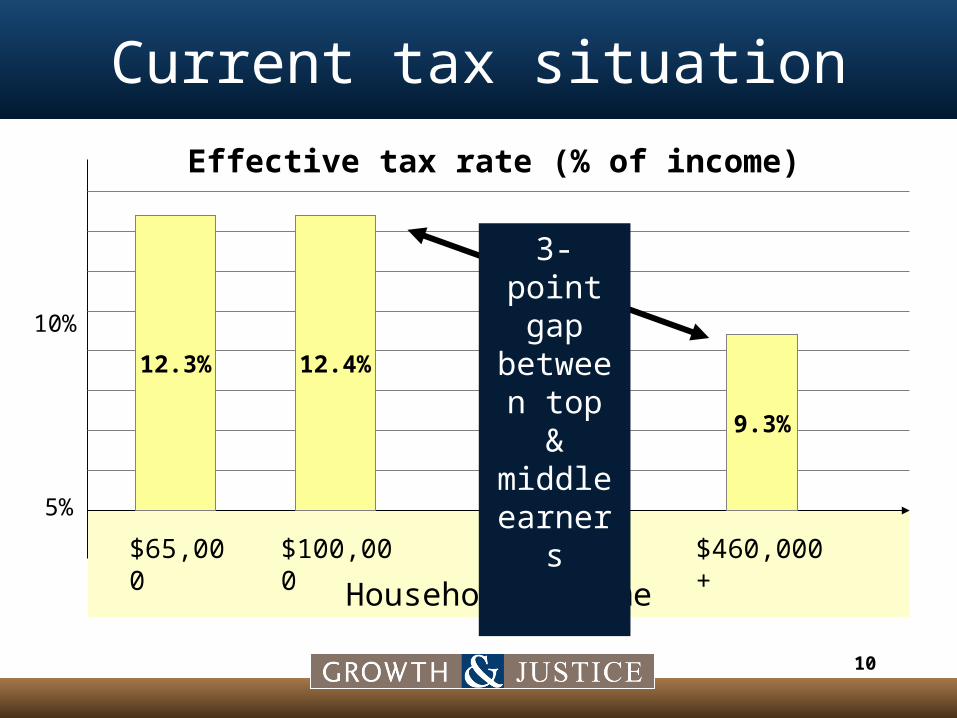
Strategic education goal for Minnesota
Challenge: If Minnesota had $1billion to invest in education, how and where would we in order to:
Increasing by 50% the rate of students who finish post-secondary education by 2020, including increasing the attainment rate of students of color and Native Americans accordingly.

14
Minnesota’s education challenge
2006 2020
BS or MoreAA DegreesOtherSlice 4
BS or moreAA degreesOther
By 2020, a smaller proportion of Minnesotans will have a post-secondary education
BS or more
AA degree
HS or less
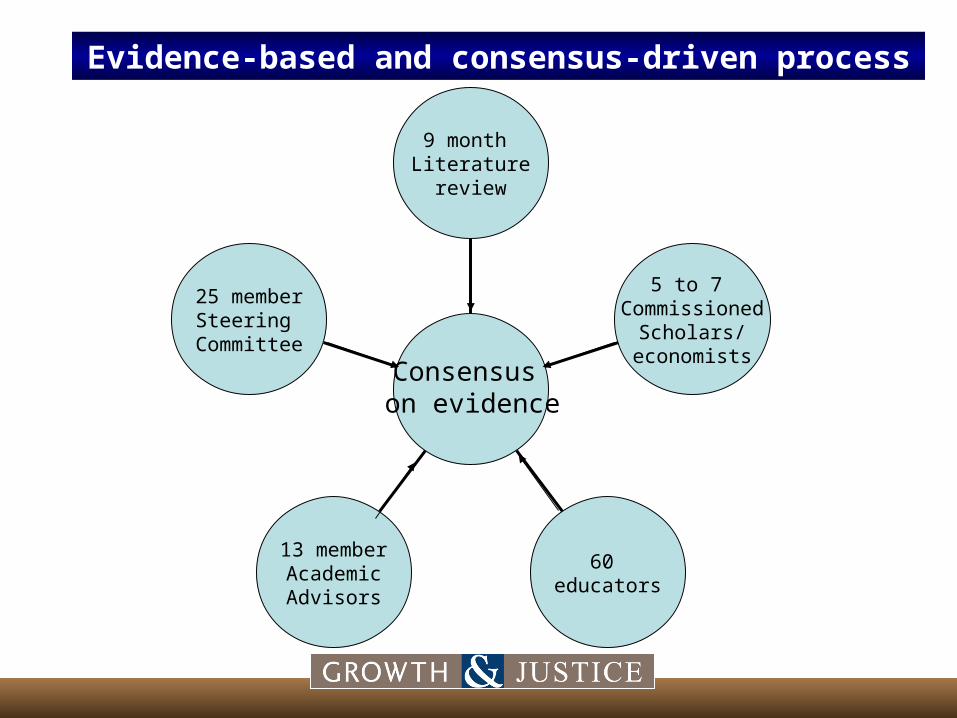
25 memberSteering
Committee
13 memberAcademicAdvisors
60 educators
5 to 7 Commissioned
Scholars/economists
9 month Literature
review
Evidence-based and consensus-driven process
Consensus on evidence

16
Statewide Steering Committee
Nicola Alexander, Professor, College of Education, University of Minnesota
Linda Baer, Sr. Vice Chancellor for Academic and Student Affairs, MNSCU
Darlyne Bailey, Dean, College of Education, University of Minnesota
Meria Carstarphen, Superintendent, St. Paul Public Schools
Mary Cecconi, Executive Director, Parents United for Public Schools
Maureen Cisneros, Student/Regent, University of Minnesota
Jennifer Godinez, Director, Minnesota College Access Network
Lynn Haglin, Vice President/KIDS PLUS Director, Northland Foundation
Jerry Halverson, Sr. Faculty, Capella University
Vernae Hasbargen, Sr. Legislative Analyst, MN Rural Education Association
Robert Johnson, Professor, State Cloud State University
Steve Kelley, Senior Fellow, Humphrey Institute

17
Statewide Steering Committee
Laura LaCroix-Dalluhn, Executive Director, Youth Community Connections
Rene Lara, Legislative Action Specialist, Education Minnesota
Jim Meffert-Nelson, Chair, Children’s Platform Coalition
Todd Otis, President, Ready 4 K
Eugene Piccolo, Executive Director, MN Association of Charter Schools
Peter Sadowski, Antares Pharma, Inc.
Don Schuld, Assistant Superintendent, Stillwater Area Schools
Jim Southwick, Medtronic
Lee Ann Stephens, Teacher, Education Minnesota teacher of the years
Judy Temple, Professor, Humphrey Institute, University of Minnesota
Neal Thao, Faculty of Social Work, Metro State University
Greg Vandal, Superintendent, Sauk Rapids-Rice School District
Pam Willard, Director, Golden Heart Child Care Center

18
Evidence of effectiveness
Best bang for the buck
Benefit/costBenefit/cost
Intervention selection process
Body of Research

19
Projected Change in Working Age Population (Age 25-64) by Race/Ethnicity, 2000-2030
Source: Minnesota State Demographic Center
157,072
127,926
165,803
113,354
60,850
19,513
0
50,000
100,000
150,000
200,000
White African-American
Hispanic/Latino Asian/PacificIslander
NativeAmerican/AK
Native
Two or MoreRaces
7% 152% 270% 169%75%
341%

20
Making the CasePercent increase needed by subpopulations
to reach 50% attainment
48%
33%
153%
45%
243%
220%
30%15%
150%
67%
275%
233%
0%
50%
100%
150%
200%
250%
300%
MN White Black AsianAmerican/ Pacific
Islander
Hispanic AmericanIndian/ Alaskan
Native
6 year rate (BA)
3 year rate (AA)

How to best invest?
Invest in the whole student
from birth to college

22
Smart Investments in MN Students:Where Should We Invest Our Next Dollar?
Pre-K
All 3rd graders read at or above grade level
13-163rd
K
Every child enters school ready to learn
All students pass Algebra I by the end of 8th grade
Students who enter post-secondary school finish
with a degree
All high schoolers graduate prepared for post-secondary school through rigorous courses
(Algebra II, Chemistry/ Physics)
8th
Finish
Prep
Goal: Increase by 50% the number of students who finish post-secondary education
Start Post-Sec
Students who are qualified to enroll in post-secondary
schools begin within 3 years of H.S. graduation
-Where are we currently in Minnesota on each of these outcomes?-What are effective interventions that achieve these outcomes, and at what cost?-Which investments get the greatest return for the dollar?

23
What works?
Research addressed what works from cradle to college

24
Percent of Students “Not on Track”
Not on Track by Proficiency Level(Education Assessments & Attainments by Race/ Ethnicity, Income & Geography)
95%
59%
86%
56%59%
21%19%
73%
81%
58%
67%
60%57%
51%
64%62%
52%
67%
57%
88%
81%
21% 20%
88%
84%86% 87%
68%
83%
41%
92%
84%
78%81%
82%81%
84%
50%
91%
85%
72%
87%
81%
62%
87%
43%
80% 78%
65%
46%
66%
57%
81%
17%
71%73%
17%
30%
52%
42%
9%7%
59%
70%
8%
40%42%
58%
78%78%
49%
63%
48%
65%
61%
0%
10%
20%
30%
40%
50%
60%
70%
80%
90%
100%
Reading - NotReady for K
(Non-White/ White &
Income)
Math - Not Readyfor K (Non-
White/ White &Income)
Total Studentsbelow proficientfor K (Reading)
Total Studentsbelow proficientfor K (Math)
Reading belowproficient - 4th
NAEP
Math belowproficient - 4th
NAEP
Reading belowproficient - 8th
NAEP
Math belowproficient - 8th
NAEP
Not enrolled inHS Advanced
Math*
Below proficient -MCA-II Reading
Exam**
Not in DualEnrollment (Non-White/ White)***
Do not meet all 4Benchmarks - 12th
ACT
Do not graduatefrom HS
Do not finish AAwithin 3 years
Do not finish BAwithin 6 years
Black
Hispanic
American Indian/ Alaskan Native
Asian American/ Pacific Islander
White
Income $35,000 or less
Eligible F/ R Lunch
City
Suburb
Town
Rural

25
K-3K-3
Pre-KPre-K
4-124-12
Graduate/transition
Graduate/transition
Post-secondaryEnrollment
& Completion
Post-secondaryEnrollment
& Completion
Recommended investments
Ability to earn an income that supports basic
needs
Ability to earn an income that supports basic
needs

26
K-3K-3
Ready for K:Birth to 5 care
correlatesw/ learning readiness
Ready for K:Birth to 5 care
correlatesw/ learning readiness
4-124-12
Graduate/transition
Graduate/transition
Post-secondaryEnrollment & Completion
Post-secondaryEnrollment & Completion
Birth to 3- home visits/mentors Birth to 4 - quality childcare 4 yr old - quality preschool

27
K-3:Readiness correlates
with proficiency inbasic skills
K-3:Readiness correlates
with proficiency inbasic skills
Pre-KPre-K
4-124-12
Graduate/transition
Graduate/transition
K-3 Comprehensive program:•Class size reduction •Intensive instruction •Family supports/social skills
K-3 Comprehensive program:•Class size reduction •Intensive instruction •Family supports/social skills
Post-secondaryEnrollment
& Completion
Post-secondaryEnrollment
& Completion

28
K-3K-3
Pre-KPre-K
4-12: Proficiency at grade-level
correlates w/ HS success
4-12: Proficiency at grade-level
correlates w/ HS success
Graduate/transition
Graduate/transition
4th – 12th comprehensive program:• Rigorous coursework•Small Learning Communities, advocacy, curriculum alignment •Dropout/pregnancy prevention, counseling, social supports
4th – 12th comprehensive program:• Rigorous coursework•Small Learning Communities, advocacy, curriculum alignment •Dropout/pregnancy prevention, counseling, social supports
Post-secondaryEnrollment
& Completion
Post-secondaryEnrollment
& Completion

29
K-3K-3
Pre-KPre-K
4-124-12
Graduate From HS/
Transition to Higher ed
Graduate From HS/
Transition to Higher ed
•Financial assistance•Access/counseling
•Financial assistance•Access/counseling
Post-secondaryEnrollment
& Completion
Post-secondaryEnrollment
& Completion

30
Increase by 50% the number of students who finish a post-secondary
degree by 2020
Increase by 50% the number of students who finish a post-secondary
degree by 2020
K-3K-3
Pre-KPre-K
4-124-12
GraduateGraduate
Early careEarly care
Quality curriculum & instruction
Quality curriculum & instruction
Grade-level proficiency Grade-level proficiency
Academic, financial & social support
Academic, financial & social support
Post-SecondaryEnrollment
& Completion
Post-SecondaryEnrollment
& Completion

Where to invest?
Invest in what delivers best results for the money — for the student

32
Sample intervention: Early care
Nurse Home Visiting
Registered nurses visit homes of at-risk, first-time mothers of children prenatal to age 2. Effects include:
• improved prenatal health
• fewer subsequent pregnancies
• increased intervals between births
• fewer childhood injuries
• improved school readiness
•increased maternal employment
$35 million for 60,000 families at 185% of
poverty
Benefit/Cost:
$6 : $1

33
Sample intervention: Pre-K–3
Chicago Child-Parent Centers
Reading & math instruction, field trips. Parents volunteer in classroom, get social services, job & parenting skills
training. Effects include:
• lower rates of depression
• less violent crime & incarceration
• less public assistance
• more likely to attend 4 year college
• more likely employed full-time
$285 million for 36,000 Pre-K to 3rd graders below proficiency
Benefit/Cost:
$10 : $1

34
Sample intervention: Grades 5-8
Achievement for Latinos Through Academic Success
Counselors assigned to Latino students and their families monitor attendance, behavior and achievement; train in problem-solving; offer feedback, remediation and
advocacy. Effects include:
• 5% higher graduation rate
$4000 per student for Latinos below
proficiency levels
Benefit/Cost:
$2.90 : $1

35
Sample intervention: 9 -12
Talent Development High School
Small leaning community plus comprehensive programs with rigorous coursework, teacher professional development, mentoring relationships & parent and community strategies. Effects include:
• improved progression from 9th to 10th grade (+8 pts)
• increased graduation rates (+16 pts)
$56 million for 160,000 9-12 graders below
proficient in both math & reading
Benefit/Cost:
$6.56 : $1
36
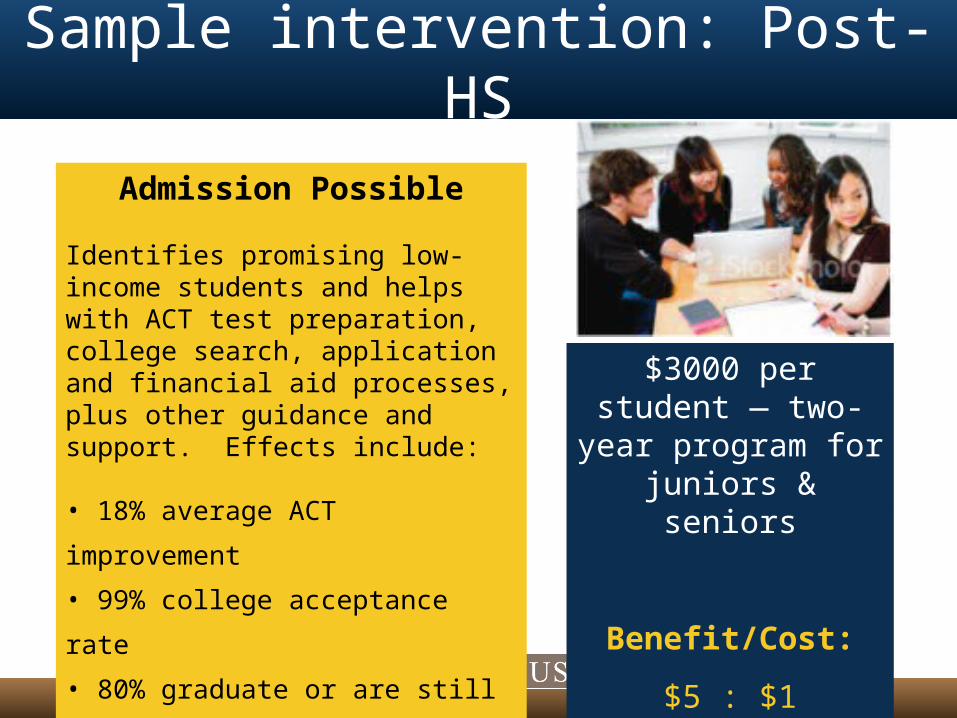
Sample intervention: Post-HS
Admission Possible
Identifies promising low-income students and helps with ACT test preparation, college search, application and financial aid processes, plus other guidance and support. Effects include:
• 18% average ACT improvement
• 99% college acceptance rate
• 80% graduate or are still in school
$3000 per student — two-year program for
juniors & seniors
Benefit/Cost:
$5 : $1

37
How investments follow the student

38
What we can do now
Uphold a child-focused, life-cycle view that cuts across traditional system boundaries
Use data on outcomes to choose interventions for specific populations
Talk about what works in terms of education outcomes and economic benefits
Advocate for funding innovation, not just restoring cuts to current system