Embed Size (px)
Citation preview

SMART FrameworkVersion 1 DRAFT
June 23, 2005


Testing SMART in the field
• Action Against Hunger (ACF) runs a large number of nutritional programs in the field and has extensive years of experience in the field of nutritional assessment.
• ACF-USA was asked to test the SMART methodology and the Nutrisurvey software in the field, to pinpoint potential weaknesses/problems with both tools and recommend solutions.
This feedback compares what the traditional management of nutritional surveys and data analysis and the proposed SMART methodology.

Feedback on Nutrisurvey software
Starting in October 2004, ACF-USA analyzed several nutritional surveys done independently in the field using both the SMART and the traditional EPI5/Epinut software.
Feedback was given during the last trimester to improve the practical use of the software and the data provided. These problems were corrected by the software designer.

Field Test
The SMART methodology was tested in Chad, in June 2005.
ACF-USA programs in Chad:• Training in the management of severe malnutrition for
agencies intervening in the camps (starting November 2004)
• Nutritional surveys/surveillance in 7 camps and neighboring local communities (starting December 2004)
• Post-distribution monitoring and food basket monitoring in 6 camps (starting February 2005)
• Management of severe and moderate malnutrition (TFC/SFC) in Oure Cassoni camp (starting July 2005)

Field TestGuereda was chosen for the test.
This village neighbors several refugee camps. It is highly probable that the population suffers from a strain on its resources.
An exploratory mission prior to the survey showed:• The population is agro-pastoralist.• The rainy season in 2004 was short, resulting in poor harvests and
migration to the south to feed the cattle.• Access to water is an issue: the only points of potable water are in
the 2 refugee camps (Mile and Kunungu). The local population relies on unprotected wells.
• No latrines were observed.• Health care is mainly provided by 1 hospital and 1 health centre in
Guereda. The drug supply is supported by an NGO. In the rest of the district, health centers lack drugs and equipment.
• The presence of the refugee population has led to pressure on water fuel (wood) resources.

Site of the nutritional survey implemented with SMART: Guereda, Dar Tama District.
Estimated population: 23,130 (6 of 10 cantons in the district)
Field Test
Constraints encountered during the realization of the SMART survey:
• Lack of communication equipment: the teams had no means of communication while in the field
• Tight schedule: this survey is part of a pool of nutritional surveys. Timing was tight to avoid the rainy season (starting in July), during which some roads are not passable. Additionally, a nutritional emergency was detected in a camp, which diverted the nutrition team during May.
• Lack of training/preparation: the expatriate nutrition survey coordinator is very experienced in this field, using traditional survey methodology. This was seen as an advantage at first, but in reality he tended to resort to the ways he was familiar with, and little follow-up could be done from the headquarters in real time.

Field Test
Feedback from this field test:
1. Standardized training2. Mortality survey3. Use of the software

1. Standardized TrainingACF-USA methodology
• Measurers are trained in anthropometrical measurements during the theoretical training and during the pre-test (1 or 2 days) in the field under survey conditions.
• Validation is subjective, no fixed number of repeated measurements (ACF guideline mentions at least 20 measurements for each surveyor, but this is not always applied on the field), no statistical test.
• The standardization test is left in the hands of the field nutritionist: no communication on this part of the survey to the headquarters.
SMART methodology• The standardization test is part
of the training (one full day).• The supervisor and each team
measure ten children twice. The figures are recorded in the software. The statistical test is automatic and provides an objective validation of measurement quality.
• The standardization test is included in the set of data sent to the headquarter: the quality of the measurement is fully part of the quality check of the survey.

1. Standardized TrainingThe survey was implemented by 6 teams.According to the training methodology, each child was to be measured
26 times (2 times by each measurer and 2 times by the supervisor). There are too many measurements on each child, even with fewer
teams and even if the measurements are divided in 2 sets. The children cry and are agitated. In such conditions, it is very challenging to have quality data and the test becomes unreliable.
As a result, the supervisor decided to have each team measure a child
twice (half the measurements), but the software test could not be used, as 20 data sets are needed.
The software should propose an option for fewer measurements, as
the field teams are not expected to complete the required measurements in bad conditions.

2. Retrospective Mortality Survey
The use of 2 questionnaires (one for each household and one compiling results for each cluster) was not easy to understand.
3 survey days were necessary to enter the data correctly, but the results were more accurate than those obtained with the traditional methodology.
Longer training on this point and a longer pre-test.

3. Use of Nutrisurvey Software
3.1. Sample size
This utility was not used by the field team.
The total number of children to be measured, as calculated by the software, was 467, which the team found disturbing, as they are used to survey 900 children in the traditional methodology.
Due to the communication constraints enumerated previously, they could not consult the headquarters on this matter and did what they thought was best - the standard 30x30 cluster sampling.
The instructions must emphasize that measuring less than 900 children in a nutritional survey is fine. This would have saved 50% of the field work with similar accuracy in the results.

3. Use of Nutrisurvey Software
3.2. Data entry
Feedback from the field is very positive: • Data is easy to intuitively enter. • No need to read a guideline, saving time. • The concurrent Weight/Height index calculation allows
modification during the data entry (versus at the end, as with EPI5).
Other comments:• The process of adding extra data (i.e. “measles vaccination”)
was not obvious, even if simple. The cursor must be placed in the first empty column on the right. If placed in a used column, it does not work.
• The calculation of the Weight/Height index appears on the data-entry screen in Z-scores, but not in % of the median (this is calculated in the Excel report only). As admission criteria are expressed in % of the median, it would be convenient to have this also on the main screen.

3.3. Data Quality checking
ACF-USA methodology• Standard deviation in the
W/H curve• Distribution of “flags” and
cases of malnutrition per team and per cluster
• Digit preference in anthropometric measurements
• W/H curve aspect (regularity)
Nutrisurvey• Standard deviation• Kurtosis• Skewedness• Distribution of cases of
malnutrition per cluster, per half cluster per team
• Digit preference• Distribution of oedema
(Poisson’s Law)• etc
3. Use of Nutrisurvey Software

3. Use of Nutrisurvey Software
3.3. Data Quality checking (continued)
The set of tools available through the Nutrisurvey software allows for the improvement of data analysis. But the interpretation of the results requires a higher degree of competence, which can be absent at field level.
In ACF-USA, the process of data validation is usually done at headquarters level.
The main reasons for this: Desire to standardize and centralize the analysis of critical information
such as nutritional surveys. Lack of competence on the field: most of those in charge of nutritional
surveys and their field coordinators have nursing or nutrition backgrounds. They lack the skills needed to validate the quality of the data. Most attend a general pre-departure training prior to their first mission, where survey methodology and EPI5/EPINUT are taught in general terms, for practical use.
The reality of the field: surveys are done alongside other nutritional programs and survey supervisors are often also in charge of these programs. Data entry and analysis are time consuming and must be done soon after the field work to avoid delays in report publication.

3.4. Analysis of the resultsThe automatic analysis of the results and completion of the report are a
great improvement, as compared to the tools used by ACF-USA (EPI5/EPINUT).
Comments: • The average for the Weight/Height distribution curve is not calculated. • In the narrative report, acute malnutrition rates in percentage of the
median are not provided with a confidence interval.• MUAC analysis and the significance of the difference of malnutrition
between boys and girls and between age groups was not reported in the narrative report.
• The Excel report provides much crude information, but its use and interpretation is not easy for a non-skilled person.
• Interpretation and choice are left to the user but again, s/he might not be skilled enough to make an informed decision (for instance, weight of the kwashiorkor cases to be corrected or not; a curve with a kurtosis / standard deviation out of range - to which extent is the data still considered usable, what could be done to correct this.)
• The W/H distribution curve obtained by the Nutrisurvey software is less smooth and regular than the one provided by EpiNut, for most nutritional surveys (see next slide).
3. Use of Nutrisurvey Software
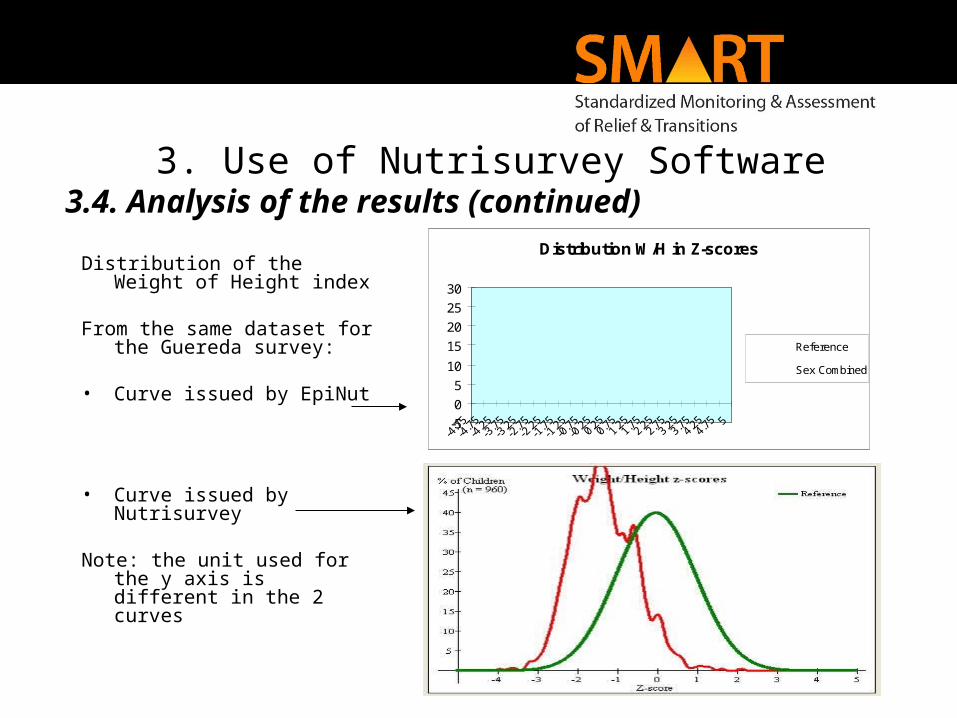
Distribution of the Weight of Height index
From the same dataset for the Guereda survey:
• Curve issued by EpiNut
• Curve issued by Nutrisurvey
Note: the unit used for the y axis is different in the 2 curves
Distribution W/H in Z-scores
-5
0
5
10
15
20
25
30
Reference
Sex Combined
3. Use of Nutrisurvey Software3.4. Analysis of the results (continued)

3. Use of the Nutrisurvey Software
3.4. Analysis of the results (continued)
The range of analysis provided on the data may provoke questions on the quality of the data and representativity of the sample.
When comparing the results obtained with Nutrisurvey and with EPI5/Epinut, the “degree of tolerance” of Nutrisurvey seems to be lower.
Even though it is part of the objective of the SMART initiative to raise the quality of the nutritional surveys, it is important to become familiar with the Nutrisurvey standard to have a clear idea of how acceptable data is.

Recommendations
Implementing the SMART methodology is easy in theory, but not necessarily in practice, as this pilot has shown.
Training of the field team is the key • For both new as well as experienced staff, as differences
between the methodologies are precise technical points that could be ignored or considered minor.
• The ACF-USA SMART pilot has shown that the guidelines cannot be just distributed to the field teams and left to their interpretation. 2-3 days of training for the Supervisors is essential.
• The translation into different languages is essential for a perfect understanding of every point. (ACF-USA is finalizing the French translation of the guidelines, it should be available by October 2005.)
• Highlighting what is new: it is indispensable to have a “SMART bulletin” summarizing the differences between the traditional and the SMART methodologies (the SMART guidelines amount to more than 100 pages).

Recommendations
The software is easy to use and the automatic calculation of all the indexes/statistic tests saves much time and effort.
A good understanding of the data produced is nevertheless essential for an optimal utilization of the tool.
• Training for the data analysts at field and/or headquarters level is essential.
• Non-technical report readers must be informed of the significance of changes that using Nutrisurvey will bring, especially regarding the lower level of tolerance that it carries.

Conclusion
The pilot test in Chad was not implemented without difficulties. However, it was fruitful in lessons learnt and highlighted the weaknesses of our traditional approaches.
We are very grateful to the SMART initiative for having made this possible.
ACF – USA will adopt the SMART nutrition specific protocol. Enhanced training protocols will be designed shortly in order to meet the critical issues identified in the pilot testing, i.e. the field team’s comfort levels with this new tool.
Thank you!