Embed Size (px)
Citation preview

SMART DIGITAL SIGNAGE WITH EYE TRACKING SYSTEM
By
CHUNG SOON ZHI
A Dissertation submitted for partial fulfilment of the requirement
for the degree of Master of Science (Electronic Systems Design
Engineering)
August 2017

II
ACKNOWLEDGEMENTS
In preparing this dissertation, I was in contact with researchers, academicians, and
practitioners. They have contributed towards my understanding and thoughts on the
research topic.
In particular, I would like to show my gratitude to my research supervisor, Dr.
Teoh Soo Siang, for encouragement, guidance and sacrificed his valuable time helped
in all the time of research and writing this thesis. Without his continued support and
passionate, this research and thesis would not have been completed so smoothly. It was
indeed an honour to work under him.
Besides that, I am truly indebted and thankful to USM Electrical and Electronics
Engineering Faculty for providing the entire resources and support throughout the
progression of this dissertation.
My sincere appreciation also extends to my housemate, all my friends, classmates,
colleagues and others who have provided assistance, valuable advisory at various
occasions. Their views and valuable opinions are useful indeed.
Last, but not least, I would like to express my gratitude to my parents and siblings
for their mentally support throughout this year.

III
TABLE OF CONTENTS
ACKNOWLEDGEMENTS .................................................................................. II
TABLE OF CONTENTS .................................................................................... III
LIST OF FIGURES ............................................................................................ VI
LIST OF TABLES .............................................................................................. IX
LIST OF ABBREVIATIONS .............................................................................. X
LIST OF SYMBOLS .......................................................................................... XI
ABSTRAK ......................................................................................................... XII
ABSTRACT ..................................................................................................... XIII
CHAPTER 1 INTRODUCTION .......................................................................... 1
Introduction ................................................................................................. 1
Project Motivation ...................................................................................... 2
Problem Statements .................................................................................... 2
Project Objectives ....................................................................................... 3
Project Scope .............................................................................................. 3
Thesis Outline ............................................................................................. 4
CHAPTER 2 LITERATURE REVIEW ............................................................... 5
Introduction ................................................................................................. 5
Current Signage System .............................................................................. 6
Face Detection Algorithm ........................................................................... 7
2.3.1 Face Detection using Local Binary Pattern Algorithm ........................ 8
2.3.2 Face Detection using Haar Cascade algorithm .................................. 10
2.3.3 Comparison between Haar Cascade and LBP Algorithm .................. 12

IV
Software Platforms for Application and Database Development ............. 13
Types of Database engine ......................................................................... 14
2.5.1 Google Firebase DBMS ..................................................................... 14
Summary ................................................................................................... 15
CHAPTER 3 METHODOLOGY ....................................................................... 16
Introduction ............................................................................................... 16
System Overview ...................................................................................... 16
Hardware Design ...................................................................................... 17
Software Design ........................................................................................ 19
3.4.1 Server Application ............................................................................. 22
3.4.2 Client Application .............................................................................. 37
System Setup ............................................................................................. 44
Summary ................................................................................................... 45
CHAPTER 4 EXPERIMENTS AND RESULTS ............................................... 46
Introduction ............................................................................................... 46
Evaluation on the Face & Eye Detection Algorithm ................................ 46
4.2.1 Distance of Detection ......................................................................... 47
4.2.2 Angle of Detection ............................................................................. 49
4.2.3 Speed Performance ............................................................................ 51
4.2.4 Accuracy of detection ........................................................................ 54
Test on the Implemented Server & Client UI Application ....................... 63
4.3.1 Accuracy of the view duration for advertisement that collected by
server application ........................................................................................ 64

V
4.3.2 Test on the Interaction between Client Application UI & Server
application ................................................................................................... 65
Summary ................................................................................................... 69
CHAPTER 5 CONCLUSION............................................................................. 70
Conclusion ................................................................................................ 70
Recommendation for future works ........................................................... 71
REFERENCES ................................................................................................... 72

VI
LIST OF FIGURES
Figure 2.1 The basic LBP operator [18] ............................................................... 8
Figure 2.2 LBP with circular neighbourhoods. From left to right, the LBP has
different sampling point and radius which is (8, 1), (16, 2) and (8, 2). ................ 9
Figure 2.3 A facial image is divided into 7 × 7, 5 × 5 and 3 × 3 rectangular
regions. [18] ........................................................................................................ 10
Figure 2.4 Set of Haar-like features .................................................................... 11
Figure 2.5 Cascaded stages of classifiers. A candidate image must pass all stages
in order to be classified as a valid detected face ................................................. 12
Figure 2.6 Block diagram of relationship of DBMS, database, and application/end
users. ................................................................................................................... 13
Figure 3.1 System overall block diagram ........................................................... 17
Figure 3.2 Flowchart of the hardware initialization process............................... 18
Figure 3.3 Flowchart of server application ......................................................... 20
Figure 3.4 Software block diagram of client application .................................... 22
Figure 3.5 Flowchart of server main class .......................................................... 23
Figure 3.6 Flowchart of MediaController class (content management) ............. 24
Figure 3.7 Flowchart of MediaController class (media controller) .................... 25
Figure 3.8 Flowchart of SocketServer class ....................................................... 27
Figure 3.9 Flowchart of FileServer class ............................................................ 28
Figure 3.10 Flowchart of FaceDetect class ......................................................... 30
Figure 3.11 An example of detection result with two false eyes detections (C and
D) located outside of the face region .................................................................. 34

VII
Figure 3.12 An example of detection result with two false eyes detections (C and
D) located not in the expected region for eyes in a face ..................................... 35
Figure 3.13 Relationship diagram of JDBC database, AdsDataRetriever class and
FaceDetect class .................................................................................................. 35
Figure 3.14 Flowchart of Main Menu UI frame ................................................. 38
Figure 3.15 Flowchart of connect TV UI frame ................................................. 40
Figure 3.16 Flowchart of Hot Topics UI frame .................................................. 41
Figure 3.17 Flowchart of Wishlist UI frame ....................................................... 42
Figure 3.18 Flowchart of Nearby Offer UI frame............................................... 43
Figure 3.19 Block diagram of system setup........................................................ 44
Figure 4.1 Experimental setup to test distance of detection ............................... 47
Figure 4.2 Chart for speed performance of detection ......................................... 53
Figure 4.3 Chart for accuracy of detection without sanity checking .................. 55
Figure 4.4 Detection result of frame 45 to 55 ..................................................... 56
Figure 4.5 Detection result of frame 21 .............................................................. 56
Figure 4.6 Detection result of frame 24 .............................................................. 57
Figure 4.7 Detection results of frame which the ceiling vent is detected as eye 57
Figure 4.8 Detection result of frame 37 .............................................................. 58
Figure 4.9 Chart for accuracy of detection with sanity checking ....................... 59
Figure 4.10 Detection result of frame 12 ............................................................ 60
Figure 4.11 Detection result of frame 31 ............................................................ 60
Figure 4.12 Detection result of frame 42 ............................................................ 61
Figure 4.13 Detection result of frame 43 ............................................................ 62
Figure 4.14 Chart for accuracy of detection with or without sanity checking .... 63
Figure 4.15 GUI frames of client application ..................................................... 65

VIII
Figure 4.16 Main Menu UI frame ....................................................................... 66

IX
LIST OF TABLES
Table 2.1 Types of database engine .................................................................... 14
Table 3.1 Values for the input parameters that used to detect different size of
object ................................................................................................................... 32
Table 3.2 List of functions in AdsDataRetriever class ....................................... 36
Table 3.3 List of variables used in Advertisement class ..................................... 36
Table 3.4 List of variables in AnalyticAds class ................................................ 37
Table 3.5 List of possible user inputs to main menu UI frame ........................... 39
Table 4.1 Detection results for different distance of detection ........................... 47
Table 4.2 Detection result for different angle of detection ................................. 50
Table 4.3 Detection results of speed performant test .......................................... 52
Table 4.4 Detection result of detection without sanity checking ........................ 55
Table 4.5 Detection results of detection with sanity checking ........................... 59
Table 4.6 Comparison of detection performance ............................................... 62
Table 4.7 Accuracy of the view duration for advertisement collected by server
application ........................................................................................................... 65
Table 4.8 Connect TV UI frame testing results .................................................. 67
Table 4.9 Hot Topic UI frame testing results ..................................................... 68
Table 4.10 Wishlist UI frame testing results ...................................................... 69

X
LIST OF ABBREVIATIONS
Ads Advertisement
DB Database
DBMS Database Management System
DC Direct Current
FN False Negative
FNR False Negative Rate
FP False Positive
FPR False Positive Rate
GUI Graphical User Interface
HD High Definition
HDMI High-Definition Multimedia Interface
ID Identity Document
IDE Integrated Development Environment
IO Input Output
JAR Java Achieve
LAN Local-Area Network
LBP Local Binary Pattern
LCD Liquid Crystal Display
LED Light-emitting Diode
OpenCV Open Source Computer Vision
SSID Service Set Identifier
TCP Transmission Control Protocol
TP True Positive
TPR True Positive Rate
TV Television
URL Uniform Resource Locator
USB Universal Serial Bus
UI User Interface

XI
LIST OF SYMBOLS
P Sampling Points
R Radius
m Number of Facial Regions
R0, R1 … Rm-1 Facial Region 0 to Facial Region m

XII
PAPAN TANDA DIGITAL PINTAR DENGAN
SISTEM PENGESANAN MATA
ABSTRAK
Papan tanda digital adalah penyelesaian pengiklanan yang lebih berkesan
berbanding dengan papan tanda tradisional kerana ia mampu untuk menunjukkan
kandungan multimedia dan maklumat pengiklanan mudah untuk dikemaskini. Dengan
kemajuan teknologi maklumat, sistem papan tanda pintar membolehkan beberapa
interaksi antara penonton dan papan tanda. Dalam projek ini, satu sistem papan tanda
digital pintar yang berkemampuan untuk berinteraksi dengan peranti mudah alih
pengguna adalah dicadangkan. Aplikasi pengguna juga mengandungi fungi untuk
mengemudi dan menyimpan maklumat iklan yang dipaparkan pada sistem papan
tanda. Selain keupayaan interaktif, sistem yang dicadangkan juga dapat mengesan
muka dan mata pengguna yang melihat papan tanda dan mengira tempoh penggunaan
melihat setiap iklan yang ditunjukkan pada paparan. Pengesanan muka dan mata dibina
dengan menggunakan pengelas “Haar Cascaded” yang terdapat di pustaka OpenCV.
Satu algoritma “sanity check” dicadangkan untuk menapis pengesanan mata yang
tersilap dan meningkatkan kadar pengesanan keseluruhannya. Keputusan ujian
menunjukkan bahawa fungsi pengesanan muka dan mata yang dibina boleh mencapai
82.5% kadar positif benar dan 17.5% kadar negatif palsu. Ujian ke atas sistem yang
lengkap menunjukkan bahawa sistem papan tanda pintar yang dicadangkan mampu
berfungsi seperti yang dicadangkan. Ia mampu merekod tempoh tontonan pengguna
untuk setiap iklan dengan ralat purata kurang daripada 12%.
XIII
SMART DIGITAL SIGNAGE WITH EYE
TRACKING SYSTEM
ABSTRACT
Digital signage is a more effective advertising solution compared to the traditional
sign board since it is able to show multimedia contents and the advertising information
can be easily updated. Current digital signage system has limited user interactive
capability. Besides that, current system also lacks a way to collect viewer’s behaviour
for analytic purposes. With the advancement of information technology, smart signage
system allows some interactions between the viewer and the signage. In this project,
a smart digital signage system which is capable of interaction between a user’s mobile
device and the signage system is proposed. The user’s application on the mobile device
provides a convenience way for navigating and storing the digital advertisements
shown on the signage system instead of having paper brochure. Besides interactive
capability, the proposed system is also able to detect faces and eyes to count the users
viewing duration for each advertisement shown on the display. The faces and eyes
detection were implemented using Haar Cascaded classifier available in the OpenCV
library. A sanity checking algorithm is proposed to filter out the wrong detected eyes
and improve the overall detection rate. Test results showed that the implemented face
and eyes detection function can achieve 82.5% of true positive rate and 17.5% of false
negative rate. Test on the complete system showed that the proposed smart signage
system is able to work as expected. It is able to collect the users’ viewing duration for
each advertisement with an average error of less than 12%.

1
CHAPTER 1 INTRODUCTION
Introduction
Commonly seen in big cities and metropolises, a digital advertisement boards, or
better known as digital signage system, is an effective advertisement solution for the
masses. Multiple versions of it are available, such as the ever popular and iconic New
York Time Square’s digital signage, or the much smaller digital directory found in
shopping malls. A traditional digital signage is only capable of showing digital images
or videos in rotation, whereas an interactive digital signage can provide feedback and
interaction to the users [1]. For example, the digital directory found in shopping malls
has touch screen input that help provide directions to the customers.
A smart digital signage system, however, is the improvement of traditional and
interactive digital advertisement boards that we frequently see in malls and events [2].
With the advent of Internet of Things, digital signage system has the need to be
upgraded to provide more functionality. By using an embedded computer as the
“brain” in the system, the digital signage system is capable of much more than just
displaying plain old image in rotations. The smart digital signage system is able to
transmit extra information to the viewer’s smart phone via an application, thus
increasing the value of the advertisements [3]. The application can also be used to
control the flow of the advertisements, by swiping left or right to cycle through the
advertisements. This gives the viewer a sense of engagement, and engaging in
activities is proven to deepen the impression which ultimately helps the advertisement
to make a more profound impact on the viewer.

2
Project Motivation
The project is motivated by the fact that all digital signage system in the current
industry remain stagnant throughout the golden age of information technology. The
technology used in them have not changed since they were first introduced over ten
years ago, saved the improvement of cathode ray to LCD/LED usage. Another
motivation of the project is to eliminate the use of brochure and promotes the ideology
of “Bring Your Own Device”. This project will improve the interactive digital signage
system into a system that can track on the audience’s viewing behaviour on
advertisement. Besides that, for analytic purpose, the advertiser can monitor on the
return of investment of their advertisement.
Problem Statements
The current digital signage system has limited user interactive capability. The user
cannot download or view more information of the advertisement. Those systems will
still rely on paper brochures to provide more information to the viewers. Without the
brochures, the users will lose the source of information for recalling the advertisement.
Moreover, current digital signage system lacks a way for retrieving and saving the
advertisement information seen on the digital signage. Besides that, most of the current
signage systems are not able to collect the audience’s viewing behaviour and statistical
data for analytic purposes.

3
Project Objectives
This project aims to tackle the problem stated in section 1.3:
1. To develop a Graphical User Interface (GUI) Application that allow wireless
interaction between user and the digital signage through a mobile device such
as smart phone. Besides, user able to store the information of advertisement
into their own mobile devices for future references.
2. To design a smart digital signage system with face detection and eye tracking
capabilities to collect the viewer’s attention information for each advertisement
3. To design a real-time database system for the storing of advertisement data and
the collection of viewer’s statistical data
Project Scope
The project is limited by the requirement that a mobile application must be
installed by the users before they are able to interact with the system. Besides that, the
eye-tracking feature is limited by both the distance and the angle between the camera
and the users. This is due to the hardware limitation of the camera. The maximum
number of connections available between the system and the mobile devices are also
limited by the router since a conventional router is only able to support 10 connections
at once usually.

4
Thesis Outline
This thesis is divided into five chapters. Chapter 1 is the Introduction chapter,
which includes the introduction, project motivation, problem statement, project
objective and project scope. Chapter 2 presents the literature review. It discusses about
several algorithms that being used for faces and eyes detection and a comparison of
the algorithm is given. Chapter 3 describes the methodology used in this research. It
includes the explanation on the proposed hardware and software design and their
implementation. Chapter 4 discusses about the experiments and test results conducted
on the proposed algorithm. Finally, Chapter 5 presents the conclusion of this research.

5
CHAPTER 2 LITERATURE REVIEW
Introduction
Due to the proven effectiveness of digital sign board for advertisement and
information, there been a significant increase in the demand for digital signage systems
nowadays [4]. For a traditional digital signage, it generally does not provide interactive
services to the audiences. A digital signage system usually consists of content
controller (server) and interactive application (client).
In this chapter, some existing features that implemented in digital signage system
will be reviewed. The focus is on the features that improve the digital signage to collect
the analytic data based on audience’s view behaviours. To track the view behaviours,
different type of faces and eyes detections algorithm will be reviewed by comparing
their accuracy and performance. Some of the common features for face detection are
Haar Cascade and Local Binary Pattern.
Besides, database management system is essential for the development of an
application with proper content management. Therefore, different type of online
database system which includes Google Firebase, Microsoft SQL and SQLite will be
reviewed.
Last but not least, the hardware selection on the host computing unit and video
device that can be used to implement this project will be reviewed based on their
specifications and system requirements.

6
Current Signage System
Digital sign (e.g. electronic advertisement board), as the replacement of traditional
static sign, have gained increasing popularity. The generality of the smartphone make
it conceivable to implement new interactive signage system for advertising purpose.
There are numbers of smart signage systems were already proposed to form a new
invention.
She et al. [5] proposed a smart signage system which allows multiple users to
simultaneously obtain the displaying content with an intuitive “dragging” hand
gesture. This system allows one-to-many interaction by allowing multiple users
acquiring content from one display with a “dragging” hand gesture.
Besides, smart signage system that allows smartphone to interact with multiple
digital in one location was proposed by She et al. [6]. The user can interact with the
intended sign by simply pointing his/her smartphone at the target signage display. The
orientation of the signage displays can be measured by the smartphone-embedded
orientation sensors. Besides, the system was extended from one-to-many interaction
to many-to-many interaction. Furthermore, an instant digital signage system which
supports quick content change and update through a smartphone in addition to the
conventional content management was proposed by Hung et al. [7].
In a nutshell, most of the previously proposed digital signage are highly focusing
on the interactive experience of the user [8]. However, these systems still lack the
capability of collecting viewer’s behaviour for analytic purpose. Therefore, this
research proposed a smart digital signage system that not only allow user interaction,
but also has the capability to collect user’s viewing statistical data. This data could be
very valuable to the advertiser for their marketing research.

7
Face Detection Algorithm
Face Detection is a computer technology being used in a variety of applications
that identifies human faces in digital images. Face detection also refers to the
psychological process by which humans locate and attend to faces in visual scene [9].
Face detection is a very active research topic in the field of computer vision and
pattern recognition [10], which is widely applied in the man-machine interface,
identity authentication, visual reality, visual communication, content-based retrieval
and many other aspects [11].
Most of the available face detection algorithm treats a detected face as binary
classification problem. Even though it looks like a simple classification problem, it is
very complex and difficult to build a robust face classifier. Using pixel values as the
features for classification is very sensitive to illumination changes and noise.
Therefore, most of today’s face algorithms extract some specific features from the
image and use a classifier to classify it into either face or non-face. The most popular
features for face detection are Local Binary Pattern (LBP) [12] and the Haar-like
feature [13].
The Local Binary Pattern (LBP) operator is one of the great performing texture
descriptors and it is widely used in various applications. It has proven to be very
efficient as it is invariance to monotonic gray-level changes as well as computational
efficient, making it suitable for demanding image analysis tasks such as real-time face
detection [14].
The Viola-Jones object detection framework is a framework based on Haar
features that can provide competitive object detection rates in real-time. This frame
work was originally proposed by Paul Viola and Michael Jones in 2001 [15]. The
algorithm has been implemented in OpenCV, and it can be trained to detect a variety

8
of objects including faces and eyes. In this project, the improved version of this
algorithm, based on the Haar Cascade features is implemented to detect face of human
and extract the eye feature from the face [16]. The following subsections explain the
LBP and Haar features in more details.
2.3.1 Face Detection using Local Binary Pattern Algorithm
The LBP operator was originally designed for texture description [17]. To extract
the LBP feature, the operator allocates a label to every pixel of an image by
thresholding the 3 × 3 neighbourhood of each pixel with the centre pixel value and
then assigning the thresholding result as binary number. The binary value are read
either clockwise or counter clockwise to form the label. Figure 2.1 shows the step for
getting the label of a pixel. By generating a histogram based on the labels, the feature
can be used as a texture descriptor.
Figure 2.1 The basic LBP operator [18]
2.3.1.1 Local Binary Pattern Extension
To deal with texture at different scales, the LBP operator was extended to use
neighbourhoods of different sizes [18]. The local neighbourhoods are defined as a set
of sampling points evenly spaced on a circle centred at the labelled pixel, allowing any
size of radius and number of sampling points. Bilinear interpolation is implemented to

9
assure the sampling points always fall in the centre of a pixel. Notation (P, R) is used
for a pixel neighbourhoods which means P sampling points on a circle of radius R.
Figure 2.2 show some examples of circular neighbourhoods.
Figure 2.2 LBP with circular neighbourhoods. From left to right, the LBP has different
sampling point and radius which is (8, 1), (16, 2) and (8, 2).
2.3.1.2 Face Detection using LBP
To detect face using LBP, texture descriptor is used to build several local
descriptor of the face and combining them into a global description. Local feature-
based method is more robust against variation in pose or illumination. On the other
hand, building a holistic description of a face using texture method is not reasonable
as the texture description tends to average over the whole image area. In the local
feature-based method, the facial image is first divided into local regions and texture
descriptors are extracted from each region independently. The descriptors are then
concatenated to form a global description of the face.

10
Figure 2.3 A facial image is divided into 7 × 7, 5 × 5 and 3 × 3 rectangular regions. [18]
The images shown in the Figure 2.3 are used to show the division of the input
image into smaller local region using different grid sizes. Texture features are then
extracted from each of the region and all the results will be combined to form the LBP
feature. The basic histogram is then extended into a spatially enhanced histogram
which encodes both the appearance and the spatial relation of facial regions. As the m
facial regions (R0, R1 … Rm-1) have been determined, a histogram is computed
independently within each of the m regions. The resulting n histograms are combine
yielding the spatially enhanced histogram. The spatially enhanced histogram has
size 𝑚 × 𝑛, where n is the length of a single LBP histogram. With the enhanced
histogram, the description of face is more effective as it includes three different levels
of locality: 1. The LBP labels for the histogram have information about the patterns on
a pixel-level, 2. The label are summed over a small region to produce information on
a regional level; 3. The regional histograms are concatenated to build a global
description of the face [19].
2.3.2 Face Detection using Haar Cascade algorithm
Viola and Jones developed an algorithm named Haar Cascaded Classifier, to
effectively detect any object, including human faces. The algorithm is based on a series
of Haar-like features and a cascade of classifier nodes. The sample of Haar-Like

11
features (edge, line and center-surrounded) used in their algorithm are shown in Figure
2.4 [20].
Figure 2.4 Set of Haar-like features
The Haar-like features compose of either 2 or 3 rectangles. Each feature has a
value which is calculated by considering the area of each rectangle, multiplied by their
respective weights, and then summing up the results. The calculation of the area of
each rectangle is speed by using the integral image technique. This technique allows
the calculation of each Haar-like feature in a constant time. Face candidates are
scanned to calculate their Haar-like features at different scales.
The Viola Jones Haar Cascaded classifier is arranged in several stages. Each stage
consists of several weak classifier based on the Haar-like feature trained on AdaBoost.
A stage comparator sums up all the Haar feature classifiers, and compares the
summation with a constant stage threshold. Each stage does not have to use a fixed
number of Haar-like features. Individual stage can have a varying number of features
which depends on the parameters of the training data. For example, the original Viola
and Jones dataset used 2 features in the first stage and 10 features in the second stage.
There are a total of 38 stages and 6060 features used. In the OpenCV library
implementation, it used 22 stages and 2135 features in total.

12
The Viola and Jones face detection algorithm eliminates unwanted face candidates
rapidly using a cascade of stages by making stricter requirement in each stage with
later stages being much more difficult for a candidate to pass. Candidates exit the
cascade if they fail any stage. A face is detected if a candidate passes all stages. This
process is shown in Figure 2.5.
Figure 2.5 Cascaded stages of classifiers. A candidate image must pass all stages in order to
be classified as a valid detected face
2.3.3 Comparison between Haar Cascade and LBP Algorithm
The performance and accuracy of both algorithms is the main factor to determine
which algorithm is better and to be implemented into this system.
Guennouni et al. [21] compared the performance of the Haar Cascade and the
LBP features. They compared the computation time and the detection accuracy
measured based on the ratio of hit, miss, and false detection rate for both features. In
the embedded platform, LBP is performing better than Haar Cascade, in term of
detection time. This shows that the LBP algorithm performs better under limited
resource, and Haar Cascade algorithm performs better on the regular platform where
there is more resource availability. In term of accuracy, Haar Cascade performance is
better than LBP in all of the platform.

13
From the above comparison, Haar Cascade algorithm is selected to be
implemented in this project. The algorithm will be used to detect faces to evaluate the
number of people looking at the advertisement displayed by the system. This selection
is made because the Haar cascade show a higher detection accuracy compared to LBP
features. The accuracy of detection is important in this application as the duration of
views of advertisement is calculated using the number of faces and eyes detected. In
this research, the pre-trained models of the Haar Cascaded classifier for frontal face
and eyes, available in the OpenCV library were used in the implementation.
Software Platforms for Application and Database Development
A database management system (DBMS) is used for end users to create, read,
update and delete in a database [22]. The DBMS essentially serves as an interface
between the database and application programs, assuring that data is consistently
organized and remains easily accessible. Figure 2.6 illustrates the relationship between
the database, DBMS, and end users or application. In this project, DBMS is used as an
interface to manage the data of advertisement.
Figure 2.6 Block diagram of relationship of DBMS, database, and application/end users.

14
Types of Database engine
A database engine is the underlying software that a DBMS used to manage data
in database. Table 2.1 shows the types of database engine that available in the market.
Table 2.1 Types of database engine
Name Google Firebase
[23] Microsoft SQL
[24]
SQLite [25]
Description Cloud-hosted real-
time document
store.
Microsoft relation
DBMS
Widely used in-
process RDBMS
Supported
Programming
Language
Limited, only
support java,
JavaScript, iOS and
Android
Intermediate, cover
most of the
language
Full, cover almost
every language
Apps
Development
Fast as complete
API is provided
Slow, need to
create own API
Slow, need to own
API
2.5.1 Google Firebase DBMS
Firebase is a mobile and web application platform which is designed to help
developers to build quality apps. Firebase is made up of several complementary
features that developers can mix-and-match to fit their needs. Firebase provides both
analytic and development services. For development, it provides the functionality of
user authentication, real time database [26], online storage and some other useful
features [27].
In this project, Firebase is selected to be implemented real time database for
storing all the digital signage information. This project will only use only Java and
Android which are fully supported by Firebase.

15
Summary
From the review, it was found that there are several types of digital signage system
available in the market. Most of these system focus on improving the interactive
experience such as one-to-many and many-to-many interaction. Besides, there are also
few system focus on improving the efficiency of the content management.
Based on those available system, it was found that available digital signage system
still lack the capability of collecting viewer’s behaviour for analytic purpose. Hence,
this project proposed a digital signage that able to evaluate the viewer’s behaviour by
collecting the number of faces and eyes of audiences that are viewing on the
advertisement. This chapter has also reviewed the common imaging techniques for
face detection. It was found that the Haar Cascade classifier algorithm has better
accuracy than the LBP algorithm and, thus, it is selected to be used in this research to
detect faces and eyes.
Last but not least, the database engines and hardware platforms that can be used
in the implementation of this project are reviewed.

16
CHAPTER 3 METHODOLOGY
Introduction
This chapter explains the methodology for hardware and software design of the
digital signage system. In this chapter, it briefly covers the hardware design of the
system since the focus part of this research is more towards the software design.
For the software design, this chapter explains in detail the software flow of each
programming classes which implement the server application with the aids of
flowchart. Besides, this project proposed an improved sanity checking algorithms that
is capable of reducing the error caused by the incompatibility of existing Haar Cascade
algorithm and this particular system.
Furthermore, this project proposed a new style of interactive experience on a
digital signage by implementing a simple GUI design and capability of interacting with
the digital signage system wirelessly using smartphone. The UI frames which
implement the client application are explained using block diagram and flowchart.
System Overview
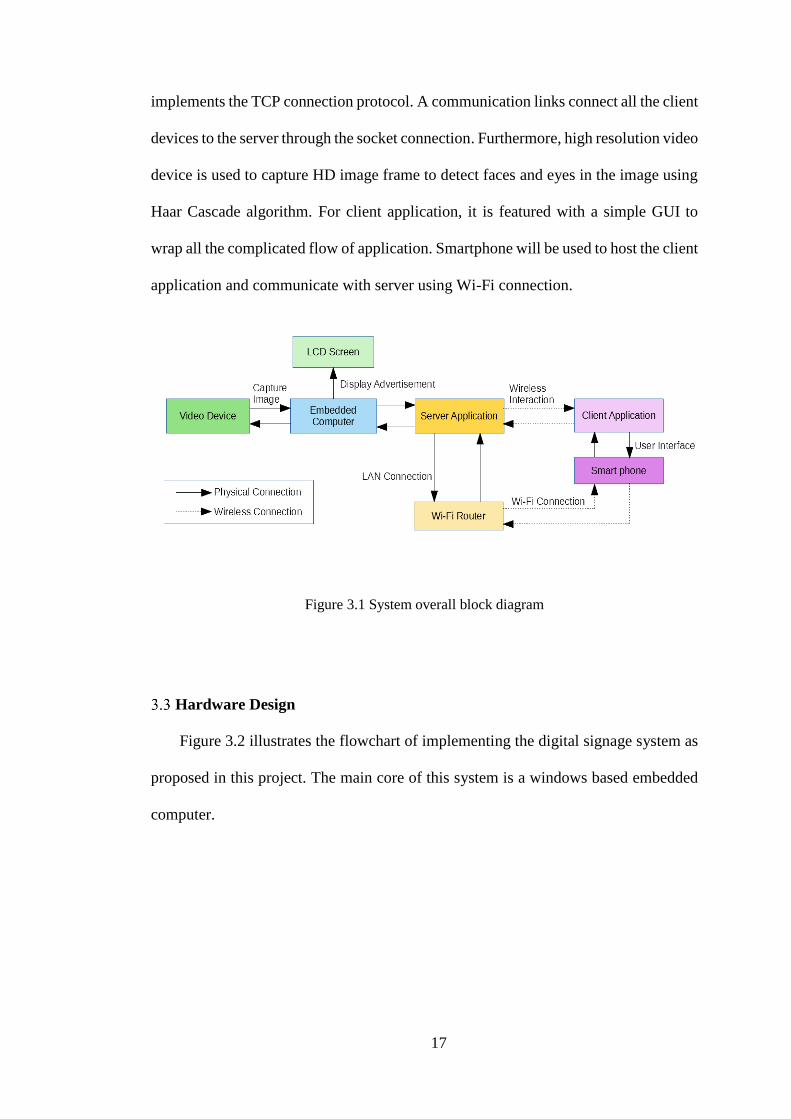
Figure 3.1 illustrates the overall system block diagram. Embedded computer, LCD
screen and video device are the hardware to host the server application, hence, it forms
a digital signage controller. Embedded computer provides enough computation
resource which required by the server application. For server application, it is featured
with face and eyes detection using Haar Cascade application which consume the high
computation power. Besides, feature of displaying advertisement image and video also
consume quite a lot of resources. This application also provides a socket server that
17
implements the TCP connection protocol. A communication links connect all the client
devices to the server through the socket connection. Furthermore, high resolution video
device is used to capture HD image frame to detect faces and eyes in the image using
Haar Cascade algorithm. For client application, it is featured with a simple GUI to
wrap all the complicated flow of application. Smartphone will be used to host the client
application and communicate with server using Wi-Fi connection.
Figure 3.1 System overall block diagram
Hardware Design
Figure 3.2 illustrates the flowchart of implementing the digital signage system as
proposed in this project. The main core of this system is a windows based embedded
computer.

18
Figure 3.2 Flowchart of the hardware initialization process
Basically, embedded computer connects all the required peripherals such as video
device and LCD screen. The digital signage controller is basically a mini embedded
computer that used to host and run the server application. The embedded computer is
featured with LAN port which uses to connect the Wi-Fi router through LAN

19
connection. The purpose of having internet connection is to connect online Firebase
database in order to retrieve the advertisement data.
Next, the video device is used to capture the high definition image for faces and
eyes detection. The resolution of the video device is required to be at least 1280 ×
720 to provide better accuracy for face and eye detection. For LCD screen, it is simply
used to display the advertisements. Besides, smartphone is used to run the client
application, allowing user to wirelessly interact with the digital signage through Wi-Fi
connection. Hence, Wi-Fi router will be the bridge for server and client application to
exchange data.
Software Design
In this project, server and client application need to be developed. For server
application, it is used in the embedded computer to be implemented as a digital
signage. The operating system used on the embedded computer is based on 64 bit
Linux Ubuntu.
The server application developed in this project was written in Java programming
language using NetBeans IDE 8.02 with latest version of Java Development kit. The
code is compiled into executable .jar file, running as an application in Linux operating
environment. Basically, server application is made up of a several components such as
media controller, face detection engine, socket server, file server, and advertisement
data retriever.

20
Figure 3.3 Flowchart of server application

21
Main class of server application will be started and download the advertisement
data from the Firebase database. Then, a media controller will be started to display the
advertisement media. When the advertisement is displayed on the screen, the face
detection engine will be started in background to detect faces and eyes for tracking
view counts and view duration of advertisement. The application will keep
continuously tracking for any incoming connection from the remote socket server. If
there is a mobile device connected to the server, it will transfer advertisement data to
the mobile device and allow them to control the digital signage. Figure 3.3 shows the
flowchart of the overview of server application. The detailed flowchart for each
designed software classes will be shown and explained in the following sections.
For client application, it is used in the smartphone to be implemented as a
controller to interact with the digital signage. The client application is designed in
Android programming language using Android studio IDE. In Android programming
life cycle, UI frame is labelled as activity, and also called as a page. The code is
compiled into installer .apk file, and installed into the smartphone. The client
application is made up of five simple GUI with different functionality. Connect TV UI
is designed to interact with the server application. Hot Topic UI is designed to retrieve
recently viewed advertisement and Wishlist UI is designed to retrieve wishlisted
advertisement from local database. Figure 3.4 show the overall block diagram of client
application.

22
Figure 3.4 Software block diagram of client application
3.4.1 Server Application
Server application is designed and implemented as a digital signage controller. It
allows user to view on the advertisement and interact with the screen by using client
application. The server communicates with the client application through socket and
file server. Besides, Haar cascade algorithm is implemented to detect the face and eyes,
hence, each views and duration of displayed advertisement are tracked and stored into
the database.
3.4.1.1 Main class
This class is created as a server main controller to initiate all the related software
classes which are designed to support different kind of software flow in the correct
priority and setup all the required parameters. Figure 3.5 shows the flowchart of the
main class.

23
Figure 3.5 Flowchart of server main class
This thread first initialized the shared references for all the supporting classes. The
shared references is created to assure every supporting classes are started with only
one instance. Then, it establishes the database connection which be used to retrieve
advertisement info list. Upon database connection establishment successful, the media
controller is started to download media using the advertisement list. Lastly, the face
detection controller and file server is started as well. All these classes will be described
in more detail in the following sub-sections.
3.4.1.2 MediaController class
This class is designed to display the advertisement media through the screen and
control the activity of the advertisement media. Basically, this class has two main

24
functions which it acts as a database manager and digital signage controller. Figure 3.6
shows the flowchart of MediaController class
Figure 3.6 Flowchart of MediaController class (content management)
This thread is started to first check for internet connection before it starts to
establish connection with online advertisement media’s firebase DB. Upon internet
connection established successful, it fetches the list of media information which
includes advertisement id, description, file size, media URL and more, then it
downloads the media files using URL path and save into defined local directory. When
the download is successful, it runs some validations on the created media map which
use for media displaying usage, in order to prevent blank or corrupted image is loaded.
After the validation is successful, it starts other few related threads which used to