Embed Size (px)
Citation preview

NASA Reference Publication 1309
Small-Crack Effects in High-Strength AluminumAlloys
A NASA/CAE Cooperative Program
J. C. Newman, Jr., X. R. Wu, S. L. Venneri, and C. G. Li
(NASA-RP-1309) SMALL-CRACK EFFECTS
IN HIGH-STRENGTH ALUMINUM ALLOYS
(NASA. Lang|ey Research Center)
11b p
H1/39
N94-34299
Unclas
0010373
May 1994
https://ntrs.nasa.gov/search.jsp?R=19940029793 2018-02-13T17:18:05+00:00Z


NASA Reference Publication 1309
Small-Crack Effects in High-Strength AluminumAlloys
A NASA/CAE Cooperative Program
J. C. Newman, Jr.
Langley Research Center • Hampton, Virginia
X.R. Wu
Institute of Aeronautical Materials • Beijing, People's Republic of China
S. L. Venneri
National Aeronautics and Space Administration • Washington, D.C.
C.G. Li
Institute of Aeronautical Materials • Beijing, People's Republic of China
National Aeronautics and Space Administration kLangley Research Center • Hampton, Virginia 23681-0001
May 1994

w _ r
The use of trademarks or names of manufacturers in this
report is for accurate reporting and does not constitute an
official endorsement, either expressed or implied, of such
products or manufacturers by the National Aeronautics and
Space Administration.

Contents
Preface .................................. vii
Nomenclature ................................. ix
Summary .................................. 1
1. Introduction ................................ 2
2. Cooperative Program Overview ........................ 3
3, Test Program ............................... 5
3.1. Materials ................................ 5
3.2. Specimens ............................... 6
3.3. Loading Conditions ........................... 9
3.3.1. Constant-Amplitude Loading ................... 10
3.3.2. Mini-TWIST Spectrum Loading ..................
3.4. Fatigue Test Conditions and Procedures _=_:_: . ..............
3.5. Small-Crack Test Conditions and Procedures ...............3.5.1. Small-Crack Measurement Meth0d _ -I. i ...............
3.5.2. Constant-Amplitude and Spectrum Loading .............3.5.2.1. Constant-amplitude loading ..................
3.5.2.2. Spectrum loading ......................
3.5.3. Crack Shape Determination ....................
3.6. Small-Crack Data Analysis Procedures ..................
3.6.1. Calculation of Stress Intensity Factors ...............3.6.2. Calculation of Crack-Growth Rates ................
3.7. Large-Crack Test Conditions and Procedures ...............
3.7.1. Constant-Amplitude Loading ...................
3.7.2. Mini-TWIST Spectrum Loading Program ..............3.7.3. Large-Crack Data Reduction ...................
4. Analysis Program .............................
4.1. Finite-Element Analyses .......................
4.2. Weight-Function Analyses .......................
4.3. Boundary Force Method ........................
4.4. Comparison of Methods ...... _: . ................
I0
11
11
12
13
13
13
13
13
13
15
15
15
15
15
15
16
17
17
18
4.5. Stress Intensity Factor Equations .................... 194.5.1. Surface and Corner Cracks at Notch ................ 20
4.5.1,1. Surface crack at a semicircular notch .............. 20
4.5.1.2. Corner crack at a semicircular notch .............. 21
4.5.2, Through Crack at Notch ..................... 21
4.5.3. Effect of Cladding ........................ 21
5. Large-Crack Experimental Data ...................... 24
5.1. Stress Ratio Effects on Large-Crack-Growth Rates ............. 24
5.1.1. 7075-T6 Aluminum Alloy ..................... 24
5.I.2. LCgcs Aluminum Alloy ...................... 255.1.3. Comparison of Alloys ...................... 26
5.2. Large-Crack-Growth Rates for Mini:TWIST Spectrum ........... 265.2.1. 7075-T6 Aluminum Alloy ..................... 26
5.2.2. LC9cs Aluminum Alloy ...................... 27
5.2.3. Comparison of Alloys ...................... 27
nl

6. Fatigue and Small-Crack Experimental Data ................. 27
6.1. Fatigue Tests ............................. 28
6.1.1. Constant-Amplitude Loading ................... 28
6.1.2. Mini-TWIST Spectrum Loading .................. 28
6.1.3. Effect of Cladding ........................ 296.1.4. Effect of Replica Method ..................... 29
6.2. Initiation Sites and Distributions for Small Cracks ............. 31
6.2.1. 7075-T6 Aluminum Alloy ..................... 31
6.2.2. LC9cs Ahnninum Alloy ...................... 34
6.2.3. Comparison of Alloys ...................... 34
6.3. Small-Crack Shapes for Two Alloys ................... 37
6.4. Crack Length Against Cycles for Small Cracks .............. 38
6.4.1. 7075-T6 Aluminum Alloy ..................... 386.4.2. LC9cs Aluminum Alloy ...................... 39
6.5. Small-Crack-Growth Noninteraction Criteria ............... 39
6.6. Small- and Large-Crack-Growth Rates 40
6.6.1. Constant-Amp_[itude Loading ................... 40
6.6.1.1. 7075-T6 aluminum alloy ................... 406,6.t.2. LC9cs aluminum alloy .................... 41
6.6.2. Mini-TWIST Spectrum Loading .................. 44
6.6.2.1. 7075-T6 aluminum alloy ................... 44
6.6.2.2. LC9cs aluminum alloy .................... 44
7. Crack-Closure Model for Small and Large Cracks ............... 44
7.1. AnaIytical Crack-Closure Model. : ................... 45
7.2. Crack-Opening Stresses From Model ................... 46
7.2.1. Constant-Amplitude Loading ................... 47
7.2.2. Mini-TWIST Spectrum Loading .................. 487.2.2.1. Small crack ......................... 48
7.2.2.2. Large crack ......................... 48
7.3. Crack-Opening Stress Equations .................... 49
7.3.i. Constant-Amplitude Loading ................... 497.3.2. Extreme Crack-Growth Rates ................... 50
7.3.3. Surface- and Corner-Crack Growth ................ 50
8. Fatigue Crack-Growth Rate and Life Prediction ............... 50
8.1. Correlation of Large-Crack-Growth Rates ................ 51
8.1.1. 7075-T6 Aluminum Alloy ..................... 51
8.1.2. LC9cs Aluminum Alloy ...................... 52
8.2. Effective Stress Intensity Factor Relations for Small Cracks ......... 528.2.1. 7075-T6 Aluminum Alloy ..................... 52
8.2.2, LC9cs Aluminum Alloy ...................... 53
8.3. Prediction of Large-Crack Growth .................... 54
8.3.1. 7075-T6 Aluminum Alloy ..................... 54
8.3.2. LC9cs Aluminum Alloy ...................... 54
8.4. Initiation Sites and Crack Shapes for Small Cracks ............ 55
8.4.1. 7075-T6 Aluminum Alloy ..................... 55
8.4.2. LC9cs Aluminum Alloy ...................... 56
iv

8.5. Prediction of Small-Crack Growth .................... 57
8.5.1. 7075-T6 Aluminum Alloy ...................... 57
8.5.2. LC9cs Aluminum Alloy ...................... 59
8.6. Prediction of Fatigue Life ........................ 60
8.6.1. 7075-T6 Aluminum Alloy ..................... 61
8.6.2. LC9cs Aluminum Alloy ...................... 61
9. Conclusions ....................... + ........ 62
9.1. Analyses ............................... 62
9.2. Experiments ............................. 62I
9.3. Analytical Crack-Closure Model ..................... 63
Appendix A--Finite-Element Analyses of Surface and Corner Cracks at aSemicircular Notch ............................ 64
Appendix B--Three-Dimensional Weight-Function Analyses of Surface and CornerCracks at a Semicircular Notch ....... - ................ 73
Appendix C--Two-Dimensional Weight-F_mction and Boundary-Force Analyses . 85
Appendix D--Stress Intensity Factor Equations for a Surface, Corner, and ThroughCrack at a Semicircular Notch ......... . .............. 90
Appendix E--Specimen Machining and Polishing Procedures ........... 93
Appendix F--Specimen Gripping and Alignment Procedures ........... 95
Appendix G--Method of Recording Small- and Large-Crack Data ......... 97
Appendix H--Plastic-Replica Method ..................... 103
References ................................. 104
V

P reface
In May 1985, the National Aeronautics and Space Administration (NASA) and the Chinese
Aeronautical Establishment (CAE) held a symposium on structural analysis methods in Beijing,
China. During technical discussions and subsequent visits of NASA scientists to several CAE researchinstitutes, areas of mutual interest for technical cooperation were identified. A joint working group
meeting was held in late 1985 in Washington, D.C. Annex III to the Protocol on Cooperation in
Aeronautical Science and Technology between NASA of the United States of America and the CAE
of the People's Republic of China was signed in February 1987. During 1986 and early 1987, a joint
technology plan on fatigue and fracture mechanics was established.
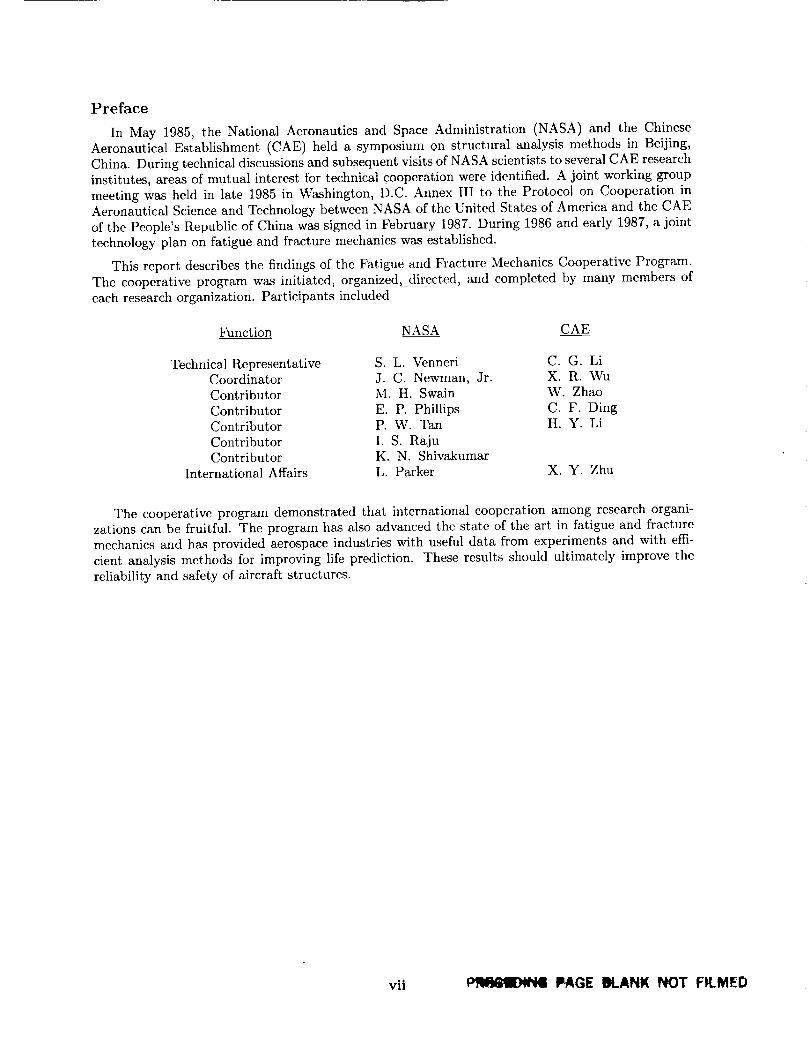
This report describes the findings of the Fatigue and Fracture Mechanics Cooperative Program.
The cooperative program was initiated, organized, directed and completed by many members ofeach research organization. Participants included
Function NASA CAE
Technical Representative S.L. Venneri C.G. Li
Coordinator J.C. Newman, Jr. X.R. WuContributor M.H. Swain W. Zhao
Contributor E.P. Phillips C.F. DingContributor P.W. Tan H.Y. Li
Contributor I.S. RajuContributor K.N. Shivakumar
International Affairs L. Parker X.Y. Zhu
The cooperative program demonstrated that international cooperation among research organi-zations can be fruitful. The program has also advanced the state of the art in fatigue and fracture
mechanics and has provided aerospace industries with useful data from experiments and with effi-
cient analysis methods for improving life prediction. These results should ultimately improve the
reliability and safety of aircraft structures.
vii _ laAGE IN.ANK NOT FILMED


Nomenclature
a
ai
ax
B
b
c
ci
cn
cu
c'
da/dN
dc/dN
ds
dT
E
Es
Fj
Gc
gi
h
K
Kce
Ke
K,
KT
ki
L
N
NI
P(x, y)
Q
R
P_
one-half surface- or total corner-crack depth, m
initial one-half material defect (or crack) depth, m
crack depth in slice model, m
specimen thickness, m
material defect (or void) height, m
surface-, corner-, or through-crack length, m
initial material defect (or crack) length, m
initial crack starter notch length, m
crack length in slice model, m
crack length plus hole radius, m
crack-growth rate in a-direction, m per cycle
crack-growth rate in c-direction, m per cycle
inclusion particle size in short direction, m
inclusion particle size in transverse direction, m
Young's modulus, MPa
elastic modulus for spring slices, MPa
boundary correction stress intensity factor for corner crack with clad correction
boundary correction stress intensity factor (j = c, s, or t)
clad correction on stress intensity factor
fitting functions for boundary-correction factor
one-half specimen height, m
stress intensity factor, MPa-m 1/2
stress intensity factor for partially loaded edge crack, MPa-m 1/2
stress intensity factor for edge crack, MPa-m 1/2
crack opening stress intensity factor, MPa-m 1/2
stress concentration factor
spring stiffness in slice model (i = a or c), N/m
total depth of surface (2a) or corner crack (a) along notch, m
clad-layer thickness, m
cycles
cycles to failure
weight-function spring forces, N
shape factor for surface or corner crack
Smin
stress ratio (S_-_)
restraining areas in slice model (i = a or c), m2
Ix
PI_ PAGE BLAJ,IK NOT FILMI£D

r
S
Smln
s'o
S, T, L
T1 ,T2,T3
t
ti
U, V
Wi
w
Wn
x, y: z
OL
AK
AKe_
(AKeff)th
AKth
AN
AS
P
(T
(TO
(Tu
Grys
(Tyy
_d
Subscripts:
c
S
t
semicircular notch radius, m
applied gross stress, MPa
maximum applied gross stress, MPa
mean flight stress in Mini-TWIST spectrum, MPa
minimum applied gross stress, MPa
crack-opening stress, MPa
short, transverse, and longitudinal directions, figure 5
transition points in AK-rate relation
one-half or full specimen thickness, m
distance from sheet centerline to crack initiation site, m
displacement in x- and y-directions, respectively, m
weight function in slice model (i = a or c), m-1/2
one-half specimen width or full specimen width, m
width of crack-tip element, m
Cartesian coordinates
constraint factor
crack-closure factor ratio
stress intensity !actor range, MPa-m 1/2
effective stress intensity factor range, MPa-m 1/2
effective threshold stress intensity factor range, MPa-mU2
large-crack threshold stress intensity factor range, MPa-m 1/2
interval between plastic replicas, cycles
applied stress range (Smax - Stain), MPa
length of tensile plastic zone, m
uniform stress, MPa
flow stress (average between (Tys and au), MPa
ultimate tensile strength, MPa
yield stress (0.2-percent offset), MPa
normal stress in y-direction, MPa
parametric angle of ellipse, rad
length of cyclic plastic zone, m
corner crack at notch
surface crack at notch
through crack at notch
x
Abbreviations:
ASTM
BFM
BIAM
CAE
CCT
DOF
EDI
EDM
FEM
LaRC
LEFM
NASA
PRC
SEM
SENT
S-N
2D
3D
US
VCCT
WFM
American Society for Testing and Materials
boundary force method
Beijing Institute of Aeronautical Materials
Chinesc Aeronautical Establishment
center-crack tension
degree of freedom
equivalent domain integral
elcctrical discharge machining
finite-element method
Langley Research Center
linear-elastic fracture mechanics
National Aeronautics and Space Administration
People's Republic of China
scanning electron microscope
single-edge-notch tension
material stress-cyclic life relation
two dimensional
three dimensional
United States
virtual crack closure technique
weight-function method
xi


Summary
From1987to 1992theNationalAeronauticsandSpaceAdministrationandthe Chinese Aeronautical
Establishment participated in a Fatigue and FractureMechanics Cooperative Program, the first coopera-
tive exchange between the scientific organizations ofthe two countries. The program objectives were to
study crack initiation and the growth of small cracks
in two high-strength aluminum alloys, to comparetest and analysis results from each laboratory, and
to evaluate an existing analytical model to predict
the growth of such cracks. Experimental and ana-
lytical studies were conducted on various aspects of
fatigue crack growth of small and large cracks.
In the experimental program, three types of testswere conducted: fatigue tests on single-edge-notch
tension (SENT) specimens, small-crack tests on the
SENT specimens, and large-crack tests on center-crack tension (CCT) specimens. The initiation and
growth of small fatigue cracks (10 ttm to 2 mm long)
from the edge of a semicircular notch in 7075-T6and LC9cs aluminum alloy sheets were monitored for
various load histories by means of a plastic replica
method. In both alloys, small cracks were initiated as
naturally occurring from material defects or cladding.
cracks initiated along the bore of the notch. Atthe lower stress levels, particularly those near the
fatigue limit, the tests produced only a few cracks
along the bore. The small-crack data showed a largeramount of scatter than observed in large-crack data
due to crack-grain boundary interactions and crack
interactions with neighboring cracks. Noninteractioncriteria were used to eliminate data where cracks
interacted. This approach greatly reduced the scatter
in the stress intensity factor against crack-growthrate data. Results from the study showed that
fatigue life, even near the fatigue limit, was mostly
crack propagation from a material defect or from the
cladding layer.
In the analysis program, three-dimensional finite-
element and weight-function methods were uscd todetermine stress intensity factors for a surface crackand a corner crack at the notch in the SENT speci-
men. In general, the two analysis methods gave verysimilar results for a wide range of crack shapes and
sizes. Stress intensity factor equations were devel-
oped for a wide range of crack configuration param-eters. These equations were used in the small-crackdata correlations and in life predictions. An indi-
rect boundary element method and an experimentaltechnique were used to obtain stress intensity fac-
In the 7075-T6 bare alloy, cracks initiated from tors and equations for a through crack in the SENT
inclusion particles or voids on the notch surface and sPecimens tested in remote, fixed-grip (displacement)
generally grew as surface cracks. Cracks in the conditions.LC9cs clad alloy, however, initiated at slip bands
in the cladding layer and grew as corner cracks.Tests were conducted for both constant-amplitude
(stress ratios of R = -1, 0, and 0.5) and spectrum
(Mini-TWIST) loading conditions at two or threestress levels each. The replica method was found to
affect fatigue life and apparently small-crack-growthrates of the 7075-T6 alloy, but the method did not
A crack-growth model that incorporated crack-closure effects was used to analyze the growth of
small cracks along the bore of the notch. Small crackswere assumed to initiate eithcr at inclusion-particle
defects (surface crack) or in the cladding layer (corner
crack). In the 7075-T6 alloy, the initial defect sizewas consistent with observations of initiation sites
at inclusion-particle clusters or voids. In the LC9csappear to affect fatigue lives for the LC9cs clad clad alloy, an initial defect slightly larger than the
alloy. Data on large-crack growth (cracks greater clad-layer thickness was used. For both materials,than 2 mm long) were obtained for a wide range in
rates (10 -8 to 10 -1 mm per cycle) for all constant-
amplitude loading conditions. Data on large-crack
growth for the Mini-TWIST loading sequence werealso obtained on the same materials.
The experimental results from the participants in
the cooperative program showed good agreement onsmall- and large-crack-growth rates and on fatiguelives. The small cracks exhibited the classical "small-
crack" effect because they grew faster than largecracks for the same stress intensity factor range.
They also grew at stress intensity factor ranges thatwere lower than the thresholds obtained from large-
crack tests for constant-amplitude loading. During
small-crack tests at the higher stress levels, multiple
the effective stress intensity factor against crack-
growth rate relations was different in the crack-depth
(through the sheet thickness) and crack-length (sheet
width) directions. At high crack-growth rates and,especially for the Mini-TWIST loading sequence, avariable-constraint method was used to correlate and
predict crack growth. Reasonable agreement wasfound between measured and predicted small- and
large-crack-growth rates, surface- and corner-crack
shapes, and fatigue lives for most loading conditions.For loading at a high stress ratio (R = 0.5), the model
predicted slightly faster rates than those measured
experimentally. This particular loading conditioninvolved a local notch root that yielded while in
tension, a condition approximated in the model. The

closuremodeldid confirmtheexperimentalfindingsthat the small-crackeffectwasmorepronouncedin thosetestsinvolvingcompressiveloads,suchasconstant-amplitudeloadingat anegativestressratio(R = -1).
The cooperative program demonstrated that in-
ternational cooperation among research organiza-tions can be fruitful. The program also has advanced
the state of the art in fatigue and fracture mechan-
ics and has provided aerospace industries with use-
ful data from experiments and with efficient analysismethods for improving life prediction. These results
should ultimately improve the reliability and safetyof aircraft structures.
1. Introduction
Linear-elastic fracture mechanics methods are
widely accepted for damage tolerance analyses. Thetrend has also been toward the use of the same
methodology for fatigue durability analyses. To
obtain acceptably large lives without a significantweight penalty, durability analyses must assume
very small initial cracks. Numerous investigators
(refs. 1-20) have observed that the growth charac-
teristics of small fatigue cracks in plates and atnotches differ from those of large cracks in the samematerial. These studies have concentrated on the
growth of small cracks 10 #m to 1 mm long. On the
basis of linear-elastic fracture mechanics (LEFM),small cracks grew much faster than predicted from
large-crack data. This behavior is illustrated in fig-
ure 1, where the crack-growth rate is plotted againstthe linear-elastic stress intensity factor range AK.
The solid (sigmoidal) curve shows typical results
for a given material and environment for constant-
amplitude loading. The solid curve is usually ob-
tained from tests with large cracks. At low growthrates, the threshold stress intensity factor range
AKth is usually obtained from load-reduction (AK-
decreasing) tests. Typical experimental results forsmall cracks in plates and at notches are shown by thedashed curves. These results show that small cracks
grow at AK levels below the large-crack threshold
and that they also can grow faster than large cracksat the same AK level above threshold. Small-crack
effects have been shown to be more prevalent in tests
with compressive loads and negative stress ratios.
(See refs. 19 and 20.)
During the last decade, research on the small- orshort-crack effect has concentrated on three possible
explanations for the behavior of such cracks: plas-
ticity effects, metallurgical effects, and crack closure.All of these features contribute to a breakdown of
da dc
dN dN
R = constant
$1< $2< S 3 /
/.Small crack / \
from hole , $3 ,/' Large crack
"J from hole
Small cracks J "-_ Large crack
/d s 2_/" "',, :f Large crack
_,,S 1 -_.:._,,// (AK-decreasing test)
-_(-_- Steady state
I £KthJ.
AK
Figure 1. Typical fatigue crack-growth rate data for small andlarge cracks under constant-amplitude loading.
LEFM and to the use of the AK concept to corre-late fatigue crack-growth rates.
Some of the earliest small-crack experiments
(refs. 1 4) werc conducted at high stress levels that
were expected to invalidate LEFM procedures. Non-
linear or elastic-plastic fracture mechanics concepts,such as the J integral and an empirical length pa-
rameter (refs. 3 and 4), were developed to explainthe observed small-crack effects. Recent research
on the cyclic Dugdale model and the use of AJ
(cyclic J integral) as a crack-driving parameter sug-
gest that plasticity effects are small for many of the
early and more recent small-crack experiments. (Seeref. 21.) However, the effect of plasticity on small-
crack growth and on the appropriate crack-driving
parameter is still being debated.
Small cracks generally initiate in metallic ma-
terials at inclusion particles or voids, in regions ofintense slip, or at weak interfaces and grains. In
these cases, metallurgical similitude (refs. 10, 16,
and 17) breaks down- that is, the growth rate is nolonger an average over many grains. Thus, the local
growth behavior is controlled by metallurgical fea-
tures. (See refs. 6 and 12.) If the material is markedly
anisotropic (differences in modulus and yield stress indifferent crystallographic directions), the local grain
orientation will strongly affect the rate of growth.
Crack-front irregularities and small particles or inclu-sions do affect the local stresses and, therefore, crack
growth. For large cracks (with large fronts), all these
metallurgical effects are averaged over many grains,
except in very coarse-grained materials. Researchers
2

in linearelasticandnonlinearfracturemechanicsareonlybeginningto explorehowmetallurgicalfeaturesaffectstressintensityfactors,strain-energydensities,J integrals, and other crack-driving parameters.
Very early in small-crack research, fatigue crack
closure (ref. 22) was recognized as a possible expla-nation for rapid small-crack growth. (See refs. 5-11
and 23.) Fatigue crack closure is caused by residualplastic deformations left in the wake of an advancing
crack. Only that portion of the load cycle for which
the crack is fully open is used to compute an effec-
tive stress intensity factor range AKeff from LEFMsolutions. A small crack that initiates at an inclu-
sion particle, a void, or a weak grain does not have
the prior plastic history to develop closure. Thus, a
small crack may not be closed for as much of the load-
ing cycle as a larger crack. If a small crack is fullyopen, the stress intensity factor range is fully effec-
tive and the growth rate will be greater than that k
for steady-state crack growth. (A steady-state crackis one in which the residual plastic deformations and
crack closure along the crack surfaces are fully de-
veloped.) In contrast, the development of the large-crack threshold, as illustrated in figure 1, has beenassociated with a rise in crack closure as the load
is reduced. (See ref. 24.) Thus, steady-state crack-
growth behavior may be between the small-crack andnear-threshold large-crack behavior, as illustrated by- .......
the dotted curve. The results from this study suggest
this possibility.
As the crack size approaches zero, a crack sizemust exist below which the assumptions of contin-
uum mechanics and the AK concept are violated
because of microstructural features. However, thetransition from valid to invalid conditions does not
occur abruptly. For many engineering applications,
a AK-based analysis that extends into the "gray
area" of validity may still prove useful. Certainly forstructural designers, a single analysis methodology
that applies to all crack sizes is desirable, as demon-strated in a total-life analysis in reference 25. If for
no other reason than that AK analyses are already
being used for large-crack problems, the applicationof a AK analysis to small-crack problems should be
thoroughly explored. The approach in this report is
to apply both continuum mechanics and AKeff con-
cepts to small- and large-crack growth.
2. Cooperative Program Overview
In May 1985, the United States (US) National
Aeronautics and Space Administration (NASA) and
the People's Republic of China (PRC) Chinese Aero-nautical Establishment (CAE) held a symposium on
structural analysis methods in Beijing, China. Dur-
ing technical discussions between NASA and CAEscientists, several research areas of mutual interest
were identified for technical cooperation. Small-crack
growth and the breakdown of linear-elastic fracturemechanics concepts particularly were identified as
important problems to the aircraft industries of both
nations. The CAE had recently developed a simple
weight-function method (WFM) for analyzing cracks
in two-dimensional (2D) crack configurations. Also,a new three-dimensional (3D) WFM had emerged for
analyzing surface and corner cracks at stress concen-
trations. These new approaches offered an excellentbasis for comparison with existing methods and so-
lutions that NASA had developed using the finite-
element method (FEM). In addition, NASA hacl re-
cently improved a life-prediction method based onthe crack-closure concept. These new developments
offered an opportunity to develop a research plan be-
tween the two organizations.
A joint technology plan on fatigue and fracturemechanics was established during late 1986 and early
1987. Scientists in the cooperative program were to
study small-crack growth, to develop a link between
classical stress-cyclic life (S-N) fatigue behavior andmodern damage-tolerance methodologies, to bridge
durability and damage tolerance analyses, to improve
life-prediction capabilities by developing more accu-rate stress intensity factor solutions for small cracks,
and to evaluate an existing analytical model to pre-
dict the growth of such cracks. Exchange of materi-als and analysis methods began in early 1987. Three
joint meetings were held between NASA and CAE
for data exchanges and in-depth discussions. Meet-
ings were held at the Beijing Institute of Aeronauti-cal Materials (BIAM) in Beijing, China, in 1987 and
1992 and at the Langley Research Center (LaRC) in
Hampton, Virginia, in 1989.
The cooperative program brought together fa-
tigue and fracture mechanics researchers to studythe small-crack effects in high-strength aluminum al-
loys of interest to each country. The program ob-jectives were to identify and characterize through
experiments and analyses the initiation and growth
of small cracks (10 #m to 2 mm long) in common
US and PRC aluminum alloys, to improve fracture
mechanics analyses of surface- and corner-crack con-figurations, and to develop improved life-prediction
methods to correlate and predict the growth of small
and large cracks for constant-amplitude and aircraftspectrum loading.
To achieve the objectives of the cooperative pro-gram, experiments and analyses were conducted
in each laboratory on two high-strength aluminum
3

alloys,7075-T6 bare and LC9cs clad sheet. Three
types of tests were conducted: fatigue tests on single-edge-notch tension (SENT) specimens, small-crack
tests on the SENT specimens, and large-crack tests
on CCT specimens. The initiation and growth of
small fatigue cracks (10 #m to 2 mm long) at thesemicircular notch were monitored based on the
plastic-replica method. Tests were conducted at sev-
eral constant-amplitude (R = -1, 0, and 0.5) and
spectrum (Mini-TWIST) loading conditions at two
or three stress levels each. Large-crack-growth rates(cracks greater than 2 mm long) were obtained for
a wide range in rates (!0 -s to 10 -1 mm per cycle)
for all constant-amplitude loading conditions. Rates
of large-crack growth from the Mini-TWIST loading
sequence were also obtained for the same alloys.
The small-crack specimen was selected to producenaturally occurring cracks at material defects or dis-
continuities and to propagate cracks through a stressfield similar to that in aircraft structures. A SENT
specimen was used. (See fig. 2.) The notch was semi-circular, had a radius r of 3.2 mm, and a width w of
50 mm. The stress concentration factor was 3.15,based on gross section stress. (See ref. 26.) Figure 3shows the normal stress distribution near the notch
root for the SENT specimen (solid curve). For com-parison, the normal stress distribution for a circular
hole in an infinite plate is shown as the dashed curve.
The normal stress distribution for the SENT speci-
men is similar to that for an open hole in an infinite
plate, but the stresses are slightly higher because of
the finite width. Thus, the SENT specimen simu-lates a hole in an aircraft structure. Use of a side
notch rather than a hole allows the notch root to be
observed with a microscope and plastic replicas tobe taken with ease during tests. A typical test stand
with the SENT specimen and the guide plates that
were used for compressive loading tests is shown infigure 4.
The three-dimensional FEM and the WFM were
Used to determine stress intensity factors for surface
and corner cracks at the notch in the SENT speci-men. The results from these two methods were then
compared for a range of crack-configuration parame-ters. A brief description of the FEM and the WFM is
presented in appendixes A and B, respectively. Two-dimensional weight-function analyses were used to
develop weight functions for use in the 3D WFM.
These analyses are discussed in appendix C. An in-
direct boundary element method, referred to as the
boundary force method (BFM), was also used to ob-tain stress intensity factors for a through crack in
the SENT specimen for either uniform remote stress
or displacement boundary conditions. Numerical re-
3OO
r_ 150
w = 50
H e-
,4
Grip line
y,v
Figure 2. Single-edge-notch tension (SENT) fatigue specimen.All dimensions are in millimeters.
4
S
Yt s
,_, 4, _ _
Yt
---I r I--
S
,,i
0.5
3
I I l
0.0 1.0 1.5 2.0
x/r
Figure 3. Normal stress distributions for SENT specimen andopen circular hole in infinite plate for remote stress.
sults from the BFM and stress intensity factors deter-
mined from an experimental technique are also givenin appendix C. Stress intensity factor equations based
on the results from these analyses were developed for
a range of crack-configuration parameters; they arepresented in appendix D. These equations were usedin the small-crack data correlations and in the life
predictions.
A crack-growth model that incorporates crack-
closure effects was used to analyze the growth ofsmall cracks along the bore of the notch and of
large cracks away from the notch. Small cracks were
4

Load
jaw
G d v _,.- / _,'.4jL _ule fol Ioiplale ".,_ oi io I
Specimen -_ i_ N°tch
Rubber Iol Io[
spacer __j_ 2
LoadL-88-3166
Figure 4. Typical test stand with SEN_F specimen and guide plates for compressive load tests. All dimensions are in millimeters.
assumed to initiate at either inclusion-particle de-
fects (surface cracks) or in the cladding layer (cor-
ner cracks). Comparisons were made between ex-
perimental and predicted surface- and corner-crackshape changes, small-crack-growth rates, large-crack
growth, and total fatigue life for constant-amplitude
and spectrum loading.
3. Test Program
Three types of fatignm tests were conducted
for both constant-amplitude and spectrum loading.Standard fatigue tests on SENT specimens were con-ducted to determine the S-N curves for the two al-
loys, especially near the endurance limit. Fatiguetests were also conducted on LC9cs alloy without
the cladding layer. The primary experiments in the
cooperative program were on small cracks and wereconducted on the SENT speclmens at stress levels se-
lected from the S-N fatigue test results. Large-crack
tests on CCT specimens were also conducted to oh-
rain fatigue crack-growth rate data for a wide range
of rates; in these tests the same loading histories wereused as in the small-crack tests. All tests were con-
ducted at room temperature and in laboratory air.
Table I. Nominal Chemical Composition (wt%) of Materials
Element
AluminumChromium
CopperIron
Manganese
MagnesiumSilicon
Titanium
Zinc
Aluminum alloy
7075-T6
Balance0.2
1.6
.2
.2
2.6.1
.1
5.7
LC9cs
Batance0.2
1.6
.5
.15
2.5.5
5.6
3.1. M_terials
Two high-strength aluminum alloy sheets com-monly used for aircraft structures were selected for
the test program: 7075-T6 aluminum alloy (2.3 mm
thick) and LC9cs clad aluminum alloy (2 mm thick).
The 7075-T6 alloy was selected because the growth ofsmall cracks was expected to be significantly affected
by grain boundary interactions and to severely test
continuum mechanics concepts. (See ref. 12.) TheThis section describes the materials, fatigue and LC9CS sheet, similar in chemical composition and
small-crack test specimens, loading conditions, test tensile properties to 7075-T6 alloy, was selected be-
procedures, and data analysis procedures used to cause clad aluminum alloy is used extensively in the
obtain small-crack-growth rates. The procedures aircraft industry. Tables I and II give the nominal
used to obtain large-crack-growth rates from CCT chemical compositions and average tensile proper-
specimens are also presented, ties, respectively. Tensile properties for the 7075-T6

TableII. AverageTensilePropertiesofMaterials
Materiala7075-T6LC9csBareLC9cs
Ultimate YieldstressThickness tensilestrength, (0.2-percentB, mm MPa offset), MPa2.3 575 520
52 538 481
Cl.8 575 514
aLongitudinal (or rolling) direction.
bCladding thickness 80 to i00 jzm on each side (as received).
CCladding layer removed, core material.
alloy were obtained from standard American Societyfor Testing and Materials (ASTM) tensile specimens.
Tensile properties are also given for the LC9cs alloy
with the cladding layers removed.
The most significant difference between the twomaterials is the surface condition. The LC9cs alloy
had a cladding layer 80 to 100 #m thick on each sur-face of the sheet; however, that thickness was reduced
to about 50 to 70 #m after the SENT specimens were
chemically polished. The 7075-T6 alloy was a barematerial, although 7075-T6 clad sheet is also used in
the aircraft industry. The thin cladding layer, con-
taining mainly A1-Zn, is used to enhance corrosionresistance. The tensile strength of the cladding ma-
terial is only about 10 percent of that of the bare
material. Consequently, the nominal tensile strength
of the LC9cs sheet is reduced by the cladding. (See
table II.) Yield stress and ultimate tensile strengthof the bare LC9cs alloy were about 7 percent higher
than those of the LC9cs clad alloy. Bare LC9cs alloy
properties agreed well with those of the bare 7075-T6aluminum alloy.
Microstructures typical of each material areshown in figure 5. Clusters of inclusion particles, sim-
ilar in both the 7075-T6 and bare LC9cs alloys, ap-
pear as black regions. The cladding layer was cleaner
than the bare material, but it still contained many
small inclusion particles. The inclusion-particle sizedistributions are shown in figure 6. The large dimen-
sions of the inclusion-particle clusters dT were aligned
perpendicular to the notch surface in the SENT spec-imen, as illustrated in the insert. The distribu-
tions were similar for both alloys. The average grain
sizes in the short S-, transverse T-, and longitudinal
L-directions are shown in figure 7. The grain sizes
in the 7075-T6 alloy in the T- and L-directions wereabout twice as large as those in the LC9cs alloy.
3.2. Specimens
Two types of specimens were used in the test
program. Fatigue (S-N) and small-crack tests wereconducted on the SENT specimens. (See fig. 2.) The
6
Modulus of
elasticity,MPa
70000
66400
69200
Elongation
(51-mm gage
length), .Percent12
12.5
12.3
large-crack tests were conducted on CCT specimens.
(See appendix E, fig. El.)
The small-crack SENT specimens were selected
to produce naturally occurring cracks at material
defects or discontinuities and to propagate cracksthrough a stress field similar to that encountered
in aircraft structures. The semicircular edge notch
permitted easy access to the notch surface; thus,crack monitoring by the replication technique wasconvenient.
The specimen blanks for the SENT and CCT
specimens were cut from aluminum alloy sheets (610
by lS30 by 2.3 mm for 7075-T6 alloy and 1000 by
2000 by 2 mm for LC9cs alloy). The long dimensionof the specimens was parallel to the rolling direction
of the sheet. Each specimen blank was labeled with
a specimen number. All blanks were milled to finaloverall dimensions. Some blanks were reserved for
alignment specimens so they did not contain a notch.
In the SENT blanks, the semicircular notch was
milled with a process designed to minimize residualstresses at the notch root. Details on the machining
process are given in appendix E. All of the 7075-
T6 alloy specimens were machined at LaRC and theLC9cs alloy specimens were machined at BIAM.
The SENT specimens were chemically polishedto debur the edge of the notch, to remove machining
marks from the notch surface, and to eliminate anyresidual stresses from the fabrication process. De-
tails on the polishing process are also given in appen-
dix E. The polishing process removed about 30 pm
of material from all surfaces. In a few specimens, the
notch root residual stresses were measured by X-raydiffraction. These measurements indicated that the
residual stress was negligible (1-2 MPa). Figure 8
shows some typical notch surface finishes on an alu-minum alloy after 1 and 5 minutes of polishing. The
5-minute polishing procedure removed more mate-
rial from the surfaces than did the 1-minute process.
In addition, the edges of the specimens polished for5 minutes were deburred and mildly rounded during

_ v
r) "_
.-2.
v
v
0
7

200 -
150
Inclusionparticles 100 i.
5O
00
m--m dS
m--u dTo--o dS
o--o dT
0
7075-T6
7075-T6
Lcg_s-_i_=--:_-_:_: -_: i
LCgcs
ds ...... - _ ::H
urfoceNotch
I--_I_I--_= - - ,
5 10 15 20
Inclusion-particle size,/_m
Figure 6. Inclusion-particle size distributions for aluminum alloys in short and transverse directions.
40,
Grain size,/._m
7075-T6
30-
20-
10
S T
LC9cs
L
Direction
S T L
Figure 7. Grain sizes for aluminum alloy materials.
8

L-93-46
(a) One minute.
30
%i::
(b) Five minutes.
Figure 8. Effect of chemical polishing time on notch surface finish.
L-93-47
the polishing process, thus preventing prematurecrack initiation at the edge of the notch. Therefore,
the 5-minute polishing procedure was selected for the
current study. In some cases, the notch surface of the
LC9cs alloy was lightly etched beforehand to revealthe microstructure.
All large-crack tests were conducted on 75-mm-
wide CCT specimens made from the two alloys in
the as-received condition. The LCgcs alloy specimenshad about 90-pro-thick cladding on each surface:
Specimens were tested in either hydraulic or flat-plate friction grips. Bolt holes were machined in
the specimens to facilitate the application of uniform
gripping pressure. However, the specimens were notgripped directly; either brass or plastic spacers were
used between the specimens and the grip jaws so that
the specimens would not crack in the gripping area.
Details on the grip design used in both laboratoriesare given in appendix F.
3.3. Loading Conditions
A range of loading conditions was applied in the
test program. Fatigue, small-crack, and large-crack
tests were conducted for three constant-amplitude
loading conditions and for a standardized aircraft
wing spectrum. (See Mini-TWIST ref. 27.) A
summary of the cooperative program test matrix for
the two aluminum alloys is given in table III.
Each laboratory was required to align the test
machines and gripping fixtures to produce a nearlyuniform tensile stress field on an unnotched sheet
specimens that had been instrumented with strain
gages. Blank specimens (identical to the small-
crack specimens without a notch) were machined for
alignment verification. The alignment procedures arepresented in appendix F.
Antibuckling guide plates that had been lined
with tetrafluoroethylene fluorocarbon polymer sheetswere used on all tests where compressive loads were
applied. They were loosely bolted together on bothsides of the specimens. Guide plates were not used
when the minimum applied load was zero or positive.
If a test was interrupted, the steady-state minimum
load was maintained at a level greater than or equalto the required minimum load in the test. The
following sections briefly describe the various loadhistories.

Table III. Cooperative Program Test
Matrix for Aluminum Alloys
Loading 7075-T6
Fatigue SENT tests; cladding
Number tested
= 50 70 #m
LC9es
Clad I Bare
after polishing
Constant R = -1
amplitude R = 0
R= 0.5
12 a(4)17 %4)17 a(3)
16 a(3) 0
14 "(2) 1819 a(2) 17
Spectrum b 14 a(7) 13 a(8)
Small-crack SENT tests; cladding = 50 70 pm after polishing
Constant R = -I
amplitude R = 0
R= 0.5
10
9
10
10
8
9
Spectrum b 8 9
Large-crack CCT tests; cladding = 80 100 pm as received
Constant R -- - 1
amplitude R = 0
R= 0.5
Spectrum b
7 6 0
6 6 1
5 6 1
9 8 0
aReplica-effects tests.
bMini-TWIST loading seqnence (ref. 27).
3.3.1. Constant-Amplitude Loading
Three stress ratios, -1, 0, and 0.5, were used in
tile test program. The negative stress ratio was se-
lected because, as mentioned, the small-crack effect is
more pronounced foi" compressive loading conditions.
In contrast, the small-crack effect is less evident at
high R. At each R, two maximum stress levels were
selected; also the lower stress level was slightly higher
than the fatigue limit. The cyclic frequencies ranged
from 5 to 20 Hz for the fatigue and small-crack tests.
Frequencies for the large-crack tests ranged from 5 to
30 Hz for the constant-amplitude tests and from 30 to
50 Hz for the threshold tests.
Table IV shows the local notch root elastic
stresses at maximum and minimum applied stress for
the SENT small-crack test conditions. For all stress
conditions with R = -1 and 0, the local stresses were
elastic for both materials. However, at R = 0.5, the
notch root yielded under tension for both alloys.
3.3.2. Mini-TWIST Spectrum Loading
The Mini-TWIST loading sequence (ref. 27) was
used for all spectrum loading tests. Mini-TWIST is a
10
Table IV. Local Notch Root Elastic Stresses for
Small-Crack Test Conditions
Loading Smax, MPaKTSmax h_T Stain
(7ys O'ys
7075-T6 alloy
R=-I
R= 0
R= 0.5
Mini-TWIST
80
95
120
140
195
220
190
2O8
0.48
.58
.73
.85
1.I8
1.33
1.15
1.26
-0.48
-.58
0
0
.59
.67
-.26
-.29
LC9cs alloy; multiply by 1.07 for notch root stresses in core
R=-I
R= 0
R= 0.5
Mini-TWIST
70
9O
100
115
165
185
i25
140
170
0.46
.59
.65
.75
1.08
1.21
.82
.91
1.11
-0.46
-.59
0
0
.54
.60
-.19
-.21
-.26
European standard gust load sequence for flight sim-
ulation tests on transport aircraft wing structures.
Load spectra pertaining to wing root stresses were
obtained from several transport aircraft types. The
standardized flight loading sequence was taken as the
average of the different load spectra. Mini-TWIST
represents a load sequence for a block of 4000 flights
that are composed of 10 distinct flight types. Stress
levels in each flight have been normalized by lg mean
stress in flight Smf during cruise conditions. The
highest peak stress Smax = 2.6Smf occurs only once
in the total sequence, The lowest trough (or mini-
mum stress) is Smin = -0.6Snlf. Figure 9 shows a
flight of the Mini-TWIST spectrum that is the third
most severe (2936) of 4000 flights. Thus, Smax and
Smi n are the highest and lowest values of stress in the
total sequence. The cumulative distribution of peaks
and troughs for both the Mini-TWIST and TWIST
flight load sequences in 40000 flights is shown in
figure 10.
The aim of the Mini-TWIST sequence was to
develop a standardized flight sequence that would

Smax
S
0
Smin
Time
Figure 9. Third most severe flight (2936) in Mini-TWIST andTWIST flight load sequences.
3 _ Mini-TWIST
2 Peaksl__ TWIST
S/Smf 1 __ _,,
Troughs I---r'--
0 _ ..............................
101 103 105 107
Cumulative cycles for 40 000 flights
Figure 10. Cumulative peaks and troughs in Mini-TWIST andTWIST flight load sequences for 40 000 flights.
reduce the time and cost involved in tests of the
TWIST sequence. (See ref. 27.) The difference be-
tween these two spectra is the number of cycles ap-plied at the two lower stress levels. In the Mini-
TWIST sequence, the cumulative number of flight
load cycles per block of 4000 flights is 58442 cy-cles, whereas the TWIST sequence has 398 665 cy-
cles. Also, 4000 additional cycles were included for
the ground-air-ground loading (O°min = -0.5Smf ).
These cycles were placed at the end of each flight.Reference 27 gives a complete Mini-TWIST sequence
in flight types and a FORTRAN program to gener-
ate the sequence. This computer program was used
to generate the sequence.
LaRC and BIAM and the loading sequence was care-
flllly verified. Loading accuracy was well within
I percent for each local maximum load and 2 to 3 per-cent for each local minimum load. In the SENT
specimens, the highest stress level in some of the
Mini-TWIST program loading sequences caused thenotch root to yield under tension. (See table IV.)
3.4. Fatigue Test Conditions andProcedures
Because the participants may have been unfamil-
iar with the other's material, eight SENT specimens
were exchanged for use in the exploratory fatigue• tests. These tests verified proposed test procedures
and contributed to understanding the fatigue behav-ior of each material.
Standard S-N tests on the SENT specimens atvarious maximum stress levels for both constant-
amplitude and spectrum loading were used to aid inthe selection of the applied stress levels and plastic-
replica intervals for the tests involving small-crack
growth. The fatigue life data were also used to assess
a method for total fatigue life prediction based solelyon crack propagation from material microstructural
defects or from the cladding layer.
For constant-amplitude loading, tests were con-
ducted at R = -1, 0, and 0.5. Thc Mini-TWIST
program loading sequence was used for the spectrumtests. Guide plates, as shown in figure 4, were used
for all tests with compressive loads. The SENT spec-
imens were cycled to complete failure (or stopped
without failure after 2 million cycles for tests to es-tablish the fatigue or endurance limit for constant-
amplitude loading). The maximum number allowed
for the spectrum tests was 5 million cycles. (Speci-mens removed after these cycles were not retested.)
The test matrix for the fatigue tests is shown in ta-ble III. This table shows the number of specimens
tested at each condition for each material. In paren-
theses is the number of tests conducted to study theeffects of the plastic-replica method on fatigue life.
The LC9cs alloy was also tested without the cladding
to study the effects of the cladding layer on fatiguelife.
3.5. Small-Crack Test Conditions and
Procedures
To ensure that the load sequences and magni-
tudes were identical for the two laboratories, the
same FORTRAN load generator code was used at
The test matrix for the small-crack program issummarized in table IV. The two objectives for thesmall-crack tests were to obtain data on surface-
or corner-crack length against cycles and to obtain
surface- or corner-crack depths. To achieve these
objectives, two types of tests were required. Some
11

specimensweretestedfor cracklengthagainstcyclesuntil onecontinuouscrackextendedacrossthenotchroot andthe specimenwaspulledto failure. Themethodof recordingsmall-crackgrowthis givcninappendixG. Otherspecimensweretesteduntil thetotal cracklengthalongthe boreof the notchwasmuchlessthan the sheetthickness.The specimenwasthenmonotonicallypulledto failure. Thefrac-turesurfaceswereexaminedto revealthesurface-orcorner-crackshapes.
3. 5.1. Small- Crack Measurement Method
Newman and Edwards (ref. 19) investigated scv-eral methods for measuring the growth of naturally
initiated cracks 10 ttm to 2 #m long for a test pro-
gram on small-crack growth in an aluminum alloy.
These methods were electrical potential (ref. 28),
ultrasonic surface waves (ref. 29), marker bands(ref. 30), and plastic replicas (rcf. 31). Of these, only
in the plastic-replica method was able to monitor thegrowth and location of single and multiple cracks as
small as 10 pm along the bore of a notch. Because
the plastic-replica method was accurate to the small-
crack lengths required in the program, that methodwas also selected for this Study: The method is simple
to apply, but it is labor intensive; that is, many repli-cas must be taken for adequate descriptions of crack
length against cycles. The plastic-replica proceduresare presented in appendix H.
Figure 11 shows the area of the specimen notchroot over which cracks were to be monitored. The
crack depth L1 was measured along the bore of thenotch. The value of L1 and its location were recorded
on a data chart as a function of cycles. A sampledata chart, shown in appendix G, includes the speci-
men number, cycles, and a grid upon which the infor-mation obtained from a replica was recorded. Each
record of crack length, location, and cycles was taken
at specified cyclic intervals. Cyclic intervals were cho-
sen so that at least 25 to 30 replicas were taken dur-
ing each test. The intervals were determined by di-
viding the fatigue life at each test strcss level by 25or 30. Replicas were also taken while the specimens
were tensile loaded (S -- 0.6 to 0.8Smax). (Theprocedures for taking replicas for constant-amplitude
and spectrum loading are presented in the next sec-
tion.) Figure 12 shows scanning-electron-microscope
(SEM) photographs of notch surface replicas for thetwo alloys. Crack depth measurements L were the
horizontal projections. For surface cracks, L = 2a
and for corner cracks, L = a. The test was ter-
minated when a crack had grown across the speci-
men thickness B. Then, the specimen was staticallypulled to failure. Some tests, however, were statically
L3
w
•------ B -----.
End View
T2r
l
(a) Cracks in notch root. (b) Crack length measurements.
Figure 11. Notch configuration and crack-length measure-ments.
pulled to failure early in life to determine the shape
of the crack or cracks. (See sec. 3.5.3.)
At the lower stress levels selected in table IV, a
single crack was expected to initiate naturally anddominate for most of the fatigue life. However, at
the higher stress levels, several cracks may develop
along the bore of the notch, as shown in figure 11. Ifseveral cracks developed in the test, these cracks were
also recorded on the data chart as L i (i = 1 to n). Anexample of the recorded multiple crack data is shown
in figure G1 of appendix G. Starting with the lowest
number of cycles (early in life) where cracks could bemeasured, researchers numbered them and recorded
the lengths +0.001 mm on the data chart. At the
next cyclic interval, crack lengths were recorded andany new cracks were included. If two cracks had
joined, the lower crack number was used as the
identifier. These data charts provided approximatelocations for determining crack initiation sites, for
calculating stress intensity factors, and for applying
the crack noninteraction criteria. (See sec. 6.5.)
The following were collected for each test: data
charts, a small-crack data table (scc appendix G),a photograph of the surface or corner cracks for the
full thickness of the specimen, and a photograph of a
replica near the end of each test for the full thickness.
The data for crack length against cycles were thenused to obtain stress intensity factor ranges against
crack-growth rates. The method of calculating stress
intensity factors and crack-growth rates is presentedin section 3.6.
12

I-Crack length, L (2a) _1
-I
I. Crack length, L (a) =1I-
/Initiation site
(a) Surface crack in 7075-T6 alloy.L-93-48
1 60- tm,Claddin; I1- Core
(b) Corner crack in LC9cs alloy.
Figure 12. SEM photographs of replicas of notch surfaces.
L-93-49
3.5.2. Constant-Amplitude and Spectrum
Loading
Replicas were taken while the specimens were
tensile loaded so that any cracks would be open andwould allow the replica material to infiltrate. The
procedures for each type of loading were as follows.
3.5.2.1. Constant-amplitude loading. The test
was stopped at mean (or minimum) load. The ap-
plied load was then manually increased to 80 percentof the maximum test load. This load was held while
a replica was taken along the bore of the notch. (See
procedures in appendix H.) After the replica was re-moved from the notch, the load was reduced to the
mean and the test was restarted.
3.5.2.2. Spectrum loading. To take replicas for
the Mini-TWIST loading sequence, the test machine
was programmed (or manually set) to stop and holdat a specified peak level after the desired number
of cycles. The replica was taken along the bore ofthe notch. A peak load of level VIII was specified
in the Mini-TWIST loading sequence. (See fig. 2 of
ref. 27.) This level corresponds to about 60 percentof the maximum applied stress. After the replicawas removed from the notch, the test machine was
restarted and it continued from the specified peaklevel.
3.5.3. Crack Shape Determination
The replica method provides information only onsurface- or corner-crack lengths along the notch root.
The surface- and corner-crack depths had to be de-
termined either by an experiment or by analyticalcalibration. For each test condition, several speci-mens were to be tested until the total crack length
along the bore of the notch was at different percent-
ages of the sheet thickness. The specimen was then
pulled to failure to reveal the crack locations, shape,and size.
3.6. Small-Crack Data Analysis
Procedures
In the following sections, stress intensity factor
equations are presented for a surface or corner crackemanating from a semicircular edge notch. These
equations are used later to compare crack-growthrates measured for small cracks with those measured
for large cracks as a function of the stress intensity
factor range. The method of calculating the crack-
growth rates for small cracks is also presented.
3. 6.1. Calculation of Stress IntensityFactors
The calculation of stress intensity factors assumes
either a semielliptical surface crack at the center
of the edge notch, as shown in figure 13(a), or a
13

SSection A-A
= _. (a) Surface crack.
_'*_ r ----_ c _----
(b) Corner crack.
--f--B=2t
A_Ta
(c) Definition of _.
S
Figure 13. Definition of dimensions for specimens, surface- and corner-crack configurations, and parametric angle _.
quarter-elliptical corner crack at an edge, as shown
in figure 13(b). The crack depth L (a or 2a) isalways measured in the B direction and the lengthof crack c is measured in the w direction. For a
surface crack at a notch, thickness is denoted 2t for
convenience in expressing stress intensity factors as
a function of a/t; that is, a/t varies from 0 to 1.This nomenclature was selected so that both surface
and corner cracks will become a through crack of
length c when a/t approaches unity. For surface
cracks at other places Mong the bore of the notch,
the equations presented herein are adequate if thecrack is small compared with thickness. However,
if several cracks are close to one another, then the
calculation of stress intensity factors is in error. Noprovisions have been made to account for multiple
crack interactions in the calculation of stress intensity
factors. Instead, data were simply rejected if an
interaction was likely. (See sec. 6.5, "Small-Crack-
Growth Noninteraction Criteria.")
To calculate the stress intensity factor at thepoint where the crack intersects the notch surface
(_, = 7r/2), a and c must be known. For a surface
crack, 2a (L) was measured as the projection of the
crack on a horizontal plane, as shown in figure 12(a).
The crack aspect ratio a/c and c were calculated from
and
a 40(t ) ( a )-c = + 0.2 for _ < 0.02 (lb)
For a corner crack, a (L) is again the projection of the
crack on a horizontal plane, as shown in figure 12(b),and the ratio a/c was calculated from
o- = 1.1+0.1 a (2)C
for a > l, the cladding-layer thickness. Equa-
tions (la) and (2) were determined by visual straight-line fits to the experimental data; these comparisons
are shown in section 6.3. Equation (lb) was selectedto match predicted results from the crack-growth
analyses based on a typical material (inclusion-particle cluster) defect size and shape, The mea-
sured crack shapes are compared later with those
predicted from the stress intensity factor equations
and the crack-growth rate properties.
The stress intensity factor range equation for
a surface crack at the center of the edge notch
(fig. 13(a)) for uniform remote stress is
AK =/kS Fs (3a)
a 1 + 0.1 (_) (for a > 0.02) (la)c t --
Equations for the shape factor Q and the boundary-correction factor Fs are given in appendix D.
14

Fora cornercrack, 3. 7.1. Constant-Amplitude Loading
AK = AS Fc (3b)
Equations for Fc also are given in appendix D. Equa-
tions (3a) and (3b) apply to a range of crack configu-
ration parameters (ale, a/t), but they are restrictedto the SENT specimens with r/w = 1/16 and 1 < r/t
< 3.5. For corner cracks in the LC9cs alloy, a correc-
tion for the cladding was developed in section 4.5.3 to
modify the calculation of the stress intensity factor
range.
The stress range AS is full range (Smax - Smin)
for constant-amplitude and spectrum loading. For
example, AS = 2Smax for R = -1 loading. For
spectrum loading, the highest peak stress is Smax andthe lowest trough is Smin.
3.6.2. Calculation of Crack-Growth Rates
The calculation of crack-growth rate for constant-amplitude and spectrum loading for small cracks was
a simple point-to-point calculation. That is,
da Aa ai+ l - ai
dN -- AN -- Ni+l- Ni (4)
where a i is the crack length at 2Vi cycies. The cycIicinterval AN is the interval between replicas. The
cyclic interval was chosen so that at least 25 to
30 replicas were taken during a test. The correspond-
ing AK is calculated at an average crack depth as
ai+ai+l (5)a-- 2
and c is calculated from equations (1) or (2).
3.7. Large-Crack Test Conditions andProcedures
Fatigue crack-growth rate tests were conducted
for large cracks (c > 2 mm) at the three constant-amplitude stress ratios and for the Mini-TWIST
loading sequence. Data were generated for the two
materials for a range of rates, especially in the
near-threshold crack-growth regime. Tests were per-formed on 75-mm-wide CCT specimens made of the
7075-T6 and LC9cs alloys. (See appendix E.) Themethod of recording large-crack data is presented
in appendix G. These data were used to define the
regime in which small-crack data from the SENT
specimens correlated with large-crack data. The re-sults from this study are presented and discussed insection 5.
Constant-amplitude tests were conducted at
R = -1, 0, and 0.5. At each R, both constant-
amplitude loading and threshold tests were con-
ducted. In the threshold tests, crack-growth rates
wcre obtained for a load-shedding (decreasing AK)
procedure. The LaRC researchers used a load-shedding procedure that was consistent with the
guidelines of the ASTM Standard Test for Measure-
ment of Fatigue Crack-Growth Rates (E647-87) in
which the loading was reduced by 6 percent every1 mm of crack growth, whereas the CAE researchers
employed a procedure in which the load was de-
creased by 10 percent every 1 mm of crack growthfor rates greater than 2 x 10 -6 mm per cycle and
6 percent for rates lower than 2 x 10 -6 mm per cy-
cle. After they reached threshold conditions, some
specimens were then tested for load-increasing con-
ditions to obtain more crack-growth data.
3. 7.2. Mini- TWIST Spectrum Loading
Program
Spectrum tests were controlled by a computer
program that allowed the mean flight stress to bechanged at any stage by the operator, to stop the
test at zero load, or to stop the test at the required
stress level so that replicas could be taken on the
SENT specimens. This program also allowed load-decreasing or load-increasing tests to be conducted
without interrupting the flight history, except when
Smf was changed.
3.7.3. Large-Crack Data Reduction
Crack-growth rates were calculated from crack
length against cycles using the secant (point-to-point) method. The stress intensity factor range was
computed from the well-known equation for a central
crack in a strip in tension (ref. 32),
AK=AS lrcsec _ww (6)
where AS is the full cyclic range, c is the average of
the crack length measured on the right and left sidesof the specimen, and w is half-width of the specimen.
Visual best-fit lines (piecewise linear segments) weredrawn through the AK rate data. These baseline
relations were developed to compare with small-crackdata generated for the same test conditions.
4. Analysis Program
To understand small-crack growth and to improvelife-prediction methods, accurate stress intensity
15
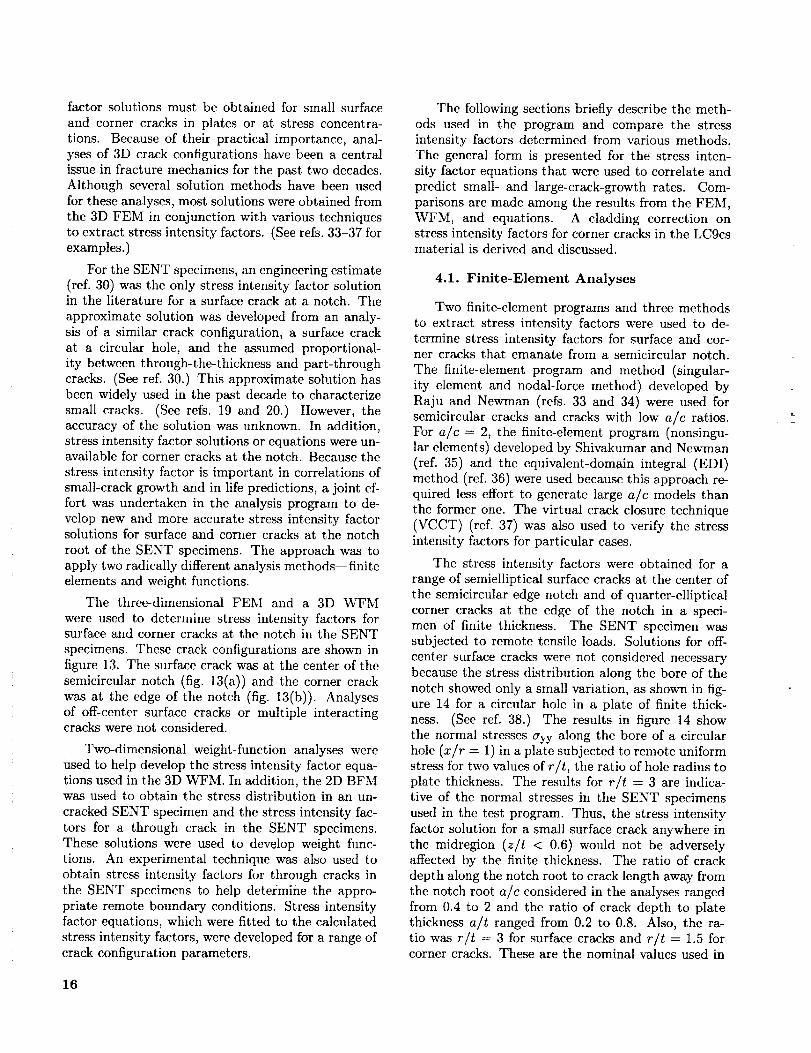
factorsolutionsmustbeobtainedfor smallsurfaceandcornercracksin platesor at stressconcentra-tions. Becauseof their practicalimportance,anal-ysesof 3Dcrackconfigurationshavebeena centralissuein fracturemechanicsfor thepasttwodecades.Althoughseveralsolutionmethodshavebeenusedfortheseanalyses,mostsolutionswereobtainedfromthe3DFEMin conjunctionwith varioustechniquesto extractstressintensityfactors.(Seerefs.33-37forexamples.)
FortheSENTspecimens,anengineeringestimate(ref.30)wastheonlystressintensityfactorsolutionin the literaturefor a surfacecrackat a notch.Theapproximatesolutionwasdevelopedfromananaly-sisof a similarcrackconfiguration,a surfacecrackat a circularhole,and the assumedproportional-ity betweenthrough-the-thicknessandpart-throughcracks.(Seeref. 30.)Thisapproximatesolutionhasbeenwidelyusedin thepastdecadeto characterizesmallcracks. (Seerefs.19and20.) However,theaccuracyof the solutionwasunknown.In addition,stressintensityfactorsolutionsorequationswereun-availablefor cornercracksat thenotch.Becausethestressintensityfactoris importantin correlationsofsmall-crackgrowthandin lifepredictions,a joint ef-fort wasundertakenin theanalysisprogramto de-velopnewandmoreaccuratestressintensityfactorsolutionsfor surfaceandcornercracksat thenotchroot of theSENTspecimens.Theapproachwastoapplytworadicallydifferentanalysismethods--finiteelementsandweightfunctions.
The three-dimensionalFEM and a 3D WFMwereusedto determinestressintensityfactorsforsurfaceandcornercracksat thenotchin theSENTspecimens.Thesecrackconfigurationsareshowninfigure13.Thesurfacecrackwasat thecenterofthesemicircularnotch(fig. 13(a))andthe cornercrackwasat theedgeof the notch(fig. 13(b)).Analysesof off-centersurfacecracksor multiple interactingcrackswerenotconsidered.
Two-dimensionalweight-functionanalyseswereusedto helpdevelopthestressintensityfactorequa-tionsusedin the3DWFM.In addition,the2D BFMwas used to obtain the stress distribution in an un-
cracked SENT specimen and the stress intensity fac-tors for a through crack in the SENT specimens.
These solutions were used to develop weight func-tions. An experimental technique was also used to
obtain stress intensity factors for through cracks inthe SENT specimens to help determine the appro-
priate remote boundary conditions. Stress intensityfactor equations, which were fitted to the calculated
stress intensity factors, were developed for a range ofcrack configuration parameters.
The following sections briefly describe the meth-ods used in the program and compare the stress
intensity factors determined from various methods.The general form is presented for the stress inten-
sity factor equations that were used to correlate and
predict small- and large-crack-growth rates. Com-
parisons are made among the results from the FEM,
WFM, and equations. A cladding correction onstress intensity factors for corner cracks in the LC9csmaterial is derived and discussed.
4.1. Finite-Element Analyses
Two finite-element programs and three methods
to extract stress intensity factors were used to de-termine stress intensity factors for surface and cor-ner cracks that emanate from a semicircular notch.
The finite-element program and method (singular-
ity element and nodal-foree method) developed by
Raju and Newman (refs. 33 and 34) were used for
semicircular cracks and cracks with low a/c ratios.For a/c -- 2, the finite-element program (nonsingu-lar elements) developed by Shivakumar and Newman
(ref. 35) and the equivalent-domain integral (EDI)method (ref. 36) were used because this approach re-
quired less effort to gcnerate large a/c models thanthe former one. The virtual crack closure technique
(VCCT) (ref. 37) was also used to verify the stress
intensity factors for particular cases.
The stress intensity factors were obtained for a
range of semielliptical surface cracks at the center of
the semicircular edge notch and of quarter-elliptical
corner cracks at the edge of the notch in a speci-men of finite thickness. The SENT specimen was
subjected to remote tensile loads. Solutions for off-
center surface cracks were not considered necessary
because the stress distribution along the bore of the
notch showed only a small variation, as shown in fig-ure 14 for a circular hole in a plate of finite thick-
ness. (See ref. 38.) The results in figure 14 show
the normal stresses ayy along the bore of a circularhole (x/r = 1) in a plate subjected to remote uniform
stress for two values of r/t, the ratio of hole radius to
plate thickness. The results for r/t = 3 are indica-tive of the normal stresses in the SENT specimens
used in the test program. Thus, the stress intensityfactor solution for a small surface crack anywhere in
the midregion (z/t < 0.6) would not be adverselyaffected by the finite thickness. The ratio of crack
depth along the notch root to crack length away fromthe notch root a/c considered in the analyses ranged
from 0.4 to 2 and the ratio of crack depth to platethickness a/t ranged from 0.2 to 0.8. Also, the ra-
tio was r/t = 3 for surface cracks and r/t = 1.5 forcorner cracks. These are the nominal values used in
16

4o a Folias (ref. 38) elliptical corner cracks (ref. 40), in plates of finite
r/t -- 1 - - Exoct (2D) thickness subjected to mode I loading. Results fromthe WFM agreed well with other accepted solutionsAt"
. ___=_=_=.______ _ for these crack configurations.
Herein, the method was applied to surface andr/t -- 3 corner cracks at the semicircular notch in the SENT
specimens (refs. 49 and 50). The 3D WFM for-mulated here, however, assumed that the normalstress distribution around the notch root was uniform
through the thickness. This assumption was justified
_-× for the SENT specimen configurations in the cur-rent study because through-the-thickness variations
in normal stress are small, as shown in figure 14. Ba-
sically, the current 3D WFM uses the normal stress
distribution shown by the dashed line. The normal
, stress distribution, together with the corresponding
J .0 stress]ntensity factors for through cracks (calculatedfrom the BFM), was used to derive the 2D weight
function (ref. 45) for a through crack emanating froman edge notch. The 2D weight function was then used
in the 3D WFM to derive stress intensity factors forsurface and corner cracks at the notch. The 3D WFM
allows for the determination of stress intensity factors
at any location along a crack periphery for the crack
configurations shown in figure 13. The a/c rangedfrom 0.2 to 2 and a/t ranged from 0.05 to 0.5. Note
Chat the WFM was applied to a different range of a/c
and a/t values than the FEM. The WFM was appliedto smaller cracks (lower a/t), but the FEM was ap-
S
S
0 I ,, I I I
0.0 0.2 0.4 0.6 0.8
z/t
Figure 14. Stress concentration along bore of circular hole infinite-thickness plate for remote tensile loading.
the test program. Appendix A gives more details ofthe finite-element analyses. Tables of stress inten-
sity factors for various crack configurations are also
presented.
4.2. Weight-Function Analyses
The 3D WFM developed in references 39 and 40
was based on the slice-synthesis procedure (refs. 41-43) and the general expressions for 2D weight func-
tions. (See refs. 44 46.) Reference 47 reviews the 2D
and 3D WFM's and their solutions. Basically, the3D WFM transforms the restraining effect of the un-
cracked part of a 3D cracked body into a kind of elas-
plied to larger cracks (larger a/t). For surface cracks,
r/t = 2.78 and 3.2 and r/t = 1.39 and 1.6 for corner
cracks. These are the particular r/t values used inthe test program for the two materials. Appendix B
gives the details of the 3D WFM. Tables of stress
intensity factors for various crack configurations alsoare presented.
tic boundary condition on 2D slices. Thus, some 3Dnature is built into these slices. The weight functions 4.3. Boundary Force Method
for these slices are constructed through two limitingcases, one for zero constraint and the other for fixed
constraint, by using the general weight functions
for 2D crack configurations. For an infinite, semi-infinite, or quarter-infinite body wherein the restrain-
ing areas tend to infinity, the 2D weight functions
with fixed boundary conditions are directly applied.
However, for a finite body, a reference soIution isneeded to determine an unknown parameter in the
weight functions for the slices. For the present prob-
lems with r/w = 1/16, the 2D weight functions
with fixed boundary conditions are applicable, as dis-cussed in appendixes B and C.
The 3D WFM has previously been applied to
embedded elliptical cracks (refs. 39 and 40), semi-elliptical surface cracks (refs. 40 and 48), and quarter-
The BFM was formulated for 2D stress analysisof complex configurations, with and without cracks,
subjected to internal loading and traction or displace-
ment boundary conditions. (See refs. 26 and 51.)
The BFM uses the elasticity solution for concen-trated forces and a moment in an infinite plate as
the fundamental solution. For plates without a crack,
Muskhelishvili's solution (ref. 52) for a pair of con-
centrated forces Pz, Py and moment M in an infiniteplate is used as the fundamental solution. For a plate
with a crack, Erdogan's solution (ref. 53) for Px and
Py and for M in an infinite plate with a crack is used
as the fundamental solution. With Erdogan's solu-tion, the crack faces need not be modeled as part of
the boundary because the stress-free conditions on
the crack faces are exactly satisfied.
17

F$
3 3
2
a/c = I
FEM WFM WFM
a/t .3 2.78 3.2
.2 -- o []
,5 -- & 0
I I I
0 30 60 90
_p, deg
Fc 2
I I
0 30 90
_, deg
FEM WFM
r/ta/t 1.5 1.39.2 _ o
a/c = 1 .5 -- "
I
6O
WFM
1.6t-1
o
Figure 15, Boundary-correction factors from FEM and WFMfor semicircular surface crack at notch.
Figure 16. Boundary-correction factors from FEM and WFM
for quarter-circular corner crack at notch.
The BFM was used to analyze the uncrackedSENT specimens to obtain the stress concentrationfactor and the normal stress distribution along thenet section. In addition, the BFM was used toanalyze a through crack emanating from the SENTspecimens subjected to either remote uniform stressor displacement. The James and Anderson technique(ref. 54), to extract experimental stress intensityfactors, was used to verify the remote boundaryconditions on the SENT specimens. Appendix Cgives some details of the BFM analysis and of the2D solutions used in the cooperative program.
4.4. Comparison of Methods
that the FEM results arc slightly higher (2 per-cent) for surface cracks and slightly lower (3 per-cent) for corner cracks than are the WFM results.This small variation may have been caused by theslightly higher normal stresses shown in figure 14 forz/t < 0.2 for surface cracks and the slightly lowernormal stresses for z/t > 0.8 for corner cracks. Thisnominal stress variation was accounted for in the
FEM. The WFM did not account for through-the-thickness variations in the normal stresses. For theconfigurations used in the cooperative test program,however, neglecting the small through-the-thicknessvariations was justified.
Typical comparisons of the stress intensityboundary-correction factors from the FEM andWFM are shown in figures 15 and 16 for a semi-circular surface crack and quarter-circular cornercrack at a notch, respectively. The FEM analyseswere conducted on a large mainframe computer withabout 15 000 degrees of freedom (DOF), whereas theWFM analyses were performed on a personal com-puter. The boundary-correction factor is plottedagainst the parametric angle _. The WFM resultsare shown as symbols for the two particular val-ues of r/t used in the test program. The curvesshow the results from the FEM for a nominal value
of r/t. Results for a/t = 0.5 agree well (within3 percent) with the FEM analyses, except where thecrack intersects the free boundaries (_p = 90° forsurface cracks; qa = 0° and 90 ° for corner cracks).The results for the smaller crack (a/t = 0.2) show
The stress intensity boundary-correction factorsfrom the FEM and those for the WFM for an ellip-tical crack (a/c = 2) are shown in figure 17. Again,the boundary-correction factor is plotted against _ofor several values of r/t. The WFM results (solidsymbols) are average results between r/t = 1.39and 1.6. For all crack configurations considered inthe analysis program, these results show the largestdifference (about 10 percent) between the FEM andWFM. To resolve these differences, two finite-elementprograms, three methods of extracting stress inten-sity factors, and several finite-element models wereused. These results are shown in figure 18. Theopen circles show the results from the FEM and the
model (model A with 13 wedges of elements alongthe crack front and the EDI method) used in the co-operative program for a/c = 2. Model B containedsingularity elements around the crack front (about
18

F c
a/= = 2
00 30
FEM WFM WFMr/t
a/t 1.5 1.39 1.6.2 _ o []
.5 -- z_ 0
! !
60 90
ep, deg
Figure 17. Boundary-correction factors from FEM and _,VFM
for quarter-elliptical corner crack at notch.
3
F c
2
@ •
= 1.5a/c = 2
a/t = 0.2
• WFM
FEM Model:
o A (EDI)
[] B (Nodol force)
A C (EDI)
o c (VCCT)0 I I I
0 30 60 90
_, deg
Figure 18. Boundary-correction factors from various finite-
element models and methods and weight-function resuNs
for quarter-elliptical corner crack at notch. _
15 000 DOF) and the nodal-force method was usedto calculate stress intensity factors. Model C con-tained nonsingular elements around the crack frontbut had 20 wedges of elements along the crack frontwith about 18 000 DOF. Two methods, EDI and theVCCT, were used to extract stress intensity factors.All FEM's show similar results in the region of con-cern (_ < 30°).
The higher WFM results for the corner-crack con-figuration may, to some extent, be attributed to ne-glecting the normal stress variation in the thicknessdirection near the plate surface. The results from a3D stress analysis of a hole in a plate of finite thick-ness (fig. 14) show that the z variation of the normalstress is largest at the hole and plate surface. Theactual normal stresses are lower than the 2D stress
distribution used in the 2D weight-function analyses.Thus, the 2D stress distribution will overestimate thestress intensity factors for corner cracks in the SENTspecimens when the ratio of crack length to notch ra-dius c/r is small. If the actual 3D stress distributionhad been used as the applied crack-face loading inthe WFM, lower stress intensity factors would havebeen obtained. However, no further effort was takenhere to clarify this point because the precise 3D stressdistribution in the notch-root region was not knownand the refined 3D finite-element analyses providedconfidence in the FEM solution.
4.5. Stress Intensity Factor Equations
The FEM and WFM stress intensity factor solu-tions for surface and corner cracks at a notch (appen-dixes A and B) and the BFM solutions for a throughcrack at a notch (appendix C) were used to developequations. The stress intensity factor equations andtheir functional forms are given here for a semi-elliptical surface crack at the center of a semicircularedge notch, a quarter-elliptical corner crack at theedge of the notch, and a through crack at the notchsubjected to remote uniform stress or displacement(where the ratio of one-half the specimen height hdivided by width w was 1.5). Thus,
(_),/2 (a a c c r r )K=S Fj c' t' r' w' t' w' _ (7)
where Fj is the boundary-correction factor. (Seeref. 34.) The equations were developed for a rangeof crack configurations with r/w = 1/16 (the r/wvalue for the SENT configuration). Note that heret is defined as one-half the full sheet thickness for
surface cracks (j = s) and t is full sheet thickness forcorner cracks (j = c). Here Q is given by
Q = 1+ 1.464 (a)1.65_, (for a/c <_ 1) (8a)
(c] 1.65q = 1 + 1.464 -a/ (for a/c > 1) (8b)
19

i ..--'• ...%,-
F 2L .-"-.-" %
/ .,,/-t I"..-'o.. "..._ .... . ..... " t_ ....'-_ '" .'1_1". a/t_ FEM WFM Equation,_"'_11.°-''m o/( WFM Equation
___-1i .UO • _ .2 o • --
I O I i I
0 30 60 90 0 30 60 90
ep, deg tp, deg
(a) a/c = 0.2. (b) a/c = 0.4.
4 ._ 33 Do
..... ._'" ""'" 2
Fs 2 Fs
0
a/t FEM WFM Equation 1.05 •.2 o • --.5 rl • ---
I l I 0
30 60 90 0
_, deg
(c) ale = 1.
a/t FEM WFM Equation,05 • m.2 o •.5 [] • --
! ! I
30 60 90
_, deg
(d) a/c= 2.
Figure 19. Boundary-correction factors from FEM, WFM, and equations for surface crack at notch, r/t = 3.
4.5.1. Surface and Corner Cracks at Notch
4.5.1.1. Surface crack at a semicircular notch.The boundary-correction factor equation for a semi-elliptical surface crack at the center of a semicircularedge notch (fig. 13(a)) subjected to remote uniformstress or displacement is
[Fs = 1_1 + 1_I2 + 1_I3 glg2g3g4g5f_fw (9)
for 0.2 < a/c < 2, a/t < 1, 1 < r/t < 3.5,(r + c)/w < 0.5, r/w = 1/16, and -7r/2 < _o< _t/2.The equations for all other terms in equation (9) aregiven in appendix D.
Figures 19(a)-19(d) show comparisons among theFEM, WFM, and stress intensity factor equationsfor a surface crack at the notch root in the SENT
specimens. Each figure is for a constant value of a/cand r/t. The WFM results (solid symbols) are theaverages of the results for the two values of r/t used in
20

the test program. The open symbols in figures 19(b)-
19(d) show the FEM results. The equations are
shown by the curves for various values of a/t. Theequations are well within :t:4 percent of the WFM
and FEM results, except where the crack intersects
the notch boundary (_ = 90°). In applications,
the stress intensity factors near the free surface have
been shown to control fatigue crack growth. (See
ref. 55.) (Note that the percentagc of error is definedin reference to the largest stress intensity factor for
any particular configuration.)
4.5.1.2. Corner crack at a semicircular notch.
The boundary-correction factor equation for a
quarter-elliptical corner crack at the edge of a semi-
circular edge notch (fig. 13(b)) subjected to uniformremote stress or displacement is
a 4
Fc-_ I_t_/1-i-A'/2 (_)24-_/3 (_) Jglg2g3g4g5f'_[w (_0)
Figure 21 shows a comparison between the BFM
results and stress intensity factor equations for a
through crack at the notch in a SENT specimen sub-jected to either remote uniform stress or displace-
ment (h/w -- 1.5). Figure 21(a) shows the results
for small through cracks and figure 21(b) the re-
sults for large cracks. These results indicate that
the boundary-correction factors are strongly influ-enced by the remote boundary condition for large-
crack lengths. Through-crack equations, fitted to
these results, are shown by the curves. The equa-
tions are within =t=2 percent of the BFM results.
Stress intensity factors from experiments were alsodetermined from the fatigue crack-growth-rate test
in appendix C, and agreed well with the numeri-
cal results for uniform displacement boundary condi-tions. Thus, the equations for uniform displacement
with h/w = 1.5 were used in the life-prediction code
FASTRAN II (ref. 56) to predict small- and large-crack growth in the SENT specimens.
for 0.2 < ale < 2, air < 1, 1 < r/t < 2, (r + c)lw< 0.5, r/w = 1/16, and 0 < _ < 7r/2. Again, theequations for other terms in equation (10) are given
in appendix D.
Figures 20(a)-20(d) show comparisons among the
FEM, WFM, and stress intensity factor equationsfor a corner crack at the notch root in the SENT
specimens. Here, too, each figure is for a constant
value of a/c and r/t. The WFM results (solid
symbols) are the averages of results for the two
values of r/t (1.39 and 1.6). Open symbols showthe FEM results for r/t = 1.5. Again, the corner-
4.5.3. Effect of Cladding
In the LCgcs alloy, cracks initiated in the cladding
layer and grew as corner cracks into the core mate-
rial. To account for this growth, the stress inten-
sity factor solution _or corner cracks was modified
to approximately model cracks in a multiple-layermedium. The yield stress of the cladding was esti-
mated to be about 50 MPa. In the SENT specimens,
the cladding layer (_) always yielded and developed
multiple cracks from slip-band formation along thecrack equations are shown by the curves for various edges of the notch. Thus, as a first approximation,values of a/t. The equations are generally within:£5 percent of the FEM and WFM results exceptfor the differences noted between the methods for
shallow cracks with a/c -- 2 (fig. 20(d)) and deep
cracks with a/e = 0.4 (fig. 20(b)). In these two cases,the equations were made to fit the FEM resuIts.
4.5.2. Through Crack at Noteh
The stress intensity factor for a through crack
emanating from a semicircular notch subjected to
remote uniform stress or displacement is expressedas
K = S(Trc)l/2Ft( cw' re' _) (11)
where Ft is the boundary-correction factor that ac-counts for the effect of the notch and external bound-
aries for r/w ---- 1/16. Equations are given inappendix C for Ft for uniform remote stress or
displacement.
was assumed to carry no load. To estimate the ef-fects of the cladding layer on stress intensity factors,
two stress intensity factor solutions were used: one
was an edge crack in a 2D sheet that carries a uni-
form stress q over only the core material, as shown infigure 22(a); the other was an edge crack that carries
uniform stress over the total crack length, as shown
in figure 22(b). The cladding correction factor wasthen defined as the ratio of the stress intensity factors
for the two crack configurations. The stress intensity
factor for the partially loaded edge crack (ref. 47) is
given by
(12)
where /31 _- 2, /32 = 0.9788, /33 = 1.1101, /34 =-0.3194, and j35 = -0.1017. The corresponding
21

4
3
Fc 2
I
"° 3
. ._14"'" • ..,-._'_"
..z-. -.f _....i. ,
-''" • FEM.-'/o a/t WFM Equation • • • a/t WFM Equation
-$ • 1 .05 • --.05 • -- .2 o • --.2 • -- .5 [] • - -
0 , i , 0 ' ' '0 30 60 90 0 30 60 90
_, deg _, deg
(a) a/c = 0.2. (b) a/c = 0.4.
• Y
T -_---'@--J----_-- _':.""$"_.-.=.... ,_-'" ...-
• :lt:.::..T..---.--- _'.T..'.'............Fc 2
00
FC
2
a/t FEM WFM Equation 1.05 • --
.2 o • --
.5 [] • --
.8 A ....
i ,_ I 0
30 60 90
_, deg
(c) a/c = 1.
a/t FEM WFM Equation.05 •.2 o • --.5 [] • --
I I
60 90
|
0 30
_#, deg
(d) ale = 2.
Figure 20. Boundary-correction factors from FEM, WFM, and equations for corner crack at notch, r/t = 1.5.
stress intensity factor for the uniformly loaded edgecrack (r.ef. 32) is
Ke = av/_ 1.1215 (13)
The ratio of Kcs/Ke, the cladding correction factor,is
_-'5 Bj (1- _)j-1/2 (14)Gc O.4"--" 2j - 1j=l
If the crack length is equal to the cladding thick-hess, then Gc = 0, whereas if the crack length be-comes large compared with cladding thickness, Gcapproaches unity and the cladding has no effect onstress intensity factors.
The cladding correction must now be applied toa corner-crack configuration. (See fig. 22(c).) Theangle _ is measured from the free surface. The edge-crack cladding correction can be directly applied topoint A in that figure, point A being the intersection
22

4 4
Ft 2
o. BFM
Equation (C12)uniform displacement
-- Equation (C12)uniform stress
Ft 2
0 I, I I 0
0.00 O. 15 0.00.05 0.10
(c + r)/.
(a) Small through cracks.
¢
0/ /I/ /
on BFM
Equation (Cl 2)uniform displacement
-- Equation (C12)uniform stress
I I I I I
0.2 0.4 0.6 0.8 1.0
(c + 5/*
(b) Large through cracks.
Figure 21. Boundary-correction factors from BFM and equation for small through crack at notch, r/w = 1/16; h/w = 1.5.
l tttttt
tI
C
TC
±
:i
front
a -'-IA
(a) Partially loaded edge crack. (b) Uniformly loaded edge crack. (c) Corner crack in clad material.
Figure 22. Crack configuration and loadings for estimating clad correction on stress intensity factors for corner crack at notch.
between the crack front and notch surface (_a =7r/2) because it most closely resembles figure 22(a).However, the application of Gc at other locations isquestionable. To grow a crack in the bare material,point B should be used to evaluate stress intensityfactors. The parametric angle that defines point Bwill vary from 7r/2 when a _ g to _0 = 0 whena > g. The stress intensity factors at point B willalso be greatly reduced because the no-load-carryingclad has a similar effect as on stress intensity factorsat point A. Thus, the 3D stress intensity factors for
a corner crack at the edge of a notch were modifiedby multiplying Ge times the stress intensity factorsolution without the clad (eq. (10)). The corner-crack (boundary and clad) correction becomes FcI =FcGc. Although the cladding correction factor wasderived for the maximum depth location (_o = 7r/2),the same correction was applied at _ = 0 where thecrack front intersects the sheet surface in the claddinglayer. The selection of point C (_a = 0) was madefor convenience because small corner cracks in the
clad material grew in a nearly semicircular (a/c = 1)
23

manner for low a/t and the stress intensity factorsfor this configuration do not vary much with the
parametric angle. (See fig. 20(c).)
5. Large-Crack Experimental Data
Experiments were conducted to determine the
rates of fatigue crack growth on large cracks (>2 mm)at three constant-amplitude stress ratios and the
Mini-TWIST loading sequence. The objective was
to generate data for the two aluminum alloys for a
wide range of rates, especially in the near-thresholdcrack-growth regime. Additional tests were also
conducted on the LC9cs bare alloy to determine the
effect of the cladding on large-crack-growth rates. Allof these tests were conducted on 75-ram-wide CCT
specimens. (See appendix E.) The method by whichthe data were recorded is presented in appendix G.
These data will be used to define the regime in
which large-crack data apply to small cracks and to
establish the baseline data for use in life predictions.The results will be presented as AK against crack-
growth rate.
5.1. Stress Ratio Effects on Large-Crack-Growth Rates
Fatigue crack-growth-rate tests for constant-
amplitude loading on 7075-T6 and LC9cs aluminum
alloy sheets were conducted at R = -1, 0, and 0.5.Tests on the LC9cs bare alloy were conducted at
only R -- 0 and 0.5. At each stress ratio, two types
of tests were conducted: constant-amplitude loading
and threshold (load-shedding) tests.
5.1.1. 7075-T6 Aluminum Alloy
The AK-rate data for large cracks are shown infigure 23 for the 7075-T6 alloy. At all stress ra-
tios, the data from NASA and CAE agreed well, al-
though some slight discrepancies were observed atthe threshold level. The NASA data showed slightly
higher AK thresholds than did the CAE data forR = -1 and 0. The data for R = 0.5 from each
laboratory agreed very well. The data at each of
these stress ratios parallel well with each other. The
data also showed several "knees" or transitions (T1,
T2, and T3) , which are sharp changes in the slope.These transitions occur at nearly the same crack-
growth rate for all stress ratios. References 57 and 58have shown for 7000 series and 2024 aluminum al-
loys, respectively, that these transitions correspond
to loading conditions where the monotonic or cyclic
plane-strain plastic-zone sizes become equal to char-acteristic microstructural fcaturcs such as dispersoid
24
10 -3 " 7075-T6
o NASA
10 -4 " A CAE
R = 0.5
dc/dN, 10 -5-
ram/cycle
10-6 . _,
Jl
I0-7. _ _
T3
-1
T1 Transition
10-8 .... = ........1 5 10
AK, MPo-m 1/2
5O
Figure 23. Crack-growth rate against AK for 7075-T6 alu-minum alloy under various constant-amplitude loading.
spacing, dislocation cells, subgrain size, or grain size.
Wanhill (ref. 58) pointed out that the cyclic plas-tic zone should be calculated with AKeff to account
for closure effects on reverse yielding. References 57
and 58 suggest the following correlations at the tran-sition points:
T1 cyclic plastic-zone size _ mean
planar distance between dispersoids
T2 cyclic plastic-zone size _ subgrainand dislocation cell sizes
T 3 monotonic plastic-zone size _ grainsizes
The transitions are also associated with changes
in fracture surface topography. Between AKth and
T2, the fracture surfaces are faceted. Above T2 a
gradual change to continuum (flat) fracture is char-acterized by fatigue striations. Above T3 the flat
fracture changes to slant crack growth (crack surface
plane is at 45 ° to the loading axis through the thick-ness). The fiat-to-slant crack growth is discussed fur-
ther in section 8. Relationships between monotonic
and cyclic plastic zones and the transitions observed
in the current study are discussed in section 8.
The solid lines were drawn through the datapoints by a visual fit; the points used to define these
lines are given in table V. These lines are comparedwith the small-crack data in section 6.
Figure 24 shows a comparison between the crack-
growth rates generated in the cooperative program
and the results of Hudson (ref. 59) on the samematerial. Wide-ranging stress ratios were tested in

TableV.Large-CrackDataPointsfor7075-T6AluminumAlloy
AK,R Point MPa-m 1/2
-1 1 3.9
2 4.43 11.0
4 15.5
5 40.0
0 1 2.3
2 2.5
3 3.04 5.6
5 8.5
6 24.5
0.5 1 1.4
2 1.43 1.7
4 3.8
5 5.7
6 15.5
Mini-TWIST 1 5.3
2 8.63 35.0
dc/dN,
mm/cycle1.00 x 10 -81.40 x 10 -6
1.20 x 10 -5
1.00 x 10 -41.30 x 10 -3
1.00 x 10 -81.00 x 10 -6
2.00 x 10 -6
9.00 x 10 -6
1.00 x 10 -41.70 x 10 -a
1.00 x 10_8
1.00 x 10 -7
1.20 x 10 -6
8.00 x 10 -68.50 x 10 -5
1.50 x I0 -3
6.00 x 10-s
1.20 x 10⁻⁶
7.40 x 10⁻⁵
10-3
10-4
dc/dN, 10 -5
mm/cycte
10 -6
10-7
10 -8
LC9cs
o CAE
A NASA
R = 0.5
& i
T3-1
T2
T 1 Transition
5 10
AK, MPo-m 1/2
5O
Figure 25. Crack-growth rate against AK for LC9cs aluminumalloy for constant-amplitude loading.
reduce the data. The results of this cooperative
program demonstrate why a calculation of point-to-
point crack-growth rates is preferred more than a
smoothing technique.
I0-I r 7075-T6 " It_ ,_
10-3
dc/dN, 10 -4
"=o.yj.t.y-, ....[ f/S HUrl°s-O; (re,. ,59)
10-6 o 0
&.510--7 v .710 -8
1 10 100
AK, MPa-m 1/2
Figure 24. Crack-growth rate against AK from cooperativeprogram and Hudson's data for 7075-T6 aluminum alloy.
reference 59; these results are shown as symbols
and the results from the cooperative program areshown by the solid lines. Results for R = -1, 0,
and 0.5 agreed quite well with the previous data.
In some cases, the transition in Hudson's data is
not as sharply defined as in the cooperative pro-gram because a smoothing technique was used to
5.1.2. LCgcs Aluminum Alloy
The large-crack z_K-rate data for the LC9cs clad
alloy are shown in figure 25. In calculating AK, thefull specimen thickness was used. The data from the
CAE and NASA laboratories agreed fairly well for
each stress ratio. Again, the NASA data showed
slightly higher AK thresholds than did the CAEdata. The three transitions observed in the data for
the 7075-T6 alloy were also observed in the LC9cs
alloy at about the same rates as measured for the7075-T6 alloy. The solid lines were drawn through
the data points by a visual fit; the points are givenin table VI.
As mentioned, additional tests were conducted on
the LC9cs bare alloy. These results are shown in fig-
ure 26 for R = 0 and 0.5. For comparison, the test
data on the LC9cs alloy, shown in figure 25, were
reanalyzed without the cladding layer in the calcula-
tion of AK (180 #m subtracted from the originalthickness). The effective thickness tp was 93 per-
cent of the original thickness. In the midrate region(10 -6 to 10 -4 mm per cycle), the results from the
two sets of data agreed very well, indicating that
the cladding layer could not carry a significant por-tion of the load. The LC9cs alloy showed somewhat
higher AK thresholds than the LC9cs bare alloy. At
the lower AK values, the cladding layer may carry
enough load to affect the threshold.
25

Table VI. Large-Crack Data Points for LC9cs
Aluminum Alloy
R
-1
0.5
Mini-T%VIST
Point
1
2
3
4
5
6
1
2
3
4
5
1
2
3
4
5
6
1
2
3
AK,
MPa_ml/2
4.0
4.0
4.6
8.7
11.5
36.5
2.4
2.6
5.0
7.0
18.7
1.6
1.7
2.0
3.2
4.5
10.0
6.0
10.0
27.0
dc/dN,
mm/cycle
1.00 x 10 -s
2.00 x 10 -7
2.00 x 10 6
1.00 x 10 .5
4.70 x 10 -5
1.00 x 10 .3
1.00 x 10 -s
1.80 x 10 -6
1.10 x 10 -5
1.00 x 10 -4
1.60 x 10 -3
1.00 x 10 -s
1.00 x 10 .6
2.70 x 10 -6
7.00 x 10 -6
4,60 x 10 -5
7.60 x 10 .4
1.00 x 10 -r
2.50 x 10 6
4.20 x 10 -5
10-3
10-4
dc/dN, 10 -5
rnrn/cycle
10 -6
10-7
10-8
R = 0.5
R=O
#o V
oA LC9cs clad
,, (t'= o.9at)A
av LCgcs bare
. . i | | . . . i
2 5 10
AK, MPa-m 1/2
Figure 26. Crack-growth rate against AK for LC9cs clad and
bare aluminum alloys at two stress ratios.
5.1.3. Comparison of Alloys
A comparison of the AK-rate results for the two
alloys is shown in figure 27. The solid lines show
the fitted lines from the 7075-T6 alloy tests and the
dashed lines show the results from tile LC9cs alloy
tests. The dotted lines show the LC9cs alloy results
10--3
10 -4
dc/dN, 10 -5
turn/cycle
10 -6
10 -7
10-8
1. /.' .'"
__s s s'l'"..s, • ... •
. .' ..'"
R=0.5 " _" _"
,'/,7 ,'/I@. :.Y s.,'J
, Zf( f -I',i lJ t:
I: I:(;i I". I ....Lcgc c,adI;i V I (,.--
lb. t .......5 10 50
AK, MPo-m 1/2
Figure 27. Crack-growth rate against AK for 7075-T6 and
LC9es aluminum alloys for constant-amplitude loading.
based on t p = 0.93t in the calculation of AK. In
the midrate region, the results for the 7075-T6 alloy
and LC9cs bare alloy (with t/) agreed fairly well, but
some significant differences were evident in the AK
thresholds. Even the LC9cs alloy" showed slightly
higher thresholds than the 7075-T6 alloy.
5.2. Large-Crack-Growth Rates for
Mini-TWIST Spectrum
Two types of spectrum crack-growth tests were
conducted on CCT specimens made of 7075-T6 and
LC9cs alloy sheets: constant load Smf and load
shedding. The objective of the load-shedding tests
was to obtain AK-rate data to low stress intensity
factor ranges to compare with the small-crack data.
(Sac sac. 6.6.2.) The constant-mean flight-stress
tests were conducted to obtain data at higher stress
intensity factor ranges and to provide data on crack
length against cycles to verify FASTRAN II. (See
ref. 56.)
5.2.1. 7075-T6 Aluminum Alloy
Figure 28 shows the AK-rate data for the 7075-
T6 alloy. The circular symbols are the results from
load reduction tests and the triangular symbols arc
from the constant load tests. Recall that the AK
values were computed by using the maximum and
minimum stresses in the Mini-TWIST spectrum and
the crack-growth rates generally were calculated by
using the crack extension during one pass through
the spectrum. At the higher rates, this procedure
was not always possible. The results from the two
types of tests agreed well. The solid lines were drawn
26
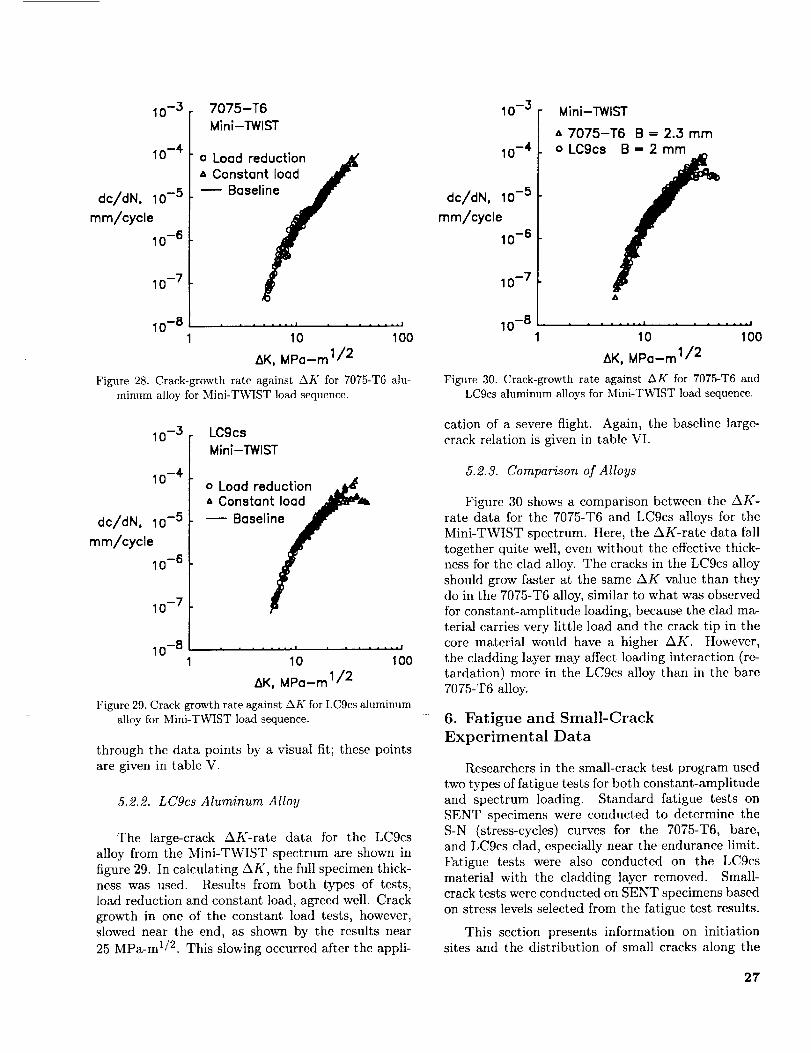
10-3
10-4
dc/dN, 10 -5
ram/cycle
10 -6
10-7
10-8
7075-T6
Mini-TWIST
o Lood reduction =_'= Constant load
w Basel_
| ....... = ........ !
10 100
AK, MPa-m 1/2
Figure 28. Crack-growth rate against AK for 7075-T6 alu-minum alloy for Mini-TWIST load sequence.
10-3
10-4
dc/dN, 10 -5
ram/cycle
10 -6
10 -7
10-8
Mini-TWIST
A7075-T6 B=2.3mm
o LC9cs B=2mm
A
...... t ........ i
1 10 100
&K, MPa-m 1/2
Figure 30. Crack-growth rate against AK for 7075-T6 andLC9cs aluminum alloys for Mini-TWIST load sequence.
10 -3 LC9csMini-TWIST
10-4
dc/dN, 10 -5
ram/cycle
10-6
10 -7
10 -8
o Load reductionA Constant load
m Baseline
, = = = = .i ........ i
10 100
AK, MPa-m 1/2
Figure 29. Crack-growth rate against AK for LC9cs aluminumalloy for Mini-TWIST load sequence.
through the data points by a visual fit; these pointsare given in table V.
5.2.2. LCgcs Aluminum Alloy
The large-crack AK-rate data for the LC9csalloy from the Mini-TWIST spectrum are shown in
figure 29. In calculating AK, the full specimen thick-ness was used. Results from both types of tests,load reduction and constant load, agreed well. Crack
growth in one of the constant load tests, however,slowed near the end, as shown by the results near
25 MPa-m 1/2. This slowing occurred after the appli-
cation of a severe flight. Again, the baseline large-
crack relation is given in table VI.
5.2.3. Comparison of Alloys
Figure 30 shows a comparison between the A/4-rate data for the 7075-T6 and LC9cs alloys for the
Mini-TWIST spectrum. Here, the AK-rate data fall
together quite well, even without the effective thick-
ness for the clad alloy. The cracks in the LC9cs alloy
should grow faster at the same AK value than theydo in the 7075-T6 alloy, similar to what was observed
for constant-amplitude loading, because the clad ma-
terial carries very little load and the crack tip in thecore material would have a higher AK. However,
tile cladding layer may affect loading interaction (re-
tardation) more in the LC9cs alloy than in the bare
7075-T6 alloy.
6. Fatigue and Small-Crack
Experimental Data
Researchers in the small-crack test program used
two types of fatigue tests for both constant-amplitude
and spectrum loading. Standard fatigue tests onSENT specimens were conducted to determine tile
S-N (stress-cycles) curves for the 7075-T6, bare,
and LC9cs clad, especially near the endurance limit.
Fatigue tests were also conducted on the LC9csmaterial with the cladding layer removed. Small-
crack tests were conducted on SENT specimens based
on stress levels selected from the fatigue test results.
This section presents information on initiation
sites and the distribution of small cracks along the
27

boreof the notch for the two alloys. Small-crackdatachartswereusedto recordcracklocationandcracklengthagainstcyclesfromthereplicas.Crack-shapedatawereobtainedfromexaminationof frac-turesurfacesof specimensthat wcrcbrokenearlyinlife.Thesedata,togetherwithacracknoninteractioncriterion,wereusedto determineAK-rate dataforsmallsurfaceandcornercracksat thenotch.Com-parisonsare then madewith large-crackAK-ratedatadiscussedin section5.
6.1. Fatigue Tests
Fatigue life tests were conducted on the SENTspecimens of T075-T6 and LC9cs alloys to aid in the
selection of applied stress levels and replica intervals
for the small-crack-growth-rate tests. These fatiguelife data were also used to assess a total life-prediction
method based solely on crack propagation from ma-
terial microstructural defects or from the cladding
layer. The effects of cladding and the replication pro-cess on fatigue lives were also studied.
6.1.1. Constant-Amplitude Loading
Fatigue life data for constant-amplitude loading
at the three stress ratios are shown in figures 31and 32 for 7075-T6 and LC9cs alloys, respectively.
In those figures, N/ is the cycles to failure at Smax.Solid and open symbols show the results of standardfatigue tests conducted by each laboratory. NASA
was the lead laboratory for the 7075-T6 alloy andCAE was the lead laboratory for the LC9cs alloy.
The results from each laboratory agreed well for both
alloys and all test conditions, although slight differ-
ences were observed for the LC9cs alloy, which ex-
hibited more experimental scatter than the 7075-T6
bare alloy. As usual, an arrow indicates that a testwas terminated before failure at the indicated cy-cles. The stress levels for the small-crack test wereselected from these results and are listed in table IV.
The lowest stress levels were near the endurance limit
but high enough to give failures in about 100 000 cy-cles. The second stress level was selected to give
about 50 000 cycles to failure. Table IV indicates thatthe notch root stresses are elastic for all constant-
amplitude tests except those at R = 0.5.
6.1.2. Mini-TWIST Spectrum Loading
Fatigue test results for the Mini-TWIST loading
sequence are showm in figures 33 and 34 for the7075-T6 and LC9cs alloys, respectively. Fatigue life
is plotted against Smax, which is equal to 2.6Smf
(the highest stress level in the sequence). The solidand open symbols distinguish the results from each
28
250 7075-T6
Sma X,
MPa
200
150
100
[] []
%=d' •lid
gO0o_
A
0 GH,
CAE NASA50 • [] R = 0.5
• o R=O• " R=-I
104 105 106 107
Nf, cycles
Figure 31. Fatigue lives of T075-T6 aluminum alloy at various
stress ratios.
200 LC9cs
150
0
mrll_ D 0
IB 000
n
e,_o
_0
&_.L &
OO
[]
° o0
A
NASA CAE "
O-)
o-)
Smax' 1O0MPo
5O• o R=0.5
• o R=O• & R=-I
I ....... I ........ 1 t ....... I
10 4 105 106 107
Nf, cycles
Figure 32. Fatigue lives of LC9cs aluminum alloy at various
stress ratios.
laboratory; the close clustering reflects the good
agreement between NASA and CAE tests. The stress
levels selected for the small-crack tests are given in
table IV; they wcrc sclccted to give about 0.5 to
2 million cycles to failure. Three stress levels wereselected for the LC9cs alloy because it has a lower
endurance limit than the 7075-T6 alloy. Table IVshows that the notch root stresses are above the yield
stress for the 7075-T6 alloy but are generally elastic
for the LC9cs alloy. However, the cladding layer
yields in all cases. (The estimated yield stress of
the cladding was 50 MPa, as estimated from results
shown in table II.)

300 250
Srrlox,
MPa
200
1O0
0
7075-T6Mini-TWIST
8oeo
CAE NASAl 0
• i • i = i,,] ........ ]
105 106 107
Nf, cycles
Figure 33. Fatigue lives of 7075-T6 aluminum alloy for Mini-
Stag X,
MPa
TWIST load sequence.
300
200
100
OO •
oo
NASA CAE• a
LCgcsMini-TWIST
O0 @
0 0
0
, _ ...... I i ....... I
105 106 107
Nf, cycles
Smax.
MPa
2O0
150
100
5O
[] []
• oo0
0• 0
_@0 @0
[]
LCgcs 7075-T6Bare Bare
• [] R=0.5• o R=O
I:t
0.11_ o-p
O ! I ...... i ....... i ........ I
104 105 106 107
Nf, cycles
Figure 35. Fatigue lives of 7075-T6 and LCgcs bare aluminum
alloys at two stress ratios.
20O
150
Smox' 1O0MPa
5O
%.%B
LCgcsClad Bare
D
--_ 0
........ |
105
R = 0.5R=O
I L ...... i • , = • .... i
104 106 107
Nf, cycles
Figure 34. Fatigue lives of LC9cs aluminum alloy for Mini-
TWIST load sequence. -_
Figure 36. Fatigue lives of LCgcs clad and bare aluminum
alloys at two stress ratios.
6.1.3. Effect of Cladding
Fatigue tests were also conducted on SENT spec-imens of LC9cs bare alloy. The objective of thesetests was to assess the effect of cladding on fatiguelives at R = 0 and 0.5. Figure 35 shows a compari-son of fatigue lives on bare LC9cs and bare 7075-T6alloys. The endurance limits for both alloys were sim-ilar, but the fatigue lives of the LC9cs bare specimensgenerally were shorter than those for the 7075-T6 al-loy. A comparison between LC9cs clad (curves) andbare (symbols) alloys is made in figure 36. Theseresults show that removing the cladding greatly im-
proves the endurance limit. Fatigue lives at higherstress levels also show an improvement.
6.1.4. Effect of Replica Method
Fatigue life data for constant-amplitude andMini-TWIST spectrum loading are shown in fig-ures 37 and 38 for 7075-T6 alloy and in figures 39and 40 for LC9cs alloy, respectively. The open sym-bols are the standard fatigue tests results previouslyshown. These tests were conducted for laboratoryair conditions and were continuously cycled to fail-ure without interruption. The solid symbols denotetests during which replicas were taken.
29

250 7075-T6
Sma x,
MPG
200
150
100
5O
E0 0
nO
0 o •0
o_Q o e
Replica None• a R=05• o R = 0A A R = -1
0-_
b-b
O-P
........ | _ ....... | • • • •••=i!
10# 105 106 107
Nf, cycles
Figure 37, Effect of replica process on fatigue lives of 7075-T6
aluminum alloy for constant-amplitude loading,
Smax,
MPa
250
2OO
150
100
5O
0
7075-T6Mini-TWIST
@ Ills
oce 8-oOo
Replica None• o
• ....... I _ • ..... 1
105 106 107
Nf, cycles
Figure 38. Effect of replica process on fatigue lives of 7075-T6
aluminum alloy for Mini-TWIST load sequence.
The limited results on the 7075-T6 alloy forconstant-amplitude loading (fig. 37) indicated thatthe fatigue lives at R = 0 and -1 were affected bythe replica process. The fatigue lives for R = - 1 werenearly twice as long as the lives for tests without the
replicas. Tests for the Mini-TWIST loading (fig. 38)also showed that the replica process strongly affectsfatigue lives. Here, the fatigue lives were also dou-bled when replicas were taken. To identify the sourceof this effect, four additional tests were undertaken
on this material with the Mini-TWIST spectrum(Smax = 205 MPa). In two tests, the fatigue cycle was
Smax,MPa
200
150
100
50
0104
a LCgcs
o@_ [] []OClO O0
[]
[]0 []
0o_o
_OA_ _ O
OA_ A
&
Replica None A• [] R=0.5• o R=O• * R=-I
, • ...... | • • • • ,,,I
10 5 10 6
Nf, cycles
Figure 39, Effect of replica process on fatigue lives of LC9cs
aluminum alloy for constant-amplitude loading.
Sma x,MPa
250
200
150
100
5O
oe
• oo o •
ooo• o
o0De
Replica None• o
105
LCgcsMinI-TWlST
0 0
o
106 107
Nf, cycles
Figure 40. Effect of replica process on fatigue lives of LC9cs
aluminum alloy for Mini-TV_qST load sequence,
stopped periodically after the same cyclic interval inthe replica tests, and the load was held for 10 min-
utes at the replica load (about 60 percent of Smax);however, no replica was taken. The resulting liveswere slightly less than the lives from the standardfatigue tests at this stress level. For the other twospecimens, the notch root was bathed with the ace-tone solution twice during the 10-minute hold atreplica loading, but no replica was taken. The fa-tigue lives from these tests agreed with those fromthe tests with replicas. Thus, the longer fatigue livesof the replica test specimens are likely attributable to
3O

a chemical effect connected with tile acetone rather_than a purely mechanical effect from holding the
cracked specimens at constant tensile loading or from
rcsidual acetyl cellulose between the crack surfaces.
Whether the longer life is attributable to effects
on initiation or on fatigue crack-growth rates was not
determined in this study. However, Gao, Pao, and
Wei (ref. 60) have shown that higher fatigue crack-growth rates are associated with higher water vapor
pressures. They also found that crack-growth rates
in moist air are greater than those in vacuum, argon,
or oxygen, which they attributed to hydrogen embrit-tlement. Given the sensitivity of the 7075-T6 alloy
to water vapor, the longer fatigue lives after replica-
tion may relate to the introduction of acetone, whichreduced the environmental effects because it dries or
protects the crack front region from the normal mois-ture levels in laboratory air. In the standard fatigue
life tests, a baseline condition of water vapor expo-
sure was established in laboratory air. Tests with
the 10-minute holding time at loading are equally
exposed to laboratory water vapor, which results insimilar fatigue lives. In replica tests or when the
holding time includes bathing the notch root with
acetone, the water vapor concentration at the crack
front may be reduced, thereby slowing crack-growthrates and producing longer fatigue lives.
The replica-effects tests on the LC9cs alloy are
shown in figure 39 for constant-amplitude loading.The limited results here indicate that the replica pro-
ccss did not affect the fatigue lives for this alloy.
Similarly, in extensive tests using the Mini-TWIST
spectrum sequence (fig. 40) no effect of the replicaprocess was evident on fatigue lives. As discussed,
this alloy is nearly identical in composition and
microstructure to the 7075-T6 alloy except for the60-#m cladding layer on each sheet. Because the
fatigue lives for the 7075-T6 alloy were longer be-
cause of the acetone solution, the LCgcs alloy shouldhave shown longer lives. However, cracks in tile
LC9cs specimens initiated from slip bands in the
low-strength ductile cladding and produced predom-
inately corner cracks rather than initiating at inclu-sion particle sites as surface cracks as in the 7075-T6
alloy. (Crack initiation results for the two alloys are
discussed in the next section.) When corner cracks
are prevalent, no consistent difference is evident be-
tween the fatigue lives with or without replicas. Theseeming indifference to the cffects of acetone on fa-
tigue life (and presumably crack-growth rates) mayrelate to the corner-crack configuration. Because
replication is performed on only one surface (notch
root), the corner-crack front is exposed to the water
vapor environment through the crack surface that in-tersects the side of the specimen.
Because the plastic replicas had an effect on the
fatigue life of the 7075-T6 alloy and presumably on
small-crack growth, the small-crack rates in the co-
operative program may not reflect the true behavior
of small cracks for laboratory air conditions. There-
fore, analyses and comparisons based on these datashould be viewed with caution. Fortunately, the
replica method did not affect the fatigue life of LCgcs
specimens because of corner-crack growth. Here, the
complex interaction of the cladding on stress inten-
sity factors may be evaluated without concern forreplica effects.
6.2. Initiation Sites and Distributions forSmall Cracks
A study of small cracks must invariably in-volve consideration of the surface and subsurface
microstructure of the material. In the following sec-tions, the initiation of cracks at microstructural de-
fects, discontinuities, or cladding is discussed. Sur-face replicas taken early in lifc were used to locate
where cracks initiated and to identify the microstruc-
tural feature that caused those cracks. Broken spec-
imens were then used to identify the types of cracks(surface or corner) and their shapes.
Photomicrographs of sections along the notch-
root surface and crack-surface plane for the 7075-
T6 and LC9cs alloys are shov, na in figures 41(a)
and 41(b), respectively. These photomicrographs
show inclusion particles in the bare (or core) ma-terial and the grain structure. Cracks that initiate
along the notch surface will grow as either surface orcorner cracks. Crack growth along the bore of the
notch will be in the 2a-direction and crack growth
away from the notch will be in the c-direction. The
grain structure and inclusion-particle clusters of bothalloys are elongated in the c-direction. The notch-
surface planes in figures 41(c) and 41(d) show a sim-ilar pancake microstructure as do the crack-surface
planes. Figure 41(d) also shows the cladding layer
in the as-received condition. Chemical polishing ofthe SENT specimens reduced the cladding layer to
50 70 #m.
6.2.I.7075-T6 Aluminum Alloy
A typical initiation site along the bore of the
notch in the 7075-T6 alloy is shown in figure 42.This series of photomicrographs from surface replicas
shows a surface crack initiating and growing from a
pit, which may have been caused by the removal of
31

¢-
OI..
N-
O
Crack growth (2a)
(a) 7075-T6 crack plane.(b) LCgcs crack plane.
Cladding Core(c) 7075-T6 notch root.
(d) LC9cs notch root.
L-93-50
Figure 41. Photomicrographs of sections along crack-surface plane and notch root surface for the two aluminum alloys.
32

"8
"d
"8
o_
"a
I'-.-
b
.o
o_
£oo
o
0
33

an inclusion-particle cluster during the machining or
polishing process, ttere, the initial defect void size
was surprisingly large, about 30 pm. A crack was
observed to initiate at the void at about 17 percent ofthe total fatigue life. These photomicrographs show
the progression of the crack for most of the life of
the specimen. For the 7075-T6 alloy, crack initiation
generally occurred early in life at inclusion-particleclusters or voids, similar to the crack initiations
observed by Bowles and Schijve. (See ref. 61.)
Seven broken specimens were examined to iden-
tify the size of the inclusion-particle cluster or void
that initiated the crack. Ill the SEM photomicro-
graphs shown in figure 43, a specimen is shownthat had two initiation sites along the bore of the
notch. From this examination, the material defect
size ranged from 4 to 8 pm in the 2a-direction (along
the notch root) and from 6 to 18 pm in the c-direction
(away from the notch). (Note that these ranges donot include the unusually large void that is shown
in fig. 42.) However, the defect sizes should be com-pared with the inclusion-particle sizes shown in fig-ure 6. The defects that were sufficient to initiate sur-
face cracks are at the upper portion of the particle
size distributions. This outcomc is expected because
of the small volume of material used to generate the
distribution chart. Thus, the initiation site shouldoccur at one of the largest inclusion-particle sites or
voids along or near the notch surface. Prom these re-
sults an initial defect (or crack size) 2ai = 6 pm was
selected and tile initial crack length was c i = 9 #mto characterize the most probable initial defect.
6.2.2. LC9cs Aluminum Alloy
The initiation sites in the LC9cs alloy were nearly
always in the cladding layer as shown in figure 44.
This series of photomicrographs (again from surface
replicas) shows slip bands and cracks in the cladding
layer and cracks growing in tile bare material. In
figure 44, a crack was observed at about 17 percentof the life required to grow the crack across the full
sheet thickness. Although this particular specimen
broke in monotonic loading when the corner-cracklength was equal to sheet thickness (breakthrough),
the total fatigue life would have been only about
20 percent longer than the life to breakthrough. In
the LC9cs alloy, cracks were also observed to initiate
early in life, similar to the life in 7075-T6 alloy, even
though they initiated in the cladding layer and grew
predominately as corner cracks. The significanccof the cladding layer on fatigue in aluminum alloys
has been known for many years. (See ref. 62.)
However, the analysis methods have only recently
34
been developed to analyze corner-crack growth andcrack closure.
Some SEM photomicrographs of broken LC9csspecimens are shown in figure 45. These photographs
show a corner crack that initiated in the cladding
(fig. 45(a)) and a rare occurrence of a surface crack
that initiated at a large void along the bore of the
notch. (See fig. 45(b).) For these crack sizes, notethat tile crack fronts are ncarIy circular (a/c = 1 to
1.1). A detailed discussion on crack shapes is givenin section 6.3.
6.2.3. Comparison of Alloys
A comparison of data on crack-initiation sites for
the two alloys is shown in figure 46, which has aninsert that shows a cross section of the notch root.
The crack-initiation site, denoted t,i_ is measuredfrom the centerline of the specimen thickness. Half
the sheet thickness is denoted t. When t i = 0, the
crack initiated at the specimen centerline; but when
t i = t, the crack initiated at the corner of the notchand specimen surface. The information on initiationsite locations was obtained from the small-crack data
charts made from plastic replicas taken early in life.Each specimen data chart documented one to five
crack-initiation sites along the notch root. The
cooperative program requirements were such that thefive largest cracks were monitored from initiation to
breakthrough (L = B). Because multiple cracks weremore likely at the high stress levels than at the low
stress levels, the low stress levels in the test programwere selected as slightly higher than the endurance
(fatigue) limit.
The initiation-site information from NASA and
CAE was analyzed together. The distribution of
initiation sites along the bore of the notch for nearly
65 cracks is plotted in figure 46. The number of
cracks that initiated in each of i0 separate regionsalong the notch-root surface is plotted in relation to
the ratio ti/t. Each region is defined as 10 percent of
the specimen thickness.
For the 7075-T6 alloy, most of the cracks initiatedat ti/t < 0.5 (middle half of specimen thickness)
and grew as semielliptical surface cracks. Crackinitiation in the middle of the notch root is promoted
by an elevation of stress concentration in this region.The stress concentration factor at the notch is about
5 percent higher in the middle of the specimen than
on the edge of the notch. (Sec ref. 38.) With the
edges of tile notch polished and deburred, the mostlikely location for crack initiation would be near the
center of the specimen thickness. Therefore, for smallcracks in the 7075-T6 alloy, modeling the crack as a

0.5 mm 0.2 mmI I I I
_: Crack 1 ..... Crack 2 Crack2 _
Crack 1 _ilCrack2 ,_
Figure 43. 7075-T6 aluminum alloy surface-crack initiation sites.
L-93-52
30t_m ;!----I
(a) 5000 cycles. (b) 8000 cycles. (c) 14 000 cycles.L-93-53
Figure 44. Photomicrographs of surface replicas showing initiation site in cladding and crack-growth history in LC9cs aluminum
alloy. Cracks grew across thickness (L = B) in 28 000 cycles.
35

f Cladding301_m
(a) Corner-crack initiation site in cladding.
0.5 mmi I
(b) Surface-crack initiation site at inclusion-particle void.
Figure 45. LC9cs aluminum aI]oy crack:initiation sites.
L_93'54
36

Centerline
Cracks
35
30
25
20
15
10
5
7075-T6
00.0 0.2 0.4 0.6
tilt
-q!
LCgcs
I
0.8 1.0
Figure 46. Distribution of crack-initiation sites along bore of
notch for 7075-T6 and LC9cs aluminum alloys.
1.5n
[]
boo 0 0....... o-o"_°°_d_ °13-- ----____EL.__
-- -- 0 0 [] _'_n O_[]
10 - n .L• _ - 0 0 0 0 0
0 [] 0 0 0
a/c o
o Surface crack 7075-T6
0.5 []Corner crack LC9cs
_,_ Clad • Materialdefect(bare)layer
-- Equation (I)
-- Equation (2)
0.0 ' ' ' '0.0 0.2 0.4 0.6 0.8
a/t
Figure 47. Surface- and corner-crack shapes and sizes for the
two aluminum alloys.
defect that grows along the specimen centerline isa reasonable assumption. Multiple crack initiationsand interactions were not considered in the coopera-tive program.
For the LC9cs alloy, more than 90 percent of thecracks initiated at the corner (ti/t = 1) and grew asquarter-elliptical corner cracks. Therefore, a cornercrack was assumed in the analyses of small cracks inthe clad alloy. Multiple crack initiations and inter-actions were not considered. In a few cases, a crackdid initiate at the surface in the LC9cs alloy. Thesefew surface crack results provcd useful in assessmentsof cladding-layer effects on stress intensity factors.(See secs. 4.5.3 and 8.5.2.)
6.3. Small-Crack Shapes for Two Alloys
To calculate stress intensity factors for a surfaceor corner crack at the notch, crack dimensions a andc, must be known. The replica method was usedto monitor crack length in the a-direction as a func-tion of cycles. For information about crack growth inthe c-direction, some specimens were pulled to failure(monotonic loading) at various stages during theirlives. (See figs. 43 and 45.) Figure 47 shows the vari-ation of a/c with a/t for naturally initiated cracks.The surface-crack data were obtained from the 7075-
T6 alloy, whereas the corner-crack data were ob-tained from the LC9cs alloy.
In the 7075-T6 alloy, surface cracks initiated atinclusion-particle clusters or voids at or near thenotch surface. The solid symbols show the materialdefects where cracks initiated in the bare alloy. Thesedefects ranged from a/t = 0.002 to 0.004. Theinitial crack size selected to characterize the initial
material defect (ai = 3 /_m and ci = 9 pm) wasan average of these defect sizes. For a/t < 0.05,very little information was obtained on experimentalcrack shapes. However, very early in life, the cracksin both alloys generally grew in a nearly semicircular(a/c= 1) shape. However, the cracks grew morealong the bore of the notch than away from the notch(a/c> l) as, they deepened (larger a/t).
In the LC9cs alloy, corner cracks initiated fromslip bands in the cladding layer very early in life.Figure 44 shows the cracks in these slip bands andthe progression of crack growth into the core mate-rial. Again, very little information was obtained fora/t < 0.03. Corner cracks generally grew more alongthe bore of the notch than did surface cracks, as ev-idenced by the generally larger a/c ratio.
The solid and dashed lines in figure 47 showequations that were visually fitted to these data--equation (1) for surface cracks and equation (2)for corner cracks. These equations were used tocalculate c from (a or 2a) measurements made in thecooperative test program.
37

10.5 mm
7
L-93-55Figure 48. Surface replicas on notch root for 7075-T6 alloy with single and multiple surface cracks.
6.4. Crack Length Against Cycles forSmall Cracks 0.3
Small-crack growth along the bore of the notch
was measured by the plastic-replica method. Cracklength against cycles was then recorded on data
charts. (See appendix G.) Examples of replicas
and typical crack-growth data are presented in thefollowing sections.
6.4.1. 7075-T6 Aluminum Alloy
Figure 48 shows photomicrographs of surface
replicas on the notch root for the 7075-T6 alloy.These examples show both single and multiple cracks
along the notch surface. A plot of crack length
against cycles for small cracks in constant-amplitude
loading (R = -1; Smax = 95 MPa) is shown infigure 49. Tile tests at R = -1 were selected be-
cause small-crack effects are more pronounced forthese conditions. The solid and dashed curves show
test results from NASA and CAE, respectively, which
agreed very well. Growth of naturally initiatedcracks was detected early in life after about 5000
to 15000 cycles. At these cycles, L = 5 to 15 #m.
Although these particular tests were terminated af-
L, mm
0.2
0.1
0.0 l
0 100
7075-T6 iI
!
Sma x = 95 MPa I t'/I I/
R = - 1 / I /I II I
-- NASA ) ' ] '/
-- ! .,' :/
20 40 60 80
N x 10 -3, cycles
Figure 49. Experimental crack length against cycles for small
cracks in 7075-T6 aluminum alloy.
ter the cracks grew across the sheet thickness, fa-
tigue tests at these conditions (replica effects, fig. 37)
would have lasted about 150000 cycles. Thus, the
38

I I0.5 mrn
L-93-56
Figure 50. Surface replicas of notch root for LC9cs aluminum alloy with single and multiple corner cracks.
initiation phase, that is, the cycles before a crack
was detected, was only about 3 to 10 percent of the
total fatigue life.
6.4.2. LC9cs Aluminum Alloy
Corner-crack growth in the LC9cs alloy is shown
in photomicrographs of surface replicas in figure 50.Single and multiple cracks also developed along the
edges of the notch. A plot of crack length against
cycles for small cracks at R = - 1 and Smax = 90 MPa
is shown in figure 51. The solid and dashed curvesshow test results from CAE and NASA, respectively.
Here, also, the results from each laboratory agreed
well. As mentioned, the clad alloy exhibited more
scatter in fatigue life than did the 7075-T6 alloy;the scatter may account for the differences at about
20 000 cycles. Growth from naturally initiated cracks
in the cladding also was detected early in life. Crack
growth was recorded as early as 1000 cycles, butmost initiated at about 4000 cycles. At these cycles,
however, the cracks were from 60 to 100 #m long.
Fatigue tests in these conditions (fig. 39) would have
lasted about 40 000 cycles. Thus, the initiation phasefor the clad alloy was also about 3 to 10 percent of
the total fatigue life.
6.5. Small-Crack-Growth Noninteraction
Criteria
As shown, multiple cracks did initiate in manytests. Because the development of multiple-crack
stress intensity factor solutions was beyond the scope
of this study, a small-crack noninteracting criterionwas used. Application of this criterion permitted re-
searchers to reject data when the stress fields of mul-
tiple cracks may have interacted. The approach wassimilar to the procedures developed in reference 19
but was modified for nonaligned multiple cracks. Fig-
ure 52 illustrates a simple system for rejecting crack-
growth rates wherein such interactions could occur.
Four cases were considered when data are rejected:
I. When cracks are on nearly the same path with
each other (such as cracks 1 and 2, fig. 52(a)) and
when the distance dl, 2 is less than the length ofthe largest crack L1, then subsequent data from
crack L 2 are rejected. When dl,2 between theadjacent crack tips is less than the length of the
smaller crack L2, then subsequent data from L1
are rejected. Here, the crack tips are expected to
approach each other, so the rate of growth of eachwould accelerate.
39
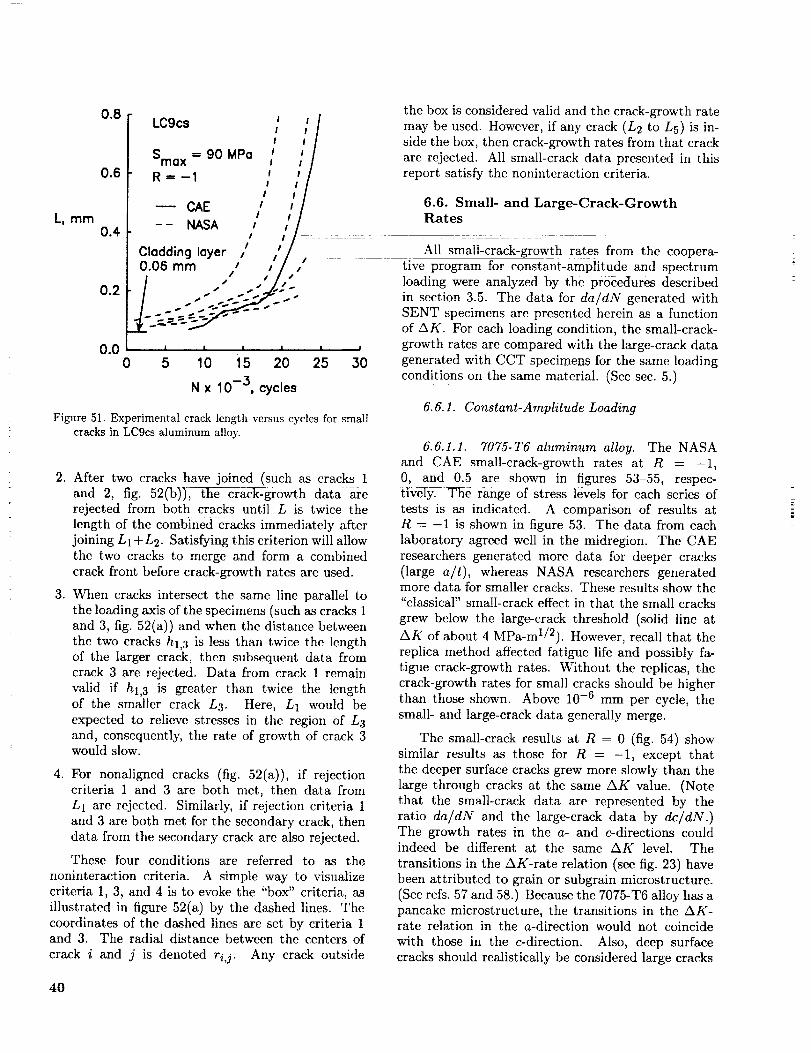
LI mm
0.8
0.6
0.4
0.2
0.0
LC9cs / //
' ,/t !Sma× -- 90 MPa _ _
R=-I l //I /
-- CAE i i/
- - NASA / // .......
Cladding layer i t //
0.06 mm / // /
-_=_= ....
1 I I I • ]
0 5 10 i 5 20 25 30
N x 10 -3, cycles
Figure 51. Experimental crack length versus cycles for small
cracks in LC9cs aluminum alloy.
. After two cracks have joined (such as cracks 1and 2, fig. 52(b)), the crack-growth data arerejected from both cracks until L is twice the
the box is considered valid and the crack-growth rate
may be used. However, if any crack (L2 to L5) is in-
side the box, then crack-growth rates from that crack
are rejected. All small-crack data presented in thisreport satisfy the noninteraction criteria.
6.6. Small- and Large-Crack-GrowthRates
All small-crack-growth rates from the coopera-
tive program for constant-amplitude and spectrum
loading were analyzed by the procedures described
in section 3.5. The data for da/dN generated withSENT specimens are presented herein as a function
of AK. For each loading condition, the small-crack-
growth rates are compared with the large-crack data
generated with CCT specimens for the same loading
conditions on the same material. (See sec. 5.)
6. 6.1. Constant-Amplitude Loading
6. 6.1.1. ?0'75- T6 aluminum alloy. The NASA
and CAE small-crack-growth rates at R = -1,
0, and 0.5 are shown in figures 53-55, respec-tively. T_ne range of stress levels for each series of
tests is as indicated. A comparison of results atlength of the comb_ne_ cracks immediately after R -1 is Shown in figure 53. The data from each
joining L1 +L2. Satisfying this criterion will allow
the two cracks to merge and form a combined
crack front before crack-growth rates are used.
3. When cracks intersect the same line parallel to
the loading axis of the specimens (such as cracks land 3, fig. 52(a)) and when the distance between
the two cracks h],3 is less than twice the lengthof the larger crack, then subsequent data fromcrack 3 are rejected. Data from crack 1 remain
valid if hi,3 is greater than twice the lengthof the smaller crack L 3. Here, L 1 would be
expected to relieve stresses in the region of L 3and, consequently, the rate of growth of crack 3would slow.
4. For nonaligned cracks (fig. 52(a)), if rejectioncriteria 1 and 3 are both met, then data from
L1 are rejected. Similarly, if rejection criteria 1
and 3 are both met for the secondary crack, thendata from the secondary crack are also rejected.
These four conditions are referred to as the
noninteraction criteria. A simple way to visualizecriteria 1, 3, and 4 is to evoke the "box" criteria, as
illustrated in figure 52(a) by the dashed lines. The
coordinates of the dashed lines are set by criteria 1and 3. The radial distance between the centers of
crack i and j is denoted ri,j. Any crack outside
laboratory agreed well in the midregion. The CAE
researchers generated more data for deeper cracks
(large a/t), whereas NASA researchers generatedmore data for smaller cracks. These results show the
"classical" small-crack effect in that the small cracks
grew below the large-crack threshold (solid line at
AK of about 4 MPa-mU2). However, recall that the
replica method affected fatigue life and possibly fa-
tigue crack-growth rates. Without the replicas, the
crack-growth rates for small cracks should be higherthan those shown. Above 10 -6 mm per cycle, the
small- and large-crack data generally merge.
The small-crack results at R = 0 (fig. 54) show
similar results as those for R = -1, except that
the deeper surface cracks grew more slowly than the
large through cracks at the same AK value. (Notethat the small-crack data are represented by the
ratio da/dN and the large-crack data by dc/dN.)The growth rates in the a- and c-directions couldindeed be different at the same AK level. The
transitions in the AK-rate relation (see fig. 23) havebeen attributed to grain or subgrain microstructure.
(See refs. 57 and 58.) Because the 7075-T6 alloy has apancake microstructure, the transitions in the AK-rate relation in the a-direction would not coincide
with those in the c-direction. Also, deep surface
cracks should realistically be considered large cracks
4O

I L4L__ __ Ls
h1'3 ',' ,
Combined crack front
/ ._ "- -- "" _. \
_ L = 2 (L 1 + L2) "
(a) Multiple surface cracks at notch root. (b) Interacting surface cracks for d],2 = 0 (sec. A-A).
Figure 52. Definition of crack noninteraction criteria for crack coalescence and crack shadowing.
10-3
10-4
da/dN, 10 -5
ram/cycle10 -6
10 -7
10-8 .....0.5 1
7075-T6
R = -1
ta
o &
°°i_ ck:i r o NASA
A CAE
o -- Large crack
(dc/dN)
. _._ ......5 10 50
AK, MPa-m 1/2
Figure 53. Small surface crack (Smax = 80 95 MPa) andlarge through crack growth rates against AK for 7075-T6 aluminum alloy for R = -1.
in the a-direction because they are more than 0.5 mm
long and crack closure stresses have stabilized at the
large-crack steady-state values. (See sec. 7.)
Small-crack results for R --- 0.5 are shown in
figure 55. Results from the two laboratories show
good agreement for the measured range of rates.Here, the small cracks grew only slightly below the
large-crack threshold (1.4 MPa-ml/2). Also, da/dN
at the higher rates was lower than dc/dN at the sameAK value. These data also support the conclusionthat the AK-rate relations in the a- and c-directions
are different. At R = 0.5, crack closure becomes less
10-3
10-4
da/dN, 10 -5
turn/cycle
10 .6
10-7
10 -80.5
R 0 /=o
AI_ A
oAel_ * Surface crock:
aM=_ A CAE
o°_ n Large crack
.....:I.......!°oi°,>1 5 10 50
AK, MPa-m 1/2
Figure 54. Small surface crack (Smax = 120 140 MPa) andlarge through crack growth rates against AK for 7075-T6aluminum alloy for R = 0.
an issue (cracks are nearly fully open) and AK .._
AKeff. These data were used to help establish the
AKeff-rate relation in the a-direction. A detaileddiscussion of effective stress intensity factors is in
section 8.2.
6.6.1.2. LC9cs aluminum alloy. In the small-
crack tests on the LC9cs alloy, primarily corner
cracks were produced. These cracks were initiated by
slip-band formation in the cladding layers very earlyin life. Because the yield stress of the cladding is only
about 10 percent that of the bare alloy, the stress dis-tribution at the corner of the notch is complex in that
41

10-3
10-4
do/dN. 10 -5
ram/cycle
t0-6
10 -7
10-80.5
7075-T6R - 0.5
o j_rfoce crock:
oNAsA
o °7ill • ........ | ....
1 5 10 50
&K, MPo-m 1/2
do/dN,
ram/cycle
10-,3
10 -4
10-5
10-6
10-7
LC9cs
o[][]
oo
Smo x= 180MPoR=0.5
o Surface crock (o' = o)[] Corner crock
(a' = o - 0.06 mrn)
= i , I / I
0 .2 .4 .6 .8 1
o', mm
Figure 55. Small surface crack (Smax = 195 220 MPa) andlarge through crack growth rates against AK for 7075-T6aluminum alloy for R = 0.5.
Figure 57. Crack-growth rate against crack length for surfacecrack in LC9cs bare and corner crack length minus cladthickness in LC9cs clad alloy.
10-3
10 -4
do/dN. 10-5
mr'n/cycle
10-6
LC9cs
[][]
13
Smo x = 180 MPo
R=0.5
B o Surface crock[] Corner crack
10 -7 (_ .2 .4 .6 .8 ;
o, mm
Figure 56. Crack-growth rate against crack length for surfacecrack in LC9cs bare and corner crack in LC9cs clad alloy.
the cladding yields and the core material carries most
of the load. To calculate the effect of the cladding on
stress intensity factors, a 3D finite-element analysis
would be required. In lieu of such an analysis, an
engineering estimate was used to develop a simplecorrection to the stress intensity factors for a cor-
ner crack. (See sec. 4.5.3.) The correction assumes
that the cladding layer does not carry any load. The
data generated in the small-crack test program will
be used to evaluate this simple hypothesis.
As mentioned, several tests on the SENT speci-
mens produced a surface crack along the bore of the
notch instead of a corner crack. These results were
used to help assess the effect of the cladding layer on
crack-growth rates and, consequently, on stress inten-
sity factors. Figure 56 shows crack depth a plottedagainst da/dN for a surface crack and a corner crack
growing in the core LC9cs alloy. At a givcn crack
length, the corner crack grew at a much lower ratethan the surface crack. Because these results were de-
termined from a high stress ratio test (R = 0.5) and
at the same maximum stress level (180 MPa), crack
closure is not an issue. The results in figure 56 have
been replotted in figure 57, but the average cladding-layer thickness (60 #m) has been subtracted from
the crack length in the a-direction. Here, the results
of crack length against growth rate for surface andcorner cracks agree quite well and indicate that the
cladding does not affect the rate of crack growth in
the core material. Thus, the cladding layer may be
assumed not to carry any load in the stress intensityfactor calculations.
To show how well the clad correction (modifica-
tion of the stress intensity factors) does in correlatingsmall-crack data, the data at R = 0.5 are analyzed
with no clad correction, then the data are analyzed
with the simple clad correction. The small-crack data
for R = -1 and 0 are analyzed with only the clad
correction to the stress intensity factor solutions.
Figure 58 shows the results for small surface
and corner cracks at R = 0.5. Stress intensityfactors were calculated with the measured value of
a, the calculated c from equations (1) or (2), and theequations in appendix D. The open symbols show
the data for corner cracks and the solid symbols
42

10-3
10-4
da/dN, 10 -5
ram/cycle
10 -6
10 -7
10 -80.5
LC9cs
R = 0.5
1
10-3
10--4"
Corner crack: 10 -5o CAE da/dN,
- NASA mm/cycle
Surface crack: 10 -6
• CAE• NASA
Large crack 10 -7
(dc/dN)
...... i ....
5 10 50
AK, MPa-m 1/2
Figure 58. Small crack (Sm_ = 165 to 180 MPa) and large-crack-growth rates against AK with no clad correctionfor small cracks in LC9cs aluminum alloy for R = 0.5.
10-3
10 -4
da/dN, 10-5
mm/cycle
10 -6
10 -7
10-8 .....0.5 1
LCgcs /R = 0.5 /_
a
&
_ Comer crack:* ._IIX o C_,AE
o •• • • Surface crack:
b
• • CAE• NASA
Large crack
(dc/dN)• ....... = . . .
5 10 50
&K, MPa-rn 1/2
Figure 59. Small crack (Smax = 165 to 180 MPa) and large-crack-growth rates against AK with clad correction forsmall cracks in LC9cs aluminum alloy for R = 0.5.
show them for the surface cracks. Again, da/dN
may not be the same as dc/dN at the higher rates,as discussed for the 7075-T6 alloy. However, the
two sets of data separate sharply for rates below10 -5 mm per cycle. Below this point the surface-
crack data agree well with those for large cracks in
that same region. The corner-crack data do not agreewith either the surface- or large-crack data at the
lower rates. The high R data for corner cracks were
reanalyzed with the clad correction; the results are
10-8 .... ,0.5 1
LCgcs
R=-I
• • •A
&
o
o
Comer crock:
o CAE
-,NASA
Large crock
(dc/dN)
..... | ....
5 10 50
AK, MPa-m 1/2
Figure 60. Sntall corner crack (Smax = 70 to 90 MPa) andlarge-crack-growth rates against AK with clad correctionfor small corner cracks in LC9cs aluminum alloy for
R=-I.
10-3
10-4
da/dN, 10 -5
mm/cycle
10-6
10-7
10 -80.5
LCgcs
R=O
Corner crack:o CAE
A • •A4 •NASASurface crack:
• NASA
Large crack
(dc/dN)
1 5 10 50
AK, MPa-m 1/2
Figure 61. Small crack (Srnax = 100 to 115 MPa) and large-crack-growth rates against AK with clad correction forsmall cracks in LC9cs alumimlm alloy for R = 0.
shown in figure 59. -The corner-crack results now
agree quite well with those for surface cracks overthe range of measured rates. They also agree with
the large-crack data at the lower rates. These resultsshow the effectiveness of the simple clad correction
for corner-crack stress intensity factors.
The results of CAE and NASA small-crack tests
on the LC9cs alloy SENT specimens at R = -1 and0 with the clad correction are shown in figures 60
and 61, respectively• Again, the data from each lab-
oratory agreed well. The data in figure 60 show
43

morescatterin thelowerregionthanthecorrespond-ing plot for the 7075-T6alloy. (Seefig. 53.) How-ever,the mostnoticeabledifferenceis the shapeofthe AK-rate results at AK values below the large-
crack threshold (vertical solid line). In the LC9cs
alloy, the crack-growth rates at AK values below the
large-crack threshold were much higher than thosemeasured for the 7075-T6 alloy. Of course, some of
this difference may have been a result of the replica
process on the 7075-T6 alloy small-crack data. An-
other source of difference may be the crack sizes. The
data for the 7075-T6 alloy were generated at muchsmaller crack sizes than for the LC9cs alloy. The
crack sizes in the 7075-T6 alloy ranged from 5 to
100 ttm, whereas those in the clad material ranged
from 80 to 300 #m. The shape of the AKeff-rate
curve in the region of lower rates and different crack-closure transients may also be responsible for some
of these differences. A detailed analysis of these data
with the crack-closure model is given in section 8.
Figure 61 shows the results of small surface andcorner cracks for R = 0 constant-amplitude loading
conditions. The solid and open symbols show the
data for surface and corner cracks, respectively. Inthe midrate region, all surface-, corner-, and through-
crack data agreed quite well. The SENT speci-
men data on large corner cracks also support the
conclusion that da/dN is different from dc/dN at
a given A K.
6.6.2. Mini-TWIST Spectrum Loading
6.6.2.1. 7075-T6 aluminum alloy. A plot of
AK against rate for small surface cracks for the
Mini-TWIST spectrum loading is shown in figure 62.For this assessment, AK is calculated with the high-
est and lowest stresses in the spectrum sequence.
Also, the crack-growth rates are the average ones
for about 30 000 cycles. The NASA and CAE data
agreed very well. Here, the small-crack results also
agreed with the large-crack data. However, this
agreement may have been fortuitous because thereplica method significantly affected the fatigue life
for Mini-TWIST loading. (See fig. 38.) Thus, themeasured rates for small cracks may be too low for a
given value of AK.
6.6.2.2. LC9cs aluminum alloy. Small-crackrates for corner cracks in the LC9cs alloy for Mini-
TWIST spectrum loading are shown in figure 63.
Again, AK is calculated with the highest and loweststresses in the spectrum, but the cladding correctionis also used. The CAE and NASA data for this case
did not agree except at the higher rates. As expected,the small cracks in the clad alloy grew faster than the
44
10-4
10-5
da/dN, 10-6
mm/cycle
10-7
10 -8
10 -g
7075-T6MTnT-'I'WIST
(_ o
AA Surface crack:o NASA
A CAE
-- Large crack
(dc/dN)
O . .| . =|
10 100
&l<,MPa-m 1/2
Figure 62. Small surface crack (Smax = 190 to 208 MPa) andlarge through crack-growth rates against AK for 7075-T6aluminum alloy for Mini-TV_rIST load sequence.
10-4"
10-5
10-6da/dN,
mm/cycle 10_ 7
10 -8
10-9
LC9cs
Mini-TWIST
#O A
OA
O0
Corner crack:A f@- CAE
A4= A A NASAAA
Large crack
(dc/dN)
....... | ........ i
10 100
_J<, MPa-m 1/2
Figure 63. Small corner crack (Smax = 125 to 270 MPa) andlarge through crack-growth rates against AK with cladcorrection for small corner cracks in LC9cs aluminum
alloy for Mini-TWIST load sequence.
large cracks at a given AK value in the region of lowrates.
7. Crack-Closure Model for Small and
Large Cracks
Numerous investigators have suggested (refs. 5-
11) and verified (refs. 8, 19, and 63) that crack clo-
sure (ref. 22) (or lack of closure in the early stages of
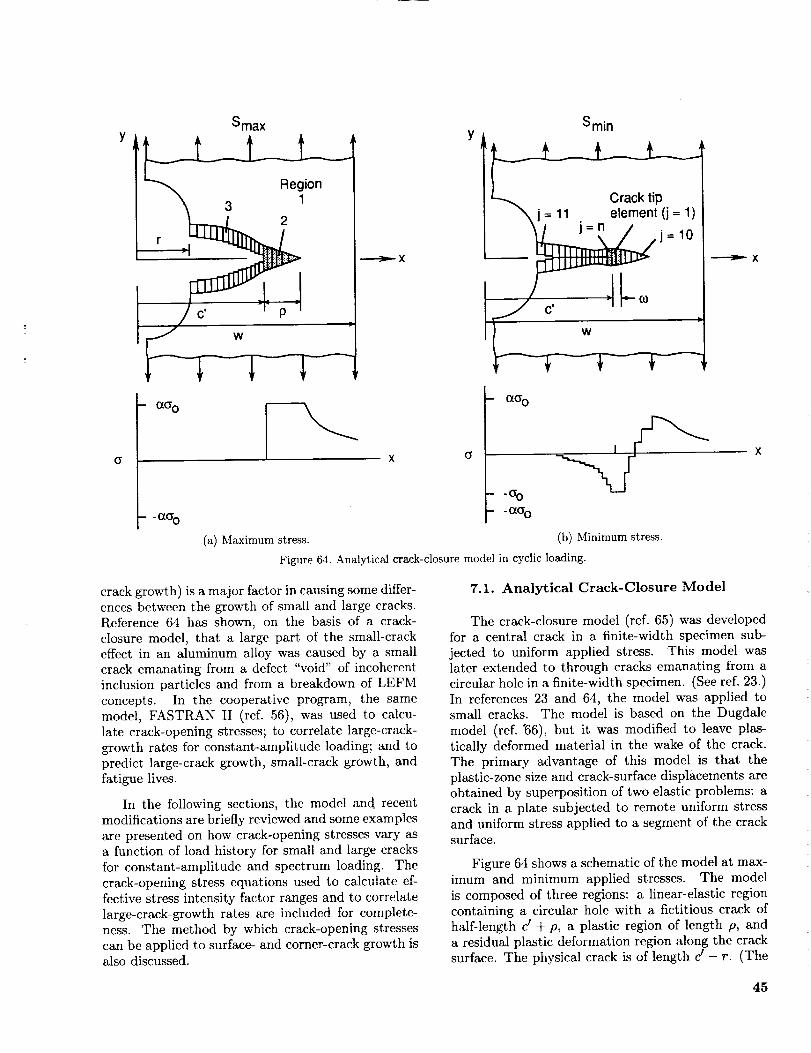
YSmax
Region
3 2 1
- a%
_x
- _a_ o
(a) Maximum stress.
Smin
I j=n j =10
(b) Minimum stress.
Figure 64. Analytical crack-closure model in cyclic loading.
--'-}"- X
crack growth) is a major factor in causing some differ-
ences between the growth of small and large cracks.Reference 64 has shown, on the basis of a crack-
closure model, that a large part of the small-crack
effect in an aluminum alloy was caused by a smallcrack emanating from a defect "void" of incoherent
inclusion particles and from a breakdown of LEFM
concepts. In the cooperative program, the same
model, FASTRAN II (ref. 56), was used to calcu-late crack-opening stresses; to correlate large-crack-
growth rates for constant-amplitude loading; and topredict large-crack growth, small-crack growth, and
fatigue lives.
In the following sections, the model and recent
modifications are briefly reviewed and some examples
are presented on how crack-opening stresses vary asa function of load history for small and large cracks
for constant-amplitude and spectrum loading. The
crack-opening stress equations used to calculate ef-
fective stress intensity factor ranges and to correlate
large-crack-growth rates are included for complete-ness. The method by which crack-opening stresses
can be applied to surface- and corner-crack growth isalso discussed.
7.1. Analytical Crack-Closure Model
The crack-closure model (ref. 65) was developedfor a central crack in a finite-width specimen sub-
jected to uniform applied stress. This model waslater extended to through cracks emanating from acircular hole in a finite-width specimen. (See ref. 23.)
In references 23 and 64, the model was applied to
small cracks. The model is based on the Dugdale
model (ref. "66), but it was modified to leave plas-tically deformed material in the wake of the crack.
The primary advantage of this model is that the
plastic-zone size and crack-surface displacements areobtained by superposition of two elastic problems: a
crack in a plate subjected to remote uniform stressand uniform stress applied to a segment of the crack
surface.
Figure 64 shows a schematic of the model at max-imum and minimum applied stresses. The model
is composed of three regions: a linear-elastic regioncontaining a circular hole with a fictitious crack of
half-length cr + p, a plastic region of length p, and
a residual plastic deformation region along the cracksurface. The physical crack is of length cr - r. (The
45

modelwasalsoassumedhereinto applyfor a crackemanatingfromasemicircularnotch.)Thecompres-siveplasticzoneis w. Region 1 is treated as an
elastic continuum. Regions 2 and 3 are composed
of rigid, perfectly plastic (constant stress) bar ele-ments with a flow stress no, which is the average
of the yield stress (ays) and the ultimate strength(au). The shaded regions in figures 64(a) and 64(b)
indicate material that is in a plastic state. At anyapplied stress level, the bar elements are either in-
tact (in the plastic zone) or broken (residual plastic
deformation). To account for the effects of state of
stress on plastic-zone size, a constraint factor a wasused to elevate the tensile flow stress for the intact
elements in the plastic zone. The effective flow stress
aCro for simulated plane-stress conditions is ao (usual
Dugdale model) and for simulated plane-strain con-ditions is 3Cro. The value of 3Cro was established from
elastic-plastic finite-element analyses for plane-strain
conditions with an elastic, perfectly plastic mate-
rial (normal stress elevation in the crack-tip region
was about 2.7 from the analysis). The use of themodified Dugdalc model for plane-strain conditionsis a matter of convenience because the shape of the
yield zone for plane-strain conditions is very differ-
ent from that used in the strip-yield model. How-
ever, the calculated crack-opening stresses for these
conditions agree well with finite-element calculationsfor plane-strain conditions (ref. 67); that is, stabi-
lized So/Smax _ 0.2. At the minimum applied stress,
some elements in the plastic zone and elements alongthe crack surfaces that arc in contact may yield in
compression when the contact or compressive stress
reaches -no. This assumption was justified because
when a crack closes, tile large stress gradient at the
crack tip is greatly reduced (loss of constraint) anda more uniform stress field is produced.
For thin-sheet alloy, full plane-strain conditions
are not possible. Irwin (ref. 68) suggested accountingfor through-the-thickness variation in stress state
by introducing a constraint factor (a = 1.73) to
represent nominal plane-strain conditions. For thin-
sheet 2024-T3 aluminum alloy (ref. 19), c_ = 1.73correlated crack-growth rate results for various stress
ratios and gave crack-opening stresses that agreed
with measurements. (See ref. 69.)
The closure model is used to calculate the ap-plied stress level at which the crack surfaces fully
open as a function of crack length and load history.
This stress is denoted the crack-opening stress. The
crack-opening stress calculated for a through crack
was also assumed to apply along a surface- or corner-crack front. Special modifications are required whenthe crack front intersects a free surface. The crack-
opening stress is then used to calculate AKeff. (See
ref. 22.) In turn, the crack-growth rate is calculated
from AKeff-against-crack-growth-rate relation deter-mined from large-crack data.
7.2. Crack-Opening Stresses From Model
The method used in the original closure model to
calculate crack-opening stresses (So) assumed that
the rate of crack growth was small compared with
crack length. (Sec ref. 65.) In proof tests or severe
spectrum loading, however, crack-growth incrementsmay be large compared with crack length. There-
fore, the closure model was modified. (See ref. 70.)The contact stress intensity factor equation for cal-
culating crack-opening stress (eq. (27) in ref. 65) waschanged to
SIo = &in- fi 2o'2 (arcsin B2- arcsin B1)j (15)7r
j=ll
where
sin (_.)B k= (fork= 1 or 2) (16)
sin (_ud,)
The modification changed _the upper limit of the
summation in equation (15) from n - I to n to reflectthe change in formulation from the crack length
before growth to actual or current crack length.
The prime denotes the modified crack-opening stress.The index j refers to elements along the crack surface
that are used to model plastic and residual-plastic
deformations, as shown in figure 64(b). The cracklength c_ is the sum of the hole radius plus all of the
elements from j = 11 to n. Dimension bk denotes thedistance to an edge of an element and the width of
an element is b2 - bl. Specimen width w is measured
from the specimen centerline or edge. Element 1 isthe first intact element at the crack tip. Elements 1
to 10 are always ahead of the current crack tip and
model the plastic zone p. The intact elements in the
plastic zone may carry tensile stresses to aao andcompressive stresses to -no. Elements 11 to n are
along the crack surface between the initial notch and
the current crack tip.
In the physical model, the crack was extended by
the width of the nth element at the maximum ap-
plied stress. (See ref. 65.) The physical crack exten-sion and width of the nth element were denoted Ac*.
In the revised model, the total width of the nth ele-
ment was not used in the computation of the crack-
opening stress from equation (15). The elementwidth wn in the crack-opening stress calculations was
46

thelargestcrack-growthincrementduringthegener-ationof Ac*. Forlowfatiguecrack-growthrates,urn
was generally very small compared with Ac* and was
neglected in the original model. But for proof testingor severe loading, Wn may be a large percentage of
Ac*. For proof tests, wT_ is equal to Ac*, the amount
of crack extension during proof loading. Thus, thecontribution of the crack-extension increment to sub-
sequent crack-opening stresses is accounted for in thenew calculations. At the minimum applied stress, el-
ements along the crack surface that are in contact
carry rrd, the element contact stress; otherwise, theelement stress is zero. Elements in the plastic zone
carry either tensile or compressive stresses and may
yield in compression if _rj is less than -_r o. For
low fatigue crack-growth rates, Sro calculated from
equation (15) is nearly equal to So calculated from
the equation developed in reference 71. However,for large-crack-growth increments (high crack-growth
rates), S_o from equation (15) is now a function ofcrack extension. See reference 70 for further details
on this modification.
Z2.1. Constant-Amplitude Loading
In the following section, the crack-closure model
is used to calculate crack-opening stresses for vari-
ous constant-amplitude loading and constraint con-ditions. First, the model is used to demonstrate theeffect of the initial defect void size on crack-closure
behavior of small fatigue cracks emanating from
these voids. Next, the effects of a and R on small-crack-closure behavior are shown.
Previous studies (refs. 23 and 64) have indicated
that small-crack effects are more pronounced at neg-
ative stress ratios and for plane-stress conditions.Typical results of calculated Sro, normalized by the
maximum applied stress as a function of a, are shown
in figure 65. The crack-growth simulation was per-formed at R = -1 with the constraint factor of unity
(plane stress). The value Smax/_ro = 0.15 was used in
the simulation. In bare aluminum alloys, cracks havebeen found to initiate at inclusion-particle clusters
or voids left when these particles are removed during
machining or polishing processes. An initial mate-
rial defect (void or crack) with sizes ai = 3 #m andci = 9 gm was selected for crack-growth simulationsl
The defect-void half-height b was selected as either
0 or 0.5 #m. The 0.5-#m value was selected so thattile initial defect surfaces would not close even for
R = -1 compressive loading. These calculations are
shown as the lower solid curve in figure 65. As the
crack grows, however, the newly created crack sur-faces close and the crack-opening stresses rapidly rise
and level off at the steady-state (large-crack) opening
[_1
A
_A_._LA_
2a i
Section A-A
2a i
1.0
0.5
!
So 0.0
Smax
-0.5
-1.0
T Smax/O'o = 0.15R=-I
Z_Seff a = 1
Sma x a i = 3 p,mb = 0 I c i p,m
................. my.m.gy.o-.}.h.
lb °s , m ,20 40 60
a,/_m
Figure 65. Calculated crack-opening stresses for various defectvoid heights as function of crack length for small crack.
stress value. A minimum crack-growth rate occurs at
c -_. 19 pro. This behavior was caused by the rapidrise in crack-opening stresses. Initially, the small
crack was fully open and AKeff = AK. However,
as the crack grew, the rapid rise in the crack-opening
stresses reduced Ah_fr, thereby also reducing crack-growth rates. However, as the crack-opening stresses
began to stabilize, the rise in the stress intensity
factor with longer crack lengths caused a reversal in
the growth rate trend.
For a crack that initiates at a tight cluster of
inclusion particles or voids, b may be nearly equal
to zero. In figure 65, the defect surfaces do contactduring compressive loading and the contacting sur-
faces greatly affect the amount of residual plastic de-
formation left behind as the crack grows. The calcu-lated crack-opening stresses quickly stabilize at the
steady-state large-crack value, as shown by the up-
per solid curve. These results suggest that the small-
crack effect, at least in relation to crack closure, is a
microcrack effect (a < 20 to 40 #m).
The effect of constraint on closure of small cracks
is shown in figure 66, in which the constraint factor
47

a varies from plane-stress conditions (a = 1) to sim-
ulated plane-strain conditions (a = 3). In all cases,
the initial crack-opening stress is at the minimum ap-plied stress and rapidly rises as the crack grows. The
initial response is nearly independent of (_, but the
stabilized values for large cracks are different; again,
the crack-closure stresses stabilize for a > 40 #m.
For thin-sheet aluminum alloys, a = 1.7 to 1.9
correlates crack-growth rates as a function of the ef-fective stress intensity factor range below the tran-
sition from fiat-to-slant crack growth. (See refs. 64
and 65.) The effect of R on calculated crack-opening
stresses is shown in figure 67 for a = 1.8. The par-
ticular values of Smax/ao used in the simulationsare as indicated. As previously shown, the nega-
tive stress ratio simulation shows a significant crack-
closure transient. However, at positive stress ratios,
the crack-opening stresses stabilize after a smalleramount of crack growth. The results at R = 0.5
show that the crack surfaces were always fully open.
These results are important because the AK valuesfor high R conditions are the same as the Ah_ff val-
ues, and tests with these conditions can help establish
the AKeff-rate relation for the material of interest.Tests at the lower stress ratios are then used to help
determine the proper constraint factor to correlate
the crack-growth rates as a function of AKeff.
7. 2.2. Mini- TWIST Spectrum Loading
In the cooperative test program, the Mini-
TWIST loading sequence was used for both small-
and large-crack tests. One of the most important fea-tures of the crack-closure model and life-prediction
program (ref. 56) is the ability to calculate the effectof loading history on crack-opening stresses. Typi-
cal crack-opening stresses for the Mini-TWIST load-
ing sequence for a small surface crack in the SENTspecimens and for a large crack in the center-crack
specimens are presented in the following sections.
7.2.2.1. Small crack. In the small-crack simula-
tion, the same initial defect-void size (ai, c/, b) was
used as for the constant-amplitude loading cases. Avariable-constraint option was selected for this sim-
ulation. (See refs. 56 and 64.) Thus, a -- 1.8 forcrack-growth rates less than 7 x 10 -4 mm per cy-cle and 1.2 for rates greater than 7 × 10 -3 mm per
cycle. (See sec. 8, "Fatigue Crack-Growth Rate and
Life Prediction.") The mean flight stress in the Mini-TWIST spectrum was 73 MPa (Sma× = 190 MPa).
Figure 68 shows crack-opening stress (normalized by
the peak stress in the spectrum) as a function of the
ratio of applied cycles N to iV/ (Nf _ 800 000 cyclesfor these particular conditions). Only a part of the
48
1.0
0.5
I
So 0.0 .o,
Smox o i
-0.5 I"
d
-1.0 '_0
a=l
_2
Smox/_ro = 0.15
// R'::I
f/ °i= 3
b = 0.5 l_m
| i !
20 40 60
O, _m
Figure 66. Calculated crack-opening stresses for various con-straint factors as function of crack length for small crack.
1.0 [ Smox/ao
E = o.5.___3_5o.51 R= 0._ 0.25
.ooolZf ..............., o_-
-0.5 I" / ai= 3 p,m
/ ci=g
-1.00 20 40 60
o, u,m
Figure 67. Calculated crack-opening strcsscs for variousconstant-amplitude loadings as function of crack lengthfor small crack.
opening stresses calculated from the model is shown
in the figure. These results show that the openingstresses start near the minimum stress in the spec-
trum and rise as the crack grows. Crack-opening
stresses generally level off at N/N/= 0.6 to 0.9. The
Sro/Sma.xrapid jump in for N/NI _ 0.92 is caused bythe change in constraint from 1.8 to 1.2 during higher
crack-growth rates. Incidentally, the surface crack
became a through crack (a/t = 1) at N/N/ _ 0.9.
7.2.2.2. Large crack. Two objectives in the
test program were to test CCT specimens with the

Mini-TWISTloadingsequenceto obtainlarge-crackdata that couldbe comparedwith thoseof smallcracksand to compareexperimentalandpredictedcracklengthagainstcyclesbasedonthecrack-closuremodel.In the latter case,theCCT specimenswerefatigueprecrackedat R = 0 from an initial sawcutnotch an to a predetermined ci; then the specimen
underwent spectrum loading until failure. The max-
imum precracking stress was 50 percent of Smax in
the spectrum.
Figure 69 shows some calculations from the model
during both fatigue precracking and spectrum load-
ing. Again, the crack-opening stresses have been nor-malized by Smax. From ci to about 20 mm, the crack-
opening stresses oscillate about a mean value. The
constraint factor during most of these calculationswas 1.8. Beyond about 20 mm, the constraint fac-
tor was 1.2 rather that 1.8 and higher crack-openingstresses were calculated. A drop in crack-opening
stresses was calculated for ci approaching w. The
specimen failed when the crack length was about90 percent of the specimen width.
7.3. Crack-Opening Stress Equations
Crack-opening stress equations for constant-amplitude loading were developed to facilitate the
determination of AKeff-against-crack-growth-rate
relations for a given material, thickness, and envi-ronmental conditions. (Scc ref. 71.) These equa-
tions were developed from calculations made in the
original model. However, because the method of
calculating crack-opening stresses was modified toaccount for extreme crack-growth conditions, these
equations have been modified. In the following sec-
tions, the original crack-opening stress equations andtheir modifications are presented. These equationsare used in section 8 to correlate fatigue crack-
growth rates for constant-amplitude loading condi-tions. Because the crack-closure model gives crack-
opening stresses for only 2D crack configurations(plane-stress or simulated plane-strain conditions),further modifications have also been developed for
surface- and corner-crack growth to account for vari-
ations in opening stresses along the crack front.
7.3.1. Constant-Amplitude Loading
The original crack-opening stress equations devel-
oped in reference 71 are presented here for complete-
ness. These equations were developed by fitting tothe calculated results from the closure model for a
CCT specimen. Note that the crack-opening stresswas calculated from equation (15) where n is replaced
1.0
0.5
!
S O
Snnax
0.0
Mini-TWIST 7075-T6
Smf = 73 MPa _ Prediction
a i--3/_nn a= 1.8to 1.2
c i = 9/_m
b = O.5_m
olt= i
-0.5 ' ' ' ' '0.0 0.2 0.4 0.6 0.8 1.0
N/Nf
Figure 68. Calculated crack-opening stresses for small crackin 7075-T6 alloy for Mini-TWIST load sequence as ratioof applied to failure cycles.
0.6 Mini-TWIST LC9cs
Smf = 34.5 MPo _ Prediction0.5 a= 1.Sto 1.2
0.4
S_ 0.3
Smox
0.2
ff0.I w
i°i' l0.0 ' ' '
0 I 0 30 40
I
2O
c, I'TII'TI
Figure 69. Calculated crack-opening stresses for large crack inLC9cs alloy for constant-amplitude precracking and Mini-TWIST load sequence.
by n - 1 (original formulation). The equations were
given by
So _ Ao+A1R+A2R2+A3R3 (for R >_ 0) (17)Sm_x
and
So-Ao+A1R (forR<0) (18)
SII]&X
where R = Smin/Smax, Smax < 0.Sao, Stain > -ao,
So = Smin if So/Smax is less than R, and So/Smax = 0
49

if So/Smax is negative. The Ai coefficients are func-
tions of cr and Smax/_o and are given by
Ao = (0.825 - 0.34_ + 0.05_2)/cos--/k 2ao ]
Al (0.415 - 0.071c_) S .... FGo
A2 1 - Ao - A1 - A3
A3 = 2Ao + .41 - 1
(19)
for c_ = 1 to 3. The boundary-correction factor F
was added to these equations later to account for the
effect of finite width on crack-opening stresses. (See
ref. 70.)
7.3.2. Extreme Crack-Growth Rates
A modification to correct the original crack-
opening stress equations for large-crack-growth ex-tensions or rates was developed in reference 70. As
discussed, a portion of the nth element was included
in the calculation of crack-opening stress. (See
eq. (15).) In the closure model analysis, the nth cle-ment always carried -ao during unloading; the con-
tribution of this element to the crack-opening stresswas cstinlated as follows. An approximate equation
for $1o for constant-amplitude loading was derived
from stress intensity factors for a crack in an infinite
plate based on the assumption that the contact stressdistribution was linear. The assumed contact stress
distribution along the crack surfaces varied from -aoat the crack tip to zero at the end of the contact re-
gion. The modification to correct the crack-opening
stress equation is given by
SIo = So + 0.3ao F_ for Smax )-- < 0.6 (20)O- o
where Ac is the crack-growth increment (or rate per
one cycle). The boundary-correction factor F was
again "added to account for the effect of finite width.The quantity So is calculated from equations (17)-
(19). Comparisons with the model (ref. 70) showed
that equation (20) was reasonably accurate for a
range of constant-amplitude loading conditions inwhich Smax/_ro < 0.6. The difference between SIo and
So was significant (greater than a 2-percent effect oncrack-opening stresses) only for growth rates greater
than about 10 .2 mm per cycle. For Smax/(ro > 0.6,
the crack-opening stresses should be obtained from
the FASTRAN II code (ref. 56) by conducting an
analysis of the test specimen.
50
7.3.3. Surface- and Corner-Crack Growth
Early studies on crack growth predictions of
semielliptical surface cracks demonstrated thatsurface-crack growth cannot be predicted solely by
stress intensity factor ranges. (See refs. 72 and 73.)
For R = 0 loading, small semicircular surface cracks
grow in a self-similar fashion, although the stress in-
tensity factor at the frec surface is about 10 percenthigher than the value at the maximum depth for low
values of a/t. To account for this difference, Newman
and Raju (ref. 72) multiplied the stress intensity fac-
tor range at the free surface by 0.9 and Jolles and
Tortorietlo (ref. 73) used 0.91. This factor wins re-lated to the crack-closure differences at the two loca-
tions. Assuming that crack closure at the free surface
was plane stress and at the maximum depth locationwas plane strain, a crack-closure factor ratio _R was
derived and is given by
/3R = 0.9 + 0.2R 2 - 0.1R 4 (21)
for R > 0 and 3 R = 0.9 for R < 0. Therefore, forsurface cracks, AK at the intersection of the crack
front with the free surface is multiplied by fTR. How-
ever, for corner cracks, the stress intensity factorsat the locations where the crack front intersects the
free surface and the hole or notch surface arc both
multiplied by _R.
8. Fatigue Crack-Growth Rate and LifePrediction
In the following sections, the experimental data
on small and large cracks in the two aluminum al-
loys are summarized and compared with calculationsor predictions from a AK-based analysis and the
crack-closure model. First, the crack-growth rates
for large cracks and for constant-amplitude loading
are correlated by use of AKeff calculated from theclosure model. Similarly, the AKeff:rate relation for
cracks growing in the sheet thickness direction is
established. The large-crack AKeff-rate relation isthen used to predict crack growth for Mini-TWIST
spectrum loading. The small-crack data on initia-
tion sites, shapes, length against cycles, and rates
for both constant-amplitude and Mini-TWIST spec-
trum loading are reviewed and compared with pre-dictions from the crack-closure model. Finally, a to-
tal fatigue life-prediction method is verified from the
AKeff-rate relations and the information obtainedon small-crack initiation sites at material microstruc-
tural defects (inclusion particles or voids) and at slip-band locations in the cladding layer.

8.1. Correlation of Large-Crack-GrowthRates
To use the crack-closure model and life-prediction
code, FASTRAN II (ref. 56), an effective stress inten-
sity factor range against crack-growth rate relationmust be obtained for the material, thickness, and en-
vironmental conditioDs of interest. The growth rates
of large cracks for constant-amplitude loading andlaboratory air were correlated against AKeff with
equations developed from the crack-closure model.
(See sec. 7.3.) The following section describes how
the AKeff-rate relation was obtained from the large-crack data.
Center-crack tension specimens were used to ob-
tain crack-growth rates for large cracks (c > 2 mm)
in the 7075-T6 and LC9cs aluminum alloy sheets.Tests were conducted for R = -1 to 0.5. In the
past, the spread in tile AKeff-rate results as a func-tion of R, as shown in figures 23 and 25, has beenused to estimate a for the closure model. The con-
straint factor is selected by trial and error to collapse
the data onto a nearly single curve of AKef f against
rate. From past analyses on several aluminum a!!oys
(refs. 64 and 65), a = 1.7 to 1.9 has been shown tocorrelate constant-amplitude data for a wide range
in rates. The effective stress intensity factor (ref. 22)
is given by
S /
1- _ (22)AKeff = Kmax - K_ = AK 1 - R
where Kto is the stress intensity factor at thecrack-opening stress and Sto was calculated from
equations (17) (20).
8.1.1. 7075-T6 Aluminum Alloy
The AKeff-rate relation for 7075-T6 alloy is
shown in figure 70 for R = -1, 0, and 0.5. Thedata correlated quite well onto a nearly single curve
with several transitions in slope at about the samerate for all stress ratios. Some differences were ob-
served in the threshold regime, however. For thesecalculations, a = 1.2 was used for rates greater than
7 × 10 -3 mm per cycle (end of transition from flat-
to-slant crack growth), and a = 1.8 (nearly equiva-
lent to Irwin's plane-strain condition) was used forrates lower than 7 × 10 -4 mm per cycle (beginning
of transition from fiat-to-slant crack growth). For
intermediate rates, a was varied linearly with the
logarithm of crack-growth rate. The solid symbolsdenote measured rates at the transition from flat-
to-slant crack growth from the cooperative program
10-1[ 7075-T6 j
I j .ram/cycle 10_ 5
I _ NASA/CAE baseline
1o-6 -- E !imotedI ,'__ Tronsition rate"
10 -7 I- l_ll • Present study (R = 0)
10_8 _1)
0.5 1 5 10 50
AKef f, MPa-m 1/2
Figure 70. Effective stress intensity factor range against crack-growth rates for large cracks in 7075-T6 aluminum alloyfor various stress ratios.
Fatigue surface
Crack /Tensile front- I_-..mode
Sh..rn_e c I
Figure 71. Transition from tensile to shear mode fatigue cracksurfaces.
and from Vogelesang (ref. 74). (See illustration in
fig. 71.) Schijve (ref. 75) has shown that the transi-tion from fiat-to-slant crack growth occurs at nearly
the same rate for a range of stress ratios. Newman,
Swain, and Phillips (ref. 64) have proposed that theflat-to-slant crack-growth transition region may be
used to indicate a change from nearly plane-strain to
plane-stress behavior and, consequently, to indicate a
change in constraint. The importance of the variable-
constraint option is shown later in crack-growth
predictions made for the Mini-TWIST spectrum
loading.
In the low crack-growth rate regime near and
at the threshold, some tests (ref. 24) and analyses
51

1O- 1 7075-T6 _1_
/10-2 a-- 1.2 _L
10 -3 a -- 1.8 -i- _ Hudson
(ref.59)
m m/cycle - 110-5 [] 0
10 -6 / " 0.7
. *0.8
,/ bos .,,n,10-8 ................
0.5 1 5 10 50
&Keff, MPo-m 1/2
Figure 72. Effective stress intensity factor range against crack-growth rate from cooperative program and Hudson's datafor 7075-T6 aluminum alloy.
10-1
10-2
10-3
dc/dN, 10 -4
mm/cycle 10_ 5
10-6
10 -7
10-80.5
Ro-1[] 0• 0.5
-- CAE/NASA baseline-- Estimoted
1 5 10 50
&Keff, MPo-m 1//2
Figure 73. Effective stress intensity factor range against crack-growth rates for large cracks in LC9cs aluminum alloy forvarious stress ratios.
(ref. 23) have indicated that the threshold devel-ops because of a rise in crack-opening stresses at-
tributable to the load-shedding procedure. If a risein crack-closure behavior does occur in the thresh-
old regime, then the actual AKeff-rate results would
lie at lower values of AKeff because the rise in
crack-opening stresses has not been accounted for in
the crack-closure model analysis. Further study is
needed, however, to establish the actual AKeff-rate
behavior in this regime. The solid lines shown in
figure 70 were drawn to fit dc/dN results; they are
52
used later to compare with da/dN results generated
in the sheet thickness direction. The da/dN datafrom small cracks arc then used to help establish the
&Neff-rate relation in the a-direction.
Figure 72 shows a comparison of large-crack
(dc/dN) AKeff-rate results from the cooperative pro-
gram (baseline) with data obtained from Hudson(ref. 59) for a larger range of stress ratios than that
used in the cooperative program. Although Hudson
used a CCT specimen that was four times wider than
the one used in the cooperative program, the datacorrelated reasonably well with the baseline relation
except in the high crack-growth-rate regime. In this
region, a plasticity-corrected AKeff may bc required
to correlate these data. (See ref. 70.) Herein, onlythe elastic stress intensity factors are used.
8.1.2. LC9cs Aluminum Alloy
The AKeff-rate results for the clad alloy are
shown in figure 73. Again, the data for R = -1, 0,and 0.5 correlated quite well onto a single curve. Asbefore, some differences were observed in the thresh-
old region. For these calculations, the same variable-
constraint regime that was selected for the 7075-T6
alloy was also used for the LC9cs alloy. A compar-ison of the baseline curves for 7075-T6 and LC9cs
alloys showed similar trends, with the transitions inslope occurring at about the same rates. Therefore,
the upper portion of the data for the 7075-T6 alloywas used to estimate the upper portion for the LC9cs
alloy.
8.2. Effective Stress Intensity FactorRelations for Small Cracks
The surface-crack data from the small-crack test
program produced data in the a-direction. Becausethe crack-opening behavior of small cracks stabilizes
after a small amount of crack growth (about 40 #m
for the tests in which R = -1, see fig. 67), these data
may be used to help establish effective stress intensityfactor relations in the a-direction. Based on a similar
AKeff analysis to the one discussed for cracks grow-
ing in the c-direction, baseline curves were developed
for cracks growing in the a-direction. Comparisons
among predictions made with these baseline curvesand experimental data are made later.
8.2.1. 7075-T6 Aluminum Alloy
The large-crack baseline results for dc/dN
(fig. 70) are shown in figure 74 as the solid lines.As mentioned, the data for rates less than about
1.0 × 10 6 mm per cycle (point A) may be affected by
closure due to the load-shedding procedure (refs. 23

da dc
dN dN
mm/cycle
10-1 7075-T6 /.."
1o-2 _L== 1.2 /."
lo-3 .8//10 -4 T(= = 1
/- -- Large crack10-5 . /B (dc/dN)
10 .6 A K .... Large crack• ,'/ (do-ldN)
10 -7 / / -- Small crack
,!/ .... T(',"andO.5 1 5 10 5O
AKef f, MPa-m 1/2
Figure 74. Effective stress intensity factor range against crackgrowth for small and large cracks in a- and c-directionsfor 7075-T6 aluminum alloy.
10-1 LCgce /.."/,
,o-2 2_= - ,.2 /-.
lO-3 To= /d.__o,d__.q,10 -4dN dN
/-" -- Large crack0-5 _ B (dc/dN)ram/cycle I
A// .... Large crock10-6 '-I (do/dN)
10-7 / / -- Small crack
/ / (da/dN and dc/dN)10-81 ...................
0.5 1 5 10 50
AKef f, MPa-m 1/2
Figure 75, Effective stress intensity factor range against crack-growth for small and large cracks in a- and c-directionsfor LC9cs aluminum alloy.
and 24), which is not accounted for in the crack-
opening stress equations. (See eqs. (17) and (18).)Thus, the AKeff values for steady-state large-crack
growth may be lower than those shown by the solidline. Further study is needed to resolve the issuesassociated with threshold behavior. The dashed line
near point A is an estimate for steady-state da/dN
and dc/dN behavior. This estimate was foun d bytrial and error to fit the endurance-limit behavior
from fatigue tests (shown later). An evaluation ofthese AKeff-rate relations is made later for both
small-crack growth and fatigue-life predictions.
Beyond 1.0 x 10 -5 mm per cycle (point B) da/dN
results (dotted line) deviated from dc/dN results
(solid lines). This deviation is expected because a
crack growing in the a-direction grows through a
much different grain structure (see fig. 41) than one
growing in the c-direction. (See refs. 56 and 57.) The
upper portion of the da/dN relation (dotted line) wasassumed parallel to dc/dN, and the final change in
slope was assumed to occur at the same rate.
Instead of an equation to relate crack-growth rate
to AKeff, a table lookup procedure was chosen. The
primary advantage of a table is that the baseline
data can be described more accurately than witha multiparameter equation, especially in fitting the
transitional regions. Multilinear segments were used
to define the baseline AKeff-rate relations in the a-and c-directions. These relations were then used in
the analyses to predict small- and large-crack-growth
rates and fatigue lives for constant-amplitude and
spectrum loading. The end points of these segmentsare listed below:
AKe_ , dc/dN, da/dN,
MPa-m 1/2 m/cycle m/cycle0.9
1.253.0
4.0
10.012.4
14.8
23.0
28.4
1.0x 10⁻¹¹
1.0x 10⁻⁹
1.0x I0-8
6.3 x i0-s
1.0x 10 -6
1.0 x 10-51.0 x 10-4
1.0 x 10 -1]
1.0 x 10 -9
1.0 x 10 -8
1.0 x 10 -6
1.0 x 10 -4
For values below or above the extremes listed in the
above table, a power law that employed the first
or last two points, respectively, was used to obtainrates. The upper limit for the power-law relation is,
of course, defined by fracture toughness, which was
50 MPa-m 1/2. A lower limit or small-crack threshold
(AKeff)tb was estimated to be 0.9 MPa-m 1/2 on the
basis of the fatigue limits predicted in section 8.6.
8.2.2. LC9cs Aluminum Alloy
The dc/dN baseline data for the LC9cs alloy
(fig. 73) is shown in figure 75 as the solid lines.Cracks in the core of the LC9cs alloy exhibit quite
similar effects as those observed for the 7075-T6 alloy.
The steady-state large-crack AKeff-rate relation inboth the a- and c-directions was assumed to be the
dashed line near point A. Again, this behavior wasfound by trial and error but was closely modeled after
53

thedatafor the7075-T6alloy.Evaluationsof theseAheff-raterelationsaremadelater in comparisonsbetweenexperimentaland calculatedsmall-crack-growthratesandfatigue-lifepredictions.
Beyond1.0 x 10-5 mmpercycle(point B), theda/dN results (dotted line) again differed from the
dc/dN results (solid lines). The upper portions of the
da/dN and dc/dN relations were assumed parallel to
the dc/dN relation for the 7075-T6 alloy.
Linear segments in figure 75 that define the base-line AKeff-rate relations in the a- and c-directions
were used in all subsequent analyses. These relations
were used to predict small- and large-crack-growth
rates and fatigue lives. The end points of these seg-ments are listed below:
0.9
1.25
3.45.2
11.9
14.8
17.6
27.534.0
de/dN,
m/cycle1.0 x 10-u
1.0 x i0 9
1.0 x 10 -81.0 x 10-7
1.0 × 10 6
1.0 x 10⁻⁵
1.0 x 10⁻⁴
da/dN,
m/cycle1.0 x 10-u
1.0 x 10- 9
1.0 x 10 -8
1.0 x 10 -6
1.0 x 10⁻⁴
Again, for values below or above the extremes listed
in the above table, a power law that employed thefirst or last two points, respectively, was used to
obtain rates. The upper limit is defined by the
fracture toughness, which was also 50 MPa-m 1/2.
The (/kKeff)t h was estimated to be 0.9 MPa-m 1/2
based on fatigue limits predicted in section 8.6.
8.3. Prediction of Large-Crack Growth
Several tests in the cooperative program wcrc
conducted on CCT specimens to monitor large-crackgrowth for the Mini-TWIST loading spectrum. For
these tests, a constant-amplitude precracking stress
(R = 0 and OOmax = 1.3Smf) was used to grow a crack
from the starter notch until a crack half-length hadreached about 6 ram. At that point, the spectrum
was applied until the specimen failed. These testswere used to evaluate the crack-closure model and
life-prediction code (ref. 56) on large-crack growth.
8.3.1. 7075-T6 Aluminum Alloy
Five tests were conducted on the 7075-T6 alloy
at three different Smf levels. These test results are
54
c, mm
35
30
25
20
15
10
5
00
7075-T6 Test
[] d
I i I ,}
1 2 3 4
N x 10 -6, cycles
Figure 76. Experimental and predicted crack length againstcycles for large cracks in 7075-T6 aluminum alloy for Mini-TWIST load sequence with constant constraint factor.
shown in figure 76. To illustrate the importanceof the variable-constraint option for spectrum crack
growth in aluminum alloys, the first set of predic-tions was made with a constant constraint factor
(a = 1.8). The solid curves show the predictions; the
predicted results for the two lowest Smf levels werewithin -t-20 percent of the test results. However, the
predicted cycles to failure for the highest Smf casewere considerably less than the test results, but the
predicted results using the variable-constraint option
a = 1.8 to 1.2, as showm in figure 77, agreed well with
all of the test results (within 4-20 percent).
8.3.2. LCgcs Aluminum Alloy
Figure 78 shows the test results for five specimensmade of LC9cs alloy. Here, only two Smf levels were
tested. Once again, variable a was used to predict
crack length against cycles. Because the initial cracksizes for the low Smf tests varied, the smallest and
largest initial crack sizes were used in the predictions.
Although the curves of the predicted crack length
against cycles did not match those of the test resultsnear failure, the test results generally fell within the
upper and lower bounds. However, the two tests
at Smf = 34.5 MPa showed a large difference. The
predicted results here fell within a factor of 2 of the
average of these two tests. The radical change inthe predicted crack length against cycles curve at
about a 20-mm-long crack was caused by one of the
severest flights in the spectrum that activated the low
constraint value. The crack-opening stress history for

35 7075-T6 Test
[ Mini-TWIST Srnf, MPo /
30 I- _ Prediction • 62.2 _
l a= 1.8 to 1.2 on 34.5 v t
25 Av 20.7_ /
c, mm2015 :
10
5
I I I
0 1 2 3 4
N x 10 -6, cycles
Figure 77, Experimental and predicted crack length againstcycles for large cracks in 7075-T6 aluminum alloy for Mini-TWIST load sequence with variable constraint factor.
35
30
25
2O
c, mm
15
0 _0
LC9cs Upper c.Mini-TWIST . '=
#oO I;ZIIo a t,",,.A /o [] Lower c;,
Smf, MPoPrediction o [] 34.5
== 1.Sto 1.2 &v& 20.7
I 1 I I
1 2 3 4
N x 10 -6, cycles
Figure 78. Experimental and predicted crack length againstcycles for large cracks in LC9cs aluminum alloy for Mini-TWIST load sequence with variable constraint factor.
this particular test is shown in figure 69 in which the
crack-opening stress levels rapidly rise at c _ 20 ram.One of the tests showed a corresponding decrease inrate at c _ 22 mm.
8.4. Initiation Sites and Crack Shapes for
Small Cracks
One of the most difficult tasks in monitoring the
growth of small surface or corner cracks is determin-
ing the crack shape. In many early reports of small-
crack growth, researchers used the experimental cal-ibration method in which specimens were broken at
various stages and microscopic examinations of the
fatigue surfaces revealed the crack shape. In many of
these investigations, the researchers found that small
cracks grow in nearly a semicircular shape (a/c =
0.9 to 1.1). For large surface cracks in some com-mercial alloys, the preferred propagation pattern is
also nearly semicircular. (See ref. 55.) However, for
highly anisotropic or textured materials, the propa-
gation patterns are different. (See ref. 76.)
In the following sections, comparisons are made
between experimental and predicted crack shape
changes for surface and corner cracks at the edgenotch for the two alloys. Because surface cracks gen-
erally initiate at inclusion particle clusters or voids in
the 7075-T6 alloy, only surface cracks are considered.
However, cracks in the LC9cs alloy nearly always ini-tiate in the cladding layer and grow as corner cracks;
therefore, only corner cracks are considered. Because
the crack-growth rate properties are different in the
a- and c-directions, analyses conducted here also ad-dress the influence of the two AKeff-rate relations on
surface- and corner-crack shape changes as the cracks
grow along the notch root. Comparisons are madewith the test data generated by NASA and CAE.
8.4.1. 7075-T6 Aluminum Alloy
Figures 79 and 80 show the crack shape changesfor the 7075-T6 alloy. These figures show a/c against
a/t. The solid symbols show the sizes and shapesof inclusion-particle clusters or voids that initiated
the small cracks (average size was ai = 3 /zm and
c/ = 9 #m). The data for a/c against a/t were de-termined from the experimental calibration method
(specimens were broken at various stages in lifeand examined to determine the crack depths and
lengths). In the analyses shown in figure 79, two dif-ferent rate relations were used for da/dN. One anal-
ysis assumed that da/dN was the same as dc/dN asa function of/',/(eft; the other analysis assumed that
the two relationships were different as presented in
the table on page 53. In the calculations, R = 0and Smax = 120 MPa. The predicted shape with
the same AKeff-rate relations is shown as the dashedcurve. The solid curve shows the predictions made
with different rate relations for da/dN and dc/dN.
In both analyses, the initial crack was an average ofthe inclusion particle sizes. Points A and B relate
to the corresponding points shown in figure 74. At
point B the AKeff-rate relations begin to differ anda radical change in predicted crack shape is evident.
55

O/C
1.5
1.0
7075-T6R=O
[]
Test[] Surface crack
0.5 • Material defect
Prediction
-- Different AKef f curves-- Same AKef f curves
0.0 ' ' ' '0.0 0.2 0.4 0.6 0.8
a/t
Figure 79. Experimental and predicted surface-crack shape
changes in 7075-T6 aluminum alloy for same and different
AAeff curves in a- and c-direction for R = 0.
1.5 7075-T6
1.0
a/c
0.5
_<_",_ _ _---0- Er--
• Material defect
Loading Test PredictionR=-I o --R=O [] --R=0.5 A ....MIni-TWIST •
I I I l
0.2 0.4 0.6 0.8
a/t
Figure 80. Experimental and predicted surface-crack shape
changes in 7075-T6 aluminum alloy for various stress
ratios.
For a/t > 0.1, the solid curve fails closer to the lim-ited test data (symbols) than the dashed one. Thetests and analyses show that small cracks approach
a/c of about unity for a large part of their growththrough the thickness.
Figure 80 shows the effect of stress ratio on crackshape. The results from the Mini-TV_qST spec-trum are also shown. The spectrum has an over-
1.0
a/c
1.5 r LCgcs
I R = -I -or.......
I o Testo Corner crack0.5
_ Cladding Prediction=
layer-- Different AKeff__curves
-- Some AKef f curves
I I I I
0.2 0.4 0.6 0.8
a/t
Figure 81. ExperimentaI and predicted corner crack shape
changes in LC9cs aluminum alloy for same and different
AKcff curves in a- and c-directions with clad correctionfor R = -I.
all R = -0.23 (minimum to maximum stress in thespectrum). Maximum stress levels in the analyseswere like those in the tests; however, the da/dNand dc/dN relationships were different. The sharpchanges in crack shape as a function of a/t werecaused by the multilinear AKeff-rate curves. Thepredicted results for all stress ratios agreed reason-ably well with the test data.
8.#.2. LCgcs Aluminum Alloy
Comparisons between tests and analyses on crackshape changes in the LC9cs alloy are shown in fig-ures 81 and 82. Again, these figures show a/cagainst a/t. The average cladding-layer thicknesswas about 60 #m (indicated as the vertical line). Asdiscussed, the experimental a/c and a/t values (sym-bols) were determined from the experimental calibra-tion method. In the analyses shown in figure 81, twodifferent rate relations were used for da/dN. In oneanalysis, da/dN was equal to dc/dN as a functionof AKeff (dashed curve); in the other analysis (solidcurve), the two relationships were different as pre-sented in the table on page 54. Here, the calculationswere performed with R = -1 and Smax = 80 MPa.In both analyses, the initial crack was 77 pm in boththe a- and c-directions. Again, points A and B re-late to corresponding points on figure 75. Point B iswhere the AKeff-rate relations begin to differ. Thesolid curve falls closer to the test data at R = -1
(symbols) than the dashed one and indicates thatdifferent AKeff curves are appropriate.
56

1.5
1.0
a/c
0.5
LC9cso
"- _ "--D o.l_I-I A
..-:--.:0 "',, ........ .., ." "
Loading Test PredictionR= -1 o --
_-- R=O []
Cladding R = 0.5 A ....layer Mini-TWIST •
.0 I I 1 I
0.0 0.2 0.4 0.6 0.8
a/tFigure 82. Experimental and predicted corner crack shape
changes in LC9cs aluminum alloy for various stress ratios.
0.5 7075-T6 .... Prediction
Sma x = 95 MPa (a i = 3/_rn;R = -1 c I = 9/_rn)
0.4Test
m NASA-- CAE :
0.3 .' / I " ,,/ i
L, mm .." _ I
0.2 // /
.- /,'" //0.1 ." ,, ,"
0.0 _ ' 'B
0 30 60 90
N x 10 -3, cycles
Figure 83. Experimental and predicted small surface crackgrowth in 7075-T6 aluminum ahoy SENT specimens.
Figure 82 shows the influence of R on crack shape
for the LC9cs alloy. Again, the initial crack size
was 77 #m (ai/ci = 1) and the levels of Smax in theanalyses were the average of those used in the tests.
Although the predicted results for R = -1 agreed
with the test results, those for R -- 0 and 0.5 did not
agree. The reason for the different trends betweentests and analyses could not be determined.
8.5. Prediction of Small-Crack Growth
In the following, comparisons are made between
measured and predicted crack length against cycles
for typical constant-amplitude loading conditions.Comparisons are also made on crack-growth rates
against AK for small cracks for all cooperative pro-
gram loading conditions. All experimental small-
crack-growth results were analyzed with the non-
interaction criteria. (See sec. 6.5.) Baseline results
from the large-crack tests (see sec. 5) are also shownfor comparison. Note that the small-crack growth
rates are calculated for da/dN, whereas the large-
crack rates are for dc/dN.
8.5.1. 7075-T6 Aluminum Alloy
Typical results of crack length against cycles for
small cracks are shown in figure 83 for R = -1.These results were selected because previous stud-ies have shown that the small-crack effect is more
pronounced at negative stress ratios than at positive
ones. The depth L from the plastic-replica method is
plotted against cycles. The solid and dashed curvesshow NASA and CAE results, respectively. Based on
an initial defect (or void) size (ai = 3 #m, a/= 9 #m,and b -- 0.5 #m) in the analysis, the predicted results
(dotted curve) fall considerably shorter than thosein the tests. Because the plastic-replica method af-
fected fatigue life (by about a factor of 2 at this stresslevel) and possibly small-crack-growth rates, the re-
sults shown in figure 83 may be expected.
Comparisons of experimental and predicted
growth rates for small cracks are shown in figures 84-
87 for R --- -1, 0, 0.5, and Mini-TWIST load-
ing, respectively. Even though the range in Smaxin each test series is indicated, no stress-level effect
was apparent in the test data; thus, all data have
been grouped. In some cases, however, a range ofstress levels was used in the analyses to show ex-
pected trends. The dotted lines show the large-crack
(dc/dN) results and the dashed lines show the AKeff-rate curve used in the analyses for da/dN.
Results for R = -1 are shown in figure 84. The
solid curves show the predicted results based on an
initial defect (or void) size of 3 by 9 by 0.5 #m fora range of maximum stress levels. All predictions
start on the AKeff curve because cracks at smallvoids are assumed to be fully open on the first cycle
and AK = AKeff. Clearly, the model predictions
did not agree well with the test data for Smax = 80
to 95 MPa in the near-threshold regime. However,
the predictions did agree with the test data in the
mid- and high-rate range. At 70 MPa, the predictionsshow that the crack nearly arrested (minimum rate)
at AK _ 2 MPa-m 1/2. At this point AKeff was
slightly greater than 0.9 MPa-m 1/2, the effective
57

10 -3 7075-T6 / ." 10 -3 7075-T6 >"
R = -1 / _" R = 0.5 :
10-4- /• o 10-4
SrTIOX ••11 _ _edo/,,,,.1°-5 do/d,.1°-5mm/cycle 9 mm/cycle o o
80 " _4_o ° diction,
10 -6 _"_ _/_ -- Prediction 10 -6 7%d_ ° Sma x - 200 MPo:7oimI -I '_= "-' Large crock, _. -- &Keff
10-7 :e _Ibi dc//dN 10-7 o / i -'" Lorge crock,dc/dN
: l_io = Surface crack / i o Surfocecrock
10-8 ..... :.=_....... 10-8 .....................0.5 1 10 100
6K, MPo-m 1/2
Figure 84. Experimental (Smax = 80 to 95 MPa) and predictedsmall surface crack-growth rates against AK in 7075-T6aluminum alloy SENT specimens at R = -1.
0.5 1 10 100
6K, MPo-m 1/2
Figure 86. Experimental (Smax = 195 to 220 MPa) andpredicted small surface crack-growth rates against AKin 7075-T6 aluminum alloy SENT specimens at R = 0.5.
10-3
10 -4
do/dN, 10-5
ram/cycle
10 -6
10 -7
10 -80.5
7075-T6 •'._
R=o ,,.:/.o• " 0
/.o"
J s_ °
t_q_ _ Prediction,/ v#o Smo x= 120MPo.Io^d __ *v
;4 -- AK_ff
lo _." ....Large crock, dc/dNo Surface crack
I :• i.ii ........ i ........ l
1 10 IO0
AK, MPa-m 1/2
Figure 85. Experimental (Sm_ = 120 to 140 MPa) and
predicted small surface crack-growth rates against AKin 7075-T6 aluminum alloy SENT specimens at R = 0.
threshold for small cracks. (Note that the fatigue
limit for R = -1 was about 70 MPa, see sec. 8.6.1.)
The comparison of experimental and predicted
results for R -- 0 is shown in figure 85. The
observed trends are nearly identical to those forR = -1, except that the cracks in the mid- to high-
rate range grew more slowly than those predicted
(solid curve). As R increases, the spread between the
large-crack AK-rate and AKeff-rate curves lessens,
which helps explain why the small-crack effects arenot as pronounced as those observed for R = -1.
10-4
10-5
da/dN, 10-6
rnm/cycle
10-7
10-8
10-9
7075-T6Mini-TWIST
."" 0
o=__i ° oo diction,
o_ Sma x = 200 MPo
/_o - '"_-arge crack.
o dc/dN
%=_ o Surface crack0
........ | ........ i
10 100
&K, MPa-m 1/2
Figure 87. Experimental (Sma_ = 190 to 208 MPa) andpredicted small surface-crack growth rates against AKin 7075-T6 aluminum alloy SENT specimens for Mini-TWIST load sequence.
Whereas the previous results for R = -1 and 0
had elastic notch-root stresses, the test conditions
for R = 0.5 caused the notch root to yield. For
these conditions, small cracks were observed to grow
at considerably slower rates than those measured forlarge cracks at AK values greater than the large-
crack threshold. (See fig. 86.) Of course, the plastic-
replica method may be partly responsible, but thiseffect has been observed for 2024-T3 aluminum alloy
(ref. 19) wherein the replica method did not appear
58

to haveasignificanteffect.Theslowerratesforsmall 1.0cracksarestill beinginvestigated.
Themeasuredandpredictedsmall-crack-growthratesfor theMini-TWISTloadingareshownin fig- 03ure87. Herethe averagecrack-growthrate is plot-tedagainstthemaximumrangestressintensityfac-tor. (Seesees.3.6.1and3.6.2.) To determinethe 0.6predictedvalues,crackdepth(2a)andcycleresults L, mmweretakenfromthe analysisat nearlyequalcyclicintervalsbetweenthe initial crackdepthandbreak- 0.4through(a = t). From these values of crack depth
and cycles, the average rate and maximum rangestress intensity factor were calculated. The pre- 0.2
dieted results and experimental data showed similar
trends, but the predicted rates were generally fasterthan those from the experiments. Again, the plastic- 0.0
replica method may be responsible for some of the
observed differences. At Smax = 200 MPa, fatigue
tests in which the replica method was used gave fa-
tigue lives that were nearly a factor of 2 longer thantests without the replicas.
LC9cs ' I "
Smax=gOMPa; ,I
R=-I : :/ •Test /-- CAE i ,/
--NASA I :1,' ;/
Cladding 11 //
layer i I/
(0.06mr,',),'/ -" ,-"l_";" -"- Prediction/ -" .--.._"_-" re- = 77 #m;
I I I l
10 20 30 40
N x 10 -3, cycles
Figure 88. Experimental and predicted small corner-crackgrowth in LC9cs aluminum alloy SENT specimens.
8.5.2. LC9cs Aluminum Alloy
A comparison of experimental and predicted
crack length against cycles for small cracks in the
LC9cs alloy for R -- -1 loading is shown in figure 88.The measured L from the plastic-replica method is
plotted against cycles. The solid and dashed curvesshow data from CAE and NASA, respectively. In the
analysis, a 77-#m quarter-circular corner crack wasassumed for the initial crack size. From the exper-
iments, this particular crack size seems reasonable.
The predicted results (dotted curve) agreed well inthe early growth period but showed slower rates for
longer crack lengths. However, results from severaltests, which were stopped at about 22 000 cycles, may
have agreed better with the prediction if they hadbeen allowed to continue.
Figures 89 92 show comparisons of the experi-
mental and predicted AK against rates for smallcracks for R = -1, 0, 0.5, and Mini-TWIST load-
ing, respectively. Again, no stress-level effect wasapparent in the test data; therefore, all data have
been grouped. The dotted curves show the large
crack (dc/dN) results and the dashed lines show theAKeff-rate relation used in the analyses for da/dN.
10-3
10-4
da/dN, 10-5
ram/cycle
10 -6
10-7
10 -80.5
LC9cs
R = -1 ,' _l'
Sma x ,,'/_"
110_f
g02__o 70 6,1_"_
0 04_
: \0[ -- ,,K.,,.... Large crack,
/ 50 v dc/dNo Surface crack
I
1 10 100
AK, MPa-m 1/2
Figure 89. Experimental (Smax = 70 to 90 MPa) and predictedsmall-crack-growth rates against AK with small-crackclad correction in LC9cs aluminum alloy SENT specimensat R= -1.
cycle. As the corner crack grows, the residual plasticdeformations build along the crack surfaces and cause
the crack-opening stresses to stabilize at the large-Predictions are shown as solid curves.
Figure 89 shows comparisons of experimental and
predicted rates on the LC9cs alloy for R = -1
loading. The solid curves show the predicted results
with a 77-tim initial corner crack for a range of Smax.All predictions start on the AKeff curve because the
initial crack is assumed to be fully open on the first
crack conditions. Here, the predictions begin to agree
with the large-crack results. The predictions from
the model agree well with the test data for Smax =
70 to 90 MPa in the early stages of crack growth,
but the predicted rates seem to be slightly low in
the mid- to high-rate range. At Smax = 50 MPa,
the predictions show a large drop in crack-growth
59

10-3
10-4
do/dN, 10 -5
ram/cycle
10-6
10 -7
10-8 ...,,0.5 1
LC9cs , •
R=O ,,_
_4l_- _ Prediction,
o ol4_=v Srno,x = 100 MPoI _ -- _eff
: .... Large crack,
I dc/dNIo Comer crack
: • Surface crackI
10 100
AK, MPa-m 1/2
Figure 90. Experimental (Sma_ = 100 to 115 MPa) and pre-dicted small-crack-growth rates against AK with small-crack clad correction in LC9cs aluminum alloy SENTspecimens at R = 0.
10-3
10-4
do/dN, 10 -5
ram/cycle
10-6
10 -7
10 -80.5
I
IIIII
• ..IL
1
LCgcsR = 0.5 "'e
,0
0
-- Prediction,
Sma x= 175MPo
__ AKeff.... Large crack,
dc/dNo Comer crackA Surface crack
....... i ....... i
10 IO0
6K, MPa-m 1/2
Figure 91. Experimental (Smax = 165 to 180 MPa) and pre-dicted small-crack-growth rates against AK with small-crack clad correction in LC9cs aluminum alloy SENT
specimens at R = 0.5.
rates, similar to those for the 7075-T6 alloy. This
drop in rate is caused by a crack-closure transient, as
illustrated in figure 65. The crack would have beenpredicted to arrest if Smax = 40 MPa had been used.
Again, the effective threshold for small cracks was
assumed to be 0.9 MPa-m 1/2. The fatigue limit for
R = -i was about 40 MPa.
A comparison of experimental and predictcd re-
sults for R = 0 is shown in figure 90. Here, data on
10-4
10 -5
do/dN, 10-6
mm/cycle
10 -7
10-8
10 -9
LCgcs
Mini-TWIST
°.-AO ."O
o _ -- Prediction,
No Srnox = 150 MPo0o .... Large crock,
dc/dNo Corner crock
........ i ........ g
10 1O0
&K, MPo-m 1/2
Figure 92. Experimental and predicted small-crack-growthrates (Smax = 125 to 170 MPa) against AK with small-crack clad correction in LC9cs aluminum alloy SENTspecimens for Mini-TVc'IST load sequence.
both surface and corner cracks are shown. However,
only corner-crack growth was predicted for the LC9cs
alloy (solid curve). The predicted results agreed quitewell with the test results.
The results for R -- 0.5 are shown in figure 91.
Again, small surface and corner cracks were observedto grow at slower rates than those measured for large
cracks at AK values greater than the large-crack
threshold. This slower growth may have resultedbecause the notch root yielded• Attempts to explain
this observed effect from crack closure, constraint, or
crack-shape changes have been unsuccessful. Further
study is needed to determine the cause of this slower
growth.
The rates for measured and predicted small-crack-growth rates for the Mini-TWIST loading are
shown in figure 92. The predicted rates (solid curve)
agreed well with the experiments for both small and
large cracks.
8.6. Prediction of Fatigue Life
All of the elements are now in place to assess a
total fatigue-life prediction methodology based solelyon crack propagation from microstructural features,
such as the inclusion-particle clusters (or voids) and
the cladding layer. The fatigue tests that were con-ducted in the early part of the cooperative program
are now used in this assessment. In this approach,
a crack is assumed to initiate and grow at the notch
root on the first cycle. The crack-closure model and
the baseline AKeff-rate relations are used to predict
6O

Smo x,
MPo
250
200
150
IO0
7075-T6
R = 0.5
R O
5O R = -1-- Prediction
(o i = 3 #m; ci = 9/_m)....... 1 ........ i ........ i
104 105 106 107
Nf, cycles
Figure 93. Experimental and predicted fatigue lives for 7075-
T6 aluminum alloy at various stress ratios.
250
200
Smox ' 150
MPoIO0
5O
LC9cs Prediction-- Boseline A-- Boseline B
n n (°i = ci = 77/_m)
R=O.5
R=-I
O | ....... | ........ i ........ i
104 105 106 107
Nf, cycles
Figure 95. Experimental and predicted fatigue lives for LC9es
aluminum alloy at various stress ratios.
Smo X,
MPo
300 7075-T6Mini-TWIST
200
IO0
0105
0 @
O-P
-- Prediction
(a i = 3#m;c i= 9#m)
• • . ..... | ........
106 107
Nf, cycles
Figure 94. Experimental and predicted fatigue lives for 7075-
T6 aluminum alloy for Mini-TWIST load sequence.
crack growth from the initial crack size to failure.Comparisons are made with the fatigue tests con-ducted on the SENT specimens. Because these testswere standard fatigue tests, the effects of the plastic-replica method on fatigue life for the 7075-T6 alloyare not an issue.
8.6.1. 7075-T6 Aluminum Alloy
The S-N data for the 7075-T6 alloy are sho_-n infigures 93 and 94 for constant-amplitude and Mini-TWIST spectrum loading, respectively. A symbol
indicates a failure; when an arrow is attached, thattest was terminated before failure. In the analysis,the initial crack size was ai = 3 /_m, c/ = 9 /_m,and b = 0.5 #m. This crack size is the averagedefect size measured at actual crack-initiation sites.
The effective stress intensity factor range against raterelations used in the analysis are given in the tableon page 53 and the (Ageff)t h was assumed to be
0.9 MPa-m 1/2. The FASTRAN II code (ref. 56)was used to make life predictions for both constant-amplitude and spectrum loading. The solid curvesshow the predicted number of cycles to failure. Thepredicted lives were in reasonable agreement with thetest lives for constant-amplitude loading. In additionto predicting fatigue life, the analysis methodologywas also able to predict the fatigue limit as a functionof R. For spectrum loading, the predicted results(fig. 94) fell near the lower bound of the data fromthe experiments.
8.6.2. LC9cs Aluminum Alloy
The results from experiments and predictions areshown in figure 95 for constant-amplitude fatiguetests on the LC9cs alloy. In these tests, the LC9csalloy exhibited more scatter than the 7075-T6 alloy,especially at the R = 0.5 stress ratio condition.The solid curves show predictions using the baselinerelations for da/dN and dc/dN given in the table onpage 54 (baseline A). To show the sensitivity of theda/dN and dc/dN relations in the low-rate regimeon fatigue life, the dashed curves show the predictedresults from baseline B relations (as shown by the
61

10 -1 LC9cs N/""Io_2 _i_ = dc/d
= 1.2 /."doldN
10-3 T_""
d____a,d._.£,10 -4dN dN
rnrn/cycle 10 -5
10 -6 ../" _ Boseline A
,o-,V iiT°I'10-8 ........
0.5 1 5 10 5O
Mpa-ml/2AKef f,
Figure 96. Effective stress intensity factor range against crackgrowth rates in a- and c-directions for baseline A and Brelations.
300 LC9cs PredictionMini-TWIST -- BaselTne A
--. Baseline B
(a i = c i = 77/_rn)
200 o o
Smox, "_ o
MPa " " - ..o, o
100
I , | ...... _ , , , ..... i
10 5 10 6 107
Nf, cycles
Figure 97. Experimental and predicted fatigue lives for LC9csaluminum alloy for Mini-TWIST load sequence.
dashed lines in fig. 96). In both analyses, the initial
corner-crack size was a i = 77 #m, ci -- 77 pro,and b = 0.5 pro. This crack size is somewhat
larger than the cladding-layer thickness, but it is
consistent with observations from experiments made
early in life. (See fig. 88.) Again, the effective stress
intensity factor threshold for small cracks (AKeff)t h
was assumed to be 0.9 MPa-m 1/2. The predicted
lives were in reasonable agreement with the test
results. In addition, the results indicated that the
analysis method also could predict reasonable fatigue
limits for the LC9cs alloy.
62
Fatigue lives for the LC9cs alloy for Mini-TWIST
spectrum loading is shown in figure 97. The solid
and dashed curves show the predictions with the two
baseline relations (A and B). The predicted lives forbaseline A cross the test data at low stress levels, butthe results from baseline B fall near the lower bound
of the test data.
9. Conclusions
The National Aeronautics and Space Adminis-tration and the Chinese Aeronautical Establishment
have participated in a Fatigue and Fracture Me-
chanics Cooperative Program. The objectives wereto study the behavior of small cracks in two high-
strength aluminum alloys, to compare experimen-tal and analysis results from each laboratory, and
to evaluate an existing analytical model to predict
the growth of such cracks. Both experimental and
analytical studies were conducted on fatigue crack
growth of small and large cracks in 7075-T6 bareand LC9cs clad aluminum alloy sheets. The anal-
yses and experiments on single-edge-notch tension
(SENT) and center-crack tension (CCT) specimensproduced the following findings.
9.1. Analyses
1. Stress intensity factor solutions for surface andcorner cracks at a notch determined by the three-
dimensional finite-element method and by the
weight-function method generally agree within
-t-3 percent for a range of crack-configuration pa-rameters. However, the finite-element method
requires a large mainframe computer, whereas
the weight-function method used a personal
computer.
2. Stress intensity factor solutions for a through
crack at a notch in a plate subjected to re-
mote uniform stress or displacement have been
determined by a two-dimensional boundary-forcemethod.
3. Stress intensity factor equations have been de-
veloped for a surface, corner, and through crack
at a notch for a range of crack-configuration
parameters.
4. A simple correction to estimate the influence of
the low-yield cladding material on stress inten-
sity factors for a corner crack at the notch hasbeen developed from a two-dimensional weight-
function analysis.
9.2. Experiments
1. Fatigue lives and small-crack-growth rates mea-sured on SENT specimens for constant-amplitude

andMini-TWISTspectrumloadingfromtile twolaboratoriesagreewellfor all loadingconditions.
2. Large-crack-growthrates measuredfor threeconstant-amplitudestressratios(-1, 0, and0.5)from the two laboratoriesagreewell, althoughslight discrepancieswereobservedin the near-thresholdregime.
3. Smallcracksgrewbelowthelarge-crackthresholdin both7075-T6andLC9csalloys,especiallyforthe lowerstressratio tests. Small-crackeffectsaremorepronouncedfor thenegativestressratiotests.
4. Surfacecracksin the 7075-T6alloy initiate atinclusion-particleclustersor voidsat ornearthenotchsurface.Morethan70percentofthecracksinitiate in themiddlehalfof thesheetspecimenthickness.
5. Cornercracksin the LC9csalloy initiate fromslip-bandformationin thecladdinglayers.Morethan 90 percentof the cracksinitiate at. theintersectionsof thenotchandsheetsurfaces.
6. Both laboratoriesfoundthat 80to 97percentofthefatiguelivesforthetwoalloysisspentinprop-agatingacrackfrommicrostructuralmaterialde-fects(inclusionparticlesorvoid)or thecladdinglayer.
7. Fatiguelives,andpresumablysmall-crack-growthrates, in the 7075-T6aluminumalloy are af-fectedby tile plastic-replicamethod. However,the LC9escladalloyis apparentlyunaffectedbythismethod.
8. Measuredcrack-growthratesof largesurfaceandcornercracksat thenotchindicatethatthecrack-growthpropertiesin the lengthanddepthdirec-tionsprobablydiffer.
9.3. Analytical Crack-Closure Model
1. For large cracks, the crack-closure concept corre-
lates fatigue crack-growth rate against the effec-tive stress intensity factor range data over 6 to 8
orders of magnitude in rate for three constant-
amplitude stress ratio conditions.
2. The model predicts constant-amplitude and Mini-
TWIST spectrum loading trends for small crackslike those observed in tests, especially for the
LC9cs alloy. The discrepancies for the 7075-T6
alloy are attributed to the effect of the plastic-
replica (acetone) method on small-crack-growthrates.
3. The crack-closure model predicts crack length
against cycles for a large crack in a plate sub-
jected to the Mini-TWIST spectrum loadingwithin about -t-25 percent for the two alloys.
4. Using a microstructural defect (inclusion-
particle) size or the cladding-layer thickness as aninitial crack, a total fatigue-life prediction method
was demonstrated using the crack-closure model.
The cooperative program demonstrated that in-ternational cooperation between research organiza-
tions can be fruitful. The cooperative program hasadvanced the state of the art in fatigue and frac-
ture mechanics and has provided the American and
Chinese aerospace industries with useful data from
experiments and with efficient analysis methods for
improving life prediction. These results should ulti-
mately improve the reliability and safety of aircraftstructures.
NASA Langley Research CenterHampton, VA 23681-0001January 14, 1994
63

Appendix A
Finite-Element Analyses of Surface andCorner Cracks at a Semicircular Notch
In this section,the 3D finite-elementanalysesusedto calculatethe stressintensity factorsforsurfaceand cornercracksemanatingfrom a semi-circularnotcharepresented.Thefinite-elementpro-gramand method(singularityelementand nodal-force method) developedby Raju and Newman(refs.33and34)wereusedfor semicircularandlow-aspect-ratio(lowa/c) cracks. For large-aspect-ratio
cracks (a/c = 2), the finite-element program (non-
singular elements) developed by Shivakumar and
Newman (ref. 35) and the equivalent-domain integral
(EDI) method (ref. 36) were used because the latterapproach required less effort to generate large a/c
models than the former one. The stress intensity fac-
tors were obtained for a range of semielliptical surfacecracks at the center of the semicircular edge notch
and quarter-elliptical corner cracks at the edge of thenotch in a finite-thickness specimen. The ranges were
a/c = 0.4 to 2 and a/t = 0.2 to 0.8. The hole-radius-
to-plate-thickness (r/t) ratio was 3 for surface cracks
and 1.5 for corner cracks. The SENT specimens weresubjected to remote tensile loads.
Stress Intensity Factors
The mode I stress intensity factor for any location
along the crack front was expressed as
(_) 1/2 (car)K= S Fj -[, c' t' _ (A1)
where j = s for a surface crack and j ----c for a corner
crack. The r/w ratio was 1/16 and the half-heightof the plate h was chosen large enough that height
would have a negligible effect on stress intensity
factors (h/w > 2). Values of Fj were calculatedalong the crack front for various combinations of
configuration parameters (a/t, a/c, and _a). Thecrack dimensions and parametric angle _a are defined
in figure A1. For an ellipse, Q is given by the square
of the complete elliptic integral of the second kind.
(See appendix D.)
Three-Dimensional Finite-Element
Analyses
Singularity Elements and Nodal-ForceMethod
Stress intensity factor distributions in refer-ences 77 and 78 for surface and corner cracks at
64
a hole showed a precipitous drop near the region
where the crack meets the hole surface. This drop
was believed to have been caused by the boundary
layer effect. (See ref. 79.) However, comparisonswith other solutions in the literature (see refs. 48
and 80) showed that the stress intensity factors calcu-
lated by other investigators did not show this large
drop in the boundary layer region. Therefore, Tan
et al. (ref. 81) conducted a study to determinewhether this drop was real and, if not, to deter-
mine the source of the anomaly. The models used
in references 77 and 78 were reexamined; that exam-
ination revealed that the procedures used to gener-ate the cracked solids produced models with some
ill-shaped elements in the region where the crack
intersects the hole boundary. The ill-shaped ele-
ments were defined as ones with aspect ratios greaterthan 100. These elements do not affect the results if
they are in regions of small stress gradients. How-
ever, they may produce a stiffer model if they are
in regions of large stress gradients. For r/t -- 1,the elements in the region where the crack meets
the hole boundary had aspect ratios of about 150.In the cooperative program, however, solutions were
needed for r/t _ 3. The aspect ratio for ele-
ments created with this mesh generator produced
elements with aspect ratios of about 450! (Stressintensity factor solutions were never published for
r/t :> 2 (refs. 77 and 78).)
An investigation was undertaken (ref. 81) to studythe effect of these ill-shaped elements on the stress
intensity factor solutions and on the equations devel-
oped to fit these results. The investigation was con-
ducted in two parts: in the first part, improved proce-
dures were used to generate models for cracked solidsand several different finite-element models were de-
veloped; in the second part, several different methodswere used to extract the stress intensity factors fromthe finite-element solutions. Three different finite-
element models were developed: model A used finite-
element patterns (eight-noded elements) that weresimilar to those used in references 77 and 78 with the
ill-shaped elements, model B was a newly developedfinite-element model similar to model A but without
ill-shaped elements, and model C with eight-noded
elements used only nonsingular elements (without
any ill-shaped elements). Models A and B had about15000 DOF. Model C had about 18 000 DOF. Two
different LaRC computer programs (refs. 33 and 35)
were used to analyze the various models. These pro-
grams verified the consistency of the results and de-termined whether undetected errors existed in the
codes or analyses. (Stress intensity factors reported
in NASA TM-101527 for a/c -- 2 are in error because

1_ Crack front i
.fw
_x
(a) Surface crack (A-A). (b) Corner crack (B-B).
Figure A1. Specimen configurations and nomenclature for surface and comer crack at notch.
of a meshing problem. Results reported in ref. 81
for a/c = 2 were developed from a different meshand method. These results are shown in fig. 19(d)
and they compare very well with the weight-function
results.)
Two specimen configurations with r/t = 1 and 3
were chosen for the study. Both specimens had a
semicircular (a/c = 1) surface crack with a/t = 0.2.
Figure A2 shows a typical finite-element model
(model B) without the ill-shaped elements. Theseelements were avoided by use of an offset where thecrack front intersected the hole or notch boundary.
(See ref. 81.) Because the specimen was symmetri-
cal, only one-quarter was modeled. The model shownin figure A2 has eight wedges on the crack plane and
four layers on the hole. Pentahedral singularity el-ements were used along the crack front and eight-noded hexahedral elements were used elsewhere. The
final models used in the analysis had 14 wedges on
the crack plane and 10 layers on the hole. These mod-els had about 15 000 DOF. The finite-element models
were subjected to remote uniform stress. Stress in-tensity factors were calculated with the nodal-forcemethod. Details of the formulation of these types of
elements and the nodal-force method are given in ref-
erence 34 and are not repeated here. Details on the
development of the new finite-element models used
here are given in reference 81.
Two methods for extracting stress intensity fac-tors from the solutions were also studied: the nodal-
force method (refs. 33 and 34) and the VCCT. (See
ref. 37.) The nodal-force method was used in con-junction with models A and B and the VCCT wasused in conjunction with model C. Note that the
nodal-force method does not require an assump-
tion of either plane stress or plane strain to extractthe stress intensity factors. However, the VCCT
method doe_ need that assumption. The plane-strain
assumption was used everywhere along the crack
front except where the crack meets the notch sur-
face (_ = 90°); at this location, a plane-stress condi-tion was used. These types of plane-stress and plane-
strain assumptions along the crack front are widelyused in the literature.
Figure A3 presents the normalized stress inten-
sity factor (or boundary-correction factor) distribu-tions along the crack front (a/c = 1, a/t = 0.2, and
r/t = 1) from all three models. Model A, with theill-shaped elements (circular symbols), gave stress in-
tensity factors that were significantly lower than theresults from the other models, especially for _ > 60 °.
The results from models B and C agreed well for most
65

} WedgeOffset
Layer
i
Y
tzj
X
I|
h
Figure A2. Typical finite-element idealization for surface and corner cracks at notch configuration.
of the crack front. Some slight discrepancy (about
2 percent) was observed for _ > 80 °. The model with
the ill-shaped elements was too stiff and gave lower
stress intensity factors than models without these el-ements. The solid curve is an empirical equation for a
surface crack at an edge notch that was based on pre-vious finite-element results for surface cracks at holes
and on engineering judgment. (See ref. 30.) Compar-
ison with present finite-element results suggests thatthe equation is fairly accurate (within 5 percent) for
this crack configuration.
Figure A4 presents the normalized stress inten-
sity factors for the same crack shape and size as in
figure A3 but for a larger notch=to-plate-thickness ra-
tio (r/t = 3). The nodal-force results from model B
(without ill-shaped elements) agreed well with resultsfrom model C with thc VCCT. The maximum differ-
ence between the two sets of results was 4-1.5 percent.
Again, the solid curve is the stress intensity factorscalculated from the empirical equation. (See rcf. 30.)
Here, the equation consistently underestimated the
stress intensity factors (6 to 12 percent). Therefore,
the equations for surface and corner cracks emanat-
ing from the semicircular edge notch were modified.
(See appendix D.)
Recall that the nodal-force method was used to
extract the stress intensity factors from the mod-
els with and without tile ill-shaped elements (mod-
els A and B, respectively). The VCCT was used in
conjunction with model C. All models without the
ill-shaped elements showed nearly the same stressintensity factors along the crack front. This agree-ment demonstrates that the two methods of extract-
ing stress intensity factors are reliable, provided that
the models have appropriate elements.
66

4
F s
3
r/t= I
a/c = Ia/t = 0.2
0 3O
0
o Model A nodal force
(ill-shapedelements)
[]Model B nodal force
A Model C VCCT
m Equation (ref. 30)
I I
60 90
¢p, deg
Figure A3. Boundary-correction factors for a surface crack at
notch by various methods and models for r/t = 1.
F s
5
4
3
2
o FEM EDI
[]FEM VCCT,_ FEM nodal force
--Equatiln_=oo_
_j_Y Crack front_._--r ¢
r/t= 3a/c = I
a/t = 0.8
I
300 ,,, I I
0 60 90
¢p, deg
Figure AS. Boundary-correction factors for deep surface crack
at notch by various methods.
4
3
Fs 2
r/t = 3a/c = 1a/t = 0.2
m Model B nodal forcezx Model C VCCT
Equation (ref. 30)
I I ;
0 30 60 90
@, deg
Figure A4. Boundary-correction factors for a surface crack at
notch by various methods and models for r/t = 3.
Nonsingularity Elements and EDI Method
The method used by Raju and Newman (refs. 33and 34) requires that singularity elements be usedaround the crack front and that the finite-element
patterns be generated on orthogonal lines in thecrack-front region. These requirements cause diffi-culty in developing models for large ale cracks. Toovercome these difficulties, the 3D finite-element pro-
gram ZIP3D (ref. 35) was developed and used inconjunction with the EDI method (ref. 36) to calcu-late stress intensity factors for large a/c surface andcorner cracks at the semicircular edge notch. TheEDI method is an extension of the well-known 2D
J-integral method to 3D problems. The resultingsurface integral is converted into a volume integralthrough an application of the divergence theorem andthe use of an s-function suggested by DeLorenzi inreference 82. An advantage of the EDI method isthat singularity elements are not needed and thatthe finite-element patterns need not be orthogonalat or near the crack front. (See ref. 83.)
To verify the models and EDI method, figure A5shows the distribution oJ_stress intensity boundary-correction factors along the crack front for a deep,semicircular, surface crack (ale = 1, a/t = 0.8,and r/t = 3) by various models and methods. Thecircular symbols are from the EDI method. Thesquare and triangular symbols show results from thenodal-force and VCCT methods, respectively. Thefinite-element models used in reference 81 and in
the present analysis had orthogonal mesh patternsalong the crack front. Thus, the VCCT and nodal-force methods should give accurate solutions. Re-sults from all three methods agreed well (within3 percent) all along the crack front except very near_o = 90 °. The disagreement among the three meth-ods here is mainly due to the free-surface boundarylayer effect. (See ref. 79.) The peak values nearthe free surface are considered appropriate valuesfor crack-growth studies. Equations were developed
67

to fit these and other results for surface cracks at
the notch. The solid curve shows the equation for
the boundary-correction factors developed in appen-
dix D. The equation fits the finite-element rcsults
very well near the free surface and the equation is
about 3 percent lower than the EDI results at maxi-
mum depth (_ = 0 °) location.
Results and Discussion
The 3D FEM developed by Raju and Newman
(refs. 33 and 34) and the newly developed meshgenerator scheme (ref. 81) were used to calculate themode I stress intensity factor variations along the
crack front for a surface and corner crack (a/c <_ 1)
emanating from a semicircular edge notch in a plate
subjected to tensile loading. (See fig. A1.) For
cracks with a/c = 2, the finite-element program
(nonsingular elements) developed by Shivakumar andNewman (ref. 35) and the EDI method (ref. 36) were
used. The details of thcse analyses are given in
references 81 and 84 for a/c < 1 and in reference 85
for a/c = 2. In all of these analyscs, Poisson's ratiowas assumed to be 0.3.
A surface crack that emanates from the center
and a corner crack that emanates from the edge of
the semicircular edge notch in a plate subjected totensile loading were considered herein. A range of
crack sizes and shapes were analyzed for r/t = 1
to 3 for surface cracks and r/t = 1.5 for cornercracks. Note that thc configuration for r/t = 3
corresponds to a small-crack specimen with a surface
crack that was usedin two AGARD studies (refs. 19
and 20) and in the cooperative program. The ranges
of configuration parameters were a/t = 0.2, 0.5,
and 0.8; and a/c = 0.4, 1, and 2. For each of thesecombinations, stress intensity factors were obtained
all along the crack front. The normalized stress
intensity factors obtained with the 3D finite-element
analyses are presented in tables AI-AIV.
68
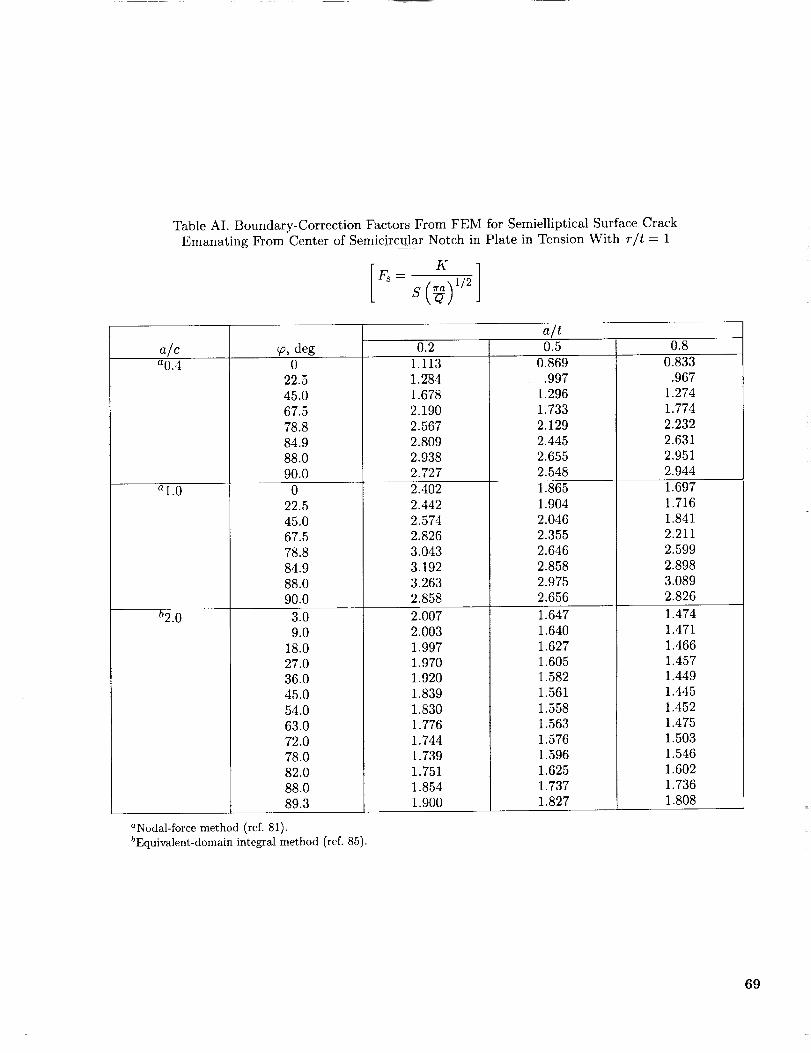
TableAI. Boundary-CorrectionFactorsFromFEMfor SemiellipticalSurfaceCrackEmanatingFromCenter of Semicircular Notch in Plate in Tension With r/t = 1
K
a/c _, degao.4
al.O
022.5
45.0
67.5
78.8
84.988.0
90.0
0
22.5
45.067.5
78.8
84.9
88.090.0
a/t0.2 0.5 0.8
1.113
1.284
1.6782.190
2.567
2.8092.938
2.727
2.402
2.442
2.5742.826
3.043
3.192
3.2632.858
0.869
.997
1.296
1.7332.129
2.445
2.655
2.548
1.8651.904
2.046
2.3552.646
2.858
2.975
2.656
0.833.967
1.274
1.774
2.2322.631
2.951
2.944
1.697
1.7161.841
2.211
2.5992.898
3.089
2.826
b2.0 3.09.0
18.027.0
36.0
45.0
54.063.0
72.0
78.082.0
88.0
89.3
2.0072.003
1.997
1.9701.920
1.839
1.8301.776
1.744
1.739
1.7511.854
1.900
1.647
1.6401.627
1.6051.582
1.561
1.558
1.5631.576
1.596
1.625
1.7371.827
1.474
1.471
1.4661.4571.449
1.445
1.452
1.475
1.5031.546
1.602
1.7361.808
aNodal-force method (ref. 81).bEquivalent-domain integral method (ref. 85).
69

TableAII. Boundary-CorrectionFactorsFromFEMfor SemiellipticalSurfaceCrackEmanatingFromCenter of Semicircular Notch in Plate in Tension With r/t = 2
a/c
aO.4
al.0
b2.0
_, deg0
22.5
45.067.5
78.8
84.988.0
90.0
0
22.5
45.067.5
78.8
84.988.0
90.0
3.09.0
18.0
27.036.0
45.0
54.063.0
72.0
78.0
82.0
88.089.3
aNodal-force method (ref. 81).
bEquivalent-domain integral method (ref. 85).
a/t0.2
1.405
1.6132.070
2.596
2.9433.151
3.252
2.982
2.789
2.8222.929
3.138
3.3233.454
3.509
3.052
0.5
1.0811.245
1.634
2.174
2.5952.880
3.044
2.8442:316
2.3572.497.
2.780
3.0283.201
3.285
2.885
0.8
0.9891.156
1.553
2.207
2.7643.182
3.469
3.347
2.1282.152
2.303
2.7153.105
3.378
3.5333.161
2.189
2.180
2.1522.124
2.074
2.0261.986
1.908
1.835
1.830
1.8651.953
2.000
1.943
1.9261.914
1.905
1.871
1.8161.791
1.764
1.746
1.7471.770
1.866
1.946
1.817
1.8111.799
1.7.84
1.7611.746
1.726
1.7111.721
1.746
1.792
1.904
1.979
70

TableAIII. Boundary-Correction Factors From FEM for Semielliptical Surface Crack
Emanating From Center of Semicircular Notch in Plate in Tension With r/t = 3
KFs -- 1/2
a/cao.4
al.0
b2.0
_, deg0
22.5
45.O67.5
78.8
84.9
88.0
90.00
22.5
45.0
67.578.8
84.9
88.0
90.0
3.0
9.018.0
27.0
36.0
45.054.0
63.0
72.078.0
82.0
88.0
89.3
0.2
1.603
1.831
2.318
2.8393.167
3.361
3.452
3.151
3.0173.045
3.138
3.328
3.5033.629
3.679
3.192
2.300
2.295
2.2632.207
2.143
2.0861.967
1.913
1.8661.847
1.872
1.949
2.023
a/t0.5
1.2531.442
1.882
2.4602.878
3.145
3.290
3.044
2.592
2.630
2.7613.022
3.251
3.4113.482
3.040
2.125
2.121
2.104
2.0722.023
1.9731.924
1.864
1.836
1.8151.822
1.881
1.964
0.8
1.1311.325
1.788
2.534
3.135
3.5593.834
3.655
2.429
2.454
2.6103.032
3.421
3.6853.829
3.398
2.028
2.021
2.006
1.9831.958
1.9281.902
1.865
1.8491.852
1.873
1.962
2.026
aNodal-force method (ref. 81).bEquivalent-domain integral method (ref. 85).
71

TableAIV. Boundary-CorrectionFactorsFromFEMfor Quarter-EllipticalCornerCrackEmanatingFromEdgeof SemicircularNotchin Platein TensionWith r/t = 1.5
a/cao.4
al.O
b2.0
_, deg0
11.2522.5
45.0
67.578.8
84.9
88.090.0
0
11.25
22.545.0
67.5
78.8
84.9
88.090.0
3.0
9.0
18.0
27.0
36.045.0
54.0
63.0
72.078.0
82.0
88.089.3
0.2
1.553
1.551
1.6682.091
2.634
2.9823.172
3.251
2.977
2.9242.861
2.796
2.8253.044
3.251
3.395
3.456
3.040
2.1282.080
2.037
1.993
1.956
1.906
1.85I1.810
1.795
1.7721.804
1.879
1.945
a/t0.5
1.459
1.433
1.508
1.8312.352
2.773
3.0593.219
3.009
2.521
2.4492.370
2.395
2.685
2.9653.163
3.263
2.902
1.932
1.8961.866
1.819
1.783
1.744
1.719
1.6961.686
1.693
1.708
1.8241.910
0.8
1.736
1.6591.666
1.839
2.3922.877
3.292
3.6003.491
2.585
2.465
2.2912.166
2.548
2.961
3.2593.429
3.122
1.852
1.813
1.764
1.7101.672
1.645
1.613
1.605
1.6111.643
1.689
1.8041.876
aNodal-foree method (ref. 84).bEquivalent-domain integral method (ref. 85).
72

Appendix B
Three-Dimensional Weight-FunctionAnalyses of Surface and Corner Cracksat Semicircular Notch
In thefollowingsections,the3DWFM is brieflydescribedforsolvinggeneral3Dcrackconfigurations.Themethodwasusedto determinethestressinten-sity factordistributionfor a rangeof surface-andcorner-crackconfigurationsat a semicircularedgenotchin a platesubjectedto remotetensileloading.
Three-DimensionalWeight-FunctionMethod
The3DWFMthat wasdevelopedin references39and 40 wasbasedon a combinationof the slice-synthesisprocedure(refs.41-43)andthegeneralex-pressionsfor 2D weightfunctions. (Seerefs.44-46.) In the 3Dweight-functionanalysis,the actualcrackedpart is discretizedinto two setsof orthog-analslicesof infinitesimalthicknessparallelto themajor and minor axes. The two setsof 2D sliceswith through-the-thicknesscracksareanalyzedwiththe 2DWFM. Reference47givesdetailedinforma-tion on the 2D weight-functionapproach,togetherwith numerousstressintensityfactorsolutions.Thecouplingbetweenthe twosetsof slicesis accounted
4
r/t = Ia/c = I
31 a/t = 0.2
Fs 2 o
o FEM Model A nodal force (ref. 78)
u FEM Model B nodal force (ref. 81)
1 & FEM Model C VCCT (ref. 81)
• WFM (ref. 48)
Equation (ref. 78)
O I I I
0 30 60 90
¢p, deg
Figure B1. Stress intensity boundary-correction factors forsurface crack at circular hole in plate subjected to remotetension.
restraint, which is characterized by a nondimensional
restraint area Ri (i = a or c), is made by an interpo-lation of two limiting cases of 2D weight functions--
one for zero constraint (Ri = 0), the other for fixed
constraint (t74 = oc). For an infinite, semi-infinite,
or quarter-infinite body where Ri tends to infinity,for by some unknown spring forces, which are deter- the 2D weight functions with fixed boundary condi-mined through the condition of compatibility of the
2D crack-opening displacements at the slice intersec-tions. To calculate 2D crack-opening displacements,
2D weight functions are again used. After the springforces are determined, stress intensity factors are es-
tablished for the two sets of slices. Finally, the stress
intensity factors for the actual 3D crack configura-
tion at any point along the crack front are obtained
based on a general relation between the 2D and 3Dstress intensity factors.
From the previous discussion, the key element in
the analysis is clearly the 2D weight function for the
slices. The 2D weight functions have been exten-
sively studied and their application to the present 3Dcrack configurations need modification because the
remaining area outside the sliced region will exert re-straint on the discretized slices. The basic idea used
to account for this effect is to transform the restraint
based on the uncracked part of a 3D cracked body
into a kind of elastic boundary condition on the 2D
slices. Thus, some 3D nature is built into these slices.The modified 2D weight functions for the slices are
constructed based on existing 2D weight functions.
(See refs. 44-47.) The modification that reflects the
tions are directly applied and no modifications areneeded. For a finite body, however, a reference 3D
stress intensity factor solution is needed to determine
an unknown interpolation parameter in the modified
weight function for the slices. Details of the 3D WFMare presented herein and the related 2D weight func-
tions are discussed in appendix C.
The 3D ,WFM has been applied to embedded
elliptical cracks in plates (refs. 39 and 40); semi-elliptical surface cracks in plates (ref. 40) or at circu-
lar holes (ref. 48); and quarter-elliptical corner cracksin plates (ref. 40), at a notch (ref. 50), or at a cir-
cular hole (ref. 86) subjected to mode I loading. Ofinterest to the present investigation are the results forsurface and corner cracks at holes. Typical compar-
isons among the WFM, FEM, and empirical equa-tions are shown in figures B1 and B2. Figure B1shows results for a shallow surface crack (a/t = 0.2)
in a hole with r/t = 1. The solid symbols show the
WFM results. (See ref. 48.) The open symbols showfinite-element results obtained from three different
models and two extraction methods (nodal force and
VCCT). These models and methods are discussed in
73

4
Fc 2
= o.5a/c = I
a/t = 0.2 ee_
°°"Zooo
0 _ 3 " - 0
o FEM Model A nodal force (ref. 78)1
• WFM (ref. 86)
Equation (ref. 78)
0 I I I
0 30 60 90
_, deg
Figure B2. Stress intensity boundary-correction factors forcorner crack at circular hole in plate subjected to remotetension.
appendix A. (See fig. A3.) The curve is an empiri-
cal equation developed to fit previous finite-element
results. (See ref. 78.) All analyses and the equationagreed within 3 percent for parametric angles less
than about 60 °. Near the hole surface (_2 > 60°), the
WFM and FEM results also agreed well with thosefrom models B and C. However, the FEM results
from model A (using ill-shaped elements, scc appen-
dix A) did not agree with the other results. Theequation that was fit to model A results in tile inte-
rior is about 5 percent too low near the hole surfacebased on the new results.
Comparisons for a corner crack at a hole are
shown in figure B2. Here, the WFM and FEM re-
sults did not agree, the results showing 5 to 20 per-cent differences. As discussed in appendix A, the
FEM results (model A) were based on models thathad some ill-shaped elements near the intersection of
the crack front with tile hole surface. Thus, the FEM
results are expected to be lower than the true solu-
tion for _ > 60 °. However, the WFM is expected togive higher stress intensity factors than the true solu-
tion because through-the-thickness variations in thenormal stresses were not considered. In tile current
3D WFM_ a 2D stress distribution was assumed inthe analysis; however, this assumption will cause anoverestimation in stress intensity factors for small
corner cracks. But the empirical equation (fit to
model A FEM results in the interior) is expected to
be accurate for this configuration.
The 3D }VFM can be used to compute stress in-
tensity factors for part-through cracks in arbitrary
stress fields, which may vary in both plate thicknessand width directions. This variance is actually thecase for the normal stress distributions at stress con-
centrations cvcn when the body is subjected to re-
mote uniform tension, as shown by the 3D stress
analysis results in figure 14. (See ref. 38.) Thethrough-the-thickness variation depends upon r/t.
This variation is the strongest at the hole or notch
root and gradually disappears as x/r increases. Thevariation does not affect the 3D weight function itself
for large Ri values (when no calibration is needed),
but it will affect the resulting stress intensity factors
through the crack-face loading. In the present anal-yses, the crack-face loading was taken from the 2Dstress distribution, which assumed that the normalstress distribution around tile notch root was uni-
form through the thickness. The 2D assumption wasjustified for the SENT specimens used in the cooper-
ative study (r/t = 3) because through-the-thicknessvariations in normal stresses are small, as shown in
figure 14. This small variance is especially true for a
semielIiptical surface crack in the mkldle of the platethickness. For corner cracks, however, some over-
estimation is expected for small values of a/t because
the actual stresses are several pcrcentlower than theassumed 2D stress distribution.
Modeling and Weight Functions
The crack configurations analyzed for the cooper-
ative program are shown in figures B3(a) and B3(b)for surface and corner cracks, respectively. Because
the corner-crack configuration was analyzed in a sim-
ilar manner as that for surface cracks, only the mod-
eling of the surface-crack configuration is described
herein. The detailed analyses of these crack config-
urations are given in reference 49 for surface cracksand in reference 50 for corner cracks.
The present method idealizes the cracked body
as two series of orthogonal slices of infinitesimalthickness in the y-z, or x-z plane within the major
or minor axis of the semielliptical crack, respectively,
as shown in figures B4(a) B4(d). Each slice is in a
generalized plane-stress state. One family of slices,
for example the a slices (slices parallel to the a axisof the semiellipse with a half-crack length of ax), is
set as the basic slices. The other slices, the c slices
(slices parallel to the c axis of the semiellipsc with a
half-crack length of cy), are set as the spring slices.The crack lengths for the slices are given by
ax=a 1- c (Bla)
74

2h
(a) Surface crack.
S
j ,'...
2h
(b) Corner crack.
Figure B3. Surface and corner cracks at semicircular notch subjected to remote tension.
The basic slices shown in figure B4(c), which havethe same elastic constants as the material of the
plate, are subjected to S as well as P(x, y) distrib-uted along the crack face. The spring force represents
the mechanical coupling between the adjacent basicslices because shear stress acts on the surfaces of the
slices toward the z-axis. The springs with stiffness ka
on both sides of each basic slice simulate the effect
of the restraint from Ra: the uncracked area outside
the region occupied by the basic slices and the notch.
(See fig. B4(a).)
The spring slices, figure B4(d), which have the
same Poisson's ratio as the material of the plate but
a different elastic modulus, undergo only the springforce on the crack face with the same magnitude as
but in opposite direction of those on the basic slices.
75

_E m
76
In
v
v
!
CQ
_cX
Q.In
t_
___ ov
0
_ I_ _ .m_

The springs with stiffness kc on the side of the springslices toward which the crack extends all simulate the
effect of the restraint from Re, the uncracked area
outside the region occupied by the spring slices and
the notch. (See fig. B4(b).)
The corresponding slice model for the corner-
crack configuratio n is shown in figure Bh. Therestraining areas shown in figures B4(a) and B4(b)
were expressed in a nondimensional form as follows:
Ra = 2a_ (w r 1) t_ (B2a)c c a
c c - c - 1 (B2b)
The nondimensional restraining areas in
equations (B2a) and (B2b), Ri (i = a or c), vary from
zero to infinity as functions of a/c, a/t, c/w, and r/t.
The stiffness ki (i = a or c) of the springs on the
sides of the slices shown in figures B4(c) and B4(d)is a function of restraining area. When Ri tends
to zero, ki also tends to zero, which results in the
cases shown in figures B4(e) and B4(f) for the exam-ple with a free center crack and a single-edge-notch-
crack. When R/ tends to infinity, so does ki. This
case is shown in figures B4(g) and B4(h) for the ex-ample with the collinear center cracks and double-
edge-notch cracks. These limiting conditions serve as
the upper and lower bounds of the weight functions
for the slices with a 3D nature. Thus, the weightfunctions Wi for the slices with elastic constraints
shown in figures B4(c) and B4(d) are constructed asfollows:
_Va --_ Wcotlinear -I- Ta(na) (Wfree - Wcollinear) (B3a)
Wc = Wdouble + Tc(nc) (Wsingle - Wdouble) (B3b)
where Ti(Ri) is the transition factor (i = a or c) andrepresents the transition from fixed to free bound-
ary conditions. The transition factor is an unknown
function of restraining areas that satisfy the condi-
tions T_(0) = 1 and T/(c¢) = 0.
Note that for the SENT specimens with
r/w = 1/16, the nondimensional restraint factor Ri
has large values when the surface or corner cracks aresmall. Thus, the 3D weight function in the present
analysis has been limited to a/t < 0.5 and, thus, noreference 3D solution is needed.
Herein, only the semi-infinite width plate is
considered--that is, r/w = 0. In this case, R i -- eoand equations (B3a) and (B3b) reduce to
Wa = Wcollinea r (B4a)
Wc = Wdouble (B4b)
with Wdouble = Wsingle. Now that the center-crack weight functions are replaced by those for edge
cracks, the parallel relations for the corner-crack con-figuration are also obtained. These weight functions
are available from previous work (refs. 44 and 45)
with the function f0 for the c slices replaced by the
function f(a) for an edge crack emanating from a
semicircular notch with r/w = 1/16. The function
f(c_) was obtained by substituting a(_)/S = 1 intoequation (C10). (See appendix C.) The numerical
results were then fitted to the following polynomialfor f(o_) as
f(c 0 = 1.121 - 0.711a + 1.6a 2 - 1.461a 3 + 0.508a 4 (Bh)
where a = c/r for a _< 1.
Solution Procedures
After the weight functions were found, stress in-
tensity factors for the slices were obtained according
to weight-function theory (refs. 44, 87, and 88) asfollows:
axKa(a,) = [a(x, y) - P(x, y)] Wa(Ra, az, y) dy (B6a)
_0 cyKe(%) = P(x, y) We(Re, %, x) dx (B6b)
where a(x,y) is the stress distribution induced bythe applied load along the location of the crack in
the crack-free body. For this particular configura-tion, the stress distribution was obtained by fitting
to Tan's 2D numerical solution (ref. 26) for a semi-
circular notch in a plate in remote tension. (See ap-
pendix C.) The resultant polynomial was
a(s¢) = S (3.157 - 6.731sr + 11.709{ 2 - 10.687s_3 + 3.838sr4)
(B7)where _ ----x/r. (Note that the origin of the coordi-
nate system is at the center of the crack for both the
surface and corner crack.) In the WFM, the normalstress distribution was assumed uniform through the
thickness--that is, a(x, y) = a(_). This assumptionis adequate for the r/t considered in the coopera-
tive program because the 3D variation through the
thickness is about 4-3 percent. (See ref. 38.) With
the weight functions and stress intensity factors avail-able, the crack-face displacements for the slices were
determined using procedures in references 32 and 89.
The crack-face displacements for these two series ofslices should be equal to satisfy compatibility. This
condition leads to an integral equation in terms of
77

R' a x
-p(x,y)
-_ ax _--
,_---- t -----_
T2h
iS
--_l<r _--c-_ w
r_ 2h
1
-P(x,y)
-_ axI_-___--t
S
r --__
S
-P(x,y)
,_--- t ---_
S
r_
Figure B5. Slice model for corner crack at notch. Basic slices: (a), (c), (e), and (g); spring slices: (b), (d), (f), and (h).
78

Y
aTI= C _-I
X
Y
Ta
l a×
ID ×
(a) a/c < 1.
Figure B6. Definition of _ and crack length for slices.
(b) a/c > 1.
the unknown spring force on the crack faces. The
integral equations were reduced to multiple linear
equations by expression of the spring force as aspecial kind of polynomial with unknown coefficientsas
• •
+o,(x)
"_- OQ3 (X)4-_O14 (Y) 4] (SS)
where aj is a known reference stress and ai are un-known coefficients. Substituting equation (B8) intoequations (B6a) and (B6b) gives multiple linear equa-
tions. These equations were solved by a regression
scheme to determine the values of ai. (See refs. 39,40, 49, and 50 for details.)
Now that the spring force has been determined,
the stress intensity factors for the slices were ob-
tained from equations (B6a) and (B6b). Then thestress intensity factor at _ (fig. B6) for a semi-
elliptical surface crack or for a quarter-elliptical cor-
ner crack was obtained from the following equationderived in references 39 and 40:
K(_)= {K4a(ax)+ [Kc(cy ) E 14_ 1/4 (-1) TMJ(B9)
where m -- 1 for Ka <_ 0 and Kc _< 0, m -- 2 for
Ka > 0 and Kc > 0; fl -- v for _9 < 90 ° , _ = 0°
for _ = 90 ° for the surface crack; and rI = u for
0° < _, < 90 ° , r] = 0° for _ = 0 ° and 90 ° for thecorner crack.
Finite-Width Effect
The weight functions previously obtained were for
a plate of semi-infinite width r/w = 0. For a finite-width plate, a nonvanishing transition factor should
generally be used in the weight-function expressions.
(See eqs. (B3a) and (B3b).) The determination of thetransition factor requires a 3D reference solution for
the finite-width plate. For the surface- and corner-
crack specimens considered in the cooperative pro-
gram, r/w = 1/16. However, the effect of the transi-tion factor on stress intensity factors for surface-crack
configurations considered herein is small based on ex-
perience with embedded elliptical cracks for which
the transition factor is known. (See refs. 39 and 40.)Thus, the effect of the transition factor was neglected.The effect of the transition factor on stress inten-
sity factors for corner cracks was Mso neglected based
on experience with other corner-crack configurations.
However, for deep, low a/c corner cracks, some dif-ferences may be observed. For example, for the case
of a/c = 0.4 with a/t -- 0.5, stress intensity factorsdetermined by the WFM for r/w = 0 are estimated
to be about 6 percent lower than those for a plate
with r/w = 1/16.
Results and Discussion
Application of the WFM (refs. 39, 40, and 48)
has shown that for an embedded elliptical crack in
an infinite solid, the WFM reproduced the exact
solutions (ref. 90) for stress intensity factors andcrack-face displacements for the uniform crack-face
79

4
3
Fs 2 WFM2.78 o
3.20 a
a/t = 0.2
a/c = I
Equation (D3)
o
0 I I I
0 30 60 90
_p, deg
Figure B7. Stress intensity boundary-correction factors forsurface crack at notch in plate subjected to remote tensionfor two values of r/t.
4
3
Fc 2
..j°
r/t WFM
1.39 o
1.60 []
a/t = 0.2
a/c = I
Equation (D17)
, I I I
0 30 60 90
_#, deg
Figure BS. Stress intensity boundary-correction factors forcorner crack at notch in plate subjected to remote tensionfor two values of r/t.
pressure case. The stress intensity factor solutionalso agreed within 2 percent of the exact solution
for a nonuniform crack-face pressure. (See ref. 91.)
For the same crack configurations in finite plates,
the weight-function results obtained by the present
method agreed well with Newman and Raju's finite-element solutions. (See ref. 78.) For two symmetricalsurface cracks at a hole, the weight-function solutions
were well within 5 percent of Newman and Raju's
finite-element solutions (ref. 78), except in the regionnear the hole surface and in a few cases at the
sharp curvature for low a/c cracks. For a singlesurface crack at a hole, the agreement between the
weight-function results and Grandt's solutions by the
finite-element alternating method (ref. 92) was also
generally very good.
and 1.6. These values were selected to match the
nominal ones used in the cooperative test program.For each configuration, the crack configurations con-
sidered were a/c= 0.2, 0.4, 1, and 2 with a/t = 0.05,
0.2, and 0.5. The results are given in tables BI BIV.
Typical comparisons for the surface- and corner-crack configurations are given in figures B7 and B8,
respectively. These figures show the slight variation
caused by the small differcnce in the r/t values. Thecurves show results from the stress intensity factor
equations that were developed in appendix D. Atthe intersection of the crack with the notch surface
(T = 90°), the equation is 2 to 3 percent lower thanthe WFM solutions. The agreement between the
equation and SVFM solutions is better away from thefree surface.
The WFM is very efficient in modeling and in
calculating stress intensity factors. Computations
are readily made on a personal computer (PC). The
calculation for each set of configuration parametersrequired less than 3 minutes for each load case on
a model 286 PC (with 80287 coprocessor). After
the basic displacement information is obtained for
a set of configuration parameters for one load case,the stress intensity factors for any other load case
The WFM was used to calculate the stress in-
tensity factors for semielliptical surface cracks andquarter-elliptical corner cracks at a semicircular
notch in a plate subjected to remote tensile load-
ing. These configurations are shown in figures B3(a)
and B3(b). Poisson's ratio was assumed to be 0.3.
(Note that stress intensity factors determined by theWFM are independent of Poisson's ratio for trac-
tion boundary conditions.) For the surface crack, for the same configuration may be obtained in a fewr/t = 2.78 and 3.2; for the corner =crack, r/t = 1.39 Seconds. IK
80

TableBI. Boundary-CorrectionFactorsFromV_TMforSemiellipticalSurfaceCrackEmanatingFromCenterof SemicircularNotchin Platein TensionWith tit = 2.78
a/c0.2
0.4
1.0
2.0
_p, deg0.1
11.3
22.5
33.845.0
56.3
67.5
75.0
82.586.2
89.9
0.1
11.3
22.5
33.845.0
56.3
67.5
75.0
82.586.2
89.9
0.1
11.3
22.533.8
45.0
56.367.5
75.0
82.5
86.289.9
0.1
11.3
22.5
33.845.0
56.3
67.5
75.082.5
86.2
89.9
0.05
1.192
1.419
1.772
2.096
2.395
2.6602.881
3.015
3.170
3.2653.054
1.844
1.952
2.163
2.399
2.6442.871
3.056
3.174
3.334
3.4443.230
3.150
3.182
3.199
3.2093.240
3.294
3.3573.432
3.593
3.722
3.5312.330
2.327
2.287
2,2132.114
2.004
1.895
1.853
1.8871.946
1.859
a/t0.2
0.8471.027
1.284
1.550
1.833
2.1262.422
2.636
2.902
3.062
2.914
1.507
1.6111.793
2.019
2.276
2.5362.779
2.946
3.157
3.2873.106
2.891
2.9292.954
2.984
3.0413.125
3.223
3.3223.499
3.631
3.452
2.2292.228
2.194
2.131
2.046
1.9511.857
1.824
1.862
1.9221.838
0.5
0.629.799
.981
1.205
1.469
1.745
2.0422.303
2.697
2.959
2.919
1.190
1.2961.440
1.645
1.905
2.1892.495
2.730
3.026
3.2003.069
2.534
2.58O2.616
2.678
2.7792.912
3.075
3.2213.437
3.580
3.424
2.071
2.075
2.0522.010
1.951
1.882
1.8161.801
1.852
1.9151.837
81

TableBII. Boundary-CorrectionFactorsFromWFM for SemiellipticalSurfaceCrackEmanatingFromCenterof SemicircularNotchin Platein TensionWith r/t = 3.2
a/c _, deg0.2
0.4
1.0
2.0
0.1
11.3
22.5
33.845.0
56.3
67.575.0
82.5
86.2
89.9
0.1
11.322.5
33.8
45.056.3
67.575.0
82.5
86.2
89.9
0.1
11.322.5
33.8
45.056.3
67.5
75.0
82.5
86.289.9
0.1
11.3
22.5
33.845.0
56.3
67.5
75.0
82.586.2
89.9
Fs- K
a/t0.05
1.216
1.446
1.805
2.1322.430
2.693
2.908
3.0363.186
3.277
3.063
1.862
1.971
2.1832.420
2.6642.889
3.071
3.1863.345
3.453
3.238
3.163
3.1953.212
3.220
3.250
3.3033.364
3.438
3.599
3.7283.536
2.335
2.332
2.292
2.2172.117
2.007
1.898
1.855
1.8881.947
1.860
0.2
0.8871.072
1.341
1.618
1.9072.202
2.493
2.698
2.9503.099
2.941
1.556
1.660
1.8482.077
2.334
2.5922.828
2.988
3.1913.318
3.132
2.935
2.971
2.996
3.0233.077
3.1563.249
3.344
3.520
3.651
3.470
2.2472.246
2.211
2.146
2.059
1.961
1.8651.830
1.868
1.9281.843
0.5
0.663
.8351.030
1.263
1.532
1.8182.128
2.393
2.777
3,0252.958
1.241
1.347
1.500
1.7141.981
2.271
2.5772.806
3.092
3.260
3.117
2.6112.657
2.693
2.7512.848
2.977
3.131
3.271
3.4823.624
3.463
2.1092.112
2.088
2.042
1.979
1.906
1.835
1.8161.865
1.928
1.849
82
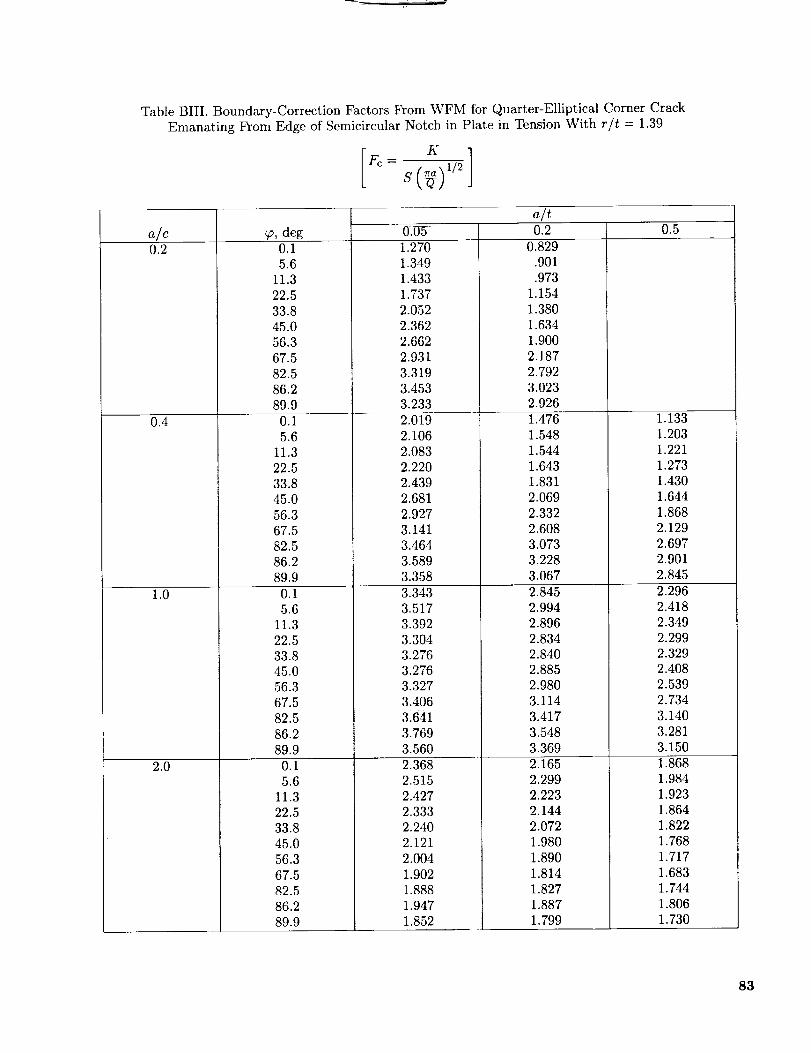
TableBIII. Boundary-CorrectionFactorsFromWFMfor Quarter-EllipticalCornerCrackEmanatingFromEdgeof SemicircularNotchin Platein TensionWith r/t = 1.39
K
E sl /lJ la/c0.2
0.4
1.0
2.0
_, deg0.15.6
11.3
22.5
33.845.0
56.3
67.5
82.586.2
89.9
0.1
5.6
11.322.5
33.8
45.0
56.3
67.582.5
86.2
89.9
0.1
5.611.3
22.5
33.845.0
56.3
67.5
82.5
86.289.9
0.1
5.6
11.322.5
33.8
45.0
56.3
67.582.5
86.2
89.9
0:05
1.2701.349
1.433
1.737
2.0522.362
2.662
2.931
3.319
3.4533.233
2.019
2.106
2.083
2.220
2.4392.681
2.927
3.141
3.4643.589
3.358
3.343
3.517
3.392
3.3043.276
3.2763.327
3.406
&641
3.769
3.560
2.3682.515
2.427
2.3332.240
2.121
2.004
1.902
1.888
1.9471.852
a/t0.2
0.829
.901
.973
1.154
1.380
1.6341.900
2.187
2.792
3.023
2.926
1.476
1.5481.544
1.643
1.831
2.O692.332
2.608
3.073
3.2283.067
2.8452.994
2.896
2.834
2.8402.885
2.9803.114
3.417
3.548
3.369
2.165
2.2992.223
2.144
2.072
1.9801.890
1.814
1.827
1.887
1.799
0.5
1.133
1.203
1.2211.273
1.430
1.644
1.8682.129
2.697
2.901
2.845
2.296
2.4182.349
2.299
2.3292.408
2.539
2.734
3.140
3.2813.150
1.868
1.984
1.923
1.8641.822
1.768
1.717
1.6831.744
1.806
1.730
83

TableBIV. Boundary-CorrectionFactorsFromWFM for Quarter-EllipticalCornerCrackEmanatingFromEdgeof SemicircularNotchin Platein TensionWith r/t = 1.6
a/c0.2
0.4
1.0
2.0
_, deg0.15.6
11.3
22.5
33.8
45.056.3
67.5
82.5
86.289.9
0.1
5.611.3
22.5
33.8
45.0
56.367.5
82.586.2
89.9
0.1
5.6
11.3
22.533.8
45.0
56.3
67.5
82.586.2
89.9
0.1
5.6
11.322.5
33.8
45.0
56.367.5
82.5
86.2
89.9
a/t0.05 0.2 0.5
1.313
1.394
1.479
1.793
2.1132.425
2.722
2.982
3.3523.480
3.253
2.056
2.1452.120
2.260
2.478
2.7202.962
3.171
3.4863.609
3.375
3.370
3.545
3.4193.329
3.299
3.296
3.345
3.4213.652
3.780
3.570
2.378
2.5252.437
2.342
2.2482.127
2.010
1.906
1.890
1.950
1.854
0.870
.941
1.013
1.2071.442
1.703
1.979
2.2762.866
3.082
2.966
1.5381.611
1.605
1.711
1.9052.147
2.412
2.6843.132
3.283
3.111
2.919
3.0722.970
2.905
2.907
2.946
3.0363.162
3.454
3.5853.401
2.1982.334
2.256
2.175
2.1002.004
1.910
1.8291.838
1.898
1.808
1.1851.255
1.269
1.3301.491
1.708
1.9412.214
2.779
2.976
2.897
2.3852.511
2.438
2.389
2.418
2.4962.626
2.816
3.207
3.3473.206
1.9252.044
1.980
1.919
1.8721.813
1.755
1.7141.767
1.829
1.749
84

Appendix C
Two-Dimensional Weight-Function andBoundary-Force Analyses
The 2D WFM and the BFM areusedto ana-lyzethroughcracksin arbitrarilyshapedbodiesforvariousin-planeloadingconditions.Brief descrip-tionsof thesemethodsaregivenherein.TheBFMwasusedin the cooperativeprogramto analyzeathroughcrackemanatingfromthesemicircularnotchof aplatefor remotetension.TheBFManalysiswasmadeon theSENTspecimensfor eitherremoteuni-formstressordisplacement.TheBFMwasalsousedto analyzetheuncrackedSENTspecimensto obtainthestressconcentrationfactorandthenormalstressdistributionalongthenetsection.Thenormalstressdistribution,togetherwith thecorrespondingstressintensityfactors,wasusedin the 2DWFM to de-rive theweightfunctionfor a crackemanatingfromanedgenotch. Theweightfunctionwasthenusedin the3DWFM to derivestressintensityfactorsforsurfaceandcornercracksat theedgenotch.A tech-niqueto extractexperimentalstressintensityfactorsfor throughcracksin the SENTspecimenwasalsoappliedto verifytheremoteboundaryconditionsonthetest specimen.Comparisonsaremadebetweenexperimentalandcalculatedstressintensityfactors.
Ft
Weight-Function Method
5
4
3
2
0
0.0
S
f
°Y h
' r
x
BFM Equ 2)
-=" 1/16 o --
0 13 --
h/w = 2I [ 1 I I
0.2 0.4 0.6 0.8 1.0
(c + r)/.
Figure C1. Stress intensity boundary-correction factors forthrough crack at notch in plate subjected to remoteuniform stress for two values of r/w.
was given by
Analytical weight functions for 2D crack configu-
rations (center and edge cracks) with finite bound- Ur(a,_) =aries have been developed in reference 44. For
simplicity, a special loading of uniform crack-face
pressure was employed as the reference solution for
which stress intensity factors are known. This ap-
proach suffices for many crack configurations. Forthe present crack configuration, however, a reference
stress intensity factor solution for uniform pressure
loading on the crack faces is not available. The ob-stacle was overcome by applying a more general ap-
proach recently developed by Wu and Carlsson. (See
ref. 47.) In this approach, the analytical weight func-tions are based on a reference solution to a poly-
nomial crack-face load ease. The derivation starts
from a reference polynomial stress distribution on the
crack faces as
O.r(_) N-- E sn_r_ (C1)
n=0
A three-term representation for the crack-face dis-
placements was assumed for this type of loading and
3 ( j-l�2
CGo
E,(2),/2 E Fj(a) 1- a_ ) (C2)j=l
where a = c/r and ( = x/r. (See insert on fig. C1.)The three unknown functions of Fj were determined
by using the following three conditions: crack-face
displacement in the immediate wake of the crack tip,self-consistency of the weight function, and vanishing
curvature along the edge crack surface at the crackmouth. The results are
F1 (a) = 4fr(a) (C3)
15 [21/27r_(c_) - FI(a)EI(a)] Fl(a)E3(a) (C4)F2(a) = 15E2(e) - 3E3(a)
Fa(a) = FI(a)E2(a) - 3121/27rgP(a) - Fl(o)E](a)] (C5)15E2(a) - 3E3(a)
where
f0 ct= :2 efT(e)de
85

and fr(a) is the dimensionless stress intensity factorfor the reference load case, commonly expressed in a
polynomial form,
for an edge crack emanating from a semicircular edge
notch (r/w = 1/16) in a rectangular plate (valid
to a = 2) is readily determined. Stress intensityfactors for an arbitrary crack-face loading a(_) can
be obtained by a simple quadrature as
K = S(rcc)l/2f (C9)
MK
fr(OZ)- S(Trc)l/2 = E Amain (C6)m=0
Based on these expressions, a general closed-form
weight function for edge cracks was obtained and was
given by
_3i(a)(1-[a) i-3/2
m(o_, _) = i=1(2 7ra)1/2
(c7)
where the functions _i(a) are given by the following
expressions:
3,(-) = 2
4of ( ) +2fr(a) + F2(a)32(a)=
93(a) =
fT( )(C8)
The only information needed for the determinationof the edge crack weight function is the stress polyno-
mial at(C) in the uncracked body from equation (C1)and the related nondimcnsional stress intensity fac-
tor fr(a). For the edge notch crack in the present
investigation, a solution for fr(a) has been obtained
by Tan, Raju, and Newman (ref. 51) using the BFM.The uncracked stress distribution along the prospec-tive crack site was also determined by the BFM (dis-
cussed later). The following two sets of polynomialequations fit, respectively, the numerical results of
Crr(_) and fr(o) within +0.2 percent and are given
by
=3.1635- 6.9765( + 14.1306(2 - 19.2171(3S
+ 16.8505( 4 - 8.9712( 5 + 2.6141(6 - 0.3182_7 (_ < 2)
fr(a) = 3.5479 7.2009a + 15.7223ct2 - 22.4661a3
+ 20.0387a 4 -- 10.5295a 5 + 2.9601a 6 0.342107 (a < 2)
(Note that these equations are valid only for r/w =
1/16.) With these two equations, the weight function
where
a-_ [_i(a)(1-- _)i-3/2] d_i=lf = f] a (CIO)
(2_ra)l/2JO
Boundary Force Method
The BFM was formulated for the two-dimensional
stress analysis of complex configurations, with andwithout cracks, subjected to internal loadings and to
traction or displacement boundary conditions. (See
refs. 26 and 51.) The BFM uses the elasticity solutionfor concentrated forces and a moment in an infinite
plate as the fundamental solution. For plates without
a crack, Muskhelishvili's solution (ref. 52) for P, Q,and _hi in an infinite plate is used as the fundamental
solution. For a plate with a crack, Erdogan's solution
(ref. 53) for a pair of concentrated forces and amoment in an infinite plate with a crack is used as
the fundamental solution. With Erdogan's solution
the crack faces need not be modeled as part of the
boundary because the stress-free conditions on thecrack faces are exactly satisfied.
Because the fundamental solution satisfies all in-
terior elasticity equations, the only remaining condi-tions to be satisfied are those on the boundary. The
specified boundary conditions are satisfied by the ap-plication of concentrated forces and moments along
an imaginary boundary traced on an infinite plate
that corresponds to the actual configuration. The
imaginary boundary is discrctized into a number ofstraight segments. At the center of each segment, a
pair of concentrated forces and a moment are appliedat a small distance from the imaginary boundary and
the region of interest. The magnitudes of these forces
and moments are determined to approximately sat-
isfy the prescribed boundary conditions.
To verify the accuracy of the method, the BFMhas been used to analyze numerous 2D crack and
notch configurations for which exact or accurate
stress and displacement solutions are available in the
literature. (See refs. 26 and 51.) The crack configu-rations considered included mode I and mixed-mode
(modes I and Ii) problems. The method produced
86

stressanddisplacementfieldsandstressintensityfac-torsthat agreedwellwith thosein the literature.Ingeneral,about 150DOF wasrequiredfor accuratesolutions(betterthan0.5percent)to complexcrackconfigurations.
The BFM wasusedto analyzethe uncrackedSENTspecimento obtainthe stressconcentrationfactorandthe normalstressdistributionalongthenet section.The BFM wasalsousedto analyzeathroughcrackemanatingfromthe SENTspecimensubjectedto eitherremoteuniformstressordisplace-ment. TheJamesandAndersontechnique(ref.54)to extractexperimentalstressintensityfactorsforthroughcracksin theSENTspecimenwasalsousedto verifytheremoteboundaryconditionsonthetestspecimen.Comparisonsaremadebetweenexperi-mentalandcalculatedstressintensityfactors.
Stress Distributions
Table CI. Stress Intensity Boundary-Correction Factorsfor Single-Edge Crack Specimen Subjected to
Remote Uniform Stress or Displacement
[Ft- KS(rc)l/2 ]
c/w0 a1.123.1 1.189
.2 1.367
.3 1.655
.4 2.108
.5 2.827
.6 4.043
.7 6.376
.8 11.99
Uniform stress Uniform displacement
h/w = 2 h/w = 2 h/w = 1.5a1.123
1.165
1.255
1.377
1.5271.705
1.913
2.166
2.507
a1.123
1.154
1.2311.294
1.418
1.532
1.7021.916
2.239
aLimiting solution from Tada, Paris, and Irwin (ref. 32).
The SENT specimen shown in figure 2 was held
by fiat-plate friction grips from the grip line to theends. The dimension of w was fixed in all specimens
to 50 mm. The height h is measured from the
specimen centerline at the notch to a specified linedrawn parallel to the grip line. Two values of h were
assumed in the analysis. One height was arbitrarilyselected as a line drawn below the optional hole
(h/w = 2), and the other was along the grip line c_r(h/w = 1.5). In the BFM analysis, uniform stress (S) 1.04or uniform displacement (v = constant, u = 0) was 1.08
applied parallel to the long dimension of the specimen 1.15
at y = +h, and zero tractions were applied elsewhere. 1.30
Analyses of the uncrackcd SENT specimen with 1.75
the BFM gave an elastic stress concentration factor 2.0
K T = O'yy/S = 3.17 for uniform stress and 3.15 3.0for uniform displacement for both values of h/w. 4.0The normal stress distribution along the specimen 6.0centerline at the notch root for remote uniform stress 8.0
is shovcn in figure 3 as the solid curve. The stress 9.6
concentration factor was about 5.5 percent higher
Table CII. Stress Intensity Boundary-Correction Factorsfor Crack Emanating From a Semicircular Edge
Notch in Specimen Subjected to RemoteUniform Stress or Displacement
[_=_; Y,=
r4-r i
0.065 I 3.276.0675 I 3.058
.0719 I 2.752
.0813 [ 2.338
.1094 [ 1.832
.125 I 1.732
.1875 I 1.638_ i 1.726
.375 I 2.160
3.011.. . 4.248
Uniform stress Uniform displacement
h/w -- 2 h/w = 2 h/w = 1.53.219
3.0302.715
2.299
1.783
1.6741.515
1.5111.627
1.822
2.022
3.1873.000
2.682
2.2691.756
1.641
1.4771.450
1.513
1.640
1.789
than that for a circular hole in an infinite plate andthe stress gradient is similar. This stress distribution where Ft is a boundary-correction factor that ac-was used in the 2D and 3D WFM to determine 2D counts for the effect of the notch and external bound-
weight functions for a crack emanating from the edge aries. The BFM was used to calculate Ft for var-
notch and 3D stress intensity factors for surface- and
corner-crack configurations. (See appendix B.)
Stress Intensity Factors
ious crack configurations and boundary conditions.
Boundary-correction factors are given in table CI for
a single-edge-crack specimen and in table CII for a
crack emanating from a semicircular edge notch ineither remote uniform stress or displacement. Equa-
The stress intensity factor for a through crack tions were then developed to fit the BFM results.
emanating from a semicircular notch subjected to The boundary-correction factor was expressed asremote uniform stress or displacement was expressed
as
K= S(Trc)l/2Ft (c, re' ;) (Cll) Ft = flg4fw (C12)
87

Thefunctionsfl and g4 were selected to accountfor the effects of the notch and are given by
fl = 1+ 0.358A + 1.425A 2 - 1.578,_ 3 + 2.156A 4 (C13)
where A = 1/[1 + (c/r)] and
0.032g4 -- Kt 0.36 (1+ c)1/2(C14)
The effects of specimen width and remote boundary
conditions were approximated by fw, the finite-width
correction, which was obtained by fitting to thecalculations from the BFM.
For h/w = 2, the correction was
fw = 1 - 0.2-r + 9.43` 2 - 19.43` 3 + 27.13 `4 (C15a)
for uniform stress and
fw = 1 + 2.772 - 3.53` 4 + 3.83` 6 (C15b)
for uniform displacement.
For h/w = 1.5,
fw = 1 + 2.17-), 2 - 3.4-_ 4 + 3.73` 6 (C15c)
for uniform displacement where 3` -- c+r TheseW
equations are valid for r/w = 1/16 and c+r-_- < 0.6.
The cracked SENT specimen was analyzed for
r/w =- 1/16 (cooperative program test specimen) andr/w = 0 (single-edge-crack specimen); these results
(symbols) are shown in figures C1 and C2 for re-
mote uniform stress and displacement (h/w =- 2),respectively. The boundary-correction factor Ft isplotted against _ The curves show the equation
tU "
(eq. (C12)) that was developed to fit these results.For r/w---0, the boundary-correction factor is also
given by equation (C12) where fl = 1, g4 = 1.123,
and fw is given by equations (C15a)-(C15c). These
results show that the remote boundary conditionshave a significant effect on the correction factors.
The boundary-correction factor equations for the
SENT specimen subjected to remote uniform stress
or displacement for h/w --- 1.5 are shown in figure C3
as dashed and solid curves, respectively. Because the
stress and displacement boundary conditions gavesuch large differences in the boundary-correction fac-
tors, the James and Anderson technique (ref. 54)
was also applied to help verify the correct externalboundary condition on the cooperative program test
specimens.
88
4
00.0 0.2 0.4
r/w BFM Equotion (C12)
1/16 o --0 [] --
h/w = 2J I I J
0.6 0.8
(c + r)/,
Figure C2. Stress intensity boundary-correction factors forthrough crack at notch in plate subjected to remoteuniform displacement for two values of r/w.
4 Equotion (C 12)
-- Uniform displocement-- Uniform stress
3 /// /ii /
Ft 2 _ ,"
Test
Smo x, MPo
o 35
" 120
r/w =1/16
h/w = 1.5
I I i • J.
0.0 0.2 0.4 0.6 0.8 1.0
(c + r)/w
Figure C3. Experimental and calculated boundary-correctionfactors for through crack at notch in plate subjected toremote stress or displacement.
Comparison of Experiments and Analyses
In the James and Anderson technique, fatigue
crack-growth rates from tests are used to determinean experimental value of the stress intensity factor
as a function of crack length. The basis for this ap-
proach is in the uniqueness of the AK against rate

(dc/dN) relationfor a materialtestedat a constantR. The point in question was whether the specimen
and grip configuration produced uniform stress or
uniform displacement conditions, and what was theeffective specimen height. Two fatigue crack-growthrate tests were conducted on 7075-T6 aluminum al-
loy SENT specimens. One test was conducted at a
low applied stress level to obtain data for a range of
ulate any slippage or wear at the higher stress levels.Crack length was measured as a function of load cy-cles at R = 0. From the crack-length-against-cycles
data, crack-growth rates and experimental values ofstress intensity were determined by using the large-crack AK-rate relation. These experimental values
are shown in figure C3 as symbols. The experimen-tal data followed the calculated curve very well for
crack lengths; the other test was conducted at a high uniform displacement for h/w = 1.5. Therefore, thestress level that was typical of the stresses used in the fw function defined by equation (C15c) was used in
cooperative test program. The latter test would sire- the test program.
89

Appendix D
Stress Intensity Factor Equations for a Surface, Corner, and Through Crack at aSemicircular Notch
Approximatestressintensityfactorequationsforasemiellipticalsurfacecrackat thecenterofasemicircularedgenotch,aquarter-ellipticalcornercrackat theedgeofthenotch,andathroughcrackat thenotchsubjectedto remoteuniformstressor uniformdisplacementfor h/w = 1.5 are given herein. These configurations arcshown in figure 13. These equations have been developed from stress intensity factors calculated from the FEM
and _VFM for surface and corner cracks (appendixes A and B, respectively), from boundary force analyses of
through cracks at a semicircular notch (ref. 51), and from previously developed equations for similar crack
configurations at an open hole. (See refs. 78 and 93.) The stress intensity factors are expressed as
K=S a a c c r r' t' r' w' t' w' _ (D1)
where K is the stress intensity factor and t is defined here as one-half the full sheet thickness for surface cracks
(j = s) and as the full sheet thickness for corner cracks (j = c). The equations have been developed for a range
of configuration parameters with r/w = 1/16.
The shape factor Q is given by
Q=l+l.464(a) 1'65a
(c -< 1) (D2a)
(c)10 (a 1)Q + 1 + 1.464 \a_ c > (D2b)
Surface Crack at a Semicircular Notch
The boundary-correction factor equation for a semielliptical surface crack at the center of a semicircular
edge notch (fig. 13(a)) subjected to remote uniform stress or displacement is
(D3)
for 0.2 <alc < 2, a/t < 1, 1 < r/t < 3.5, (c+r)/w < 0.6, r/w = 1/16, and -_r/2 < _ < 1r/2. (Here t isdefined as one-half the full sheet thickness.) For ale < 1,
A11 = 1 (D4)
g2 =
0.05
M2= f/,-a-3_2 (D5)0.11 + ,c,
0.29M3 = (D6)
0.23 + (a)3/2
gl = 1- (1 + _q) cos _o (D7)
1 + 0.358 A + 1.425 A2 - 1.578A 3 + 2.156 A4
1 + 0.08 A2 (D8)
1A (Dg)
1 + c cos (0.9_)
90

g3 ----1 + 0.1(1 --COS _)2 (1 -- a)10
7 (D10)
g4=Kr 0.36 (1+})1/2
where KT is the elastic stress concentration factor (KT --- 3.17 for uniform stress; KT = 3.15 for uniform
displacement) at the semicircular notch, and
g5=l+ 0.003(-_) +0.035 t) (1- cos _c)3 - 0.35 t)2(1-_c)3 cos_ (D12)
For uniform stress, the correction fw was
fw = 1 - 0.2 7 + 9.472 - 19.473 + 27.174 (D13a)
and for uniform displacement,fw = 1+ 2.1772- 3.474 + 3.776 (D13b)
with h/w -- 1.5 where
(a_l/2c+r7 = _-_j w
The a/t term was included in 7 to reflect the reduced influence of width on the finite-width correction for a
surface and corner crack. The function f_ is given by
f_ = COS 2 _o + sin 2 _o (D14)
For a/c > 1,
M1 = -a- (D15)
The functions M2, M3, gl, g2, A, g3, g4, g5, and fw axe given by equations (D6) (D13), respectively, and f_is given by
[{c\2 2 ]1/4-- LL )sin _ + cos 2 _o (DI6)
Corner Crack at a Semicircular Notch
The boundaxy-correction factor equation for a quarter-elliptical corner crack at the edge of a semicircular
edge notch (fig. 13(b)) in remote uniform stress or displacement is
[Fc = M1 + M2 -_ + :VI3 -[ glg2g3g4g5f_fw (D17)
for 0.2 < a/c < 2, a/t < 1, 1 < r/t < 2, (c+ r)/w < 0.6, r/w = 1/16, and 0 < _o < _r/2. (Here t is defined as
the full sheet thickness.) For a/c < 1,0.09a
M1 = 1.13- -- (D18)c
0.89(D19)
M2 = -0.54 + 0.2 + Z
1a (D20)
/VI3 = 0.5 0.65 +
91

[ (a).] (a)91=1+ 0.1+0.2 7 (1-sin_)2-0"16 7 sin_cos_ (D21)
1 + 0.358 A + 1.425 A2 - 1.578A 3 + 2.156 A4
g2 = i + 0.13_ 2 (D22)
1c (D23)
= l+_cos0.8_
a [ a]g3= (I+0.04c)[l+0.1(1-cos_) 2] 0.97 +0.03(3) 1/4 (D24)
The functions g4, g5, and fw are given by equations (Dll) (D13), respectively, and f_ is given by equa-tion (D14). For a/c > 1,
M1 = -a_ (925)
(c)4M2 = O.2 _ (D26)
M3 = -0._1 _ (D27)
gl=l+C [0.1+0.2(a) 2] (a) Csinqccosqo+0.07(l_a)(a)a t (1-sin_p)2-0'16 -/ a c 1-_- cos2_p (D28)
g3 = (1.13 0.O9c)[1+0.1(1-costa) 2] [0.97+0.03(t) 1/4] (D29)
The functions g2 and A are given by equations (D22) and (923), g4 by equation (Dll), g5 by equation (D12),fw by equation (913), and f¢ by equation (D16).
Through Crack at a Semicircular Notch
When the surface-crack length 2a reaches 2t or when the corner-crack length a reaches t, tile crack is
assumed to be a through crack of length c. The stress intensity factors for a through crack emanating from
a semicircular notch subjected to remote uniform stress or displacement are presented in appendix C. (Seeeq. (Cll).)
92

Appendix E
Specimen Machining and PolishingProcedures
Specimen Machining Procedures
The specimen blanks for the small-crack SENTand large-crack CCT specimens were sheared from
aluminum alloy sheets (about 1200 mm by 2400 mm
by supplied thickness) according to a shearing layout
diagram. The long dimension of the specimens wasparallel to the rolling direction (long dimension of
the sheet). Each specimen blank was labeled bya number with an ink marker at the end so that
refcrcnce could be made to the specimen location inthe sheet in case of questions concerning uniformity
of properties. Each sheet produced 105 SENT and
30 CCT specimens for each alloy.
A layer of material approximately 0.02 mm thick was
removed by the polishing process.
To prepare them for polishing, the inked specimennumber was removed with acetone and the specimen
number was scribed at each end of the specimen.
Next, the specimens were put into a DuPont Freon
vapor degreaser for 10 minutes, were soaked in a
detergent cleaner for 10 minutes, and finally werethoroughly rinsed in water.
To facilitate the polishing process, a specially
designed polishing rack and tank were constructed tosupport a batch of 10 specimens. The rack and tankwere fabricated from 347 stainless steel sheet and
304 stainless steel threaded rods. Ten specimens were
positioned in the rack with the semicircular notches
pointing toward the upper surface of the solution.All steps in the cleaning and polishing sequence were
performed with the specimens in the rack. About
The SENT specimens were milled to final overall 23.5 liters of solution was used in this tank with the
dimensions (50 mm wide by 300 mm long by supplied rack described above.
thickness) as shown in figure El(a). Six of thestraightest or most flat specimens were selected and
reserved for alignment specimens. (See appendix F.)
In the remaining specimens, the semicircular notchwas milled by final cuts of 0.25, 0.10, and 0.05 mm
with a newly sharpened tool to achieve a final radius
of 3.2 mm; this milling sequence was designed tominimize residual stresses in the notch. Then a hole
of 10 mm radius was punched or drilled in the grip
area at each end as shown in figure E1 to hold theSENT specimens in friction grips. Note that the hole
was oversized for the bolts used and was positioned
such that the bolt would not bear on the edge of thehole.
The CCT specimens were milled to final dimen-
sions (75 mm wide by 300 mm long by supplied thick-ness) as shown in figure El(b). The notches and
holes in the grip area were necessary for the NASA-
designed friction grips. A specimen number was in-scribed into the specimen surface at each end. Thedetails of the crack-starter notch machined in each
specimen were left to each laboratory. NASA usedthe electrical discharge machining (EDM) process to
form a central slot 5 mm long and 0.5 mm high.
Chemical Polishing Procedures
Chemical polishing of the SENT specimens wasnecessary to smooth machining marks on the semi-
The polishing process must be performed under
a fume hood capable of handling the noxious fumes
produced, especially when the specimen rack mustbc lifted from the polishing solution tank. The
composition of the polishing solution is as follows:
80 percent H3PO4 Phosphoric acid5 percent HNO3 Nitric acid
5 percent CH3CO2H Acetic acid
10 percent H20 Water
The solution was stirred and maintained between
100 ° and 105°C. Specimens were submerged in the
solution for 5 minutes, then they were agitated topermit easy removal of gaseous reaction products
from the specimen surface.
The solution was covered when not in use as the
water, nitric acid, and acetic acid can evaporate. If
the solution were to become chemically unbalanced,
the specimens would be pitted and dull rather than
bright and the material removal rates would be re-duced. The balance may be returned to the solution
by the addition of water, nitric acid, and acetic acidin a 2:1:1 ratio, as in the original formulation, until
the original solution volume is achieved.
After polishing, the specimens were rinsed inwater. A reddish cast was evident on the speci-
men surface from a copper-rich layer. This residue
was removed when the specimens were dipped in a
circular notch surface and to debur the edges of the desmutting solution of 10 percent nitric acid by vol-
notch. This process also provides further assurance ume in water for 20 seconds. The specimens were
that no significant residual stresses remained at the again rinsed in water, then alcohol; thereafter, they
notch root. Some of the specimens were weighed be- were air dried. Specimens were wrapped in paper
fore and after polishing to monitor material removal, individually for storage or shipment.
93
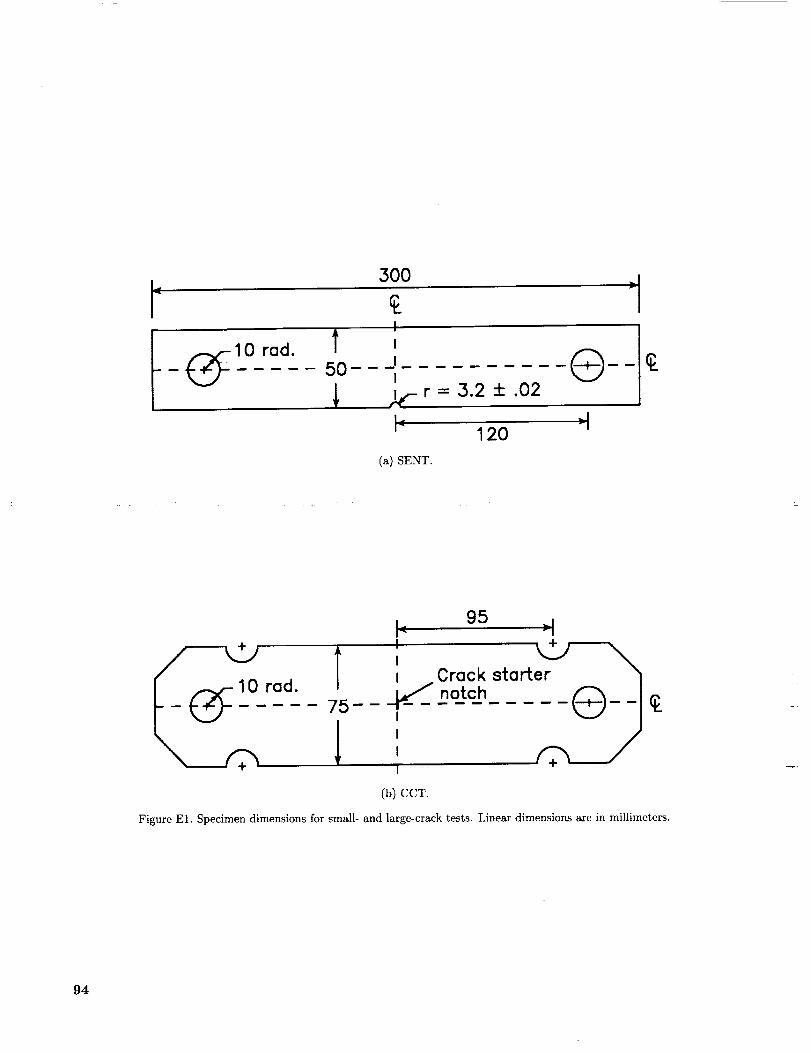
,.3OO
r _- r[
' ,,- 50 i __I
_,-- r = 3.2 -t- .02
I_ _-I120
(a) SENT.
+
rad.
I. 95 _li TM v II +
I
I___ Crack startnotch75-- I ....
I 'II
(b) CCT.
Figure El. Specimen dimensions for small- and large-crack tests. Linear dimensions are in millimeters.
94

Appendix F
Specimen Gripping and Alignment
Procedures
Specimen Grips
This appendix describes the specimen grips and
alignment procedures that were used in the coopera-
tive program. The particular set of grips was chosen
simply because of past satisfactory experience withthem during tests of 2- to 3-ram-thick specimens at
loads to 30 kN. Many other methods of gripping the
specimens would probably have been equally satisfac-
tory. Thc following paragraphs give a brief descrip-
tion of the grips and of the procedures developed tohelp ensure uniform loading on the SENT and CCT
specimens.
The grips were designed to transfer load to the
specimens by friction only. They consisted of a sin-
gle block of steel, machined into a yoke with two flatsurfaces. Each leg of the yoke had a reduced section
that gave the leg enough flexibility that the bolts
through the yokes and specimen could maintain suf-ficient pressure to grip the specimen. The specimens
were placed between these two flat surfaces with var-ious shims on both sides to ensure placement along
the center plane of the grips. Most of the shims weremetal, although the shims that bore against the spec-
imen were normally made from reinforced phenolic
plastic (generally between 0.5 to 2 mm thick). How-ever, other plastics and even brass metal have been
used successfully. The sum of the thicknesses of all
shims was such that a gap of only about 0.1 to 0.2 mmremained on each side before the bolts were tightened
to clamp the specimens in place. In addition to the
single bolt through the specimens, four other bolts,two on each side, were also used in each grip. Carewas taken so that neither of the central bolts bore
on the holes in the specimens because this pressure
could cause specimen failure in the grip area. The
goal was to transfer all load from the grips to the
specimen by friction.
Specimen Alignment Procedures
Each laboratory was required to align the test
machines and gripping fixtures to produce a nearly
uniform tensile stress field on a blank (unnotchcd)
sheet specimen. The blank specimens (50 mm wide
by 300 mm long by supplied thickness) wcre testedby strain gages as shown in figure F1. Strain gage
readings were taken at all gages. The alignment
verification procedures are as follows:
1. Zero all strain gage circuit outputs before in-
stalling the specimens in the test machine.
2. Install the specimens in the machine and read all
strain gages at 0, 5, 10, 15, and 20 kN.
3. Remove the specimens from the machine, rotate
the specimens 180 ° about the long axis, andinstall them in the new orientation. Read all
strain gages at the same loads as in step 2.
4. Compute the measures of bending strain as in-dicated in table FI and compare these computed
values with the acceptance criteria. If the spec-
imen bending strains are too large, adjust the
test machine alignment and repeat the alignment
check procedure.
Table FI. Bending Measures and Acceptance Criteria for Alignment Check
Bending measure and computation formula for--
First position Rotated position
eTM = [(el + e3 + e5) -- (e2 + ¢4 + e6)]/6
_TL = (_9 - e10)/2
_W1 = 1[(_1+ _2) - (_3 + _4)]I
ew2 ---- Ae12/Ae34
+ [(e2 + e4 + e6) -- (el + e3 + e5)]/6
+ (_8- ¢7)/2
+ (¢10- e9)/2
¢w1= I[(¢1+ e2)- (¢3+ ¢4)]1
eW2 = Ae12/Ae34
Acceptance criterion
IeTM[ < 75_ae
[eTU] < 150kte
[£TU[ < 150]_e
[eW1 [ < 200/Ae
0.95 < ew2 < 1.05
95

whereel-el0
eTM
eTU
eTL
individual strain gagc rcadings
average through-the-thicknessstrain difference at midlength
gage
average through-the-thicknessstrain difference at upper gage
average through-the-thickness
strain difference at lower gage
eWl
eW2
across-width strain difference
at midlength gage
across-width strain difference
at midlength gage
Ael2 = (el -+- e2)20 kN - (el + e2)0 kN
Ae34 = (£3 -+- e4)20 kN -- (e3 -{- e4)0 kN
Direction of strain
measurement
II I
hi -L
h/2
'I
i
7;8
,2 5,6 3,
9,10
I
I
I
I
I
I
I
Long axis
(a) Front view.
- Grip line
Strain gage 7'
Iocationsab
1
Grip line
Thickness ----
'8
1
4,6,2
'10
(b) Side view.
Figure F1. Location of strain gages on unhatched specimen used for alignment check.
96
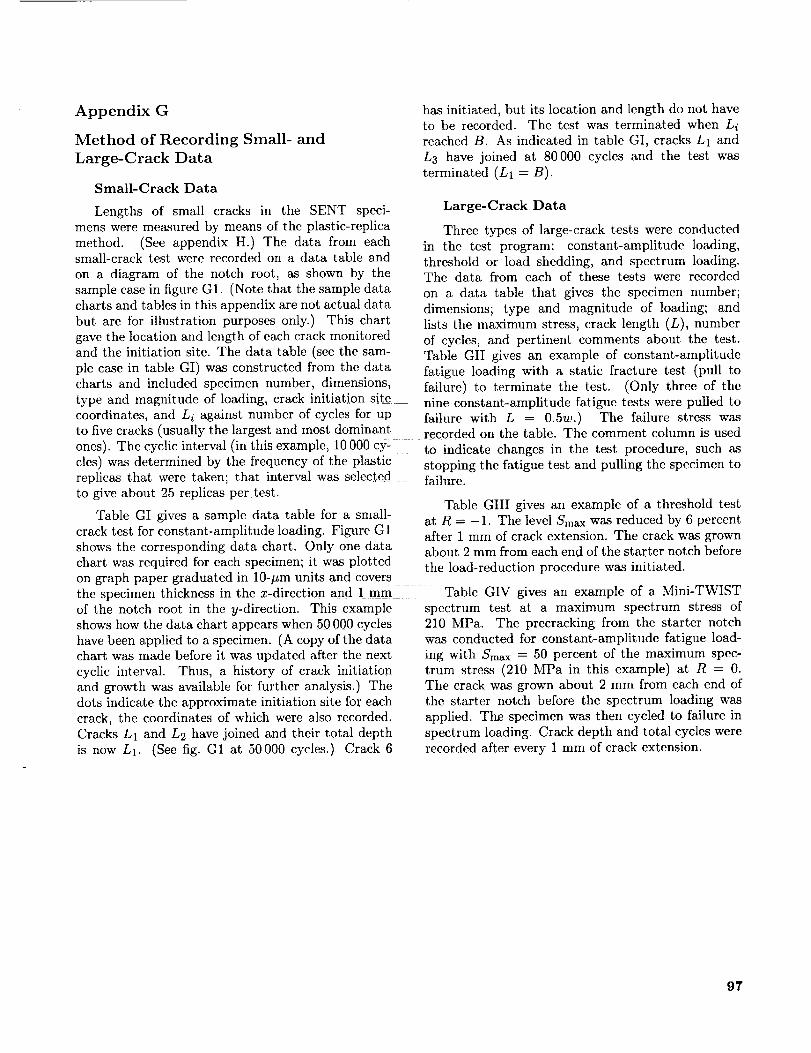
Appendix G
Method of Recording Small- andLarge-Crack Data
Small-Crack Data
Lengthsof small cracksin the SENT speci-mensweremeasuredby meansof theplastic-replica
hasinitiated,but its locationandlengthdonothavcto be recorded.The testwasterminatedwhenLi
reached B. As indicated in table GI, cracks L1 and
L 3 have joined at 80000 cycles and the test wasterminated (L1 = B).
Large-Crack Data
Three types of large-crack tests were conductedmethod. (See appendix H.) The data from each in the test program: constant-amplitude loading,small-crack test were recorded on a data table and threshold or load shedding, and spectrum loading.on a diagram of the notch root, as shown by the The data from each of these tests were recorded
sample case in figure G1. (Note that the sample datacharts and tables in this appendix are not actual data
but are for illustration purposes only.) This chart
gave the location and length of each crack monitoredand the initiation site. The data table (see the sam-
ple case in table GI) was constructed from the data
charts and included specimen number, dimensions,
type and magnitude of loading, crack initiation sitecoordinates, and L i against number of cycles for up
to five cracks (usually the largest and most dominant
on a data table that gives the specimen number;
dimensions; type and magnitude of loading; andlists the maximum stress, crack length (L), number
of cycles, and pertinent comments about the test.
Table CII gives an example of constant-amplitude
fatigue loading with a static fracture test (pull to
failure) to terminate the test. (Only three of thenine constant-amplitude fatigue tests were pulled to
failure with L = 0.5w.) The failure stress wasrecorded on the table. The comment column is used
ones). The cyclic interval (in this example, 10 000 cy- to indicate changes in the test procedure, such as
cles) was determined by the frequency of the plastic stopping the fatigue test and pulling the specimen toreplicas that were taken; that interval was selected failure.to give about 25 replicas per test.
Table GI gives a sample data table for a small-
crack test for constant-amplitude loading. Figure C1shows the corresponding data chart. Only one data
Table GIII gives an example of a threshold test
at R = -1. The level Smax was reduced by 6 percentafter 1 mm of crack extension. The crack was grownabout 2 mm from each end of the starter notch before
chart was required for each specimen; it was plottcd the load-reduction procedure was initiated.on graph paper graduated in 10-#m units and covers :
the specimen thickness in the x-direction and 1 mm Table GIV gives an example of a Mini-TWISTof the notch root in the y-direction. This example
shows how the data chart appears when 50 000 cycles
have been applied to a specimen. (A copy of the datachart was made before it was updated after the next
cyclic interval. Thus, a history of crack initiationand growth was available for further analysis.) The
dots indicate the approximate initiation site for each
crack, the coordinates of which were also recorded.Cracks L1 and L2 have joined and their total depth
is now L1. (See fig. C1 at 50 000 cycles.) Crack 6
spectrum test at a maximum spectrum stress of210 MPa. The precracking from the starter notchwas conducted for constant-amplitude fatigue load-
ing with Smax ---- 50 percent of the maximum spec-trum stress (210 MPa in this example) at R -- 0.
The crack was grown about 2 mm from each end ofthe starter notch before the spectrum loading was
applied. The specimen was then cycled to failure in
spectrum loading. Crack depth and total cycles were
recorded after every 1 mm of crack extension.
97

Y, mm
Specimen Number: B101 Cycles: 50 000
1.0
0.5
0.5 1.0 1.5 2.0 2.3X, mm
Figure (]1. Sample data chart for small:crack test B101 at N = 50 000 cycles. See table (3I.
98
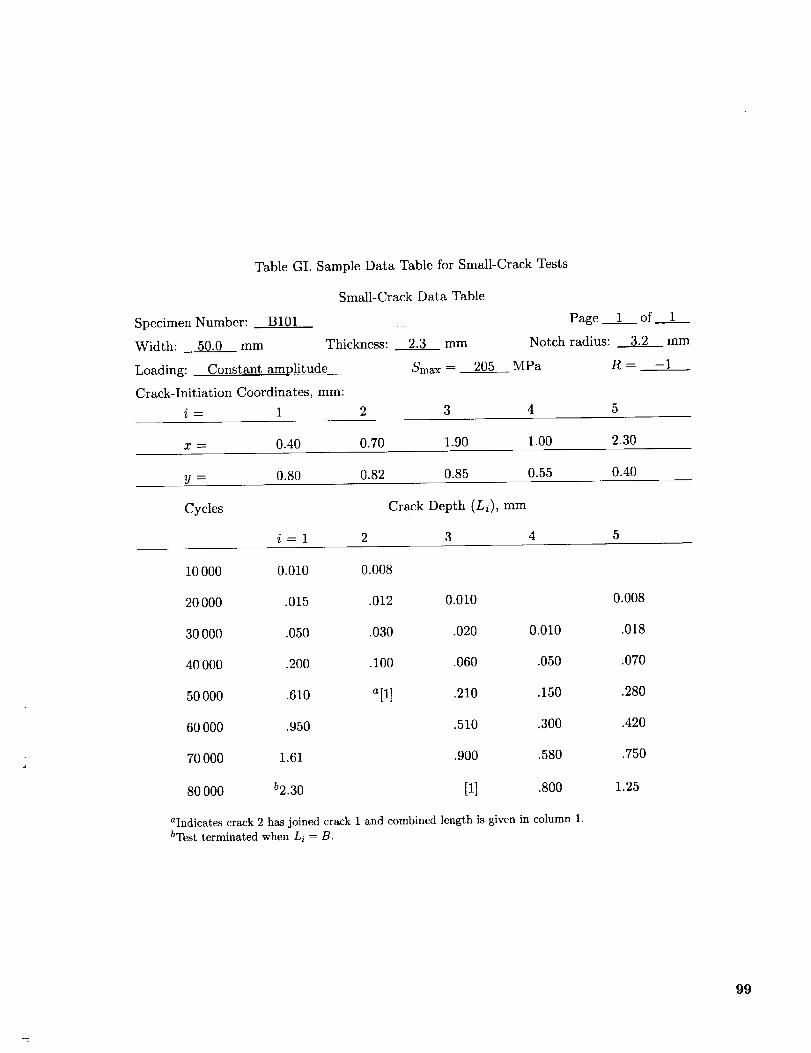
Table GI. Sample Data Table for Small-Crack Tests
Small-Crack Data Table
Specimen Number: B101 Page 1 of 1
Width: 50.0 mm Thickness: 2.3 mm Notch radius: 3.2 mm
Loading: Constant am_)litude Smax -- 205 MPa R = -1
Crack-Initiation Coordinates, mm:
i= 1 2 3 4 5
x = 0.40 0.70 1.90 1.00 2.30
y = 0.80 0.82 0.85 0.55 0.40
Cycles Crack Depth (Li), mm
i=1 2 3 4 5
10000 0.010 0.008
20000 .015 .012 0.010 0.008
30000 .050 .030 .020 0.010 .018
40 000 .200 .100 .060 .050 .070
50000 .610 a[1] .210 .150 .280
60000 .950 .510 .300 .420
70000 1.61 .900 .580 .750
80000 b2.30 [1] .800 1.25
aIndicates crack 2 has joined crack 1 and combined length is given in column 1.bTest terminated when Li = B.
99

TableGII. SampleDataTableforLarge-Crack(CCT)Constant-AmplitudeFatigueandStaticFractureTests
Large-CrackDataTable
SpecimenNumber: B614 Page 1 of 1
Width: 75.0 mm Thickness: 2.3 mm
Loading: Constant amplitude Smax = 175 MPa R = 0.5
Smax, MPa Cycles L, mm Comments
175 0 5.00
15 000 5.10
30 000 5.27
40 000 5.53
175 500 20.50
194 300 25.30
175 215 300 37.50 Stopped test
248.3 37.50 Pulled to failure
100

TableGIII. SampleDataTableforLarge-Crack(CCT)ThresholdTest
Large-CrackDataTable
SpecimenNumber: B601Width: 75.0 mm Thickness: 2.3 mm
Loading: Threshold test Smax =- __
Smax, MPa Cycles L, mm
Page. 1 of 2
MPa
Comments
100 0 5.03
100 12 000 6.07
100 25 000 7.18
100 34 500 9.00
94 57 000 10.00
88.4 67 000 11.00
47.6 1 207 000 21.00
(Test continued)
Precracking
Load reduction
I01

TableGIV. SampleDataTablefor Large-Crack(CCT)SpectrumTest
Large-CrackDataTable
SpecimenNumber: B3.15Width: 75.0 mm Thickness:
Loading: Mini-TWIST
Smax, MPa Cycles
Page 1
2.3 mm
Smax = 210 MPa R = __
L, mm Commentsa105 0 5.02
105 5000 5.O5
105 10000 6.13
105 12000 9.00
210 0 b9.00
210 20000 10.00
210 35000 11.02
210 87650 20.20
87870
aSmax --_ 50 percent of maximum spectrum stress and R = 0.bRecord measurements at about every 1-mm increment.
Fatigue precracking
Spectrum applied
Specimen failed
of 1
102
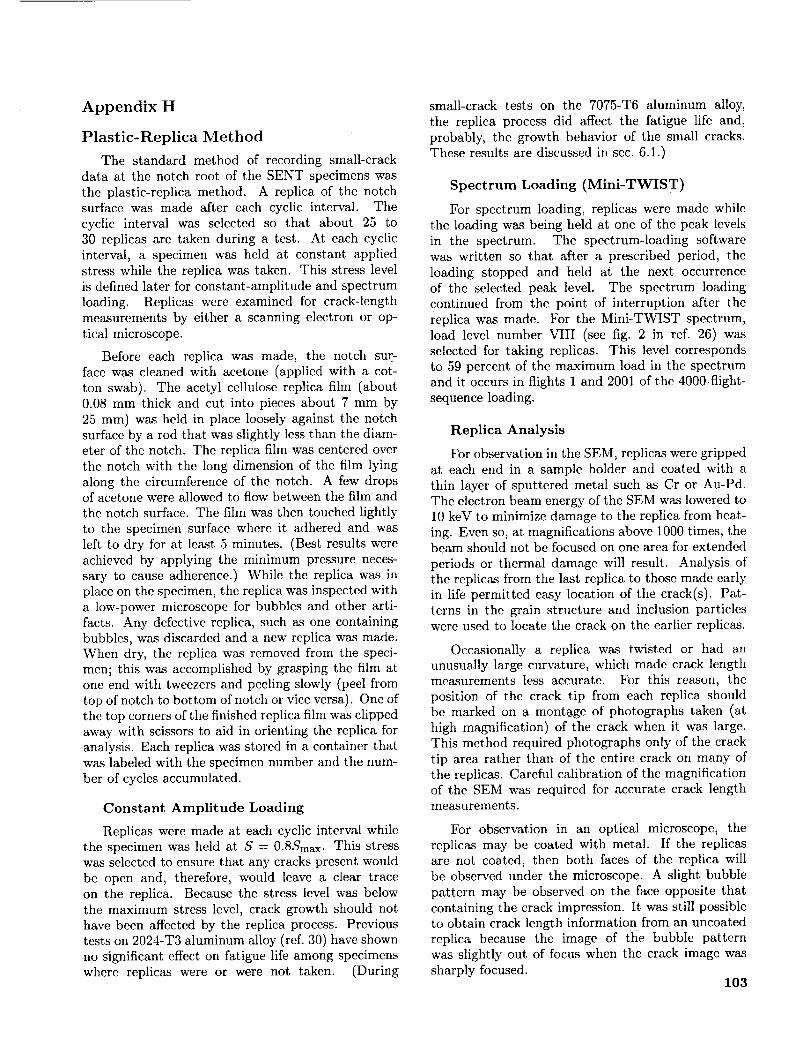
Appendix H
Plastic-Replica Method
The standard method of recording small-crack
data at the notch root of the SENT specimens was
the plastic-replica method. A replica of the notchsurface was made after each cyclic interval. The
cyclic interval was selected so that about 25 to
30 replicas are taken during a test. At each cyclicinterval, a specimen was held at constant applied
stress while the replica was taken. This stress level
is defined later for constant-amplitude and spectrum
loading. Replicas wcrc examined for crack-lengthmeasurements by either a scanning electron or op-
tical microscope.
Before each replica was made, the notch sur-
face was cleaned with acetone (applied with a cot-
ton swab). The acetyl cellulose replica film (about0.08 mm thick and cut into pieces about 7 mm by
25 mm) was held in place loosely against the notchsurface by a rod that was slightly less than the diam-
eter of the notch. The replica film was centered over
the notch with the long dimension of the film lying
along the circumference of the notch. A few dropsof acetone were allowed to flow between the film and
the notch surface. The film was then touched lightly
to the specimen surface where it adhered and was
left to dry for at least 5 minutes. (Best results wcre
achieved by applying the minimum pressure neces-
sary to cause adherence.) While the replica was inplace on the specimen, the replica was inspected with
a low-powcr microscope for bubbles and other arti-
facts. Any defective replica, such as one containingbubbles, was discarded and a new replica was me,de.
When dry, the replica was removed from the speci-
men; this was accomplished by grasping the film atone end with tweezers and peeling slowly (peel from
top of notch to bottom of notch or vice versa). One of
the top corners of the finished replica film was clipped
away with scissors to aid in orienting the replica foranalysis. Each replica was stored in a container that
was labeled with the specimen number and the num-
ber of cycles accumulated.
Constant Amplitude Loading
Replicas were made at each cyclic interval whilethe specimen was held at S = 0.8Smax. This stresswas selected to ensure that any cracks present would
be open and, therefore, would leave a clear trace
on the replica. Because the stress level was belowthe maximum stress level, crack growth should not
have been affected by the replica process. Previous
tests on 2024-T3 aluminum alloy (ref. 30) have shown
no significant effect on fatigue life among specimenswhere replicas were or were not taken. (During
small-crack tests on the 7075-T6 aluminum alloy,
the replica process did affect the fatigue life and,
probably, the growth behavior of the small cracks.These results are discussed in sec. 6.1.)
Spectrum Loading (Mini-TWIST)
For spectrum loading, replicas were made while
the loading was being held at one of the peak levels
in the spectrum. The spectrum-loading softwarewas written so that after a prescribed period, thc
loading stopped and held at the next occurrenceof the selected peak level. The spectrum loading
continued from the point of interruption after the
replica was made. For the Mini-TWIST spectrum,load level number VIII (sec fig. 2 in ref. 26) was
selected for taking replicas. This level corresponds
to 59 percent of the maximum load in the spectrum
and it occurs in flights 1 and 2001 of the 4000-flight-
sequence loading.
Replica Analysis
For observation in the SEM, replicas were gripped
at each end in a sample holder and coated with a
thin layer of sputtered metal such as Cr or Au-Pd.The electron beam energy of the SEM was lowered to
10 keV to minimize damage to the replica from heat-
ing. Even so, at magnifications above 1000 times, thebeam should not be focused on one area for extended
periods or thermal damage will result. Analysis of
the replicas from the last replica to those made carlyin life permitted easy location of the crack(s). Pat-
terns in the grain structure and inclusion particles
were used to locate the crack on the earlier replicas.
Occasionally a replica was twisted or had an
unusually large curvature, which made crack lengthmeasurements less accurate. For this reason, the
position of the crack tip from each replica shouldbe marked on a montage of photographs taken (at
high magnification) of the crack when it was large.This method required photographs only of the crack
tip area rather than of the entire crack on many of
the replicas. Careful calibration of the magnificationof the SEM was required for accurate crack lengthmeasurements.
For observation in an optical microscope, the
replicas may be coated with metal. If the replicasare not coated, then both faces of the replica willbe observed under the microscope. A slight bubble
pattern may be observed on the face opposite that
containing the crack impression. It was still possible
to obtain crack length information from an uncoatedreplica because the image of the bubble pattern
was slightly out of focus when the crack image was
sharply focused.103

References
1. Pearson, S.: Initiation of Fatigue Cracks in Commercial
Aluminum Alloys and the Subsequent Propagation of
Very Short Cracks. Eng. Fract. Mech., vol. 7, no. 2,
June 1975, pp. 235 247.
2. Kitagawa, H.; and Takahashi, S.: Applicability of Frac-
ture Mechanics to Very Small Cracks or the Cracks in
the Early Stage. Proceedings of the Second International
Conference on Mechanical Behavior of Materials, Ameri-
can Soc. for Metals, 1976, pp. 627-631.
3. E1 Haddad, M. H.: A Study of the Growth of Short
Fatigue Cracks Based on Fracture Mechanics. Ph.D.
Thesis, Univ. of Waterloo, Aug. 1978.
4. El Haddad, M. H.; Dowling, N. E.; Topper, T. H.; and
Smith, K. N.: J Integral Application for Short Fatigue
Cracks at Notches. Int. J. Fract., vol. 16, no. 1, Feb. 1980,
pp. 15 30.
5. Broek, D.: The Propagation of Fatigue Cracks Emanating
Prom Holes. NLR-TR-72134-U, National Aerospace Lab.
Amsterdam (Netherlands), Nov. 1972.
6. Morris, W. L.; James, M. R.; and Buck, O.: Growth Rate
Models for Short Surface Cracks in A12219-T851, ASME
Trans.: Phys. MetaU. _ Mater. Sci., vol. 12A, Jan. 1981,
pp. 57-64.
7. Hudak, S. J., Jr.: Small Crack Behavior and the Predic-
tion of Fatigue Life. J. Eng. Mater. _ Technol., vol. 103,
Jan. 1981, pp. 26 35.
8. Nisitani, H.; and Takao, K.-I.: Significance of Initiation,
Propagation, and Closure of Microcracks in High Cycle
Fatigue of Ductile Metals. Eng. Fract. Mech., vol. 15,
no. 3 4, 1981, pp. 445 456.
9. Schijve, J.: Difference Between the Growth of Small
and Large Fatigue Cracks--The Relation to Threshold
K-Values. Fatigue Thresholds Fundamentals and Engi-
neering Applications, VotumeII, J. B_icklund, A. F. Blom,
and C. J. Beevers, eds., Engineering Materials Advisory
Services Ltd., 1982, pp. 881-908.
10. Taylor, D.; and Knott, J. F.: Fatigue Crack Propaga-
tion Behavior of Short Cracks--The Effect of Microstruc-
ture. Fatigue Eng. Mater. _ Struct., vol. 4, no. 2, 1981,
pp. 147--155.
I1. Leis, B. N.; and Forte, T. P.: Fatigue Growth of Initially
Physically Short Cracks in Notched Aluminum and Steel
Plates. Fracture Mechanics: Thirteenth National Sympo-
sium, R. Roberts, ed., Spec. Tech. Publ. 743, American
Soc. for Testing & Materials, 1981, pp. 100 124.
12. Lankford, J.: The Growth of Small Fatigue Cracks in
7075-T6 Aluminum. Fatigue Eng. Mater. _ Struct.,
vol. 5, no. 3, 1982, pp. 233-248.
104
13. _Vood, H. A.; Rudd, J. L.; and Potter, J. M.: Evaluation
of Small Cracks in Airframe Structures. Some Considera-
tions on Short Crack Growth Behaviour in Aircraft Struc-
tures, AGARD-R-696, Mar. 1983, pp. 1-1 1-12. (Avail-
able from DTIC as AD A130 952.)
i4. Anstee, R. F. W.; and Edwards, P. R.: A Review of
Crack Growth Threshold and Crack Propagation Rates
at Short Crack Lengths. Some Considerations on Short
Crack Growth Behaviour in Aircraft Structures, AGARD-
R-696, Mar. 1983, pp. 2-1 2-12.
15. Behaviour of Short Cracks in Airframe Components.
AGARD-CP-328, Apr. 1983. (Available from DTIC as
AD A131 159.)
16. Leis, B. N.; Kanninen, M. F.; Hopper, A. T.; Ahmad, J.;
and Broek, D.: A Critical Review of the Short Crack
Problem in Fatigue. AFVCAL-TR-83-4019, U.S. Air Force,
Jan. 1983. (Available from DTIC as AD A131 349.)
17. Miller, K. J.; and De Los Rios, E. R., eds.: The Behaviour
of Short Fatigue Cracks. Mechanical Engineering Publi-
cations (London), 1986.
18. Ritchie, R. O.; and Lankford, J., eds.: Small Fatigue
Cracks. Metallurgical Soc., Inc., 1986.
19. Newman, J. C., Jr.; and Edwards, P. R.: Short-Crack
Growth Behaviour in an Aluminum Alloy -An AGARD
Cooperative Test Programme, AGARD-R-732, Dec. 1988.
20. Edwards, P. R.; and Newman, J. C., Jr., compilers: Short-
Crack Growth Behaviour in Various Aircraft Materials.
AGARD-R-767, Aug. 1990.
21. Newman, J. C., Jr.: Fracture Mechanics Parameters
for Small Fatigue Cracks. Small-Crack Test Methods,
James M. Larsen and John E. Allison, eds., STP 1149,
American Soc. for Testing & Materials, 1992, pp. 6-33.
22. Elber, Wolf: The Significance of Fatigue Crack Closure.
Damage Tolerance in Aircraft Structures, Spec. Tech.
Publ. 486, American Soc. for Testing & Materials, 1971,
pp. 23_242.
23. Newman, J. C., Jr.: A Nonlinear Fracture Mechanics
Approach to the Growth of Small Cracks. Behaviour of
Short Cracks in Airframe Components, AGARD-CP-328,
Apr. 1983, pp. 6-1 6-26.
24. Minakawa, K.; and McEvily, A. J.: On Near-Threshold
Fatigue Crack Growth in Steels and Aluminum Alloys.
Fatigue Thresholds--Fundamentals and Engineering Ap-
plications, Volume I, J. B_cklund, A. F. Blom, and
C. J. Beevers, eds., Engineering Materials Advisory Ser-
vices Ltd. (United Kingdom), 1982, pp. 373--390.
25. Phillips, E. P.; and Newman, J. C., Jr.: Impact of Small-
Crack Effects on Design-Life Calculations. Exp. Mech.,
vol. 29, June 1989, pp. 221-225.

26.Tan,PaulWilliamN.Y.:TheBoundaryForceMethodforStressAnalysisofArbitrarilyShapedPlatesWithNotchesandCracks.D.ofSci.Diss.,GeorgeWashingtonUniv.,1986.
27.Lowak,H.;DeJonge,J.B.;Franz,J.;andSchuetz,D.:MINITWIST: A Shortened Version of TWIST. LBF-
TB-146, Laboratorium fur Betriebsfestigkeit, 1979.
28. Gangloff, R. P.: Electrical Potential Monitoring of Crack
Formation and Subcritical Growth From Small Defects.
Fatigue Eng. Mater. 84 Struct., voh 4, no. 1, 1981,
pp. 15-33.
29. Walker, A. C.: Continuous Fatigue Crack Inspection of 41.
Aluminum Alloy Plate Specimens Undergoing Spectrum
Loading Using Ultrasonic Surface Waves. LTR-ST-1465,
National Aeronautical Establ., National Research Council
of Canada, July 1983.
30. Swain, M. H.; and Newman, J. C., Jr.: On the Use of 42.
Marker Loads and Replicas for Measuring Growth Rates
for Small Cracks. Fatigue Crack Topography, AGARD-
CP-376, Nov. 1984, pp. 12-1 12-17.
31. Brown, C. W.; and Smith, G. C.: A Two Stage Plas- 43.
tic Replication Technique for Monitoring Fatigue Crack
Initiation and Early Fatigue Crack Growth. Advances
in Crack Length Measurement, C. J. Beevers, Engineer-
ing Materials Advisory Services Ltd. (United Kingdom),
1982, pp. 41-51. 44.
32. Tada, Hiroshi (with the cooperation of Paul C. Paris
and George R. Irwin): The Stress Analysis of Cracks
Handbook, Second ed. Paris Productions Inc., (and Del
Research Corp.), 1985. 45.
33. Raju, I. S.; and Newman, J. C., Jr.: Three-Dimensional
Finite-Element Analysis of Finite-Thickness Fracture
Specimens. NASA TN D-8414, 1977.46.
34. Raju, I. S.; and Newman, J. C., Jr.: Stress-Intensity Fac-
tors for a Wide Range of Semi-EllipticaI Surface Cracks in
Finite-Thickness Plates. Eng. Fract. Mech., vol. 11, no. 4,
1979, pp. 817-829. 47.
35. Shivakumar, K. N.; and Newman, J. C., Jr.: ZIP3D: An
Elastic and Elasti-PIastic Finite-Element Analysis Pro-
gram for Cracked Bodies. NASA TM-102753, 1990.48.
36. Nikishkov, G. P.; and Atluri, S. N.: An Equivalent Do-
main Integral Method for Computing Crack-Tip Integral
Parameters in Non-Elastic, Thermo-Mechanical Fracture.
Eng. Fract. Mech., vol. 26, no. 6, 1987, pp. 851-867.
37. Shivakumar, K. N.; Tan, P. W.; and Newman, J. C., Jr.: 49.
A Virtual Crack-Closure Technique for Calculating Stress
Intensity Factors for Cracked Three-Dimensional Bodies.
Int. J. Fract., vol. 36, Mar. 1988, pp. R43 R50.
38. Folias, Efthymios S.: Some Remarks on Three- 50.
Dimensional Fracture. Fracture Mechanics--Proceedings
of the Nineteenth National Symposium, Thomas A. Cruse,
ed., Spec. Tech. Publ. 969, American Soc. for Testing &
Materials, 1988, pp. 56 72.
39. Zhao, W.; Wu, X. R.; and Yan, M. G.: Weight Function
Method for Three-Dimensional Crack Problems. I. Basic
Formulation and Application to an Embedded Elliptical
Crack in Finite Plates. Eng. Fract. Mech., vol. 34, no. 3,
1989, pp. 593-607.
40_ Zhao, W.: Weight Function Theory and Application for
Analysis of Three-Dimensional Crack Problems. D. of Sci.
Diss., Inst. of Aeronautical Materials, 1988.
Fujimoto, W. T.: Determination of Crack Growth and
Fracture Toughness Parameters for Surface Flaws Ema-
nating From Fastener Holes. Proceedings--AIAA/ASME/
SAE 17th Structures, Structural Dynamics, and Material
Conference, May 1976, pp. 522-531.
Dill, H. D.; and Saff, C. R.: Environment Load In-
teraction Effects on Crack Growth. AFFDL-TR-78-137,
U.S. Air Force, Nov. 1978. (Available from DTIC as
AD A071 66O.)
Saff, C. R.; and Sanger, K. B.: Part-Through Flaw
Stress Intensity Factors Developed by a Slice Synthesis
Technique. Fracture Mechanics: Fifteenth Symposium,
R. J. Sanford, ed., ASTM Spec. Tech. Publ. 833, American
Soc. for Testing & Materials, 1984, pp. 24 43.
Wu, X. R.; and Carlsson, J.: The Generalized Weight
Function Method for Crack Problems With Mixed Bound-
ary Conditions. J. Mech. Phys. Solids, vol. 31, no. 6, 1983,
pp. 485-497.
Wu, X. R.: Approximate Weight Functions for Center and
Edge Cracks in Finite Bodies. Eng. Fract. Mech., vol. 20,
no. 1, 1984, pp. 35-49.
Wu, X. R.: Weight Functions and Stress Intensity Factors
for Radial Crack(s) Emanating From a Circular Hole in
an Infinite Sheet. Rep. 63, Royal Inst. of Technology
(Stockholm, Sweden), Oct. 1985.
Wu, Xue-Ren; and Carlsson, A. Janne: Weight Functions
and Stress Intensity Factor Solutions. Pergamon Press,
Inc., 1991.
Zhao, W.; Wu, X. R.; and Yan, M. G.: Weight Function
Method for Three Dimensional Crack Problems. II. Ap-
plication to Surface Cracks at a Hole in Finite Thickness
Plates under Stress Gradients. Eng. Fract. Mech., vol. 34,
no. 3, 1989, pp. 609-624.
Zhao, W.; and Wu, X. R.: Stress Intensity Factor Eval-
uation by Weight Function for Surface Crack in Edge
Notch. Theor. _ Appl. Fract. Mech., vol. 13, July 1990,
pp. 225-238.
Zhao, W.; and Wu, X. R.: Stress Intensity Factor for
Corner Cracks at a Semi-Circular Notch Under Stress
105

Gradients.Fatigue _ Fract. Eng. Mater. _J Struct.,
vol. 13, no. 4, 1990, pp. 347-360.
51. Tan, Paul W.; Raju, Ivatury S.; and Newman,
James C., Jr.: Boundary Force Method for Analyzing
Two-Dimensional Cracked Plates. Fracture Mechanics:
Eighteenth Symposium, D. T. Read and R. P. Reed, eds.,
ASTM Spec. Tech. Publ. 945, 1988, pp. 259-277.
52. Muskhelishvili, N. I. (J. R. M. Radok, transl.): Some Ba-
sic Problems of the Mathematical Theory of Elasticity--
Fundamental Equations, Plane Theory of Elasticity, Tor-
sion, and Bending. P. Noordhoff Ltd. (Groningen,
Netherlands), 1963.
53. Erdogan, Fazil: On the Stress Distribution in Plates With
Co]linear Cuts Under Arbitrary Loads. Proceedings of
the Fourth U.S. National Congress of Applied Mechanics,
Volume I, American Soc. of Mechanical Engineers, 1962,
pp. 547-553.
54. James, L. A.; and Anderson, W. E.: A Simple Experi-
mental Procedure for Stress Intensity Factor Calibration.
Eng. Fract. Mech., vot. 1, 1969, pp. 565 568.
55. Newman, J. C., Jr.; and Raju, I. S.: Prediction of Fatigue
Crack-Growth Patterns and Lives in Three-Dimensional
Cracked Bodies. Advances in Fracture Research, Vol-
ume 3, S. R. Valluri, D. M. R. Taplin, P. Rama Rao,
J. F. Knott, and R. Dubey, eds., Pergamon Press, Inc.,
1986, pp. 1597 1608.
56. Newman, J. C., Jr.: FASTRAN H: A Fatigue Crack
Growth Structural Analysis Program. NASA TM-104159,
1992.
57. Yoder, G. R.; Cooley, L. A.; and Crooker, T. V_T.: On
Microstructural Control of Near Threshold Fatigue Crack
Growth in 7000 Series Aluminum Alloys. NRL-MR-4787,
U.S. Navy, Apr. 1982. (Available from DTIC as
AD All3 486.)
58. Wanhill, R. J. H.: Low Stress Intensity Fatigue Crack
Growth in 2024-T3 and T351. Eng. Fract. Mech., vol. 30,
no. 2, 1988, pp. 233 260.
59. Hudson, C. Michael: Effect of Stress Ratio on Fatigue-
Crack Growth in 7075-T6 and 202d-T3 Aluminum Alloy
Specimens. NASA TN D-5390, 1969.
60. Gao, Ming; Pax), P. S.; and Wei, R. P.: Chemical and Met-
allurgical Aspects of Environmentally Assisted Fatigue
Crack Growth in 7075-T65! Aluminum Alloy. Metall.
Trans. A., vol. 19A, July 1988, pp. 1739-1750.
61. Bowles, C. Q.; and Schijve, J.: The Role of Inclusions in
Fatigue Crack Initiation in an Aluminum Alloy. Int. J.
Fract., vol. 9, no. 2, June 1973, pp. 171 179.
62. Schijve, J.; Jacobs, F. A.; and Tromp, P. J.: The Signifi-
cance of Cladding for Fatigue of Aluminum Alloys in Air-
craft Structures. NLR-TR:76065-U, National Aerospace
Lab. (Amsterdam, Netherlands), Sept. 1976.
106
63. Lee, J. J.; and Sharpe, W. N., Jr.: Short Fatigue Cracks
in Notched Aluminum Specimens. Small Fatigue Cracks,
Robert O. Ritchie and James Lankford, eds., Metallurgi-
cal Soc., Inc., 1986, pp. 323- 339.
64. Newman, J. C., Jr.; Swain, M. H.; and Phillips, E. P.:
An Assessment of the Small-Crack Effect for 2024-T3
Aluminum Alloy. Small Fatigue Cracks, Robert O. Ritchic
and James Lankford, eds., Metallurgical Soc., Inc., 1986,
pp. 427 452.
65. Newman, J. C., Jr.: A Crack-Closure Model for Predicting
Fatigue Crack Growth Under Aircraft Spectrum Loading.
Methods and Models for Predicting Fatigue Crack Growth
Under Random Loading, J. B. Chang and C. M. Hudson,
eds., Spec. Tech. Publ. 748, American Soc. for Testing &
Materials, 1981, pp. 53 84.
66. Dngdale, D. S.: Yielding of Steel Sheets Containing Slits.
J. Mech. Phys. Solids, vol. 8, 1960, pp. 100 104.
67. Fleck, Norman A.; and Newman, James C., Jr.: Analysis
of Crack Closure Under Plane Strain Conditions. Me-
chanics of Fatigue Crack Closure, J. C. Newman, Jr., and
Wolf Elber, eds., Spec. Tech. Publ. 982, American Soc. for
Testing & Materials, 1988, pp. 319 341.
68. Irwin, G. R.: Structural Aspects of Brittle Fracture. AppI.
Mater. Res., vol. 3, no. 2, Apr. 1964, pp. 65 81.
69. Phillips, Edward P.: The Influence of Crack Closure
on Fatigue Crack Growth Thresholds in 2024-T3 Alu-
minum Alloy. Mechanics of Fatigue Crack Closure,
J. C. Newman, Jr., and Wolf Elber, eds., Spec. Tech.
Publ. 982, American Soc. for Testing & Materials, 1988,
pp. 505-515.
70. Newman, J. C., Jr.; Poe, C. C., Jr.; and Dawicke, D. S.:
Proof Test and Fatigue Crack Growth Modeling on 2024-
T3 Aluminum Alloy. Fatigue 90 Proceedings of the dth
International Conference on Fatigue and Fatigue Thresh-
olds, Volume 4, Hideo Kitagawa and Tsuneschiehi Tanaka,
eds., Materials and Component Engineering Publ., Ltd.
(Birmingham, England), 1990, pp. 2.107--2416.
71. Newman, J. C., Jr.: A Crack Opening Stress Equation
for Fatigue Crack Growth. Int. J. Fract., vot. 24, no. 4,
Apr. 1984, pp. R131 R135.
72. Newman, J. C., Jr.; and Raju, I. S.: Analyses of Surface
Cracks in Finite Plates Under Tension or Bending Loads.
NASA TP-1578, 1979.
73. Jolles, M.; and Tortoriello, V.: Geometry Variations Dur-
ing Fatigue Growth of Surface Flaws. Fracture Mechanics:
Fourteenth Symposium--Volume I: Theory and Analysis,
J. C. Lewis and George Sines, eds., ASTM Spec. Tech.
Publ. 791, American Soc. for Testing & Materials, 1983,
pp. 1-29T 1-307.
74.Vogelesang,L. B.: The Effect of Environment on the 83.
Transition From Tensile Mode to Shear Mode During Fa-
tigue Crack Growth in Aluminum Alloys: A Model for En-
vironmentally Assisted Crack Growth. Rep. VTH-LR-286,84.
Delft Univ. of Technology, Oct. 1979.
75. Schijve, J.: Significance of Fatigue Cracks in Micro-
Range and Macro-Range. Fatigue Crack Propagation,
ASTM Spec. Tech. Publ. 415, American Soc. for Testing
& IvlateriaIs, 1967, pp. 415-457.
76. Ravichandran, Kakkaveri S.; and Larsen, James M.: Be- 85.
havior of Small and Large Fatigue Cracks in Ti-24A1-
11 Nb: Effects of Crack Shape, Microstructure, and Clo-
sure. Fracture Mechanics: Twenty-Second Symposium
(Volume I), H. A. Ernst, A. Saxena, and D. L. McDowell,
eds., STP 1131 (Volume I), American Soc. for Testing 83 86.
Materials, 1992, pp. 727 748.
77, Raju, I. S.; and Newman, J. C., Jr.: Stress Intensity Fact
tors for Two Symmetric Corner Cracks. Fracture Me-
chanics: Proceedings of the Eleventh National Symposium. 87.
Part 1, C. W. Smith, ed., Spec. Tech. Publ. 677, American
Soc. for Testing & Materials, 1979, pp. 411 430.
78. Newman, J. C., Jr.; and Raju, I. S.: Stress Intensity 88.
Factor Equations for Cracks in Three-Dimensional Finite
Bodies. Fracture Mechanics: Fourteenth Symposium--
Volume I: Theory and Analysis, J. C. Lewis and89.
George Sines, eds., ASTM Spec. Tech. Publ. 791, Ameri-
can Soc. for Testing & Materials, 1983, pp. 1-2384-265.
79. Hartranft, R. J.; and Sih, G. C.: An Approximate Three-
Dimensional Theory of Plates With Application to crack
Problems. Int. J. Eng. Sci., vol. 8, no. 8, Aug. 1970, : 90.
pp. 711-729.
80_ Nishioka, T.; and Atluri, S. N.: An Alternating Method
for Analysis of Surface-Flawed Aircraft Structural Corn- 91.
ponents. AIAA J., vol. 21, May 1983, pp. 749 757.
81. Tan, P. W.; Raju, I. S.; Shivakumar, K. N.; and New-
man, J. C., Jr.: Evaluation of Finite-Element Models 92.
and Stress-Intensity Factors for Surface Cracks Emanat-
ing From Stress Concentrations. Surface-Crack Growth:
Models, Experiments and Structures, Walter G. Reuter, 93.John H. Underwood, and James C. Newman, Jr., eds.,
Spec. Tech. Publ. 1060, American Soc. for Testing & Ma-
terials, 1990, pp. 34-48.
82. DeLorenzi, Horst G.: Energy Release Rate Calculations
by the Finite Element Method. Eng. Fract. Mech., vol. 21,
no. 1, 1985, pp. 129-143.
Shivakumar, K. N.; and Raju, I. S.: Treatment of Sin-
gularites in Cracked Bodies, Int. J. Tract., vol. 45_ no. 3,
Oct. 1, 1990, pp. 159 178.
Tan, P. W.; Bigelow, C. A.; and Newman, J. C., Jr.:
Three-Dimensional Finite-Element Analyses of Corner
Cracks at Stress Concentrations. Durability of Metal Air-
craft Structures, S. N. Atluri, C. E. Harris, A. Hoggard,
N. Miller, and S. G. Sampath, eds., Atlanta Technology
Publ., 1992, pp. 187 199.
Shivakumar, K. N.; and Newman, J. C., Jr.: Stress Inten-
sity Factors for Large Aspect Ratio Surface and Corner
Cracks at a Semi-Circular Notch in a Tension Specimen.
Eng. Fract. Mech., vol. 38, no. 6, 1991, pp. 467 473.
Zhao, W.; Wu, X. R.; and Yan, M. G.: Stress Inten-
sity Factors for Comer Cracks at a Circular Hole un-
der Remote Tension, Acta Mechanica Sinica, vol. 7, 1991,
pp. 76-81.
Bueckner, H. F.: Novel Principle for the Computation
of Stress Intensity Factors. Z. Angew. Math. _ Mech.,
vol. 50, Sept. 1970, pp. 529-546.
Rice, J. R.: Some Remarks on Elastic Crack-Tip Stress
Fields. Int. J. Solids _ Struct., vol. 8, June 1972,
pp. 751-758.
Wu, X. R.; and Zhao, W.: Dugdale Model Solution for
Compact Specimen. Mechanical Behaviour of Materials--
Proceedings of the 5th International Conference, Vol-
ume 1, Pergamon Press, Inc., 1988, pp. 243-248.
Irwin, G. R.: Crack-Extension Force for a Part-Through
Crack in a Plate. Trans. ASME, Set. E: J. Appl. Mech.,
vol. 29, no. 4, Dec. 1962, pp. 651 654.
Shall, R. C.; and Kobayashi, A. S.: Stress-Intensity Factor
for an Elliptical Crack Under Arbitrary Normal Loading.
Eng. Fract. Mech., vol. 3, July 1971, pp. 71-96.
Grandt, A. F., Jr.: Crack Face Pressure Loading of
Semielliptt'cal Cracks Located Along the Bore of a Hole.
Eng. Fract. Mech., vol. 14, no. 4, 1981, pp. 843 852.
Newman, J. C., Jr.; and Raju, I. S.: Stress-Intensity
Factor Equations for Cracks in Three-Dimensional Fi-
nite Bodies Subjected to Tension and Bending Loads.
Computational Methods in the Mechanics of Fracture,
Satya N. Atluri, ed., Volume 2 in Computational Meth-
ods in Mechanics, Elsevier Science Publ. Co., Inc., 1986,
pp. 311-334.
107

Form Approved
REPORT DOCUMENTATION PAGE OMBNo. 0704-0188ii
Public reporting burden for this collection of information is estimated to average I hour per response, including the time for reviewing instructions, searching existing data sources,
gathering and maintaining the data needed, and completing and reviewing the collection of information Send comments regarding this burden estimate or any other aspect of this
collection of information, including suggestions for reducing this burden, to Washington Headquarters Services. Directorate for Information Operations and Reports, 1215 Jefferson
Davis Highway, Suite 1204. Arlington. VA 22202-4302, and to the O_ce of Management and Budget, Paperw_k Reduction Project (0704-0188), Washington, DC 20503.
1. AGENCY USE ONLY(Leave blank) I 2. REPORT DATE 3. REPORT TYPE AND DATES COVERED
I May 1994 Reference Publication
4. TITLE AND SUBTITLE 5. FUNDING NUMBERS
Small-Crack Effects in High-Strength Aluminum AlloysA NASA/CAE Cooperative Program WU 505-63-50-04
6. AUTHOR(S)
J. C. Newman, Jr., X. R. Wu, S. L. Venneri, and C. G. Li
7. PERFORMINGORGANIZATIONNAME(S)AND ADDRESS(ES)
NASA Langley Research CenterHampton, VA 23681-0001
9. SPONSORING/MONITORINGAGENCYNAME(S)AND ADDRESS(ES)National Aeronautics and Space AdministrationWashington, DC 20546-0001
8. PERFORMING ORGANIZATION
REPORT NUMBER
L-17244
lO. SPONSORING/MONITORINGAGENCY REPORT NUMBER
NASA RP-1309
ll. SUPPLEMENTARY NOTES
Newman: Langley Research Center, Hampton, VA; Wu and Li: Institute of Aeronautical Materials, Beijing,People's Republic of China; Venneri: National Aeronautics and Space Administration, Washington, D.C.
12a. DISTRIBUTION/AVAILABILITY STATEMENT
Unclassified --Unlimited
Subject Category 39
12b. DISTRIBUTION CODE
13. ABSTRACT (Maximum 200 words)
The National Aeronautics and Space Administration and the Chinese Aeronautical Establishment participatedin a Fatigue and Fracture Mechanics Cooperative Program. The program objectives were to identify andcharacterize crack initiation and growth of small cracks (10 #m to 2 mm long) in commonly used US andPRC aluminum alloys, to improve fracture mechanics analyses of surface- and corner-crack configurations, andto develop improved life-prediction methods. Fatigue and small-crack tests were performed on single-edge-notch tension (SENT) specimens and large-crack tests were conducted on center-crack tension specimens forconstant-amplitude (stress ratios of -1, 0, and 0.5) and Mini-TWIST spectrum loading. The plastic replicamethod was used to monitor the initiation and growth of small fatigue cracks at the semicircular notch. Crack-growth results from each laboratory on 7075-T6 bare and LC9cs clad aluminum alloys agreed well and showedthat fatigue life was mostly crack propagation from a material defect (inclusion particles or void) or from thecladding layer. Finite-element and weight-function methods were used to determine stress intensity factorsfor surface and corner cracks in the SENT specimens. Equations were then developed and used in a crack-growth and crack-closure model to correlate small- and large-crack data and to make life predictions for variousload histories. The cooperative program produced useful experimental data and efficient analysis methods forimproving life predictions. The results should ultimately improve aircraft structural reliability and safety.
14. SUBJECT TERMS
Fatigue; Fracture mechanics; Small cracks; Weight function; Finite elements; Crackclosure
17. SECURITY CLASSIFICATION
OF REPORT
Unclassified
_ISN 7540-01-280-5500
118. SECURITY CLASSIFICATION 19. SECURITY CLASSIFICATION
OF THIS PAGE OF ABSTRACT
Unclassified
15. NUMBER OF PAGES
i1816. PRICE CODE
A0620, LIMITATION
OF ABSTRACT
Standard Form 298(Rev. 2-8g)Prescribed by ANSI Std Z3g-18
298-102