Embed Size (px)
Citation preview
© Copyright 2014, Zacks Investment Research. All Rights Reserved.
TowerJazz (TSEM-NASDAQ)
Current Recommendation Outperform
Prior Recommendation Neutral
Date of Last Change 02/23/2012
Current Price (01/17/14) $6.36
Target Price $10.00
OUTLOOK
SUMMARY DATA
Risk Level Moderate
Type of Stock Small-Blend
Industry Elec Comp-Semic
TowerJazz is a pure-play semiconductor wafer foundry with two IC plants in Israel and one in California, that manufacture SiGe, MEMS, RF, embedded flash-based memory, analog/mixed-signal, and CMOS image-sensor devices. Over the past two years the firm has been building capacity due to accelerated design-win momentum.
TowerJazz has recently set a goal to reach top-line revenue run rate of $1 Billion by 2015. The acquisition of the Micron Technology FAB plant is powering growth in Asia. We see value in the shares and reiterate our outperform rating.
52-Week High $8.55
52-Week Low $3.86
One-Year Return (%) -25.00
Beta 1.22
Average Daily Volume (sh) 344,320
Shares Outstanding (mil) 48
Market Capitalization ($mil) $304
Short Interest Ratio (days) 2.32
Institutional Ownership (%) 1
Insider Ownership (%) 1
Annual Cash Dividend $0.00
Dividend Yield (%) 0.00
5-Yr. Historical Growth Rates
Sales (%) 23.3
Earnings Per Share (%) N/A
Dividend (%) N/A
P/E using TTM EPS 5.4
P/E using 2013 Estimate 6.2
P/E using 2014 Estimate 4.1
Zacks Rank 3
ZACKS ESTIMATES
Revenue (in millions of $)
Q1 Q2 Q3 Q4 Year (Mar) (Jun) (Sep) (Dec) (Dec)
2011 121 A
140 A 176 A
175 A 611 A
2012 168 A
169 A 155 A
148 A 639 A
2013 113 A
125 A
133 A
140 E
510 E
2014
610 E
Earnings per Share (Non-GAAP Diluted)
Q1 Q2 Q3 Q4 Year (Mar) (Jun) (Sep) (Dec) (Dec)
2011
$0.68 A $0.90 A
$0.90 A $0.75 A
$3.23 A
2012
$0.68 A $0.91 A
$0.65 A $0.45 A
$2.69 A
2013
$0.13 A
$0.37 A
$0.22 A
$0.30 E
$1.02 E
2014
$1.56 E
Income Statement and Valuation use fully diluted shares outstanding
Small-Cap Research Ken Nagy, CFA
www.zacks.com 111 North Canal Street, Chicago, IL 60606
January 20, 2014
TSEM: Panasonic JV will pave the Way to $1 Billion; OUTPERFORM

Zacks Investment Research Page 2 www.zacks.com
WHATS NEW
On December 20, 2013, Tower Semiconductor Ltd., announced the signing a definitive agreement creating a joint venture with Panasonic Corporation where Tower Jazz will manufacture Panasonic products using Panasonic's three semiconductor manufacturing facilities in Japan, as well as possible expansion of the current operations in those fabs, by leveraging TowerJazz's customers and businesses to capture out-of-group sales.
Panasonic Corporation is a Japanese consumer electronics vendor that has been paring back unprofitable operations in a bid to reduce its loss making operations.
By adding available capacity of approximately 800,000 wafers per year (8 inch equivalent) in the three manufacturing facilities in Japan, the joint venture is expected to improve TowerJazz s profitability by increasing its revenue by approximately $400 million a year, thereby enabling a $900 million annual run rate, all following the closing of the transaction which is expected in April 2014.
Within the scope of the JV, Panasonic will transfer its semiconductor wafer manufacturing process and capacity tools of 8 inch and 12 inch at its Hokuriku factories (Uozu, Tonami and Arai) to the JV, commit to acquire its products from the JV for the volume production based on long term partnership between TowerJazz and Panasonic of at least five years, and will transfer to TowerJazz 51% of the shares of this JV.
As consideration for its 51% equity holding in the JV, after closing of this transaction, TowerJazz will issue to Panasonic ordinary shares in the value of approximately $8 million, to be calculated based on TowerJazz average shares value during March 2014. Similarly, as a result of holding its ordinary shares, Panasonic will become a minority stakeholder in TowerJazz.
Additionally, TowerJazz s technology offerings will be increased through the joint venture by providing multiple additional specialty flows, including Panasonic's world-class specialty flows such as High Definition FSI a world famous CIS (CMOS Image Sensor) benchmark technology for high quantum efficiency, low dark current CIS technology, and high voltage SOI (silicon-on-insulator) based power management technologies.
High Definition FSI is a unique technology that enables the use of front side illumination (FSI) even for small pixels, where usually, an expensive backside illumination (BSI) is being widely used in the industry. High Definition FSI consists of light separation walls combined with a light pipe structure that funnels the light into the individual pixels with minimal light loss. This technology provides high sensitivity (high quantum efficiency) to light, low sensitivity to different angles of light that helps in preventing shading at the periphery of the image and excellent color separation leading to true and vivid colors.
The dark current performance CIS technology is known to be one of the best in the industry, not only in the average very low values of dark currents even at elevated temperatures, but also with extremely small tail of high dark current pixels, known as bright pixels . As a result, Panasonic technology allows excellent images at low light conditions (night) with no bright pixels in the image. This technology is well suited for high end DSLR (digital single lens reflex) type cameras.
Tower Semiconductor Continues Trend of Sequential Growth
On November 6, 2013, Tower Semiconductor Ltd., the Israel based global specialty foundry leader, reported financial results for its third quarter and nine months, ended September 30, 2013.
The company continued its trend of solid sequential revenue growth, reporting third quarter revenues of

Zacks Investment Research Page 3 www.zacks.com
$132.555 million, which was a $7.589 million or nearly 6 percent quarter over quarter improvement and 18 percent increase over revenues for the first quarter 2013.
However, year over year revenues fell by $22.039 million as a result of the planned contractual decrease in the Micron volume agreement in Nishiwaki. Still, excluding this Micron reduction, revenues were $4 million higher.
During the quarter the company had a record number of new masks entering its factories demonstrating effectiveness in realizing customer projects and the sales funnel.
GAAP gross profit during the 2013 third quarter was $4.371 million resulting in gross margin of 3.3 percent which compares to gross profit of $12.222 million and gross margin of 9.8 percent during the three months ended June 30, 2013.
EBITDA during the third quarter of fiscal 2013 was $21 million compared to $27 million during the three months ended June 30, 2013. Tower reported a third quarter 2013 GAAP net loss of $31.776 million or $0.68 per share, which compares to a net loss of $22.887 million or $0.59 per share during the second quarter 2013.
Non-GAAP third quarter 2013 gross profit was $39.486 million representing gross margin of 29.8 percent while non-GAAP net profit was $12.225 million. This compares sequentially to non-GAAP gross profit of $44.032 million and gross margin of 35.2 percent. Non-GAAP net profit was $18.201 million for the second quarter ended June 30, 2013.
Revenues for the nine months ended September 30, 2013 were $370.438 million, down from $491.244 million for the comparable nine months of fiscal 2012.
GAAP net loss for the first nine months of 2013 was $77.814 million or $2.10 per share, which compares to a net loss of $46.880 million or $2.13 per share during the nine months, ended September 30, 2012.
Non-GAAP gross profit for the nine months was $117.218 million representing gross margin of 31.6 percent while non-GAAP net profit was $36.899 million.This compares to non-GAAP gross profit of $184.125 million and gross margin of 37.5 percent. Non-GAAP net profit was $109.558 million for the nine months ended September 30, 2012.
Tower Semiconductor s balance sheet remained strong with $141.447 million in cash and short-term deposits and working capital of $160.060 million for the period ended September 30, 2013. This compares to $116.559 million in cash and short-term deposits and working capital of $157.197 million for the period ended June 30, 2013.Shareholders' equity at September 30, 2013 was $172 million and the current ratio was 2.1x compared with 1.8x at the end of 2012.
The first nine months of 2013 saw a 6 percent year over year increase in design wins and an increase of over 3,000 new masks entering the fab which amounted to a 34 percent year to date increase as compared to 2012.
It s important to note that design wins and numbers of masks entering the factory are the base for core business growth and the most important indicators for continuous revenue growth during the years to come.
As a result of these upturns, management anticipates fiscal 2013 fourth quarter revenues to be in the range of $133 to $143 million, representing mid-range growth of 23 percent, 10 percent and 4 percent as compared to the first, second and third quarter of 2013, respectively.
This improvement, which is nicely above the foundry market trend, is based upon continued progress in
Zacks Investment Research Page 4 www.zacks.com
the third quarter from both a business perspective as well as strategic perspective and a very nice outlook going into 2014 based upon the increased momentum year-to-date of mask sets entering into the factory.
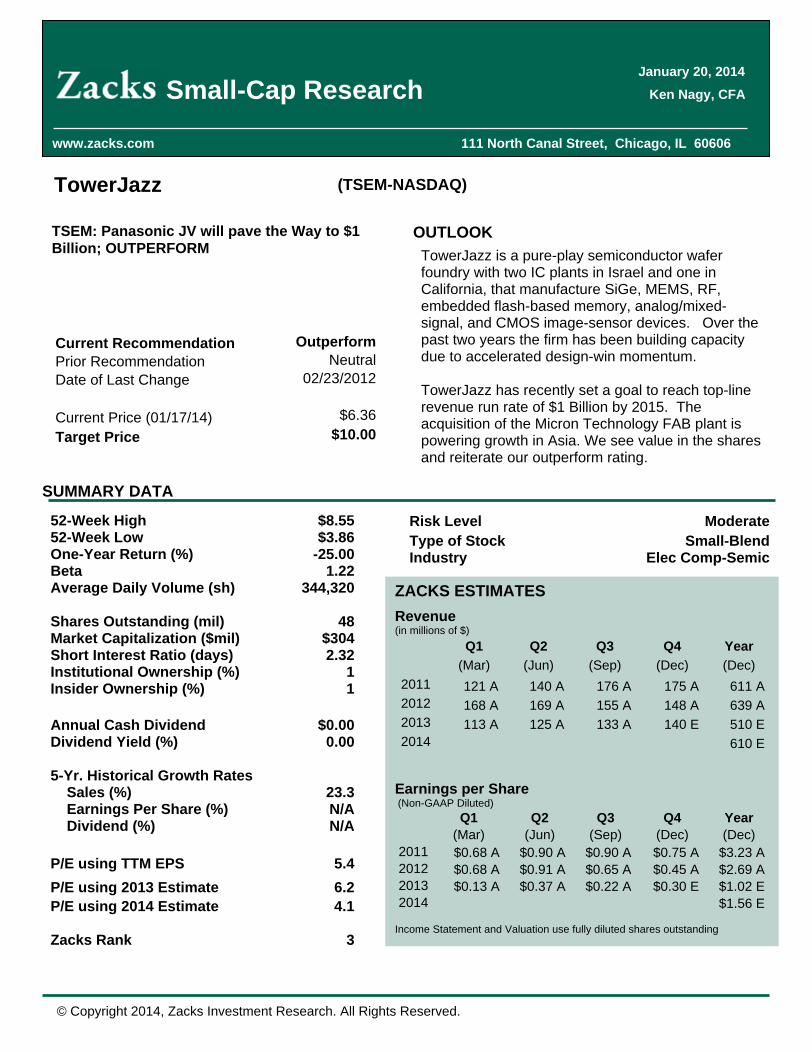
Foundry Landscape 2008-2010
($M) 2008 2009 20101 TSMC 10,556 TSMC ,8989 TSMC 13,307
2 UMC 3,070 UMC 2,815 UMC 3,965
3 Chartered 1,743 GlobalFoundries* 2,641 GlobalFoundries 3,510
4 SMIC 1,353 SMIC 1,070 SMIC 1,555
5 Vanguard 511 Dongbu 395 TowerJazz 510
6 Dongbu 490 Vanguard 382 Vanguard 505
7 X-Fab 368 TowerJazz 299 Dongbu 495
8 SSMC 340 SSMC 280 SSMC 330
9 HHNEC 290 HHNEC 240 X-Fab 320
10 TowerJazz 252 X-Fab 212 HHNEC 295
11 Grace 230 He Jian 180 Grace 260
12 He Jian 195 Silterra 170 WIN 221
13 Silterra 175 WIN 145 Altis 215
14 ASMC 134 Grace 100 He Jian 205
15 WIN 117 ASMC 94 Silterra 200
16 Mosel-Vitelic 98 XinXin 55 ASMC 150
17 XinXin 20 Mosel-Vitelic 51 Mosel-Vitelic 80
18 Altis 0 Altis 0 XinXin 75
19 - - - - - -
20+ Others 148 Others 171 Others 204
INVESTMENT THESIS
Tower Semiconductor Ltd. operates as a global specialty foundry company. Its wholly owned subsidiary, Jazz Semiconductor, Inc., specializes in analog-intensive mixed-signal (AIMS) foundry solutions. Tower and Jazz manufacture integrated circuits with geometries ranging from 1.0 to 0.13-micron, as well as provide design enablement tools to allow complex designs to be achieved quickly and accurately. The company and its subsidiary offer a range of process technologies, including digital, mixed-signal and RFCMOS, HV CMOS, BCD, non-volatile memory (NVM), embedded NVM, MEMS, and CMOS image sensors. Tower and Jazz maintain two fabrication facilities in Israel, as well as one fabrication facility in the United States, with additional capacity available through manufacturing partnerships in China.
As of March 31, 2012, the firm held 197 patents in force in the United States and 33 patents in force in foreign countries.
Zacks Investment Research Page 5 www.zacks.com
Foundry History Historically semiconductor firms (also called integrated device manufacturers or IDMs) manufactured chips in their own fabs (chip fabrication plant). By the 1990 s as chips grew smaller and more complex it was a natural that fab less outsourced manufacturing began to emerge. Semiconductor devices are broadly divided into three categories analog, digital and radio frequency (RF). Analog semiconductors condition and regulate real world information such as light, temperature, speed, pressure, power and electrical currents. Digital logic semiconductors process information in only two states. Mixed-signal semiconductors combine both analog and digital technology into a single device. Typically, an analog sensor samples real world information, and then converts the input into an electronic analog signal, which is converted into a digital format for further digital processing. The analog and mixed-signal markets tend to be more varied and specialized, with customized products that have longer life cycles than the digital industry segment. There is an ongoing drive to decrease the number of discrete devices, lessen power requirements and shrink the size of the existing devices, which correspondingly increase performance and reliability. Consequently, a greater amount of functionality is being consolidated into increasingly smaller devices
The availability of IC designs require process technologies other than standard digital CMOS have created a market for independent foundries that focus on providing specialized process technologies. Thus, wafer manufacturers may also need to make a significant investment in specialty process technologies to manufacture these semiconductors. Specialty process technologies enable greater analog content and can reduce the die size of an analog or mixed-signal semiconductor, thereby increasing the number of dies that can be manufactured on a wafer and reducing final die cost. In addition, specialty process technologies can enable increased performance, superior noise reduction and improved power efficiency of analog and mixed-signal semiconductors compared to traditional standard CMOS processes. These specialty process technologies include advanced analog CMOS, radio frequency CMOS (RF CMOS),CMOS Image Sensors (CIS), high voltage CMOS, bipolar CMOS (BiCMOS), silicon germanium BiCMOS (SiGe BiCMOS), and bipolar double-diffused metal oxide semiconductor (BCD).
Recent Wins On April 23, 2012 TowerJazz announced the completion of the successful transfer of its CMOS image sensor (CIS) technology from its Migdal Haemek, Israel facility to its US fab in Newport Beach, California providing multi-sourcing to better address its customers' growing needs. TowerJazz's CIS process has already been running in high volume in its Israeli plants, and is now available in its Newport Beach, CA facility for customers that require on-shore manufacturing.
The CIS process enables the customization of pixels according to project needs and its superior performance (dark current, low noise and dynamic range) enables a rich offering for various digital imaging applications. For example, TowerJazz's presence in the industrial sensor market is growing significantly with new applications such as fingerprint detection for homeland security, traffic monitoring cameras and others. Integration of TowerJazz's NMOS pixel with its 0.18 analog CMOS provides a US-based solution for specialty image sensors for aerospace and defense applications as well. In addition, TowerJazz's patented stitching technology overcomes photolithography tool limitations to seamlessly tile 5.5-micron pixel sections into a large pixel array, resulting in ultra-high resolution, high-quality color image sensors. This technology enables manufacturing of die sizes up to a single die per 200-mm wafer.
The firm is now enjoying a substantial ramp in volume productions that were signed in the 2008-2009 time frame. In general the time frame from design win to volume production is a two year process. Design wins per quarter were approximately 50 per quarter in 2008, 75 per quarter in 2009, and 110 per quarter

Zacks Investment Research Page 6 www.zacks.com
in 2010. The firm received a triple digit number of design wins in the past quarter, which will likely benefit the firm in 2012 and beyond.
On June 5, 2011 TowerJazz announced that it completed its previously announced acquisition of Micron Technology s fabrication facility in Nishiwaki City, Hyogo, Japan. The acquisitions will nearly double TowerJazz s current internal manufacturing capacity, increasing production by 60,000 wafers per month. The deal should also strengthen the company's presence in the Asia-Pacific region as it is likely IDM s in the area would want a partner close by. We feel the deal will help margins eventually, but perhaps not until 2013. 19.7 million shares for increasing your revenues by 80% is dilution we can live with. The first two years will operate with a cost plus model, which will allow the facility to be 80% utilized while the firm builds up a clientele. We feel this is a positive as new facilities can be a drain until the firm fills excess capacity.
Specialized Markets, higher margin The company uses CMOS (complementary metal oxide semiconductor) IC technology within the semiconductor devices. Strategically, management has targeted the manufacture of embedded flash-based memory, analog/mixed-signal and CMOS image-sensor device markets. Management asserts that these targeted specialized markets produce relatively higher gross margins and have higher growth characteristics than the general industry. Embedded flash memory is non-volatile erasable memory used within MP3 players, wireless handsets, digital cameras, DVD players, set-top boxes and PCs. The analog/mixed signal ICs are used in a wide variety of end applications that include wireless handsets, PCs, DVD players, automotive electronics and medical imaging equipment. CMOS image sensors are used within wireless handsets, digital cameras, video cameras and video game consoles. Applications within the consumer market account for 50% of revenue, while communications was 15%, PC was 7%, multi-markets 18% and the combined industrial, medical and automotive the remaining 10%.
Some industries that will benefit from optical sensors include certain processing industries that can use sensors for controlling chemical formulations and temperatures. In the medical industry, the sensors will facilitate the development of novel imaging systems. The sensors will help the construction industry monitor the structural health of different buildings, bridges, and tunnels and facilitate the environmental industry in monitoring pollutants and contamination. The multiplexing capability of optical sensors makes them an excellent candidate for structural health monitoring in aerospace applications where weight is a major consideration. Degradable polymer sensors are used to deliver antiviral drugs, pain and chemotherapy medications, and contraceptives. Universities and companies can use simulation equipment for their research and teaching needs. A range of basic and applied research programs are being conducted in aeropropulsion, space sciences, photonics, and materials technology
Merger. Jazz semiconductor was formed as the result of a spin off in 2002 from Conexant (Conexant dates back to Rockwell Semiconductor). Jazz is the owner of the Newport Beach CA 200mm facility and several industry leading technologies such as SiGE, BiCMOS, and MEMS. We feel the merger is significant to Tower for the following reasons.
The merger was done at a time when the rest of the industry was in survival mode.
The customer base was doubled.
Towerjazz is the lead in specialty higher margin foundry.

Zacks Investment Research Page 7 www.zacks.com
Diverse Customer Base (Source,Towerjazz)
The firm produces its products with its specialty process technology the designs are typically more complex than the manufacture of standard technology. This has the effect of drawing industry leading customers to the firm and makes it harder for them to leave for the competition.
SiGe TSEM s BiCMOS process technologies have more features than RF CMOS process technologies and power various RF semiconductors such as wireless transceivers and television tuners. Towerjazz takes it a step further and incorporate high-speed bipolar transistors into an RF CMOS process. The equipment requirements for BiCMOS manufacturing are specialized and require enhanced tool capabilities to achieve high yield manufacturing. Towerjazz remains the only foundry in the world with multi-fab SiGE capacity.
Power Management TSEM s high voltage CMOS and BCD process technologies have more features than advanced analog CMOS processes and are well suited for power and driver semiconductors such as voltage regulators, battery chargers, power management products and audio amplifiers.
With worldwide energy standards becoming more stringent, we are optimistic about Towerjazz technology. In particular, several new government standards are being enacted that will force new products to adopt newer technologies, displacing the inefficient legacy linear transformers. The standards imposed by the California Energy Commission (CEC) became mandatory for all external power supplies by July 2008. This is a critical event given that California is the seventh largest economy in the world and usually the pioneer in leading edge legislation that many other states usually adopt later. Washington State and Arizona have both since adopted the same California standard. China recently announced a new voluntary program similar to the Energy Star program and also adopted the California standards. The European Commission has set European standards for energy efficient external AC/DC power supplies that are even more stringent than the CEC standards, although it is initially on a voluntary basis. Australia not only adopted the CEC standards, but made compliance mandatory by April 2006. The current worldwide energy situation has created greater sensitivity to the burgeoning problem. TSEM
Zacks Investment Research Page 8 www.zacks.com
integrated power products conform to these new standards. As customers begin to design-in integrated power ICs that are in conformance with these new energy efficiency standards, the firm should be able to capitalize on the conversion.
VALUATION
The firm appears undervalued when looking at several metrics.
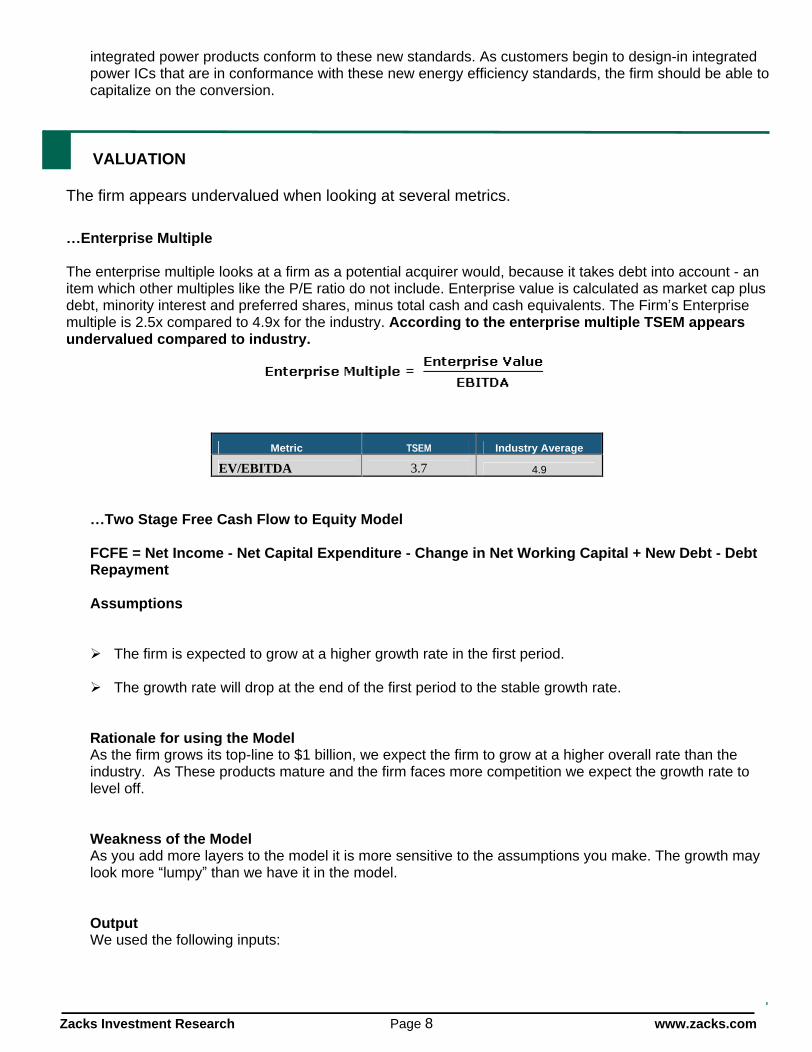
Enterprise Multiple
The enterprise multiple looks at a firm as a potential acquirer would, because it takes debt into account - an item which other multiples like the P/E ratio do not include. Enterprise value is calculated as market cap plus debt, minority interest and preferred shares, minus total cash and cash equivalents. The Firm s Enterprise multiple is 2.5x compared to 4.9x for the industry. According to the enterprise multiple TSEM appears undervalued compared to industry.
Metric TSEM Industry Average
EV/EBITDA 3.7 4.9
Two Stage Free Cash Flow to Equity Model
FCFE = Net Income - Net Capital Expenditure - Change in Net Working Capital + New Debt - Debt Repayment
Assumptions
The firm is expected to grow at a higher growth rate in the first period.
The growth rate will drop at the end of the first period to the stable growth rate.
Rationale for using the Model As the firm grows its top-line to $1 billion, we expect the firm to grow at a higher overall rate than the industry. As These products mature and the firm faces more competition we expect the growth rate to level off.
Weakness of the Model As you add more layers to the model it is more sensitive to the assumptions you make. The growth may look more lumpy than we have it in the model.
Output We used the following inputs:

Zacks Investment Research Page 9 www.zacks.com
A 5-year period with an earnings growth rate of 7.0% and a discount rate of 13.50%.
A continuing period assumed to go on forever, with earnings growing at 4% and a discount rate of 13.05%.
With these inputs we arrive at a price of $10.00
According to the model, the firm appears undervalued.
Price to Earnings Multiples/ Price to Sales Multiples
Due to its simplicity the Price/Earnings ratio is easily the most widely used metric in all of finance. The first strength of the model is that it is intuitive. It is simply the price paid for current earnings. It can also act as a proxy for other firm characteristics such as risk and growth. There is a downside to the P/E ratio in that it has the potential to reflect investor s mood rather than the fundamentals of the firm. It also eliminates assumptions about risk, growth, and retention ratio (something discounted cash flow models account for.)
While not as popular as Price/Earnings or Price/BV, Price/Sales is not influenced by accounting decisions in depreciation, inventory and extraordinary charges. P/S multiples are much less volatile than P/E multiples. However if the problem with the firm lies in cost control the P/S ratio will not reflect this flaw.
The firm appears undervalued compared to the industry.
Metric TSEM Industry Average
P/E TTM 5.4 20.5
P/E 2013 (E) 6.2 18.4
P/S 0.56 2.1
*source for background on valuation models: Investment Valuation, Aswath Damodaran
Our price target of $10.00 per share is a blend of 4.6x our 2013 EPS estimate, our two stage model and the Enterprise Model. We would add shares at these levels. We were conservative in our model.
Perhaps the recent disconnect in the shares performance versus its operating results lies in the fact that the firm had capital notes and equity options that if converted could increase the number of shares outstanding to 49 million shares. The notes along with some other equity options may be a medium term headwind for the firm, yet they were given at a time when the firm was questionable as a going concern and was hemorrhaging cash. What once saved the firm now may be holding it back. That factor was recently settled in part as Israel Corporation elected to convert their notes to common shares. (Approximately 13 million)
Our opinion is the firm is focused on getting to the $1 billion annual sales mark and will then turn its attention to improving the balance sheet.
Another potential headwind for the firm may be investors may be waiting for Tower to be GAAP profitable. Cash flow from operations has been quite strong over the past three years ($121M in 2010, $108M in 2011, $75M in 2012) This has not quite kept up with capital expenditures, which makes financing necessary. The enormous depreciation charges are on account of the build of FAB 2. As the depreciation charges wind down and the Micron plant gains strength the firm should see GAAP profitability.

Zacks Investment Research Page 10 www.zacks.com
PROJECTED INCOME STATEMENT
`INCOME STATEMENT ($ Millions) Sep-12 Dec-12 Mar-13 Jun-13 Sep-13 Dec-13 FY FY FY FY FY FY
Q3 12 Q4 12 Q1 13 Q2 13 Q3 13 Q4 13 E 2009 2010 2011 2012 2013 E 2014 E
REVENUE
Net Revenue 154.6 147.6 112.6 125.2 132.6 140.0 298.8 509.3 611.0 638.8 510.4 610.0
Sequential Growth -5% -24% 11% 6% 6%
OPERATING EXPENSES
Cost of Revenues 97.18 98.28 78.95 81.20 93.07 96.00 206.5 284.7 383.3 405.4 349.22 410.00
% of Revenue 62.9% 66.6% 70.1% 64.8% 70.2% 68.6%
Gross Profit - 57.4 49.3 33.7 44.0 39.5 44.0 92.3 224.5 227.7 233.4 161.2 200.0
Proforma Gross Margin 37.1% 33.4% 29.9% 35.2% 29.8% 31.4% 30.9% 44.1% 37.3% 36.5% 31.6% 32.8%
R&D + Engg 7.58 7.14 9.35 7.26 8.14 8.25 22.2 22.6 22.9 29.1 32.99 34.00
% of Revenue 4.9% 4.8% 8.3% 5.8% 6.1% 5.9% 7.4% 4.4% 3.7% 4.6% 6.5% 5.6%
SG&A 10.09 9.74 9.40 10.47 10.24 10.85 29.0 34 41 39 40.97 45.00
% of Revenue 6.5% 6.6% 8.3% 8.4% 7.7% 7.8% 9.7% 6.6% 6.7% 6.1% 8.0% 7.4%
GW Amort, Restructuring, other - 1.49 -
% of Revenue
Total Operating Expenses 17.67 16.88 18.75 17.73 18.38 19.10 51.1 56.2 65.1 68.2 74.0 79.0
% of Revenue 11.4% 11.4% 16.6% 14.2% 13.9% 13.6% 17.1% 11% 11% 11% 14.2% 14.2%
Operating Income - 39.7 32.4 15.0 26.3 21.1 24.9 41.2 168.3 162.7 165.2 87.3 121.0
Operating Margin 25.7% 22.0% 13.3% 21.0% 15.9% 17.8% 14% 33% 27% 27% 22.1% 22.1%
NON-OPERATING ITEMS
Non operating Income/Expense -8 -9 -8 -8 -9 -8 -22.2 -19 -4 -33 -33 -34
% of Revenue -5.29% -5.81% -7.36% -6.47% -6.70% -5.71% -7.42% -3.79% -0.64% -0.64% -6.25% -6.25%
Tax Provision 0.0 1.9 0.2 0.0 0.0 0.0 -5.0 13 2 2 0.2 0.2
Effective Tax Rate
Net Income - 31.57 21.93 6.47 18.20 12.23 16.90 24.06 136.23 157.01 130.29 53.80 86.81
Net Income Margin 20.4% 14.9% 5.7% 14.5% 9.2% 12.1% 8.1% 27% 26% 26% 15.6% 15.6%
EARNINGS PER SHARE
EPS - Basic $1.47 $0.99 $0.27 $0.78 $0.26 $0.36 $2.85 $8.55 $7.80 $6.08 $1.68 $1.86
EPS - Diluted $0.65 $0.45 $0.13 $0.37 $0.22 $0.30 $1.60 $4.27 $3.23 $2.68 $1.02 $1.56
Ken Nagy, CFA Zacks Investment Research 11/6/2013
HISTORICAL ZACKS RECOMMENDATIONS

Zacks Investment Research Page 12 www.zacks.com
DISCLOSURES
The following disclosures relate to relationships between Zacks Small-Cap Research ( Zacks SCR ), a division of Zacks Investment Research ( ZIR ), and the issuers covered by the Zacks SCR Analysts in the Small-Cap Universe.
ANALYST DISCLOSURES
I, Ken Nagy, hereby certify that the view expressed in this research report accurately reflect my personal views about the subject securities and issuers. I also certify that no part of my compensation was, is, or will be, directly or indirectly, related to the recommendations or views expressed in this research report. I believe the information used for the creation of this report has been obtained from sources I considered to be reliable, but I can neither guarantee nor represent the completeness or accuracy of the information herewith. Such information and the opinions expressed are subject to change without notice.
INVESMENT BANKING, REFERRALS, AND FEES FOR SERVICE
Zacks SCR does not provide nor has received compensation for investment banking services on the securities covered in this report. Zacks SCR does not expect to receive compensation for investment banking services on the Small-Cap Universe. Zacks SCR may seek to provide referrals for a fee to investment banks. Zacks & Co., a separate legal entity from ZIR, is, among others, one of these investment banks. Referrals may include securities and issuers noted in this report. Zacks & Co. may have paid referral fees to Zacks SCR related to some of the securities and issuers noted in this report. From time to time, Zacks SCR pays investment banks, including Zacks & Co., a referral fee for research coverage.
Zacks SCR has received compensation for non-investment banking services on the Small-Cap Universe, and expects to receive additional compensation for non-investment banking services on the Small-Cap Universe, paid by issuers of securities covered by Zacks SCR Analysts. Non-investment banking services include investor relations services and software, financial database analysis, advertising services, brokerage services, advisory services, investment research, investment management, non-deal road shows, and attendance fees for conferences sponsored or co-sponsored by Zacks SCR. The fees for these services vary on a per client basis and are subject to the number of services contracted. Fees typically range between ten thousand and fifty thousand per annum.
POLICY DISCLOSURES
Zacks SCR Analysts are restricted from holding or trading securities in the issuers which they cover. ZIR and Zacks SCR do not make a market in any security nor do they act as dealers in securities. Each Zacks SCR Analyst has full discretion on the rating and price target based on his or her own due diligence. Analysts are paid in part based on the overall profitability of Zacks SCR. Such profitability is derived from a variety of sources and includes payments received from issuers of securities covered by Zacks SCR for services described above. No part of analyst compensation was, is or will be, directly or indirectly, related to the specific recommendations or views expressed in any report or article.
ADDITIONAL INFORMATION
Additional information is available upon request. Zacks SCR reports are based on data obtained from sources we believe to be reliable, but are not guaranteed as to be accurate nor do we purport to be complete. Because of individual objectives, this report should not be construed as advice designed to meet the particular investment needs of any investor. Any opinions expressed by Zacks SCR Analysts are subject to change without notice. Reports are not to be construed as an offer or solicitation of an offer to buy or sell the securities herein mentioned.
ZACKS RATING & RECOMMENDATION
ZIR uses the following rating system for the 1045 companies whose securities it covers, including securities covered by Zacks SCR: Buy/Outperform: The analyst expects that the subject company will outperform the broader U.S. equity market over the next one to two quarters. Hold/Neutral: The analyst expects that the company will perform in line with the broader U.S. equity market over the next one to two quarters. Sell/Underperform: The analyst expects the company will underperform the broader U.S. Equity market over the next one to two quarters.
The current distribution is as follows: Buy/Outperform- 16.4%, Hold/Neutral- 77.7%, Sell/Underperform
5.2%. Data is as of midnight on the business day immediately prior to this publication.