Embed Size (px)
Citation preview

i
SMALL ANICUT SYSTEMS IN NILWALA RIVER BASIN
G.G. de.L.W. Samarasinha M.A.C. Sidath Bandara
Hector Kobbekaduwa Agrarian Research and Training Institute 114, Wijerama Mawatha,
Colombo 07

ii
LIST OF CONTENTS
FOREWORD i
ACKNOWLEDGEMENTS ii
ABSTRACT iii LIST OF CONTENTS v LIST OF TABLES vi LIST OF FIGURES vii ABBREVIATIONS viii
Chapter One 1
Introduction 1
1.1 Small Anicut Systems of Sri Lanka 1
1.2 Research Problem 3
1.3 Objectives 3
1.4 Research Methodology 3
1.4.1 Data Collection Methods 3
1.4.2 Sample Selection 3
1.4.3 Data Analysis 4
1.5 Limitations of the Study 4
1.6 Organization of the Report 5
Chapter Two 7
Nilwala River Basin 7
2.1 Background of the Nilwala River Basin 7
2.2 Nilwala Flood Protection Scheme 8
2.3 Nilwala Rectification Programme 9
2.4 Nature of the Anicut Systems in the Nilwala River Basin 10
2.5 Abandoned Anicut Systems in the Area 11
Chapter Three 13
Farming in the Study Area 13
3.1 Status of Paddy Cultivation in the Country 13
3.2 Status of Paddy Cultivation in the Study Area 13
3.3 Land Tenure 17
3.4 Size Distribution of Lowlands 17
3.5 Problems Related to Anicut Irrigated Paddy Cultivation in the Study
Area
18
3.6 Highland Crop Cultivation in Middle Nilwala Sub-Watershed 18
3.7 Highland Crop Cultivation in Urubokka Ganga Sub-Watershed 19
3.8 Status of Animal Husbandry in the Study Area 19
Chapter Four 21
Social Profile of the Sample Farmers 21
4.1 Gender and Age Distribution of the Sample 21
4.2 Labour Force 21
4.3 Literacy and Educational Level 22
4.4 Employment Pattern 22

iii
4.5 Household Income 23
4.6 Household Expenditure 25
4.7 Obtaining Loans for Farming 26
4.8 Housing and Other Facilities 27
4.9 Access to Water 27
Chapter Five 29
Summary of Findings and Recommendations 29
References
31
Annex I: Distribution of Anicut Schemes in Sri Lanka 33
Annex II: Cost of Cultivation of Paddy in Nilwala River Basin 34
Annex III: Cost of Cultivation of Paddy in Gampaha and Kalutara Districts 36
Annex IV: Explanation of Different Land Tenure Types 37
Annex V: Distribution of Working and Abandoned Anicuts, Anicut
Command Areas and Number of Benefiting Farmer Families
38

iv
LIST OF TABLES
Table 1.1: Number of Functioning and Abandoned Anicut Systems, Benefiting
Farmer Families and Respective Command Areas in Each Govijana
Kendra in Matara District
2
Table 1.2: Number of Respondents per Anicut in each Sub-Watershed
in the Sample Survey
4
Table 2.1: Sub Watersheds of Nilwala River Basin and Number of Anicut
Systems in Each Sub-Watershed
10
Table 3.1: Cost of Production of Paddy (Yala, 2008) 15
Table 3.2: Productivity of Paddy Lands by Type of Irrigation 16
Table 3.3: Type of Animal Husbandry in Each Sub-Watershed Area 19
Table 4.1: Distribution of Sample Farmers by Age Groups 21
Table 4.2: Secondary Employment of the Sample Farmers 23
Table 4.3: Annual Average Household Income from All Sources 24
Table 4.4: Annual Income from Non-Farm Activities in the Sample Households 24
Table 4.5: Purpose of Obtaining Loans in the Two Sub-Watershed Areas 26

v
LIST OF FIGURES
Figure 2.1: Map Showing Sub-Watersheds of Nilwala River Basin 7
Figure 2.2: Location of Nilwala Flood Protection Scheme 9
Figure 2.3: Distribution of Anicut Schemes in Each AER of Nilwala
Basin
10
Figure 2.4 (a): Number of Working and Abandoned Anicuts in
Middle Nilwala Sub-Watershed
11
Figure 2.4 (b): Number of Working and Abandoned Anicuts in
Urubokka Sub-Watershed
12
Figure 3.1: Cultivated Extent of Paddy under Different Irrigation Systems
in the Three ADCs of Middle Nilwala SW
13
Figure 3.2: Cultivated Extent of Paddy Under Different Irrigation Systems
in the Three ASCs of Urubokka Ganga SW
14
Figure 3.3: Average Paddy Yield in the Study Area 16
Figure 3.4: Extent of Lowlands under Different Types of Land Tenure 17
Figure 3.5: Size Distribution of Lowlands in the Study Area 18
Figure 4.1: Level of Education of the Sample Farmers 22
Figure 4.2: Primary Employment of the Sample Farmers 23
Figure 4.3: Percentage Share by Paddy Cultivation to Annual Household
Income
25
Figure 4.4: Expenditure on Food and Drink items in Middle Nilwala S.W. 25
Figure 4.5: Expenditure on Food and Drink Items in Urubokka Ganga S. 26
Figure 4.6: Source of Loans for Paddy Cultivation in the Study Area 27
vi
ABBREVIATIONS
ADC Agrarian Development Center
AER Agro Ecological Region
DAD Department of Agrarian Development
DCS Department of Census and Statistics
FL Family Labour
GDP Gross Domestic Production
HARTI Hector Kobbekaduwa Agrarian Research and Training Institute
Rh Relative humidity
SNWDR Sri Lanka National Water Development Report
SW Sub Watershed
WL1 Low Country Wet Zone
WL2 Low Country Wet Zone
WL4 Low Country Wet Zone
WM1
Mid Country Wet Zone

1
CHAPTER ONE
Introduction
1.1 Small Anicut Systems of Sri Lanka Rice is the staple food of the majority of the Sri Lankans and paddy is cultivated all over the country under irrigated and rainfed conditions. Irrigation systems can be classified according to various criteria including area or volume of the storage tank, command area or the number of crops that can be irrigated. Further, the irrigation systems are classified based on the primary function of the system (i.e. irrigation, flood control, electricity generation, etc.), and the system of management or the nature of the source of water (canal diversion, ground water or rainfed). However for administrative purposes the irrigation systems of Sri Lanka are classified according to the extent of their command area into major, medium and minor systems. Medium and major systems are the responsibility of the Irrigation Department, whilst minor systems come under the responsibility of the Department of Agrarian Services (DAS, 2000). Irrigation for cultivation is provided using the network of distributory channels of tanks and anicut systems. In the dry zone, the paddy cultivation is mainly under major irrigation, while in the wet zone, cultivation is based on rains or minor irrigation1. According to data for village irrigation systems of Sri Lanka published by the Department of Agrarian Services (DAS) in the year 2000, there were 12,950 small anicut systems distributed over seventeen districts of the country. The total command area of the small anicut systems was about 250,000 acres which was cultivated by about 339,000 farmers in the country. Though Sri Lanka is well known for its numerous ancient large reservoirs and small tanks; anicut systems are also very prominent features of water use in the island (Molle, et.al., 2003). The anicuts or amuna are small dams or weirs built across a branch of a river to pile up water behind it. The anicut keeps the levels of water high enough to feed the canal even in dry periods, while excess water is allowed to spill over and continue downstream during the rainy periods. Village tank irrigation is dominant in the dry zone of the country, while anicut system is dominant in the wet zone of the country (Dayaratne, 1991). From the total number of anicut systems in the country, 70 percent of the systems were found to be located in the five districts, Badulla, Kandy, Ratnapura, Nuwara Eliya and Matara. Highest number of anicut systems was found in Badulla district and it was about 28 percent of the total number of small anicut systems distributed over the country. In Kandy district, there were about 12 percent of total anicut systems while in Ratnapura, Nuwara Eliya and Matara districts there were about 11, 9 and 6 percent of anicut systems respectively. The small anicut systems, in each of the above districts when categorized according to size by using the representative command areas of the anicuts as representing the size, highest concentration of anicut systems are in the category of less than 10 acres of command area.
1 According to the Agrarian Services Act No.58 of 1979, the minor irrigation system can be defined as
those benefiting less than 200 acres (80 ha). Design and construction are the responsibility of the
Irrigation Department, whilst the operation and maintenance are the responsibility of the Department of
Agrarian Services (DAS) which enlists the involvement of the community for the purpose.

2
Further, the sub-division showed that most of those small anicut systems are even less than 3 acres of command area (Panabokke, et.al., 2007). Distribution pattern of anicut systems against Agro Ecological Regions (AER) of Sri Lanka shows the highest density of small anicut systems within mid and up country intermediate zones of Badulla, Nuwara Eliya and Kandy districts (ibid). In the low country wet zone the highest density of small anicut systems is found within the Nilwala Ganga basin in the Matara district (Annex 1). In Matara district, there are 825 functioning anicut systems which provide irrigation facilities to about 28,083 acres of command area. The number of benefiting farmer families are 32,808. Percentage of abandoned anicut systems is about 10 in Matara district. Table 1.1 shows the distribution of functioning and abandoned anicut systems among the ADCs. Agrarian development center areas in Matara district with the highest concentration of anicut systems are Hakmana, Kirinda-Puhulwella, Akuressa and Dandeniya.
Table 1.1: Number of Functioning and Abandoned Anicut Systems, Benefiting Farmer Families and Respective Command Areas in Each Govijana Kendra in Matara District
Govijana Kendraya Number of Functioning
Anicuts
Command Area (Acs.)
Number of Benefiting
Farmer Families
Number of Abandoned
Anicuts
Kekanadura 17 245 363 14
Dandeniya 73 1,110 1,195 -
Dikwella 7 142 143 23
Talalla 16 809 1,256 5
Weligama 40 2,786 2,571 2
Kananke 32 1,271 1,388 2
Mirissa 15 583 732 1
Malimbada 68 2,959 2,441 -
Wilpita 64 2,072 3,176 -
Akuressa 100 3,822 4,828 8
Kamburupitiya 100 3,098 3,464 2
Medawiyangoda 22 1,017 1,112 1
Kirinda Pahulwella - 2,200 2,747 10
Hakmana 89 1,588 1,539 6
Pasgoda 34 1,142 1,392 2
Ransegoda 36 680 829 -
Urubokka - 180 409 4
Deiyandara 45 1,067 1,547 4
Deniyaya 11 260 303 1
Morawaka 36 799 979 6
Beralapanathara 20 253 394 2
Total 825 28083 32,808 93
Source: DAS, 2000

3
1.2 Research Problem
Many studies on small tanks that falls into the category of minor irrigation systems
have been carried out and there are several publications on this theme. However, the
attention paid to anicut systems by the relevant government authorities and
researchers in the past is very limited and only a few research studies have been
conducted on small anicut systems.
1.3 Objectives 1. To study the present state of paddy cultivation under small anicut systems. 2. To investigate the level of operation and maintenance of small anicut systems. 3. To examine the socio-economic status of farmer families benefiting from anicut systems.
1.4 Research Methodology
1.4.1 Data Collection Methods
Data and information were collected both through primary and secondary sources. The secondary sources such as government publications, books, journals and newspaper articles were used for the study. A single visit personal interview using a structured questionnaire was adopted for each sample households. The questionnaire survey was focused on general socio-economic status of farmers, nature of anicut systems, maintenance of the anicut systems and agricultural information of the study area.
The research team interviewed the officers attached to the Agrarian Development
Centers who were in the governing body of anicut systems, agriculture officials, and
farmer leaders in order to understand the prospects and issues in using and
maintaining of anicut systems. This was done with the help of structured and guided
schedules. Field survey of this study was carried out during September to December
in 2008.
1.4.2 Sample Selection
Out of the eight sub-watersheds in the Nilwala river basin, two sub-watersheds were selected for detailed investigation. From the two sub-watersheds of WL1, Urubokka Ganga sub-watershed which has the highest number of anicut systems was selected for the study. From the sub-watersheds in WL2, Gal Oya sub-watershed has the highest number of anicut systems. Since it is located close to the Urubokka Ganga sub-watershed, Middle Nilwala Ganga sub-watershed which has second highest number of anicut systems was selected for the study. Fifteen percent (15%) of the total number of anicut systems in each of the selected two sub-watersheds was selected for the detailed study. That is eight (8) anicut systems from Urubokka Ganga sub-watershed and twenty (20) Anicut systems from Middle Nilwala Ganga sub-watershed. From the selected anicut systems, 50% or not less than 30 households was selected for the questionnaire survey from each system based on a stratified random sampling technique. The total sample size of the study is 439 as detailed out in Table 1.2. The sample frame was prepared using the registered farmers list maintained by the Agrarian Development Centers in each study area.

4
Table 1.2: Number of Respondents per Anicut System in each Sub-Watershed in
the Sample Survey
Sub-Watershed
ADC Anicut System Population (Total No. of Individuals)
Sample Size (No. of Families)
Middle Nilwala
Wilpita Avuliyadda 148 30
Ihala Beliketiya 118 27
Kethiwila 136 27
Kamburupitiya Yahamullagedara 142 30
Galwakkada 99 21
Miriswatta 146 30
Kudathota 119 25
Polkandawella 118 23
Akuressa Udahengama 103 21
Beligahahela 97 22
Gal amuna 100 22
Medilla 77 16
Kuttikubura 127 26
Sub Total 1,530 320
Urubokka Ganga
Urubokka Egodawele 116 25
Beralapanathara Koskanda 64 13
Pasgoda Illukpathdola 111 26
Mahadola 128 25
Andaluwa 140 30
Sub Total 559 119
Total 2,089 439
1.4.3 Data Analysis
Data and information collected by various methods were processed and analyzed by using statistical software of SPSS.
1.5 Limitations of the Study Literature on this theme was very limited. As in other socio-economic research projects, the data related to household income, expenditure and cost of production given by farmers by re-collecting the past, may not be accurate. Although Middle Nilwala and Urubokka Ganga sub-watershed areas were selected for this study, the respective Agrarian Development Centers belonging to those areas do not completely come within those sub-watershed boundaries. Therefore, the following Agrarian Development Centre areas were selected for the present study. To represent the conditions at Middle Nilwala sub-watershed Akuressa, Kamburupitiya and Pasgoda ADCs were selected, while Urubokka, Beralapanathara and Wilpita ADC, were selected to represent the Urubokka Ganga sub-watershed.

5
1.6 Organization of the Report CHAPTER 1: Introduction This chapter provides information on distribution pattern and the role of small anicut systems in the country, objectives of the study, sampling procedure and methods of data collection and limitations of the study. CHAPTER 2: Nilwala River Basin Chapter two presents the background information of Nilwala river basin, Nilwala flood protection scheme, Nilwala rectification programme and the abandoned anicut systems in the study area. CHAPTER THREE 3: Farming in the Study Area This chapter consists of land use information of the two sub-watersheds, status of paddy cultivation in the study area, nature of land tenure, size of holding of lowlands, problems related to anicut irrigated paddy cultivation in the study area. Chapter 4: SOCIAL PROFILE OF THE SAMPLE FARMERS
Demographic characteristics of the sample, labour force, literacy and educational levels, employment pattern, household income and expenditure, housing and sanitary facilities, access to water are discussed in this chapter. CHAPER 5: Summary of Findings and Recommendations This chapter provides findings and recommendations of the study.

7
CHAPTER TWO
Nilwala River Basin
2.1 Background of the Nilwala River Basin The river Nilwala which originates from the Sinharaja highland natural forest is the largest in the Southern Province covering a distance of 72 km. Nearly 90 percent of the area covered by the catchment of the river is in Matara District (Abhayaratna, 1996). Annual rainfall of the selected area is between 1,875mm – 2,500mm. The mean temperature is 25C0 and relative humidity (Rh) is 75% - 80%. The Catchment area covers approximately 971.0 km2 and it falls within the latitude and longitude between the 50⁰ 55' and 60⁰ 13' and 80⁰ 25' and 80⁰ 38'. Approximately 70 percent of the Nilwala river basin is used to grow paddy, tea, coconut, cinnamon, citronella and rubber (Figure 2.1). Paddy area covers approximately 18,000 ha, including 9,000 ha in the lower part of the basin which is subject to seasonal flooding. Wetland called ‘Kirelakele Marsh’ is located near the Indian ocean outfall of the Nilwala River.
Figure 2.1: Map Showing Land Use of Nilwala River Basin
Source: International Water Management Institute

8
2.2 Nilwala Flood Protection Scheme In 1979, the Ministry of Irrigation initiated a flood protection scheme in the lower most part of the watershed in the Lower Nilwala sub-watershed (Figure 2.2). The Government of France provided assistance for this project. Objectives of the Nilwala flood protection scheme were to extend the total rice cultivable area to ensure double cropping of rice on lands with elevations more than 0.6m above mean sea level (MSL) and to increase the rice yield through introduction of improved cropping practices. The implementation of the scheme involved the re-conditioning of existing drainage canals and the construction of new drainage canals, bunds, control regulators, access roads and pump houses to drain excess water from the lowest rice lands. The Nilwala flood protection scheme was completed in 1993 but only two phases of the proposed three phases were implemented. The scheme provided drainage facilities for two low lying areas rather than flood protection for the whole area coming under the project. After completion of the engineering work, the occurrence of major floods was eliminated and the drainage condition of the soil in the project area was improved. However, contrary to the plans, the rice yields sharply decreased on lands of about 1000ha with an elevation between 0.3 and 0.6m above MSL. Due to intense drainage and non availability of irrigated water, the soil problems such as increased salinity and formation of acid sulphate in the protected areas of the scheme were also experienced. As a result, large extents of paddy land in Ihala-Athuraliya, Pahala Athuraliya, Kadduwa, Narangoda, Karagoda Uyangoda and Paraduwa areas had to be abandoned. Some paddy lands which were cultivated in both seasons of the year are now cultivated only once a year. Balasuriya (1978) and Dent (1987) drew attention to the problem of acid sulphate soils in the area, the latter recommending a detailed soil survey as a basis for managing the problem.

9
Figure 2.2: Location of Nilwala Flood Protection Scheme
Source: Department of Irrigation
2.3 Nilwala Rectification Programme To minimize the negative effects of the Nilwala flood protection scheme, a Nilwala Rectification Committee has been established. The Irrigation Department has proposed the construction of flood control dams upstream of the catchment area to mitigate the ill effects of the previous flood protection scheme. Other aspects of the project proposed by the Irrigation Department include generation of electricity, provision of an additional water supply for use in periods of scarcity of water, supply of drinking water and transfer of water to the neighbouring catchment areas in Hambantota district which experience frequent water scarcity problems (Department of Irrigation, 2007).

10
2.4 Nature of the Anicut Systems in the Nilwala River Basin Nilwala river basin has been classified into eight (8) sub-watersheds by the DAD. Sub-watersheds of Nilwala watershed and number of anicut systems in each sub-watershed are given in Table 2.1.
Table 2.1: Sub-Watersheds of Nilwala River Basin and Number of Anicut
Systems in Each Sub-Watershed
Name of the Sub-Watershed Number of Anicut Systems
Urubokka Ganga 54
Katupola Ganga 31
Upper Nilwala/Hulangawa Ganga 48
Digili Ela 40
Middle Milwala Ganga 131
Gal oya 170
Kanduwela ela 42
Lower Nilwala Ganga 48
Source: HARTI/DAS, 2006 Nilwala watershed area consisted of WM1, WL1, WL2, WL4 agro-ecological regions (AER) and the distribution of anicut systems in each AER is shown in Figure 2.3. The significant finding is that in the low country wet zone, a higher density of anicut systems is present within the less wetter environment of WL2 which can experience short period of water stress (Panabokke, et al., 2007).
Figure 2.3: Distribution of Anicut Systems in Each AER of Nilwala Basin
Source: HARTI/DAS, 2006
0
50
100
150
200
250
300
350
400
WM1 WL1 WL2 WL4
11
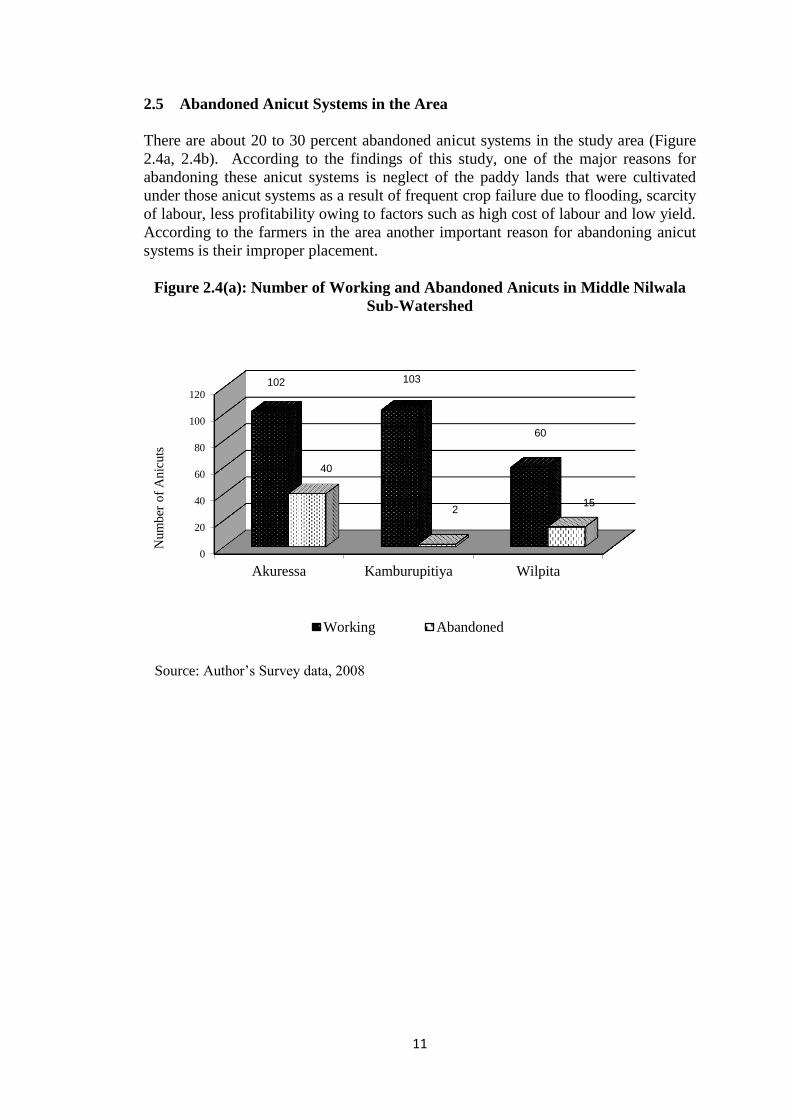
2.5 Abandoned Anicut Systems in the Area
There are about 20 to 30 percent abandoned anicut systems in the study area (Figure
2.4a, 2.4b). According to the findings of this study, one of the major reasons for
abandoning these anicut systems is neglect of the paddy lands that were cultivated
under those anicut systems as a result of frequent crop failure due to flooding, scarcity
of labour, less profitability owing to factors such as high cost of labour and low yield.
According to the farmers in the area another important reason for abandoning anicut
systems is their improper placement.
Figure 2.4(a): Number of Working and Abandoned Anicuts in Middle Nilwala
Sub-Watershed
Source: Author’s Survey data, 2008
0
20
40
60
80
100
120
Akuressa Kamburupitiya Wilpita
102 103
60
40
2 15
Num
ber
of
Anic
uts
Working Abandoned

12
Figure 2.4(b): Number of Working and Abandoned Anicuts in Urubokka
Sub-Watershed
Source: Author’s Survey data, 2008
0
5
10
15
20
25
Beralapanathara Pasgoda Urubokka
12
10
22
3 3
5
Num
ber
of
Anic
uts
Working Abandoned

13
CHAPTER THREE
Farming in the Study Area
3.1 Status of Paddy Cultivation in the Country In year 2007, the total extent of asweddumized2 land available for rice cultivation in the country was 712,111 of hectares (DCS, 2008). Of the total asweddumized land extent, about 46.7% was under major irrigation systems and 28.8% was under rainfed cultivation. Contribution by the minor irrigation systems for paddy cultivation was about 24.5% of asweddumized land (ibid). Furthermore, according to the data published by the Department of Census and Statistics, the contribution to national paddy production by major, minor and rainfed systems were 49, 25 and 26 percent respectively in 2007/08 maha season.
3.2 Status of Paddy Cultivation in the Study Area In the Middle Nilwala SW area, paddy is cultivated under rainfed, as well as under major and minor irrigation conditions. In Akuressa ADC, 2,638 acres (52%) of lowlands is being cultivated under minor irrigation (Figure 3.1). Paddy extent under major irrigation is only 155 acres (3%) in Akuressa ADC area. In Kamburupitiya ADC area, the extent under rainfed and major irrigated paddy is more or less equal, while paddy irrigated with minor irrigation systems is about 1,360 acres (24%). Paddy irrigated with major irrigation systems is about 226 acres in Wilpita ADC, while majority of the paddy lands are being cultivated under minor irrigated systems. Percentage of extent under anicut irrigated paddy is about 54 from the total extent of lowlands in the Middle Nilwala SW.
Figure 3.1: Cultivated Extent of Paddy under Different Irrigation Systems in the
Three ADCs of Middle Nilwala SW
Source: Author’s Survey data, 2008
2 Asweddumized land refers to the total cultivable land available in the country for rice cultivation.
0
500
1000
1500
2000
2500
3000
Akuressa Kaburupitiya Wilpita
Exte
nt
of
pad
dy (
Acr
es)
Major Irrigation Minor Irrigation Rainfed

14
Paddy is cultivated only under rainfed conditions and under minor irrigation in Urubokka SW area. Extent under anicut schemes are about 681 acres (19%) from the total cultivated extent of lowlands in Urubokka SW area. Unlike in Middle Nilwala SW, in Urubokka most prominent type is rainfed paddy (Figure 3.2).
Figure 3.2: Cultivated Extent of Paddy Under Different Irrigation Systems in the
Three ASCs of Urubokka Ganga SW
Source: Author’s Survey data, 2008
Cropping Intensity Annual cropping intensity of lowland was calculated according to the formula given below: Cropping intensity = Total crop area of paddy and other field crops in a year x 100 Total lowland area According to the statistics available with the Irrigation Department, the annual cropping intensities of major irrigation schemes vary from about 200% to less than 100%. Typical cropping intensities are low in rainfed and minor irrigated areas and this is generally contributing to the low national values of cropping intensities (SNWDR, 2006). However, the cropping intensity of the low land paddy was substantially higher in the study area with cropping intensity values of 186 and 177 in Middle Nilwala and Urubokka sub-watersheds respectively. In other lowland wet zone areas such as Kaluthara and Gampaha, the cropping intensity is 127 and 87 respectively in 2007 (HARTI, 2008).
Cost of Production of Paddy Except in major irrigated schemes and some minor irrigated schemes, the production of paddy has reached a level over the years, where paddy has become an unprofitable enterprise according to the cost of production data published by the Department of Agriculture from 1978 to 2001 (Aheeyar et al., 2005). For calculation of cost of production of paddy from the two categories of fixed costs and variable costs, only variable costs, have been taken into consideration in this study. Activities of paddy cultivation have been divided into eight operations from land preparation to transporting the harvest to the stores. The breakdown of cost for yala 2008 for the two sub-watershed areas is shown in Table 3.1. According to the present survey, the cost of cultivation of paddy per acre in the Middle Nilwala sub-watershed area is about Rs.38,908 including the cost of family labour while in Urubokka sub-watershed it is
0
200
400
600
800
1000
1200
1400
Beralapanathara Pasgoda Urubokka
Exte
nt
of
pad
dy (
Acr
es)
Minor irrigation Rainfed

15
Rs.39,626 (Annex II). In the Middle Nilwala sub-watershed, the labour cost is about 51 percent of the total cost including family labour whereas it is about 45 percent in Urubokka Ganga sub-watershed. Total number of labour days required to cultivate one acre of paddy is about 37 in Middle Nilwala and 32 in Urubokka Ganga sub-watersheds. Machinery cost which is about Rs.12,518 per acre is generally 32 percent of the total cost of production. In Urubokka Ganga sub-watershed, the cost for machinery is about Rs.14,551 per acre (37%). Input cost is about 17 percent in both sub-watershed areas. Weed control also leads to a considerable amount of cost of the total cost of production. The control of weeds and management of pests and diseases require about Rs.6,343 per acre in Middle Nilwala sub-watershed and it is about 16 percent of the total cost of production. In Urubokka Ganga, it accounts for about 10 percent of the total cost of production of one acre of paddy. Cost of production of paddy is more or less equal in the two sub-watershed areas and when compared with the cost of production of paddy in other low country wet zone areas like Kaluthara and Gampaha it is about 35 percent higher (Annex II). However in Middle Nilwala area, ploughing requires more labour days and higher machinery use compared to Urubokka Ganga sub-watershed area.
Table 3.1: Cost of Production of Paddy (Yala, 2008)
Sub-
watershed Activity Cost (Rs./ac)
Labour (Including
FL)
Labour (Excluding
FL)
Machinery Materials
Middle Nilwala
Land preparation
5,929.23 2,146.22 3,702.55 0
Broadcasting 2,882.13 1,858.7 0 2,262.36
Weeds, pest and diseases control
1,610.06 6,60.42 833.44 3,239.2
Fertilizer Application
329.61 0 0 1,045.33
Harvesting 4,517.05 3,735.19 0 0
Threshing 2,185.64 9,99.61 7,080.38 0
Winnowing 1,556.45 510.84 596.54 0
Transport 836.49 240 305.26 0
Total cost with imput cost of family labour (Rs.) 38,908.72
Total cost without imput cost of family labour (Rs.) 29,216.04
Urubokka Ganga
Land preparation
5,368.9 1,192.21 4,593.5 0
Broadcasting 2,809.01 1,124.67 0 3,354.46
Weeds, pest and diseases control
690.31 82.75 449.1 2,594.56
Fertilizer Application
345.76 0 0 1,001.08
Harvesting 4,565.8 2,743.46 0 0
Threshing 2180.28 826.32 8,355.09 0
Winnowing 1,529.35 451.42 898.34 0
Transport 335.8 0 255 0
Total cost with imput cost of family labour (Rs.) 39,626.34
Total cost without imput cost of family labour (Rs.) 27,921.96
Source: Author’s Survey data, 2008

16
Paddy Yield During several years of recent past, the average paddy yield had been recorded as 4.23 tons/ha under major irrigation, 3.45 tons/ha under minor irrigation and 3.02 tons/ha under rainfed conditions (SNWDR, 2006). Although there is an increasing trend in paddy yields, mainly in irrigated agriculture, the present levels of yield remain below the potential yield value of the improved paddy varieties introduced by the Department of Agriculture (Emitiyagoda and Wirasinghe, 2000). The yield potential of high yielding varieties that are being cultivated at present ranges from 7 to12 mt/ha under optimum conditions (Weerasena et.al, 2005). In general, the paddy cultivation in wet zone is considered as uneconomical as productivity is lower compared to the dry zone as shown in Table 3.2 (Balasuriya, 1987).
Table 3.2: Productivity of Paddy Lands by Type of Irrigation
Average Yield per net Hectare (kg)
2007 Yala 2007/08 Maha
Major irrigation schemes 4,915 4,803
Minor irrigation schemes 3,776 3,812
Rainfed systems 3,320 3,357
Sri Lanka (Average) 4,543 4,181
Source: Department of Census and Statistics, 2008 Average paddy yield in the study area varies between 34 to 54 bushels per acre (1.76 MT/ha to 2.8 MT/ha) (Figure3.3). In other low country wet zone areas such as Kaluthara and Gampaha, the average paddy yield is about 48 bushels per acre (2.48 MT/ha). The main problem associated with lower productivity in the wet zone is the climatic factor that creates excess water leading to poor drainage and bronzing (ibid).
Figure 3.3: Average Paddy Yield in the Study Area
Source: Author’s Survey data, 2008
0
10
20
30
40
50
60
0
10
20
30
40
50
60
Ak
ure
ssa
Kab
uru
pit
iya
Wil
pit
a
Ber
alap
anat
har
a
Pas
go
da
Uru
bo
kka
Middle Nilwala Urubokka ganga
(Bu
shel
s /a
cre)
(Bu
shel
s /a
cre)
2007/08 Maha 2008 Yala

17
3.3 Land Tenure The Sri Lankan peasant farm sector was characterized by complex systems of land tenure other than single ownership (Thilakarathne, et al., 1997). Descriptions of each tenurial agreement are shown in Annex IV. In Middle Nilwala sub-watershed area praveniya3 and individual ownership4 are the prominent type of land tenure (Figure 3.4). Ownership is recognized as praveniya when the operator cultivates a holding owned by someone else on a mutual agreement made between them. In the study area it was observed that provision of 1/4 of the harvest (¼ Ande ) to the owner as praveniya or the rent for the land is the most common type of agreement. With reference to the land ownership, the percentage of sole ownership is 45 and praveniya type ownership is 47 percent in Middle Nilwala sub-watershed. In Middle Nilwala SW area thattumaru system is not much popular. In Urubokka sub-watershed, the percentage of individually owned land parcels is 42 and second most significant category is thattumaru with 24 percent of the land holdings. Praveniya type of ownership accounts for 21 percent in Urubokka sub-watershed area.
Figure 3.4: Extent of Lowlands under Different Types of Land Tenure
Source: Author’s Survey data, 2008
3.4 Size Distribution of Lowlands According to Figure 3.5, the lowland parcels that are within the size category of less than 0.5 acres are 71 percent and 76 percent in Middle Nilwala SW area and Urubokka SW area respectively. The small land parcel size also has an impact on productivity of paddy lands in the wet zone as shading from nearby trees affects the availability of sunlight (ibid).
Figure 3.5: Size Distribution of Lowlands in the Study Area
3 Rent given to the land owner.
4 Individual ownership of the property is recognized as sole ownership.
0
5
10
15
20
25
30
35
40
45
50
Sole
ow
ne
d
Jo
intly o
wn
ed
Th
att
um
aru
Kattim
aru
Le
ased
in
Pra
van
iya
Middle Nilwala
Urubokka

18
Source: Author’s Survey data, 2008
3.5 Problems Related to Anicut Irrigated Paddy Cultivation in the Study Area Maintenance of the anicut systems is not systematic and problems related to side walls and anicut weirs and delivery channels are common. In most cases, the diversion weirs of the anicut systems were made out of wood and these have to be repaired quite often, normally before every cultivation season. Usually these were repaired by the respective farmer organization after the kanna meetings. However, it was learnt from the key informants and the farmers that these farmers’ societies are not functioning adequately in this regard. Farmers complain that they have to individually attend to canal maintenance work and the decisions made at the kanna meetings are not always put into action. As a result, during rainy seasons drainage water flows across the paddy lands because capacities of drainage canals have been reduced over time due to siltation. Rice varieties cultivated in the wet zone area are susceptible to fungal diseases. Lack of quality seeds at the proper time is also an issue faced by the farmers in the area. Part of Middle Nilwala area is prone to flood and about 800 acres of paddy land that was cultivated successfully earlier has now become uncultivable. This problem has arisen after the implementation of Nilwala flood protection scheme.
3.6 Highland Crop Cultivation in Middle Nilwala Sub-Watershed In Kamburupitiya ADC area paddy occupies 3598 acres of lowland and major highland crops are cinnamon and rubber. Tea occupies only 668 acres of highland in Kamburupitiya. Extent of lowland under paddy is 5,058 acres in Akuressa ADC area. Tea is the main highland crop occupying 15,516 acres. Rubber occupies 4080 acres while the extent under cinnamon is about 2,409 acres. Paddy occupies about 1,124 acres of lowland in the Wilpita ADC area. Area under coconut is 7,629 acres, while rubber occupies 1,400 acres.
0
5
10
15
20
25
30
35
40
45
50
<0.25 0.25-0.5 0.5-1.5 1.5-3 >3
% o
f la
nd
par
cels
Acres

19
3.7 Highland Crop Cultivation in Urubokka Ganga Sub-Watershed According to the composition of crops in the selected ADC areas in Urubokka SW, tea is the main highland crop occupying the highest extent of land in Beralapanathara ADC (5,526 acres), while rubber is cultivated in 62 acres of land. Cultivated extent of coconut and cinnamon is 428 acres and 200 acres respectively. In Pasgoda ASC, tea is cultivated in 56 percent of the total cultivated extent, while 520 acres of highland is under rubber. Clove is also cultivated in the area in about 101 acres. Cinnamon is widely cultivated in the Pasgoda ASC area and extent under cinnamon is 1,218 acres. Rubber is not popular in Urubokka ASC area, while about 31 percent of the cultivated extent comprises mixed crops. Percentage under paddy is almost same in all three ASC areas.
3.8 Status of Animal Husbandry in the Study Area In the study area the livestock farming is practiced in addition to crop cultivation. The extent of livestock farming in the two sub-watershed areas are shown in Table 3.3. According to the study findings only 8% and 11% of the population in Middle Nilwala and Urubokka sub-watersheds respectively are engaged in some kind of animal husbandry. From the small numbers who practice animal husbandry only 8% do it for the purposes of income generation. Rearing cattle and buffalo for milking and other domestic agricultural purposes, poultry farming for eggs could be observed in the Middle Nilwala area. In Urubokka sub-watershed area in addition to those; swine and goat farming were also observed. Animal husbandry is not popular within the study area mainly due to their personal dislike towards it. Therefore, no effort has been made by the livestock officials to popularize this on a commercial scale. The main problems faced by the farmers involved in animal husbandry are lack of labour and high cost of animal feed.
Table 3.3: Type of Animal Husbandry in Each Sub-Watershed Area
Name of Sub-watersheds
Type of Animal Husbandry No. %
Middle Nilwala Cattle for milking 37 23
Cattle for other uses 5 3
Buffalo for milking 69 44
Poultry farming (layers) 48 30
Urubokka Ganga Milk cattle 16 11
Cattle for other uses 3 2
Buffalo for milking 2 1
Swine farming 4 3
Goat farming 6 4
Poultry farming (layers) 115 79
Source: Author’s Survey, 2008.

20

21
CHAPTER FOUR
Social Profile of the Sample Farmers
4.1 Gender and Age Distribution of the Sample Average family size of the sample households is 4.8 in Middle Nilwala sub-watershed area and 4.7 in Urubokka Ganga sub-watershed area. A well balanced gender distribution could be observed in the population in both sub-watersheds with 51.3 percent of males and 48.7 percent females in Middle Nilwala sub-watershed and 53 percent of males and 47 percent females in Urubokka Ganga sub-watershed. The masculinity ratio of the study population is almost 100. Age distribution pattern is very much similar in the two sub-watersheds. According to the age profile of the respective population, the youth population within the age group 20 to 30 is 18.48 percent. Children who are in the age of schooling is about 21 percent of the population. Population below the age of 16 years and above 65 years of age accounts for 34 percent of the total population. About 22 percent of the total populations are over 55 years which is considered as the age for retirement. Age dependency ratio was about 53 percent when calculated according to the following equation. Age dependency ratio = Age group (0-14) + Age group (65 and above) Age group (15-64) Age structure of the sample farmers are shown in Table 4.1. Prominent age group is 41 to 65 years in both SW areas. In Middle Nilwala SW area, the percentage engaged in farming above 65 years of age is 28 and 31 in Urubokka SW areas. Young farmers in the age group of 20 to 30 years are only 1 percent in Middle Nilwala and 2 percent in Urubokka SW areas indicating the younger generations dislike farming.
Table 4.1: Distribution of Sample Farmers by Age Groups
Sub-watershed Age group Number of farmers
Percentage of farmers
Middle Nilwala 20-30 4 1
31-40 28 9
41-65 198 62
>65 90 28
Urubokka Ganga 20-30 3 2
31-40 14 12
41-65 65 55
>65 37 31
Source: Author’s Survey Data, 2008
4.2 Labour Force According to International Llabour Organization, the labour force consists of those who are already employed plus those who are unemployed during a period under discussion. It is the economically active segment of the total population.

22
In the study area, the individuals within the age group of above 14 years and below 64 years are taken as the labour force. Labour force is 64 percent in both sub-watersheds. From the labour force 44 percent is currently employed. There are about 6.3 percent of the labour force who are looking for employment, while about 23 percent are students. People with disabilities, infants and pensioners is 11 percent. Dependency ratio when calculated according to the equation given below is about 1.3 in the sample population which is high. Economic dependency ratio5 = Unemployed+Housewives+students + discouraged + others* Total Employed
* Below 6 years and above 55 years of age
4.3 Literacy and Educational Level Literacy level of the individuals of Sri Lanka, who are over 10 years old is 91%, while the literacy level in Matara district is about 90.3. Literacy rate of the study population was 92. This indicated that the sample population is within the average literacy level. Figure 4.1 provides information on levels of education of the sample farmers as reported by 119 households in Urubokka and 320 households in Middle Nilwala sub-watersheds. In both sub-watersheds the significant fraction of sample farmers had received only primary education. In Middle Nilwala sub-watershed the majority of them had received education up to secondary level, while in Urubokka, the percentage who had received education up to secondary level is 33.
Figure 4.1: Level of Education of the Sample Farmers
Source: Author’s Survey data, 2008
4.4 Employment Pattern Majority of the sample farmers do farming as their primary employment (Figure 4.2). Other than paddy, they are engaged in growing of tea, rubber, coconut and cinnamon. However there were about 8 percent from Middle Nilwala and 10 percent form Urubokka SW areas whose main employments were in government service. They reported to do farming as their subsidiary source of income.
5 Source: Aheeyar, et.al (2007)
Year 1-5
(Primary
education
34%
Year 6-
11(Secondar
y education)
43%
G.C.E.
(O/L)
passed
14%
G.C.E.
(A/L)
passed
6% Graduates
and above
2%
No
schooling
1%
Middle Nilwala SubWatershed
Year 1-5
(Primary
education
37% Year 6-11
33%
G.C.E.
(O/L)
passed
12%
G.C.E.
(A/L)
passed
9%
Graduates
and above
6% No
schooling
3%
Urubokka Ganga Sub-Watershed

23
Figure 4.2: Primary Employment of the Sample Farmers
Other than farming, the most common category of secondary employment among the sample farmers is agricultural labour (Table 4.2) and it is about 21 percent in Middle Nilwala and 36 percent in Urubokka SW areas.
Table 4.2: Secondary Employment of the Sample Farmers
Middle Nilwala (%) Urubokka Ganga (%)
Agriculture 48 45
Agricultural labour 21 36
Non agricultural labour 8 9
Skilled jobs 12 1
Self employment 11 9
Percentages are based on the number of farmers with a secondary employment Source: Author’s Survey data, 2008
4.5 Household Income Information on annual household income was collected by using the annual earnings from January to December 2007 from both agricultural and non-agricultural sources. According to the income data shown in table 4.3, the majority of the households are in the income group of Rs.100,001 to 250,000. About 41 percent of the households in Middle Nilwala sub-watershed and about 37 percent of the households in Urubokka sub-watershed are within the above income group.
4.2b Urubokka Ganga Sub-Watershed
Source: Author’s Survey data, 2008

24
Table 4.3: Annual Average Household Income from All Sources
Income group (Rs.) Middle Nilwala Urubokka Ganga
No. % No. %
<25 000 20 6 0 0
25,001 – 100,000 62 19 18 15
100,001–250,000 130 41 44 37
25,0001–500,000 72 23 36 30
>500,001 34 11 21 18
Total 318 119
Source: Author’s Survey data, 2008 More than 85%of the households in both sub-watershed areas get more than 75% of their annual household income from non-farm activities. Most common income generating activities of this nature is employment in government and private sectors for monthly wages. Majority of the households are in the non-farm income group of Rs 100,001 to Rs.250,000 in both sub-watersheds (Table 4.4).
Table 4.4: Annual Income from Non-Farm Activities in the Sample Households
Income group (Rs.) Middle Nilwala Urubokka Ganga
No. % No. %
<25 000 39 14 12 14
25,001 – 100,000 56 20 26 30
100,001–250,000 105 38 31 36
25,0001–500,000 54 20 13 15
>500,001 20 7 4 5
Total 274 86
Source: Author’s Survey data, 2008 Economic contribution of paddy cultivation is very small in the study area (Figure 4.3). Contribution by the anicut irrigated paddy to annual income is less than 10 percent in majority of the households (63%). There were 89 percent of households getting less than 25 percent of the annual household income from anicut irrigated paddy. However, there were about 4 percent of the households earning more than 50 percent of their annual household income by this means.

25
Figure 4.3: Percentage Share from Paddy Cultivation to Annual Household
Income
Source: Author’s Survey data, 2008
4.6 Household Expenditure About 63 percent of the sample households in Middle Nilwala SW area and 44 percent in Urubokka SW area spend more than 50 percent of their annual income on food (Figures 4.5 and 4.6). This is true for about 44 percent in Urubokka SW area. Households which are spending more than 76 percent of their income for food items are 13 percent and 6 percent in Middle Nilwala and Urubokka SW areas respectively indicating hand to mouth existence.
Figure 4.4: Expenditure on Food and Drink items in Middle Nilwala S.W.
0
10
20
30
40
50
60
<25 25-50 51-75 76-100
Ho
use
ho
lds
(%)
Expenditure as a % of Income
For food and drink
Source: Author’s Survey data, 2008
0 20 40 60 80
Households (%)
<10
11-25
26-50
51-75
76-100
% S
hare
fro
m p
ad
dy
Anicut Irrigated Paddy
Paddy Cultivation

26
Figure 4.5: Expenditure on Food and Drink items in Urubokka Ganga S.W.
0
5
10
15
20
25
30
35
40
45
<25 25-50 51-75 76-100
Ho
use
ho
lds
(%)
Expenditure as % from income
For food and drink
Source: Author’s Survey data, 2008
4.7 Obtaining Loans for Farming Obtaining loans for agricultural purposes was 22 percent in Middle Nilwala SW and 31 percent in Urubokka Ganga SW areas. Tea growers had obtained the highest percentage of loans for agriculture. Loans obtained for paddy cultivation is about 8 percent and 7 percent in Middle Nilwala and Urubokka SW areas respectively (Table 4.5).
Table 4.5: Purpose of Obtaining Loans in the Two Sub-Watershed Areas
Purpose of the loan Sub-watershed Total
Middle Nilwala
Urubokka Ganga
No. % No. % No. %
Paddy cultivation 9 8 5 7 14 8
Tea cultivation 10 9 15 21 25 14
Cinnamon cultivation 2 2 0 0 2 1
Other crop cultivation
3 3 2 3 5 3
Other needs 83 78 48 69 130 74
Total 107 100 70 100 176 100
Source: Author’s Survey data, 2008 Loan amounts taken for paddy cultivation varied from Rs.5,000 to Rs.100,000. Majority of these loans had been obtained from SANASA development bank and co-operatives in the area (Figure 4.6). SANASA development bank had provided loans ranging from Rs.10,000 to Rs.100,000 for cultivation of paddy.

27
Figure 4.6 Source of Loans for Paddy Cultivation in the Study Area
Source: Author’s Survey data, 2008
4.8 Housing and Other Facilities Housing can be defined as living environment which consists of the dwelling unit and supporting facilities such as water supply for domestic uses, sanitary facilities and basic community facilities. Housing situation of the sample farmers is at a satisfactory level. Almost all the houses are owner occupied and permanent houses had been built on their ancestral land. Walls of about 76% of the houses were made of bricks. Another 10% of the houses had walls made from cement blocks, while 14% had other materials such as cabook, mud, etc. Type of roof was tiles in about 85% of the houses, while others had asbestos sheets, metal sheets etc. as roofing material. Safe sanitation is mainly influenced by the type of access and type of latrine available. At present in Sri Lanka, there are about 93-94% of people who have access to some type of latrine, while about 72% have access to water sealed type latrines (DCS, 2002a). All houses under the survey had water sealed toilets. In Urubokka sub-watershed, about 8% of the houses had latrines inside the houses and about 16% in Middle Nilwala sub-watershed. According to the respondents in both sub-watershed areas about 90% are satisfied with the health facilities available in the area. Access to local facilities such as electricity and telephones were at a satisfactory level.
4.9 Access to Water
Source of domestic water can be considered as a measure of quality of life. Access to safe drinking water is an important factor effecting good health of people. In Sri Lanka, lack of access to safe drinking water has been identified as an important factor contributing to high morbidity from diarrhoeal diseases (SNWDR, 2006). Generally in Sri Lanka, there are about 75% households with access to safe drinking water. However, there are variations between different sectors in the country (DCS, 2002b). In the study area, water for domestic uses is taken from
Government banks
14% Private banks
7%
Co-operatives
29%
SANASA
29%
Neighbours
14% Money lenders
7%

28
wells, public water supply and common water bodies such as rivers and streams. About 64% of the population’s source of domestic water supply is a well which is either situated inside or outside their homesteads. Others obtain water for domestic requirements from water supply pipes, rivers, etc.

29
CHAPTER FIVE
Summary of Findings and Recommendations
Findings Paddy is the main crop cultivated under anicut systems both in yala and maha seasons in the study area. Cultivation of other crops in the irrigated area is only on a small scale for home consumption. Generally, there is abundance of water to cultivate paddy in both seasons. Cost of production of paddy is high in the area due to lower levels of yield per acre. Though the contribution by the anicut irrigated paddy to the annual household income is only a small proportion, the farmers have not shifted to other field crops (OFCs). Main purpose of the farmers cultivating paddy is provision of their own rice requirement. More than 70 percent of the produce is for home consumption, while another 10 to15 percent is used to settle payments to local merchants for inputs such as seed paddy, agro-chemicals, etc. There are no serious issues regarding water sharing as there is no scarcity of water. However, the maintenance of the system is generally poor and participation of the respective farmers in maintenance of the system is not adequate. Though farmers’ societies exist in the area, the farmers use those mainly for obtaining the subsidized fertilizer from the government.
In the study area, there are about 20 to 30 percent abandoned anicut schemes. Main
reasons for abandoning these anicut systems is abandoning of paddy lands that were
cultivated under those anicut schemes and improper placement of these anicut systems. Economic diversification is high at the household level. Though majority of the sample are involved in farming as their main employment, the majority of the households in both sub-watershed areas get more than 75 percent of their annual household income from non-farm activities. However in the study area, there was no marked difference in socio economic status as well as economic diversification from one sub-watershed to the other. Situation is more or less equal from one anicut to the other even among the two sub-watersheds. The fact that they have cultivated these paddy lands continuously without abandoning, even with the lower economic output, indicate the important role played by the anicut irrigated paddy in maintaining the household food security. Therefore, necessary changes should be implemented to increase the productivity of these paddy lands to get the maximum return for the huge investment made on subsidized fertilizers, while assuring the food security at household level. Recommendations The participation of the farmers in anicut system maintenance should be made a pre
requisite to obtain subsidized fertilizers. Then they will take an interest in anicut maintenance.
Renovating anicut systems should be done after a systematic prior investigation of the farmers traditional knowledge and wisdom on the hydrological environment of the area and the location of the existing irrigation works.
Productivity of lowland in the Nilwala river basin should be increased by introduction of high yielding rice varieties suitable for the locality and strengthening the agricultural extension service to provide instructions to overcome frequent pests and diseases.
30
Measures should be taken to minimize the environmental consequences that had taken place after the implementation of the Nilwala flood protection scheme so that currently abandoned paddy lands in the Middle Nilwala sub-watershed could be re-cultivated.
31
REFERENCES Abeyratne, S. (1990), Rehabilitation of Small-scale Irrigation Systems in Sri Lanka: State
Policy and Practice in Two Systems. Colombo, Sri Lanka: IIMI. Abhayaratna, M.D.C. (1996), Dwindling Forest Resources and the Need for Management
Interventions: A Case Study of the Nilwala Ganga Watershed. Second Annual Forestry Symposium on Management and Sustainable Utilization of Forest Resources, Kaluthara, Sri Lanka.
Aheeyar, M.M.M., Henegedara, G.M. and Rupasena, L.P. (2005), The Cost of Production of Rice in Kegalle and Kurunegala Districts of Sri Lanka, Research Report No.115. Hector Kobbekaduwa Agrarian Research and Training Institute, Colombo.
Aheeyar, M.M.M., Shantha, W.H.A. and Senevirathne, L.P. (2007), Assessment of Bulk Water Allocation Programme in Mahaweli H Area. Research Report No.118. Hector Kobbekaduwa Agrarian Research and Training Institute, Colombo.
Balasuriya, I. (1987), Reclamation and Development of Rice Cultivation on Coastal Low-lying Lands of Southern and Western Sri Lanka. Tropical Agricultural Research Series, 20, 213-224.
DAS (Department of Agrarian Services), (2000), Data Book for Village Irrigation Schemes of Sri Lanka, Island Summary, Water Management Division, Department of Agrarian Services, Colombo.
Dayaratne, M.H.S. (1991), A Review of Alternative Strategies for Improving Farmer Managed Irrigation Systems in Sri Lanka. International Irrigation Management Institute, Colombo, Sri Lanka.
Sri Lanka Department of Census and Statistics, 2008, Online at: <http://www. statistics.gov.lk/Pocket%20Book/chap06.pdf >
Sri Lanka Department of Census and Statistics, 2001(a), 2001 Population and Housing Survey. Online at: <http://www.statistics.gov.lk/PopHouSat/PDF/ Housing/p10h8%20drinking% 20 water.pdf>
Sri Lanka Department of Census and Statistics, 2001(b),2001 Population and Housing Survey. Online at: < http://www.statistics.gov.lk/PopHouSat/PDF/Housing/ p10h7%20Toilets.pdf>
Dent, D.L.(1987), Environmental Impact Report on the Nilwala Ganga Flood Protection Scheme. Land Use Policy and Planning Division, Ministry of Lands and Land Development, Colombo.
Emitiyagoda, G.A.M.S.S. and Wirasinghe,W. (2000), Rice Productivity Enhancement in Sri Lanka: Yaya (tract) Program. Annals of the Sri Lanka Department of Agriculture.
Epasinghe, S., Hitihamu, H.N.S.J.M. and Epakanda, N.S.B. (2008), Declining Trend in Paddy Cultivation in the Wet Zone of Sri Lanka. Hector Kobbekaduwa Agrarian Research and Training Institute, Colombo. (Unpublished).
Sri Lanka National Water Development Report (2006), Eds. Imbulana, K.A.U.S., Wijesekara, N.T.S. and Neupane B.R., MAIMD,UN-WWAP, UNESCO and University of Moratuwa, Sri Lanka, Paris and New Delhi
Hector Kobbekaduwa Agrarian Research and Training Institute. Paddy Statistics in Sri Lanka 2006-2007 (2008), Hector Kobbekaduwa Agrarian Research and Training Institute, Colombo.
Panabokke, C.R., Vitharana, P., Amarasinghe, L. and Samarasinha, G.G.de.L.W. (2007), The Small Anicut Systems (Amunas) of Sri Lanka-Nature of Their Occurrence and Their Regional Distribution Pattern. Hector Kobbekaduwa Agrarian Research and Training Institute, Colombo. (Unpublished)
32
Thilakarathne, L.,Yanagita, Y. and Imai, K. (1997), Land and Labour Use Pattern of Paddy Farming Practices in Sri Lanka Peasant Farm Sector. Research Bulletin No.62, Faculty of Agriculture, Gifu University, Japan.
Weerasena, S.L., Mahrouf, A.R.M., Senanayake, N. and Emitiyagoda, G.A.M.S. (2005), “Water for Food Security”. In Proceedings of Workshop on Sri Lanka National Water Development Report, eds. Wijesekera, N.T.S., Imbulana, K.A.U.S. and Neupane, B., World Water Assessment Programme, Paris, France.
Department of Irrigation (2007), Identification Mission. Flood Protection Improvement for Nilwala Lower Basin Through Upstream Multi-purpose Reservoirs.
Molle, F., Jayakody, P. and de Silva, S. (2003), Anicut Systems in Sri Lanka: The Case of the Upper Walawe River Basin. Working Paper 61, Colombo, Sri Lanka: International Water Management Institute.

33
Annex 1: Distribution of Anicut Schemes in Sri Lanka
Source: International Water Management Institute
Km

34
Annex II: Cost of Cultivation of Paddy in Nilwala River Basin - 2008 Yala
Sub Activity Mandays Cost (Rs./Ac.)
Watershed per acre Labour Labour Machinery Input
(with
family) (without family)
Middle Nilwala
Cleaning bunds and canals 3.53 1847.36 529.73 1st and 2nd Ploughing 2.72 1482.72 500.01 3702.55
Plastering bunds 3.60 1953.55 889.81
Leveling 1.25 645.90 266.67
Broadcasting 4.94 2882.13 1858.70 2262.36 Weed controlling (hand) 1.75 1008.33 566.67 Weed controlling (weedicides) 0.69 364.75 64.58 416.72 1663.79 Application of fertilizer 0.66 329.61 0.00 1045.33 Pest and diseases controlling 0.46 236.98 29.17 416.72 1575.41
Harvesting 7.52 4517.05 3735.19
Threshing 3.79 2185.64 999.61 7080.38
Winnowing 2.82 1556.45 510.84 596.54
Transport 1.59 836.49 240.00 305.26
Total cost (with imput cost of family labour) Rs. 38,902.72
Total cost (without imput cost of family labour) Rs. 29,216.04 Urubokka Ganga
Cleaning bunds and canals 3.20 1684.21 387.03 1st and 2nd Ploughing 1.95 980.31 51.62 4593.50
Plastering bunds 4.21 2215.23 717.85
Leveling 0.98 489.15 35.71
Broadcasting 4.56 2809.01 1124.67 3354.46 Weed controlling (weedicides) 0.72 362.41 42.75 224.55 1738.10 Application of fertilizer 0.66 345.76 0.00 1001.08 Pest and diseases controlling 0.66 327.90 40.00 224.55 856.46
Harvesting 7.68 4565.80 2743.46
Threshing 4.04 2180.28 826.32 8355.09
Winnowing 2.88 1529.35 451.42 898.34
Transport 0.67 335.80 0.00 255.00
Total cost (with imput cost of family labour) Rs. 39,326.32
Total cost (without imput cost of family labour) Rs. 27,921.95
Source: Author’s Survey Data, 2008

35
Cost of Cultivation of Paddy in Nilwala River Basin - 2007/08 Maha
Sub
Water shed Activity Mandays
per acre Cost (Rs./Ac.)
Labour (with
family)
Labour (without family)
Machinery Input
Middle Nilwala
Cleaning bunds and canals 2.85 1502.07 508.70
1st and 2nd Ploughing 2.52 1335.94 413.79 3549.37
Plastering bunds 3.73 2030.16 935.74
Leveling 2.02 1070.99 590.27
Broadcasting 4.92 2834.11 1833.01 2163.74
Weed controlling (hand) 3.43 2143.33 1626.67
Weed controlling (weedicides) 0.45 224.52 6.06 416.90 1551.30
Application of fertilizer 0.65 324.43 17.24 1056.43
Pest and diseases controlling 0.52 268.14 57.14 416.90 1289.02
Harvesting 7.17 4274.99 3515.79
Threshing 3.58 1973.81 907.16 6884.45
Winnowing 2.56 1381.07 400.64 569.13
Transport 2.10 1116.37 400.00 286.10
Total cost (with imput cost of family labour) Rs.38,663.28
Total cost (without imput cost of family labour) Rs.29,395.56 Urubokka Ganga
Cleaning bunds and canals 2.86 1498.46 316.62
1st and 2nd Ploughing 1.85 965.51 88.06 4557.67
Plastering bunds 4.04 2086.24 619.67 Leveling 0.95 502.84 64.29
Broadcasting 4.22 2527.14 1088.81 2925.38
Weed controlling (hand) 0.50 250.00 0.00
Weed controlling (weedicides) 0.73 363.76 45.00 294.71 1667.76
Application of fertilizer 0.63 329.28 0.00 1011.27
Pest and diseases controlling 0.68 337.77 35.56 294.71 1092.58
Harvesting 7.67 4528.13 2881.76
Threshing 4.51 2356.17 1026.57 7901.78
Winnowing 3.06 1614.47 536.35 916.39
Transport 0.53 262.88 0.00 255.00
Total cost (with imput cost of family labour) Rs.38,539.88
Total cost (without imput cost of family labour) Rs.27,619.92
Source: Author’s Survey Data, 2008

36
Annex III: Cost of Cultivation of Paddy in Gampaha and Kalutara Districts
Activities and Inputs Gampaha Kalutara
Labour days Cost (Rs.) Labour days Cost (Rs.)
Labour Cost Land preparation
6.8 3,282 5.47 2,710
Planting 4.87 2,352 4.42 2,190
Fertilizer 1.07 517 0.54 268
Weed control 1.26 608 1.47 727
Pest control 0.94 465
Harvesting 12.98 6,267 12.27 6,072
Threshing 4.58 2,212 4.04 1,999
Winnowing 2.46 1,186 2.16 1,071
Transport
Total 34 31.32 15,502
Input Cost
Seed 1,490 1,429
Fertilizer 1,009 792
Agro-chemicals 1,732 2,402
Other
Cost of machinery 7,785 7,015
Total cost (IIC) 28,440 27,142
Total cost (EIC) 13,588 16,677 Source: HARTI Data Bank, 2008

37
Annex IV: Explanation of Different Land Tenure Types Jointly owned: Ownership is shared among the shareholders of a particular immorable property. Individual decisions which can affect the property cannot be taken. There are different kinds of joint ownership categories such as; Tenancy rotation (Thattumaru system): By making a mutual agreement or according to a court order, the owners of the holding take turns to cultivate the paddy land. The individual who cultivate the land takes the total harvest alone. Benefit rotation (Kattimaru system): When several holders share the ownership of several plots of land in different locations or in the same location under different facilities, those lands are rotated among the holders for an agreed period to equalize the benefits of lands. For example if A, B, and C own the land called X, Y and Z, the utilization of these lands are agreed on yearly rotation basis. Three years in one each of A, B, and C operates the land X, Y and Z. Land leasing system (Badu): Badu is “leasing”. Under the badu system, a farmer can use the leased land for a defined period according to an initial agreement. The beneficiary (farmer) has to pay leasing payment monthly or annually irrespective of profit or loss. Land mortgage system (Ukas): Ukas is the term for mortgage. Under this system, the person to whom property is mortgaged can enjoy the benefit of the land until the mortgagor make the payment to redeem his land. If the mortgagor fails to redeem the land under the agreed person, title is transferred to the mortgagee. Share cropping (Ande): Under the ande system, a farmer cultivates a holding owned by another party subject to the conditions agreed upon mutually between the farmer and the land owner. Agreed condition may be based either on a cash rental or on the basis of share cropping. Before 1956, the law obliged a property owner to supply the tenants with seeds, fertilizer, half the labour cost, etc. in exchange for half of the harvest. But in 1956, the Paddy Lands Act changed the conditions. At present, the owner has a right to the tenant to bear all the expenses of cultivation.

38
Annex V: Distribution of Working and Abandoned Anicuts, Anicut Command Areas and Number of Benefiting Farmer Families
District Number of Working Anicuts
Number of Abandoned
Anicuts
Command Area (acres)
Number of Benefiting Farmer
Families*
Colombo 210 49 4848 7,226
Gampaha 395 165 11448 15,292
Kalutara 401 105 14695 22,968
Kandy 1586 118 21175 31,849
Matale 759 42 13687 19,198
Nuwara Eliya 1112 30 21267 32,130
Galle 504 26 16973 17,155
Matara 825 93 28083 32,808
Hambantota 32 1 893 892
Jaffna - - - -
Mannar 3 6 61 61
Vavuniya 9 1 694 506
Mullativu 3 1 277 99
Batticaloa 17 14 1885 554
Ampara 46 37 4162 1,568
Trincomalee - 1 250 151
Kurunegala 657 104 19697 23,423
Puttalam 63 33 3428 2,256
Anuradhapura 8 1 398 152
Polonnaruwa 119 17 10983 5,221
Badulla 3571 71 32089 55,757
Monaragala 325 47 5400 6,173
Ratnapura 1436 67 28173 45,825
Kegalle 809 32 10522 18,095
Kilinochchi - - - -
* Number of farmers working under the schemes as per farmers opinion and verified with the paddy land register and share list. Source: DAS, 2000


![Distribution pattern, threatened status and conservation ... · PDF fileThe fish diversity of Cauvery river system have been reported [23, 24] including fish diversity of Grand Anicut,](https://img.dokumen.tips/doc/110x75/5a907c7c7f8b9a7f398e0c5a/distribution-pattern-threatened-status-and-conservation-fish-diversity-of-cauvery.jpg)


