Embed Size (px)
Citation preview
257 97 PR ii~i~
Sri LankaAssociationfor the
Advancementof Science
and
NationalWaterSupply& DrainageBoard
PROCEEDINGSPR~WJ1T1ONOF FLUOROSISIN
sm~
Jointly organisedby NWS & DB andSLAAS-E2
SEPTEMBER 1996
257—14138
— —


a
___ £thraryJRC Interqetjon~g~~and Sanitation Centre
Faic: +31 703589964TeL: ÷ai703068980
Preventionof fluorosis in Sri Lankais basedon paperspresentedat the
symposiumheldon14th September1996at theDepartmentofChemistry,
University of Peradeniya,Sri Lanka. This event was sponsoredby the
National Water Supply andDrainageBoard in collaborationwith the Sri
LankaAssociationfor theAdvancementofScience-Section,E-2.
Printedat theprinting unit, FacultyofScience,UniversityofPeradeniya,
Sri Lanka-1997
-_
PREVENTION OF FLUOROSIS IN
SRI LANKA
Edited by
Namal Priyanthaand
J. P. Padmasiri
LIBRARY lAOPa Box 93190,2509 AD THE HAGUE
Tel.: +31 70 3068980Fax: +31 70 35 899 64
BARCODE: I ~ 138LO: ~

42

CONTENTS
Fluoridegeochemistry- An overview. 01CS.Dissanayake
Hydrogeologicalfactorscontributingtowardsfluoridesinwater .15A.LIC Adikari
Fluorosisaffectedpatientsin SriLanka. 31Uditha Weerasingbe
Treatmentoffluorosedteeth 33ltL.Wijeyeweera
Defluoridationmethodusingbonecharasfilter media 37B.M.G.H.Marasinghe
Defluoridationmethodusingbrokenpiecesofbricks asfilter media 47J.P.Padmasiri
Communityattituderegardingfluorosis andlow costdefluoridators 57N.I.Wickramasinghe
Recommendations 69

4

GEOCHEMISTRY OF FLUORIDE - AN OVERVIEW
C.B. DissanayakeDepartment ofGeology,Universi~yofPeradeniya,Feraden~yà -
Abitract: fluorine is consideredas an essentialelementthough healthproblemsmayarisefrom either adeficiencyor anexcessof fluorides. Muchof thefluoride enteringthehumanbody is from waterthoughihthecaseofmostothertraceelementsrequiredby man,foodis theprincipalsource.
fluoridesin the surfaceandgroundwaterarederivedfromfluoride rich rocks andmineralsamongwhichgranites,alkalic rocks,volcanic ash,bentonitesandphosphaticfertilisersaremoreimportant Certainplantsnotablyteaarealsoknownto absorbsignificantly highconcentrationsoffluoride from soil andwater.
In Sri Lanka, the Dry Zone has beenshownto contain excessfluorides in the surface andgroundwaterresultingin higher incidencesofdentalfluorosis. Areasin theAnuradhapuraandPolonnaruwadistrictsin particularareknownto containfluoride levelsfar exceedingtheWHO dangerleveis.Theinfluenceof climateIn the geochemicalcycling of fluoride is markedlyseenin Sri Lankawheresimilar rocktypesInthe two climatezonesyield vastlydifferentfluoride levelsin the associatedgroundwater.
Toothenamelis composedprincipallyof crystallinehydroxyl apatitewherefluoride isabsentin thewatersupply. However,wherefluoride is presentin thewatersupply,someof theingestedfluoride ions areincorporatedinto the apatitecrystal lattice of tooth enamelduring its fonnation, causing the enamelto
• becomeharderand possibly discolour. Recentresearchhas shown that further understandingof themechanismof dentalfluorosisrequiresmorecomprehensiveinformationabouttheeflèctsof fluoride on theIonic compositionof the fluid phase,the natureof the Initially precipitatingmineral(s), the interactions
between crystalsandmatrix proteinsandtheenzymaticdegradationof proteins.
JNFRODUCFION
The application of geochemistryto health hascommencedonly recentlyand there appearsto be vast possibilities for the geochemistto make extremely useful contributionstogeomedicalstudiesin Sri Lanka. Sri Lankaoffers an idealopportunity to the geochemistinview of the fact that the vast majority of the people are intimately associatedwith thephysical environment,over 80% of The populationstill obtaining theft drinking watersuppliesfrom sourcesother than centralwater supplies. The geochemistryof the physicalenvironmenttherefore governs to a verygreaf extentthe generalhealth of thesepeopleandgeographicdistributions of certain diseasesare clearly observed. Further,out of the 10great soil groups, 9 are found in Sri Lanka and this affords an opportunity to thegeochemistto correlatehealthwithsoil chemistry.
Relationshipsbetweenthe geochemicalenvironmentandhumanand animal healthare particularly complex and progress in establishingassociationand causationbetweengeochemicalfactors,healthand diseaserequiresrigorous interdisciplinary research)
Regionalgeochemicalmaps are proving to be of immensevaluein delineatingareasof mineral deficienciesandtoxicitiet The geographicaldistribution of certaindiseases
clearly indicate the important role played by climate, natureof rocks, soils and otherenvironmental factors that control the geochemical pathways of essential chemicalelements. The applicationof geochemicalmapsin investigations on humanand animal

2 CR Dtcsanayake
healtharemoresuccessfulin tropical countriesof the developingworld wherethe effectofthe lithosphere andhydrosphere onhumansandanimalsis far more pronounced.The closàassociationwith the immediate physical environmentbrings about close correlationsbetweenmineralstatusandhealth. Among such examplesare fluoride anddentalhealth,iodine and goitre, selenium and disordersin livestock, etc. For grazing livestock,deficienciesof Co, Cu, I, Fe, Mn, SeandZn tojether with excessesof Cu, F, Mn andMohavebeenrecognized.2~ is alsoknownthatAs, Pb, Cd, Hg andAl are toxic to animals.
Geomedicine is a relatively new discipline which analyzes the impact ofenvironmentalfactorson the geographicaldistributionof somehumanandanimaldiseasea.Dueto the vastimprovementsmadeparticularly in analyticalchemistry,extremelyminute
quantitiesof chemical elementsin the environmentcan now be made and correlationbetweenmineral status and health better understood. Apart from the abundanceofindividual chemical elements in rocks, soils, water and plants the antagonismandsynergismbetweendifferent elementsin human health are now being studied. It issuspectedfor example that selenium can, to some degree, neutralisethe toxicity ofcadmium. Further, it is the ionic species that is far more important, than the totalconcentrationof an element. In the caseof chromium,C? is consideredessentialinnutritionwhile C? is consideredto be toxic. The latter is often linked to the incidence ofcancerin workersfrom chromiumbasedindustries.
The correlation of fluoride in the environment most notably in the surface andgroundwaterwith dentalhealth is one of the most marked correlations,and one that is ofnational importance.3Thispaperdealswith the generalgeochemicalcyclingoffluoride inthe environmentwith potentialapplicationfor studieson humanhealth.
FLUORIDE IN ROCKSAND MINERALS
Table 1 givesthe fluoride-rich mineralsassociatedwith graniticmaterials. Itis knownthatgranitic rocksareparticularlyrich in fluoride-bearingminerals.The geochemistryof thefluoride ion (ionic radius 1.36A) is similar to thatofthe hydroxylion (ionic radius 1.40 A)and there can be easyexchangebetweenthem. Thrtensiveresearchhasbeencarriedout onthe fluoride-hydroxyl exchangein geologicalmaterials.’7 FluorapatiteCa
5(P04)3F andhydroxylapatiteCa5(P04)30Hare isomorphic end members in the apatite solid-solutionseries Ca5(P04)30H, F. Human and other animal teeth are composedmainly ofhydroxylapatite,whereasfossil shark teeth are composedmainly of fluorapatite. Thesubstitutionof hydroxyr by fluoride ion results in the replacement of hydroxylapatiteinteethandbonesby fluorapatite.Fluorides in the surfaceand groundwater are derived fromI. Leachingof the rocks rich in fluorine, e.g. granites 750ppm; alkalic rocks 950 ppm;
volcanic ash and bentonites750ppm; phosphatic fertilisers3.0-3.5%.2. Dissolution of fluorides from volcanic gasesby percolating groundwatersalongfaults
andjoints of greatdepthand discharging asfresh andmineralsprings.

fluoride Qeocheml~try 3
3. Rainwater,which mayacquire a smallamountof fluoridefrom marineaerosolsandcontinentaldust.
4. Industrialemissions,suchasfreons,organo-fluorineanddustin cryolite factories.S. Industrialeffluents. -
6. Run-off from farms using phosphatic fertifisers extensively.
The solubility of hydroxylapatite and the composition of The saturationsolutiondependstronglyuponthesolid contentofthe slurry; thatis uponthe amountof surfaceareaof solid hydroxylapatite in contact with the solute. Generally the solubility ofhydroxylapatite doesnot respondto additions of calcium andphosphate ions. Further,thepresenceof other ions such as Na4and Ct in the solute matrix leads to a decreaseinsolubility andat pH valuesgreaterthan 8.0, thesolubility of hydroxyl apatiterisessharply.8
Table I Fluoride rich miuerals.
Nams formula F (itt %
Fluorite CaF3 47.81-48.80
Cryolite Na3A1F6 51.48-54.37Fluocerite
-
CeF3 - 19.49-28.71
Yttrofluorlte (Ca,Y) (F,O)2 41.64-45.54Gagarinite Na~aYF6 - 33.00-36.60
Bastnasite Ce(C03)F = 6.-fl- 9~94Syxichisite CeCa(C03)2F 5.04- 5.82Parisite Ce~Ca(CO3)3F - 5.74- 7.47
Pyrochlnre NaCaNb3O5F 2.63- 4.31Microlite (Ca,Na)3Ta2O6(O,OH~,F) 0.58- 8.08M~h1ygonite Lik(P04) 0.51-11.71Apatite Ca5(P04)3(FC1OB) 1.35-3.77Herderite ca(BePO4) (F,OH) 0.87-11.32Muscovite -- KA13(AlSi)O,M) (OH,Fl3 0.012- 2.95Biotite K(Mg~Fe)3(A1Si3010)(OR)~ 01.08- 3.50Lepidolite XLi(Fe,M9)A1(A1S14010) (F,OR) 0.62- 9.19Zinuwaldite - KL1FG
2A1(A1513013)(POH)3 1.28- 9.15
Polylithionite KLLA1 (Si4OtQ) CFOH)3 3.00- -7.73Tainiolite KL1Mg3(Si4010)F3 ==- 5.36- 8.56Holmquistite Li2 (MgPe
2’)3 (A1Fe
3~)2(912022) (OH, F)2 0.14- 2.55
HorublerideRiebeckiteArfvedsonitePerrohastingsite
NaCa3(Mg,Fe,A1)5(Si,A1)9O33(OH,F)2Na3Fea
2Fe2
3~(Si4Oij)i(OH, F) 2
HA3FS421Fe2(S1
4O21)3(OH, F) ~NaCaPe4
3~(Al ,Fe3~)(Si~A13O33)(OH, F)3
0.01- 2.900.30- 3.312.05- 2.980.02- 1 .20
Spodumene - L1A(Si03)3 - -- o.oa—-o.ssAstrophylite (K,NA)3(Fe
3~,Mn)4(Ti5i4O14(OH)3 - 0~70- 0.86
Wohlerite NaCa(Zr,Nb)0(Si21O,)F 2.80- 2.98 .
Tourmaline Na(MgFe)3A1~(BO3)~(Si6O15) (OH)4 0.07- 1.27Spliene CaTiSiO5r 0.28- 1.36Topaz A13S1O4(OH,F)3 13.01-20.4~3Yttrobrithiolite (Ce,Y)3C3(5i04)30H 0.50- 1.48

4 C.B. Dbswrayake
Fluorine, the most reactive ofthehalogensis associatedwith manytypesof mineraldeposits and henceis a goodindicator of mineraldeposits.9 The geochemicaldispersionbabesof fluorine from mineral depositsare often detectedin groundand surfacewaters,stream sedimentsandsoils. The higher concentrationsof fluoride in water and soil aretherefore often the result of the occurrenceof mineraldepositsin the vicinity. The fluorinechemistryofgranitic material is relevant to economicprospectingin graniticterrainssincefluorine is associatedwith Sn-W-Mo and REE-Zr-Ta-Be deposits, with Li-Rb-Cspegmatites,rare-metal greisensand albitized granitesand is ultimately responsible forfluorite andcryolitedeposits. Fluorine is locatedin:1. F-richmineralssuchasfluorite,apatite,etc. - - - - -
2. ReplacingOH and 0 ions in muscovite (mean 0.1-0.3%), biotite (meanabout0.7%),homblende(meanabout0.2%) and sphene(range0.1-1.0%). -
3. Solid andfluid inclusions - micasand feldspars,fluid inclusionsin quartz.4. Rock glasses- obsidiansand pitchstones. - -
FLUORIDE IN GROUNDWATER
In the caseof most trace elementsrequiredby man, food is the principal source. Much ofthe fluoride entering the humanbody is however,obtainedfrom water. The geochemistryof fluoride in groundwater is thereföre of special importance in investigations ondistribution patternsof dental caries or dental fluorosis. - -
This is of particular importance to Sri Lanka in view of the fact that the-vastmajorityof the population doesnot have modem pipe-bornewater systems. Instead theydepend entirely on dug and deep wells, rivers, lakes and canalsfor their domestic waterrequirements.
Table 2 showsthe level offluoride in groundwater andtheft impactin health. Eventhough the W.H.O. hasseta dangerlimit of 1.5 mg/I fluoride for drinkingwater, in tropicalcountrieswhere on accountof the higher temperaturesprevailing the amount of waterconsumedmay be higher resulting in a greater intake of fluoride. Figure 1 illustrates themain high fluoride bearinggroundwater areasin Sri Lanka.
It is important to realisethatthe degreeof weathering and the leachablefluoricjein a terrainis of greatersignificancein the fluoride concentrationof water than the merc
presence of fluoride-bearing minerals in the soils and rocks. Christensen—Dharmagunawardhane’°considered the Ca-Mg carbonate-bearing rocks in the MatalePolonnaruwa districts asa goodsink for the-fluoride ion. The leachabilityof fluoride fromcarbonateconcentrationsis controlled by (a) pH ofthe drainingsolutions (b) alkalinity (c)dissolvedCO
2 andpCO~in the soil. Ramesamand Ragagopalan’1who studiedthe fluoride
ingestionin aridand semiaridareasas shownin figure 2.

F7,taildeGeóchemisliy5
Areas with ‘ ~5mgfl ~ground wUt&
CIimafC boundary
ilombantoto
ioo 10 23 39 kilo •(es
Figurel: High fluoride bearinggroundwater areasin Sri Lanka.
Colombo

6 CR Dksanayak.e
Table 2: Impact of fluoride on health (After World Health Organization, Geneva1971,International Drinking Water Standard).
Figure 3 compares the fluoride content in groundwaterfrom different rock typesunder thy and wet conditions in Sri Lanka? Irrespective of the rock types, thegroundwaterremains low in fluoride in the Wet Zone while in the Dry Zone, fluoridereacheslevels as high as 10 mg/i. It is particularly relevant to note thatwhile drinkingwater with high levelsofdissolvediron, which has both a colour an objectionabletaste,water containing excessfluoride is colourless and tasteless, chemical analysesbeingrequired to detectits presence.
FLUORIDE IN PLArcrS
Certain plantsareknown to accumulatefluoride excessively(eg. tea 100 - 760ppm,elderberry upto 3600 ppm). Most plants have 0.1 to 10.10 ppm fluoride (dry weight),whereasforageplantsgenerallyhavehigh fluoride contents(1-300ppm).
ROLE OF FLUORIDE IN BIOMTh4IIRALLSATION
Detailed studieson chemicalandbiochemical studies on fluorotic dentaltissueshave been conducted with the objective of elucidating the role of fluoride inbiomineralisation,understandingandpredictingthe pathogenicsituationsin the long-termprocessoftoothformationandestablishingcriteria for thepubliàhealthuseoffluoride.
Concentrationof fluoride(mg/I)
Nil
Impacton health
0.0-0.5
Limited growthandfertility
Dentalcaries
0.5-1.5
1.5-4.0
Promotes dental health resulting inhealthyteeth,preventstoothdecay
4.0-10.0
Dentalfluorosis
>10.0
Skeletal fluorosis (pain in back andneckbones)
Crippling fluorosis

FluorideGeachemL~uy7
Figure2: Fluoride ingestion.
We’ zone
~tnr~e 4
~ 91’]CS.Grar~zlite ~
a __
~ H
t1cmocki~
flngm
Enrlchinet of Pin cwb~,ate
concret Ions
Re4eos. of F bysdl development
11Flock with ttouride
bearing minerals
Dssolutlon of F~rich surface
~ F by water ~ waterflawing laterally 4
_______ Dissolution of ~by water Poaible r ~dimming, the salt, repreclpitot ~onS Co F& aroundt waterfluoride ricn ~lectlyv -
ground water scavenging p1 F’,
by piormis
Coic oneiaj
Dry zorn
tI’’’
’
GL~J
~L~Jflmgll)
Omotite ii
Dnew~a
Figure3: fluoride content in groundwater from different rock types.
8 CB,Dthsanoyake
Toothenamelis composedprincipally of crystallinehydroxylapatitewhenfluorideis absent in the water supply. When fluoride is present in the water supply, someof theingestedfluoride ionsareincorporatedinto the apatitecrystallatticeof toothenamelduringits fbrmation causing the enamel to become harder and possibly discolour. Thesubstitutionof fluoride for hydroxyl ion proceedssince fluorapatite is more stablethanbydroxylapatiteundermostconditions.
Figure4 illustratesthe changesin the mineral protein andwatercontentsof enameltissuewith developmentableadvancement.’3Cellular activities are known to control theentire processof enamelmineralization,namely:1. Synthesisand decretionofmatrix proteins.2. Transportofmineral latticeions. -
3. Removalofdegradedproducts.
Aoba~observesthat the most distinctive featureof mammalianamelogenesis,incontrast to dentinogenesisand osteogenesis,is that the secretedmatrix proteins aredegraded in-situand removedahnpstcompletelyfrom the tissue during the developmentalstages. He further observesthat anotheruniquefeatureof enamelmineralisationis that,after rapid precipitation of thin-ribbon precursors,mineralisationadvancesgraduallybygrowth of the formedcrystals(especiallytheft thickening) ratherthanby proliferationofthe crystals. -
it is known that the increasein severityof dental fluorosis directly reflects onincreasein fluoride concentrationin the enameL’4Evidencepresentedby Richardset al’5show that the fluoride contentof eruptedfluorotic enamelrepresentsfluoride acquiredduring tooth formation and that oncetooth formation is completed, further uptake offluoride prior to eruptionmaybe negligible. The maximum fluoridecontentof the enameltissue is attainedin the earlydevelopmentstages,while its apparentcontent per tissueweight decreaseswith the advancementofmineralization.~Theuniqueproperties offluoride include:1. increasingthe driving forcefor precipitationof calciumapatitein the form of freeions
inmedia,. -
2. stabilisingthe apatitecrystalswhenit is incorporated.3. enhancingthe adsorptionaffinity of proteins - Toth enamel proteins in developing
enamelandsalivaryproteins in-the oral cavity.’9
The enhancementof protein adsorption onto fluoridated crystal surfaces isexplainedby thehigherstabilityof the crystallinelatticebroughtaboutby the fluoride ions.The enhancedstability implies a lower surilcefreeenergyand hencea weakerinteractionof the surfacewith the water molecules,which should be displacedprior to adsorptionofprotein molecules.

Fluoride Geocheznlclry 9
FLUORIDEAS A GEOINMCATOR -
In severaltropical countriesnotablythosein Asia andAfrica, thereis a high incidenceofdental diseasescausedby an imbalanceof-fluSde ingestion from drinking water. InChina, which is one of-the countries affected by endemicfluorosis, both in ter,ns ofincidence and severity,ZbengandHong2°estimatethat thoseaffectedby fluorosismaytotal more than 30 million.
Parts~afnorthern Tanzania are known fix theft high fluoride waters and endemicfluorosis.2’ The range of fluorideconcentrations in the waters iii various regionsofTanzania differs markedly, depending largely on the bedrockcomposition.Aswathanarayanaeta!.22 reported that the highest average-contents occur within thenorthernvolcanic regions(Arurha3.5-78.0mg/I, Kilimanjaro 0.4-2.8mg/I, Mare 0.9-8.0mg/I) andin somecentralregions (Sing/dr 0.7-24.0mg/i), whereascontents weregenerallylow in coastal regions (e.g.Mtwara 0.20-0.9mg/I). If the WHO levelofa maximumof 1.5mg/i for drinkingwater is accepted,most of the waters in thesepartsof Tanzania must beregardedasunsuitablefor drinking.
In Sri Lanka,groundwatersin largepartsof the Dry Zoneare also knownto containhigh fluoridecontents.3Fluoride-bearingmineralssuch as biotite, hornblende, apatiteandfluorite areabundantin rocksin thisterrain. Severalpartsof the North CentralProvincehave groundwater with fluoride concentrationsin the range1-7 mg/I, andthere is clearevidenceofendemicfluorosis in the children living in theseareas.
In parts of the Indian Peninsula,high fludride groundwater is also commonandconstitutesa serioushealth problem?3 At least I miffion peoplehr India areknownto besubject to excessiveintake of fluoride?’ In partsofAndhra Pradesh, Kantitaka and TamilNadu, fluoride concentrationsof asmuch as 20 mg/I have beenrecordedin greundwater?3Skeletal fluorosis is alsocommonin partsof Indiawherewater fluoride levelsexceed5
mg/i.
Onekeyissueof relevanceto geoindicatorsthatneedsto be investigatedin detail isthe determination ofthe optimal levelsoffluoride in drinkingwaterfor hot anddry tropicalclimates. The WHO guidelinesfor the upper limit of fluoride in drinking waterhaslongbeenregardedas unsuitablefor tropical countries. As shownby Meyers,1’ levelsup to 1.5ing/l in drinking waterin temperateclimatesproduceonly questionableandmild fluorosisofno public health risk. However, in a tropical country suchas Kenya,onthe other hand,it has beenshown27thatevenfluoride of 0.1-1.0mg/I in drinkingwaterproduceavery highprevalenceand severityof dentalfluorosis. The recentwork of Waniakulasuriyaetaf’8 inSri Lankaaddsfurtherevidencethatin hot dry climates,there can be dentalfluorosisevenwheregroundwatercontainsfluorides lessthan0.3 mg/I. It wasshownthat amongthoseconsumingdrinkingwater -1.0mg/I fluoride, 32% ofthe childrenhadmild and 9% severe

Jo CADicsanayake
forms of dental fluorosis. This work provides further reasons to change the WHOguidelines for the upper limit offluoride in drinkingwater.
Basedon the work of Warnakulasuriyaet.al.,28 the author recommendsthat thislevel be 0.8 mg/i for those living in hot, dry tropical countries. Here the mean airtemperature is high and the amountoLwater consumedis higher than in temperatecountries, with the result that the actual fluoride ingestion is high, even if the groundwaterfluoride levelsare relatively low. As shown in Figure 5, the CommunityFluorosis Index(CFI) maybe a bettercandidateas a geo-indicatorfor dental health. The CR is an indexwhich takestemperature into account,andis basedonthe premiserthat the amountof wattrconsumedishigher in hotter climates. Thus, evenwith low groundwater contents,becauseofthe higher intake of waterthe fluoride ingestedmayhave a similar effectto thatof lowerintakeof high fluoride water in coolerclimates. It should alsobe notedthat deficiency influoride causesdental caries,anda minimum levelof (15mg/i in wateris recommended.
AineLob lasts
~l4,
tit
Developmental Age
I~Plll~les
lr*rfport ot 1at1I~ In I
Figure4: Mineral protein and water contentof enameltissne.

FluorideGeochem~shy 11
.10
E00
10 15
MeQn cnnuo( temperatureI °C
Figure5: Communityfluorosis Index.
12 GB. DLcsanayake
References
1. Plant,J.A., Baldock, J.W. & Smith, B. (1996). The role of geochemistryinenvironmental and epidemiological studies in developingcouniries:A review in:Appleton, J.D., Fuge, it & McCall, G.J.H. (eds.) (1996) EnvironmentalGeochemistryandHealth GeologicalSocietySpecialPublication (U.K.) 113: 7-22.
2. Appleton, J.D. (1992) Review of the use of regional geochemicalmaps foridentifying areas where mineral deficiencies or excessesmay affect cattleproductivity in tropical countries. British Geological Survey Technical ReportWC/92/94(Unpublished).
3. Dissanayake,C.B. (1991). The fluorideprobleminthe groundwaterof Sri Lanka -
environmental management and health. International Journal of EnvironmentalStudies38: 137-156.
4. Gillberg, M. (1964) Halogenand hydroxyl contentsof micas and amphibolesinSwedishgraniterocks.GeochemicaetCosmochimibáActa28: 495-516.
5. Stormer,J.C. & Carmichael,I.S.E.(1971). Fluorine - hydroxylexchangein apatiteand biotite. A. potential geothermorneter.Contributionr to Mineralogy andPetrology31: 167-169.
6. Ekstrom, T.K. (1972). The distributionof fluorine amongco-existingminerals.Contributlom to MineralogyandPetrology34: 192-200.
7. Munoz, J.L. & Ludington, S.D. (1974) Fluoride-hydroxyl exchangein biotite.AmericanJournal ofScience274: 396-413.
8. Zack, A.L. (1980). Geochemistry of fluoride in the Black Creek aquifer systemofHony and Georgetown Counties, South Carolina - and its physiologicalimplications.GeologicalSurveyWaterSupplyPaper2067(U.S.A.) 33.
9. Lalonder, J.P. (1976) Fluoride - an indicator of mineral deposits. Institute ofMining andMetallurgical Bulletin 69: 110-122.
10. Christensen, H. & Dharmagunawardbane,H.A. (1986) Hydrogeologicalinvestigations in hardrock terrains with special emphasis on Matale andPolonnaruwaDistricts, in : SomeAspectsofJhe Chemistry ofthe Environment ofSri Lanka. Dissanayake,C.B. & Gunatilake,Leslie (Eds.). Sri LankaAssociationfor the AdvancementofScience.SpecialPublication,25-45.
11. Ramesam,V. Rajagopalan,K. (1985) Fluoride ingestioninto the naturalwatersofhard rockareas,PeninsularIndia. Journal ofthe GeologicalSocietyof India 26:125-132.
FluorideCleochemicny 13
12. Dharmagunawardhane,H.A. & Dissanayake,C.B. (1993). FlUorideproblemsin SriLank& EnvironmentalManagementandHealth 4: 9-16. -
13. Aoba,T. (1994) Strategiesfor improvingtheassessmentofdentalfluorosis: Focuson ChemicalandBiochemicalaspects.Advancesin DentalResearch8(1): 66-74.
14. Richards,A., Fejerskov,0. & Baelum,V. (1989) Enamelfluoride in relation toseverityofhumandentalfluorosis. Advancesin DentalResearch65: 143-153.
15. Richards, A., Likiman, S., Baelum, V. & Fejerskov, 0. (1992) Fluorideconcentrationsin uneruptedfluoritic humanenamel. CariesResearch 26: 328-332-.
16. Hammarstrom~L. (1971) Distribution in developingrat enamelof simultaneouslyinjectedfluoride andcalciuntScandinavianJournal ofDentalResearch 79: 369-376.
17. Speirs,R.L. (1975) Fluoride incorporationinto developingenamelof permanentteethin domesticpig. Archivesin Oral Biology20: 877-883.
18. Weatherell, l.A., Dentsch, D., Robinson, C. & Hallsworth, A.S. (1975).Assimilation of fluoride by enamelthroughout the life of the tooth. CARIESResearch11: 85-115.
19. Varughese,K. & Moreno, E.C. (1981) Crystal growth of calciumapatitein dilutesolutionscontainingfluorideCalcic. Tissuemt. 33:431-439.
20. Zheng,B. & Hong, Y. (1988) Geochemicalenvironmentrelatedto humanendemicfluorosis in China In : Thornton, L (ed.) Geochemistryand Health. 93-96.Proceedingsof the SecondInternationalSymposium. Northwood, U.K. ScienceReviewLtd..
21. Nanyaro,J.t, Aswathanarayana,T.S., Hunngure,T.S. & Lahermo,P. (1984) Ageochemicalmodel for the abnormalfluoride concentrationsin watersin partsofNorthernTanzaniaJournalofAfrican EarthSciences2: 129-140.
22. Aswathanarayana, U., Lahermo, P., Malisa, E & Nanyaro, J.T. (1985) Highfluoride watersin an endemicfluorosis area in NorthernTansania. Proceedings,InternationalSymposiumon Geochemistryln Healtk London RoyalSociety.
23. Jacks, 0., Rajagopalan,T., Alveteg., T. & Jonsson,M~(1993) Genesisof high -Fgroundwaters,SouthernIndiaAppliedGeochemistry,SupplementaryIssue2:241-244.
24. Krishnamachari,K.A.V.R. (1974) Ari epidemiologicalstudyofthe syndromegeauvalgumamongresidents of endemicareasof fluorosi.s in AndhanPradeshIndianJournalofMedicalResearch62: 1415-1423.

14 C.& Dicsanayake
25. Handa,BSK. (1975) Geochemistryandgenesisof fluoride containinggroundwater
in India Groundwater13: 275-281. -
26. Meyers,H.M. (1988)Fluorides anddentalfluorosis Monograph.Oral Science7.BaselKarger. -
27. Mangi, F., Baelugi, V. ctFejemkov, 0. (1986) Fluoride, altitude and dental
fluoomsisCariesResearch20: 473-480.
28. Wamakulasuriya,KA.A.S., Balasuriya,S. Perera,P.A.J. & Peiris, L.C.L. (1992)Deternaining optimal levelsof fluoride in drinking water for hot dry climates - acasestudy in Sri Lanka CommunityDentalandOralEpidemiology20: 364-367.

RYDROGEOLOGICAL FACFORS CONTRIBUTINGTOWARDSFLUORIDES IN WATER
A.!. Adikari - -
National WaterSupply& DrainageBoard
Abslract: High fluoride contentin grouo4wateris amain waterquality problenain manyparts of the islandspeciallyin dry zoneareas.This paperdescribesthegeolo~calandhydrog~ologiqalfactorscontributing thefluoride contentin water. Thenaturalfluoridecontentin waterin. diflintit areasvarywith thesourceof water,geologicalfomiatlon oftheareaandtherainfall andamountofwaterlossthroughevaporation -
With the availabledatain NWS&DB, thecorrelationbetweenfluoride contentandpH values,TotalHardness:CalchanHardness,Alkalinity andtheElectricalconductivity Is disutissatiThe climaticcondition oftheareaplayanimportantrolewith thefluoride contentin groundwater,asrainfallinfluencenotonly rechargetothe subsurfacebut also its chemicalcomposition.Similarly the temperaturein theareaeffect the quantity ofdrinkingwaterintakeby localpopulation.
Duringthepreparationof MasterPlanfor WaterSupply andSanitationin Annracthapwadistrict, fieldstudiess~ecarriedout t& mproveunderstandingofiflUoride occuiraiceasaresultofthenaturallygivenfactorssuchasgeologicalandhydrogeologicalregimes. - - - -
Theresultsobtainedfrom the fluoride studiesindicate that the concentrationof Fluoride in ground-water displays a dynamicbehaviorassociatedwith the variations in space and time of the geochemicalandhydrochernicalenvironmentThefield study showedthatconsiderablevariationsIn fluorideconcentrationsmaybeeiq~eriencedwithin aneallareawiuith opensthepossibilityoflocatingwatersourcewith acceptableFluoridecontentsevenwithin highFluorideareas: - -
The field studyalsodemonstratedthatonepossibilityof locatingwallswith low Fluoride contentis totakeadvantageof seepagefrom surfacewaterbodies.
INTRODUCHON -
High fluoride contentin groundwaterbeinga main waterquality problem in manypartsofthe island’ specially in Dry zoneareasin AnuradhapuraDistrict, a studywascarriedout toestimatethe extentof the problem.Detailedstudiesweredoneto improveunderstandingoffluoride occurrence as a result of the naturally given fators a geolggical andhydrogeolpgicalregimes.2 - - - -
The studycomprisedthefollowing activities: -- - - - - -
1. Initial samplingfromthreevillages,followed by selectionofonevillagewith high fluoridecontentfordetailedinvestigations.
2. Detailed investigationinvolving samplingof waterfrombothdugwellsandtubewells,collectionofsoil samplesfor desoiptivetests,anddrilling ofexperimentalboreholes.
3. Groundwaterlevel & qualitymonitoringprogrammein 175Agriculturalwells inAnuradhapuraDistrict.
In additionto the detailedstudieson fluoride reported in this paperthegeneraloocurrenceanddistributionoffluoride in the district ispresentedanddiscussed.

16 A.LKAdIAaM
SOURCESOF FLUORIDE
There are three potential sourcesof fluoride in the Anuradhapura district; overburden,basementand fracture in the basementIn the overburdenthe probablesourcesfor fluorideare secondarymineral phasessuch as clay mineralsand Fe-andM-hydroxides formedthroughintensiveweatheringofbedrock.
In thebedrockpotentialsourcesof fluoride aremostlikely fluorite, apatiteandmicas,especiallybiotite. In fracturesfluoride- couldstemfrom fluorite andother secondary,lowtemperaturemineralphasesprecipitatedon the walls ofthe fractures?
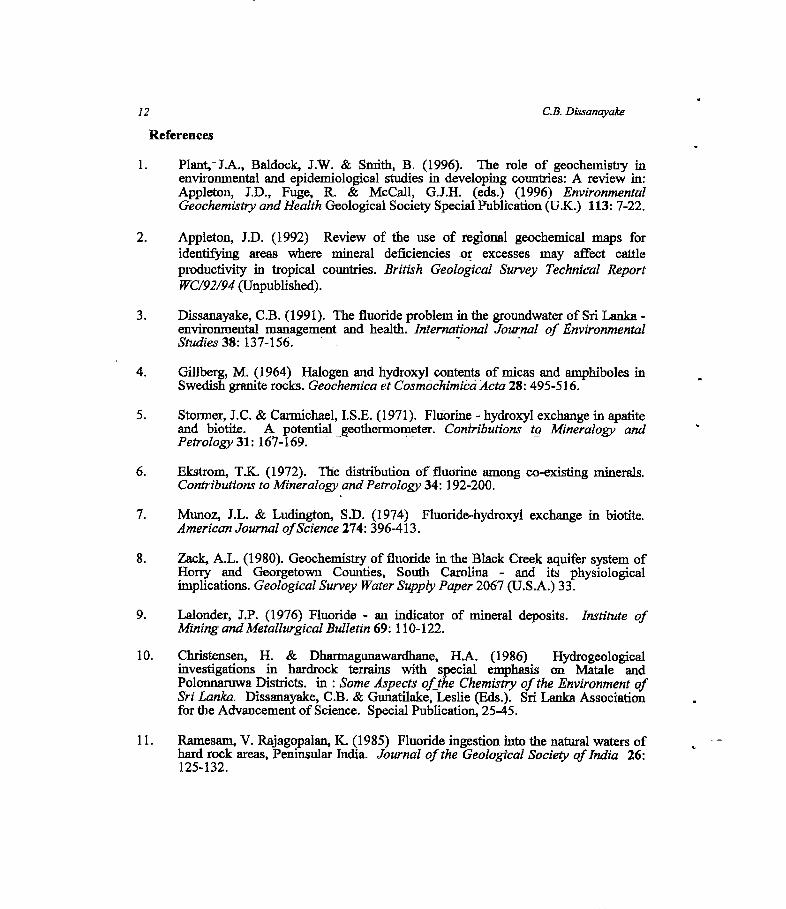
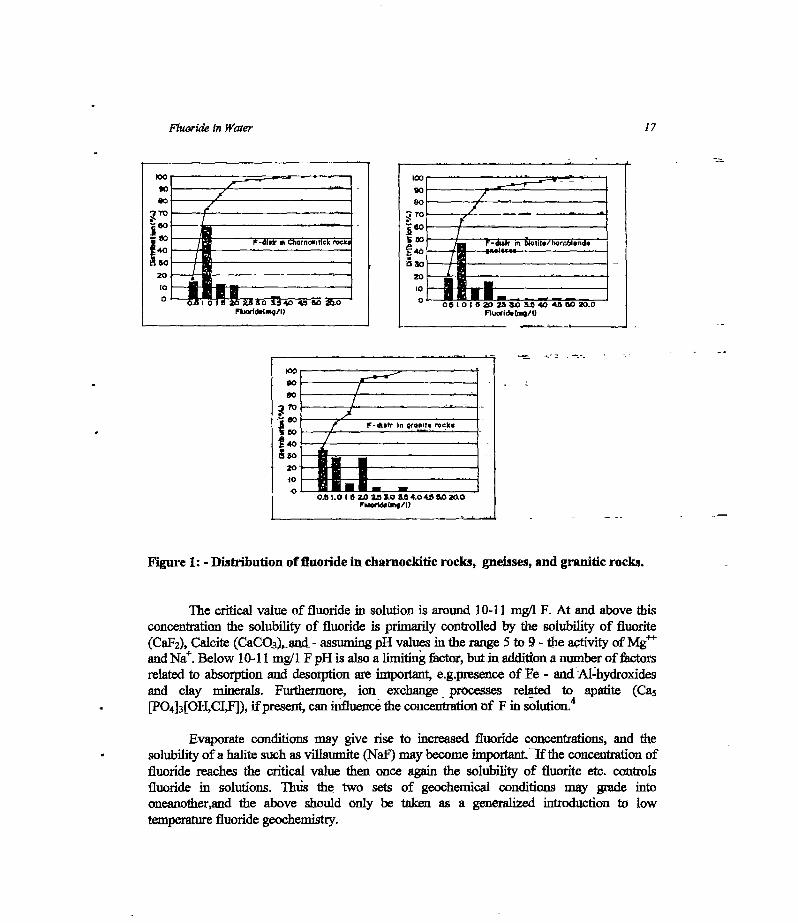
An attemptto correlatethe fluoride analysiswith geologywasdoneby plotting 643well locations from the NWS&DB water quality samplingprogrammeon scale 1:63,500geologicalmapsfrom the Anuradhapuradistrict, andtherebyobtaininginformationon theprobable host-rock. Only 540 wells of the 643 analyzedfor fluoride couldbe plotted,duetolack of geologicalinformation.It wasfound that approximately98% of the wells occur inonlythreerocktypes;Chamockiticrocks (195),homblende-biotitegneisses(300)andgraniterocks(32).
The results,displayedin frequencydistributiondiagrams,areshownin figure 1. Boththe fluoride contentsin the charnockiticrocksandhomblende-biotitegneissesdisplay log-normaldistributions,typical oftrace elementsin thegeochemicalenvironment.Hornblende-biotite gneisses,though, have a higher proportion of anomalousF-values than thechamockiticrocks. - - - -- -
The fluoride distribution in the graniterocksin. abnormaL Wells in this rock typeapparentlycontainthe highestfrequencyof F-%’aluesbelow0.5 mg/I FandatihesametimeahighfrequencyofF-valuesin the rangeof 1.5 - 2.0 mg/I F. Howeverwith the low numberofsamples(32) thisdistributionisnot statisticallysigpiflcant,andmanymoresampleswouldberequired to verifya possibleanomalousdistributionof fluoride in granite rocks, although thisis consideredunlikely. -
FLUORIDE GEOCEEMISTRY
A greatnumber of factorsinfluenceIluoridesolubility mobility andprecipitationinthe saturatedzoneand in view of this the beststartingpoint for a discussionof nomalousfluoride occurrences( relative to the Sri Lankan Standard1.5 mg/I F limit) in theAnuradhapuradistrict is to observe the range of aflomalousfluoridevalues,shownin figure2. The reason for doing so is thatbelowa certain critical value of F in solution onetype ofgeochemicalprocessesprevails,while abovethis valueother limiting conditionscontrol Fsolubility.
fluoride In Water ‘7
Qo,—~-----
7/
~-dlfl m ~,crno~c,ffckrock
I0
:v-’~60
ic:
~20J
‘ iiJ~ ~fliorfd,(i~g/I~
10
~eo -r-d~srr In QfonI?s rock;
-.--~.
~40 .
icso20
-
-
~o*
03 hOI — —I ~ 202310 234~04a~0Z0.0
Fworldilzng/I)
Figure1: - Distributionoffluoridein charnockiticrocks, gnelsses,andgraniticrocks.
The critical valueof fluoride in solution is around10-11mg/i F. At and abovethisconcentrationthe solubility of fluoride is primarily controlledby the solubility of fluorite(CaF2),Calcite (CaCO~awt- assumingpH valuesin therange5 to 9-theactivity of Mg~andNa~.Below 10-11mg/i F pH is alsoa limiting factor, butin additionanumberof factorsrelatedto absorptionand desorptionareimportant e.g.presenceof Fe - and.Al-hydroxidesand clay minerals. Furthermore, ion exchange processesrelated to apatite (Ca5[P04}3[OH,CI,FJ),if present,caninfluencetheconcentrationnf F in solution.
4
Evaporateconditionsmay give rise to increasedfluoride concentrations,and thesolubiity ofa halitesuchasvillaumite (NaF)maybecomeitiipoitant.~If the concentrationoffluoride reachesthe critical value then once again the solubility of fluorite etc. controlsfluoride in solutions. Thus the two sets of geochemicalconditions may grade intooneanother,and the above should only be taken as a generalizedintroduction to lowtemperature fluoridegeochemistry.

ILI
10
0
Fluoride (mg/I)
A.IKAdIkarI
Figure2: Fluoride contentin water from the NWS& DII iarnpling programme(A) and the masterplan samplingprogramme (B).
‘8
A
i
LI
B
0 0-Os II - IS C I - 2* 5-I 55 4-i 45 ~i 55
os jo I 6 2•O *e so 5 6 40 46 5-0
Fluoride (mg/i)
100
SO
10
40
O~0 0.6 I~i- IS Z~I 25 II 54 41 4.~ 5.J0$- I-S IS 2~0 I-S 1-0 5* 4-0 41 eo
Fluoride in Water ‘9
CcIcitn 1mg/Il
-— rr.
T1- OoCalciwnlinq/II
- . :~1 -a - -
— -
-~~~1~
20
It.21:
- 2c
I Tht0
: 11: J1~-r -
-
,
COO
•S~j~.
115
~!l0I. — —
—
~it~~.2J10 40
-C
-[Il:
I
Cl0
ci
r,t
-t
-
_______________________________-r r-rj-aC ~‘~--r~’~-- t.fl ~ ~ y~~nc9J C”’ -~
____H3- -
IC -r- —-
-
c ci!, -- ~ I~tcflvSyllM~I IOU 1000 16000
- ~ -~‘±~~
—
-- ,- - :‘“~~-4%j,- c/?~~t~t.
________________ I 4-+-—rr--~,~’~-~ ri.t
;: -~ !.t? ‘—-
-
1z~1 -:I c4 -
_______________-
____ ___ I r121fr___________ oci ~ 4
-b 5-. -~ ~s 1 IIT
• I
S -. — -
44
4
r- —~a~-ET1 w212 114 m256 114 lSBT
1-5 ~ ntrui a-s
Pt.
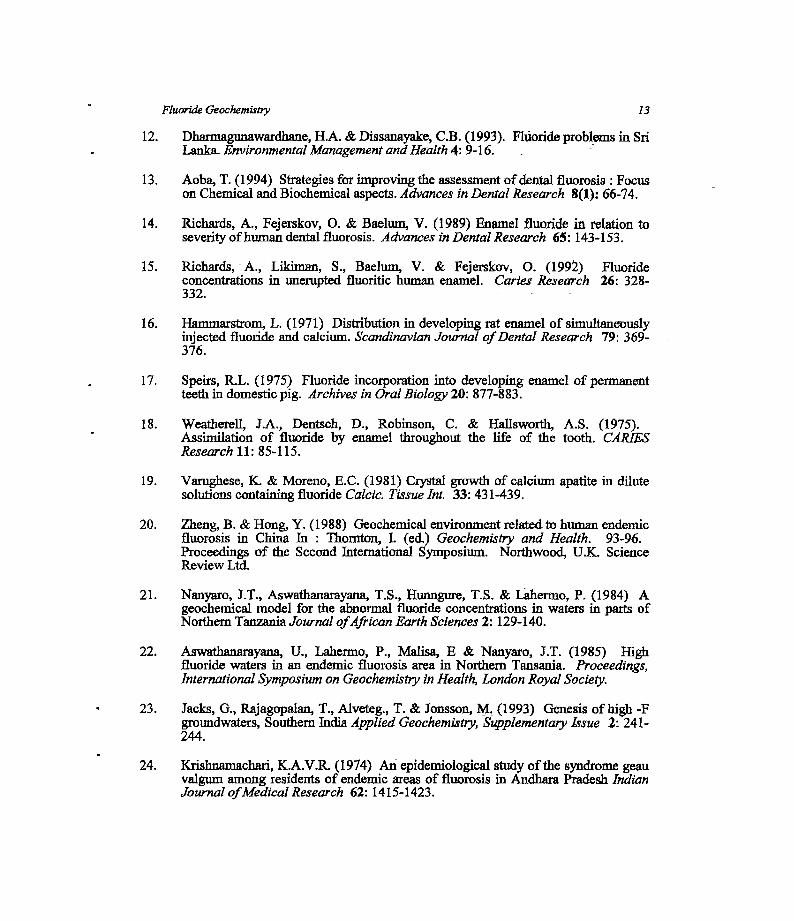
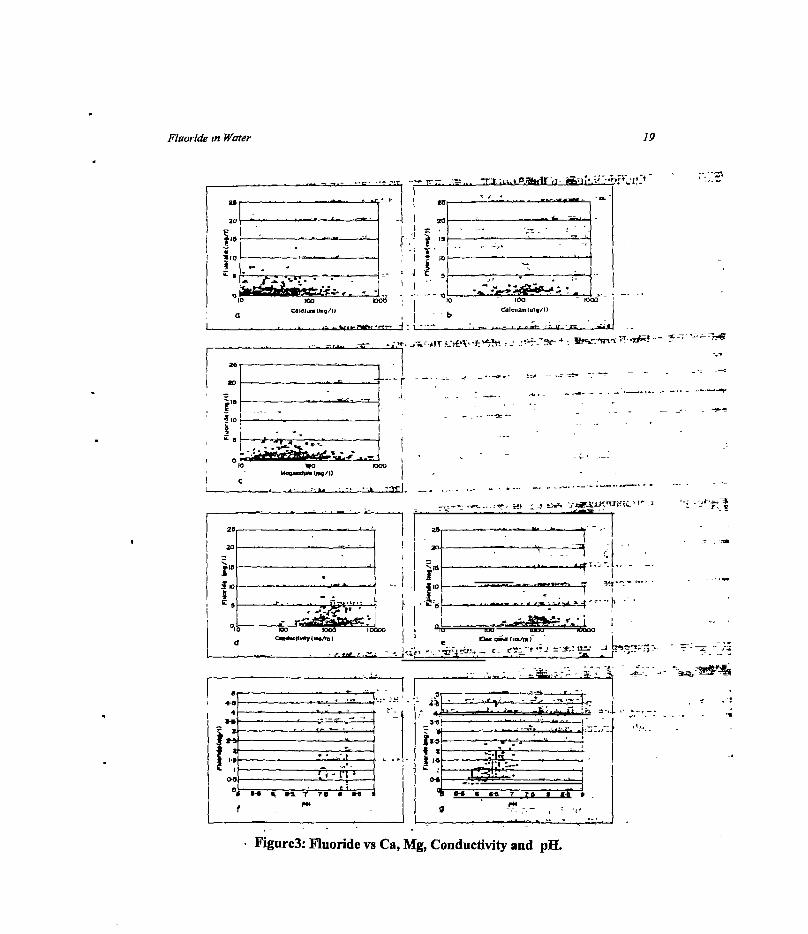
Figure3:Fluoridevs Ca, Mg, Conductivity and pH.

20 A,LKAdikari
Fromthe distributionfrequencydiagrams(Figure 3) it is apparentthat anomalousfluoridevaluesin the Anuradhapuradistrict lie in the rangeof 1.5 -10 mg/I. Consequently,the main processesgoverning fluoride solubility should be pH-controlled adsorption,desorptionthroughion-exchange.Theexchangingion is typicallythehydroxyl-ion(OH).Theactivity of dissolvedsolidsinwaterincludingCa~andNa~mayalsouifect the concentrationoffluorideinsolutionduetopossiblecomplexing. - -
The apparentinsignificance of fluorite and calcite soluhility on the fluorideconcentrationin the Anuradhapuradistrict is indicatedfront figure 3 (a and b). Plots offluoride concentrationversusCashowno correlationat all. The lack of complexingbetweenF andMg1t which is consideredapàtentiàllyimportantcompléxingagentat bothhighandlow F concentrations, is evidentfromfigure 3c.
The effect of overall dissolved solids, here illustrated by the conductivitymeasurementsin figure 3 (d and e), alsodisplayan apparentcompletelack of correlation
1suggestingthatthe behaviorof F is independentof otherionsin solution, i.e. complexingisnotimportant.
However,noteshouldbetakenof the factthatthe NWS&DB analyticalprogrammeandthe presentsamplingprogrammedo not include analysisof sodium (Na), which1 asmentionedearlier, may act as a complexingagentfor F in solution,and could influencethecorrelationbetweenF andconductivity.
Also shownis aplot ofF versuspH for the two samplingprogrammes(Figure3f and3g). Only the present samplingprogrammeshowsa correlation (The lack of correlationinthe NWS&DB samplesmayreflect the handlingof samplesafter sampling,as it is possiblethat sometimeelapsedbetweensamplingand analyses.Oxidation of e.g. iron and degassingthroughlossof CO2couldeffectthe laboratorymeasurementsof pH).
The positive correlationbetweenF concentrationand pH is probably related tochangesin surfacechargesof amorphoushydroxides,but is morereadily understoodwhendiscussedin relationto the fluoridefield studybelow.
To concludethe presentationof the graphs in figure 3. It is suggestedthat theoccurrenceof fluoride anomaliesin the Anuradhapuradistrict primarily are controlledby“below critical value”geochemicalprocesses,suchas ion-exchange. -
FLUORIDE FIELD STUDY -
Threevillages wereseleptedin high fluorideareasof Añuradhapuradistrict basedonalreadyexistingdataand on prevalenceof dentalfluorosisamongchildrenin the area.Aftersampling representativewells from the three areas,the village with highest fluoride
Fluoride In Water 21
~OUNDW~T~ caaot~---i4I--’~
CM, ABOVE M.5.L)
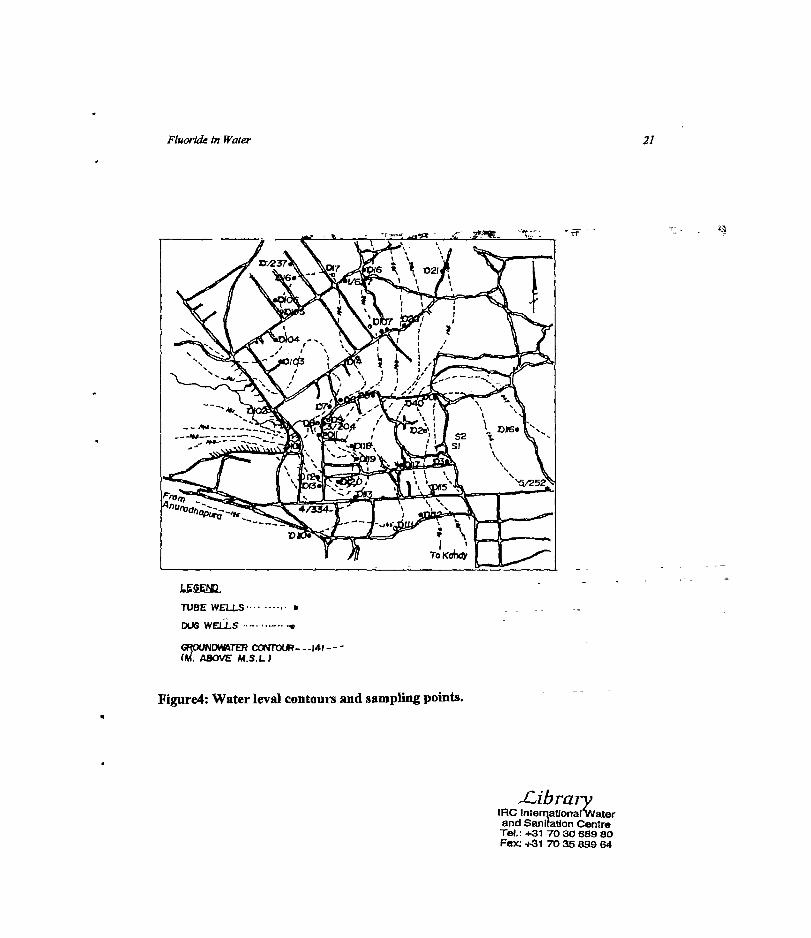
Figure4:Water levalcontours and samplingpoints.
Library(AC Intorqational’watorand Sanitation CentreTot: ~31 703068980Fax: +S1 703589964
TUBE WELLS
DUG WELLS “-

22 - AtLXAdIkarI
STUBE WELLS.
DUG WELLS. 0
FLUORIDE ~ - - - -
(mg/I)IRRIGATION CHANNEL-’
FigureS: fluoride valuesin weHs.
n-i r\ ~J.
FluorIde In Water 23
concentrationin the sampleswas selectedtbr detailed investigation.In this village area~ 3 km2 ENE of Anuradhapura town a field studywas cartedout comprisingsamplingof groundwaterfrom bothdug wells andtubewellsinadditionto samplingof soilsamples in 5-8 in deepprofiles from the walls of three selçcteddug wells. The areacomprising around 5 km2 was selected because it is characterizedby anomalousconcentrationsin groundwater.Theaimof this preliminary investigation was thereforeon amore detailed scale to study possible mechanisms leading to locally anomalousconcentrationsof fluoride. -
It shouldalsobe emphasizedthatwhile somedugwells showhighfluoride contents,up to 8 mg/I, neighboringwells only 300-400mawaymayonly contain lessthan 1 mg/I,illustratingthatanomalousfluoridevaluesarenot necessarilyaregionalphenomena,butmaybe highly localize& -
fluoride in groundwater - - - -
Water sampleswerecollectedfrom 38 dugwells and 6 tubewells in the village Henawatte3km2 ENE of Anuradhapura town. The locations of the sampling points and fluorideconcenfrationsareshowninfigures4and5. - : - - - - -
The groundwater contoursshownonthis map are basedon the measuredelevationofthe ground level minus water level of the samplingpoints, with respectto a fixed arbitrarydatum in the area.
Anomalousfluoride valuesoccurin the northerncentralandsouthernpartsofthe areaand the highestmeasuredconcentrationis 8.15 mg/i F. It is seenfrom the maponfigure 5.that high fluoride areas appear to be located in areas of groundwaterdischarge(downgradient). The consequentlyunexpected low fluoride concentrationin the groundwaterdischargeareain the west maybe explainedby the presenceof an irrigation canal whichcontributesto the dilution of groundwater through seepagein to the overbunlen.It hasalsobeenobservedthatthe elevationofgroundwateris influencedby this irrigationcanal.
The apparentimplications of figures 4 wid 5 for the fluoride distribution in thisspecificareaareasfollows. Overburdenwithin asmallrechargeareais characterizedby highbaQkgrounclvalues,whichduring rainfall is leachedfrom the soil and transported toireas ofgroundwaterdischarge.Con*inedwith evaporationthesetwo factorscouhI be importantmechanismsin concentrationof fluoridein localizedareas. - -
fluoride in dug wells/tubewells
The fluoridecontentin groundwaterfromwatersupplyboreholesand experimentalboreholesin the area wasalsomeasuredforobservingthe situationin tubewells.The fluoride levelsof

24 AdKAdIkart
boreholewaterappearedto be consistentwith the fluoride concentrationsin the dugwells inthe vicinity ofthe boreholes(Table 1).
The similarvaluesin boreholesandnearbydugwellsindicatethatthere canbe a geodhydraulic connectionbetweenthe water bearing horizonsof dug wells and tube wells orcontributionfrom fluoride sourcesaremore or lessthe samefor bothwell types. -
Water sampleswerecollectedfrom differentdepthsof the experimental boreholes.Sampleswerecollectedduring drilling wheneverawaterbearinghorizonwasencountered.Itwas difficult to observeany correlationof the-fluoride contentwith differentdepths.It washoweverclearthatthereis an effect-on the total fluoride concentration in the samplesduetothe differences in gonlogicalformations.Mixing of water from the overburdenas welL asfrom differentfracturesmadethe identificationof zoneswith low and high fluoride contentdifficult. One experimentalwell was pumpedat aconstantrate for 3 hrs. and sampleswerecollectedat every 15 minute intervals. The fluoride concentrationof the water samplesobtainedareasshownbelowin figure 6.
it is seenfrom the figure that fluoride concentration fluctuatesduring pumpingbutwithout any definite orderof magnitude.This situationmaybe explainedby the fact thatground water even within a short distancecan have different fluoride concentrationsdependingon the solubility oIfluoride in waterunder the prevailing conditionswithin theaquifer.Whenpumpingis continuedthe waterfrom distantpartsentersinto thewell so thatdischargewater from the pumpshow~fluoride concentrationcorrespondingto thoseareas.
Togetherwith fluoride, someother chemicalparametersin the water sampleswerealsoanalyzedduringpumping Theseparametershoweverdid not showany fluctuationwithanoticeableorderofmagnitude. -
FLUORIDE1NSO1L~ - -
Parallelwith the watersamplingprogramme,a soil samplingprogrammewascarriedout toassessthe desorptivepotentionalof the soil with respectto fluoride. En other words, howmuchfluoridecanrainwaterpotentiallyleachfrom the overburden.
Most of the dug wells in the study area were inspectedand the compositionof thebedrockdetermined.In the study area the rock type-is typically biotite rich homblend-biotitegneisssometimesgradinginto a schiständwith obcasionalintercalationsofthin bands (cm)of granitic/pegrnatiticcomposition. -

Fluoride In Water
Table 1: - Fluoride concentrationsin tube wells and dugwells.
25
BoreholeNo.
5/232 4/334 3/204 3/201 I~TI FT2 F1’3 1/627
Fluoridecontentinbore-hole
water
0.72 1.25 4.65 1.05 1.1 2.9
-
0.75 5.5
Fluoiidei.nnearestdug
wells
1.06 1.70 4.65 1.5(1 1.69 7.9 0.30 6.2
IDugweilNo. D116 D113 Dli D19 D3 D5 D103 D17
Ezz
1-Ui
8
8U.
4.0
3.5
30
25
20o is 30 45 60 75 90 ~D5 120 1.35 150 165 180
TIME IN MINUTES
Figure6: - Fluoride fluctu~ionduringpumping.

26 A.LK.Adlkarl
The soil samplingwas donein threedugwells takento berepresentativeof the area,andin eachdugwell wail weretakenat 1 m intervals.A generalizedprofile of the dug wellandsoil/rockcharacteristicsis givenin figure 7. Theprofile showsthathematitestainedred-earth,typically sandy-gravelyloam,occursin theupper 1-1.5m oftheproffle. Thenfbllowsa2-5 m thick zoneof highly to moderatelyweatheredbedrock,with asandy- gravely texture.A relativelythin zoneto slightly alteredor unalteredbedrock
A simpleanalyticalprocedurewaschosenconsistingof placingaknownquantityofsoil sample(10 g) in 90 ml of cia-ionizedwater for 1 hr, and stirring every 10 minutes.Thereafterawater&le wascollectedandanalyzedfbi fluorideandpif Thnampleswerethen left for 48 bra. andagainawatersamplewas takenandanalyzedfor fluoride andpETheresultsareshownin Table 2.
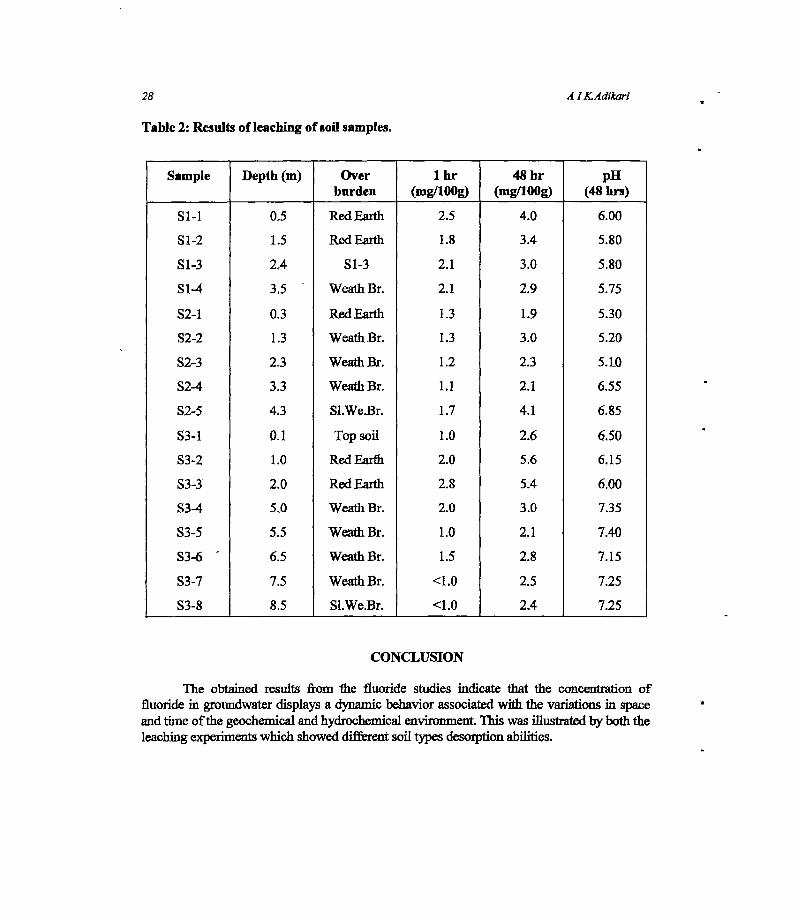
The desorptionexperimentshowsthat after 1 hour fluoride concentrations in~thedeionizedwater range from less than 0.1 to 0.28 mg/i correspondingto a maximum ofleachablefluoride from soil of 2.&mgFf100g soil. The greatestdesorption occur in the red-earTh,while low valuesareassociatedwith sandy,biotitehighly weatheredbedrockAfter 48hoursthe resultisan increaseddesorptionof between0.2and0.56 mgTF/l correspondingto amaximumleachablefluorideof 5.6mgFf100g soil. The pH after 48hours lies around6.5t0.75.
Studies of desorptionof fluoride from soil are limited, but availabledata frominvestigationsin India showthatdesqrptionvaluesafter48 hours of leachinglie in the rangeof 0.25 - 1.5 mg Ff100 g soil. Comparedto thesevalues the resultsfrom this investigationindicatedatendencytowardsthe redearthashavingahighdesorptionpotentialwith respectof fluoride, while the desorptivetapabilityof weatheredbedrockappearsto be lower. Thedesorplivecapabilityof the redearthmaywell bedueto the presenceof Al-hydroxides,as itis foundthe OH ‘will readily exchangefor looselyF absorbed on the surface of amorphousAl-hydroxides, one of the productsof weathering in tropical climates. This relationshipbetweenOH andF maybe the primereasonfor the observedcorrelationbetweenpH andF(Figure3g).
Othersourcesof fluoride suchasfracturesremainto be investigated.The existenceand possible influence of fractures as e.g., conduits for groundwater flow and thusconcentrationof fluoride in areas of limited extent, should not be disregarded. Meanwhile~the presentresultsgive a first indicationof apotentialsourceof fluoride and alsoapossibletransportmechanismwhich ultimately gives rise to localized areasof groundwater withanomalousfluoridecontents.

27Fluoride in Water
__________ Soil/rock characteristics
Top soil max.l-O.2 cm thick anddistinguished from red earthby a darkercolouring,possibledue to organiccontent.
Redearth : Sandy to gravely loam withcharacteristic hematite staining.Often
- cQntams horizons with mm-cm largequartznodules.Generally 1-2 m thick.
- Weatheredbedrock Generallyhighlyweathç~bçdrpcIg~$a~jdyto gravelytexture. ~pp~qfKa~qlm1bjtizetfeldspar,Fe-hydroxidesand -
biotite/leucoxene.Spotted,light yetlowbrown.
Weatheredbedrock : Moderately toslightly weatheredbedrock often
= citaig relict strpcftresuchas- fàliafi~.Typically albitized1biotite
hornblend gneisses,stainedwith- Fe-hydroxides.
Slightly to unaltered bedrock: Biotitehomblendegneisses.
___ Higjily weatheredbedrock
Mo4ératelyweQthereclbedrock -
Slightly weathered-Tounalteredbedrock
o ~00
~a
a~a0~
2
3
S
6
I ‘i•’*~ ~
Et5:Ui0
Redearth
Figure 7: Generalizeddugwell proffle
28 A IK.Adikari
Table2: Resultsof leachingof soilsamples.
Sample Depth (m) Overburden
1 hr(mg/lOOg)
48hr(mg/lOOg)
p11(48hrs)
51-1 0.5 RedEarth 2.5 4.0 6.00
S1-2 1.5 RedEarth 1.8 3.4 5.80
51-3 2.4 S1-3 2.1 3.0 5.80
S1-4 3.5 - WeathBr. 2.1 2.9 5.75
S2-1 0.3 RedEarth 1.3 1.9 5.30
S2-2 1.3 WeathBr. 1.3 3.0 5.20
S2-3 2.3 WeathBr. 1.2 2.3 5.10
S2-4 3.3 WeathBr. 1.1 2.1 6.55
S2-5 4.3 S1.We.Br. 1.7 4.1 6.85
S3-1 0.1 Topsoil 1.0 2.6 6.50
S3-2 1.0 RedEarth 2.0 5.6 6.15
S3-3 2.0 RedEarth 2.8 5.4 6.00
S3-4 5.0 WeathBr. 2.0 3.0 7.35
S3-5 5.5 WeathBr. 1.0 2.1 7.40
S3-6 = 6.5 Weathflr. 1.5 2.8 7.15
S3-7 7.5 Weathflr. <1.0 2.5 7.25
53-8 8.5 S1.We.Br. <1.0 2.4 7.25
CONCLUSION
The obtained results from the fluoride studiesindicate that the concentration offluoride in groundwaterdisplaysa dynamicbehaviorassociatedwith the variationsin spaceandtimeofthe geochemicalandhydrochemicalenvironment.Thiswasillustratedby boththeleachingexperimentswhich showeddifferentsoil typesdesorption abilities.

Fluortde in Water 29
Thefield studyshowedthatconsiderablevariationsin fluorideconcentrationsmaybeexperiencedwithin a small area.This opensthe possibility of locatingwatersourceswithacceptablefluoride contentsevenwithin high fluoride areas.However, further studiesarenecessaryto find whether such water sourcesmaintain a low fluoride concentrationthroughoutor whetherit changeasignificantlywith time.
The field study also demonstrated, that one possibility of locating wells with lowfluoridecontentisto takeadvantageofseepagefromsurfacewaterbodies.
References:
1. Raghva Ran K.V., BogodaKit, NilaweeraN.S., de Silva P.H.D.S.(1987).Mappinghighfluoride contentin groundwater,Sri Lanka,NationalWaterSupply and DrainageBoard-World Health Organization.
2. Proceedingsofthesymposiumon fluomsis (1974).Indianacademyof geoscience-Hyderabad-India. - - - - -
3. Fluoride Toxicity (1983).Proceedingsof the 13th conferenceofthe internationalsocietyfor fluorideresearch(ISFR)-NewDelhi.
4. Jayawardena,D.E. de S (1976)TheEppawalacarbonatitecomplexin North WestSriLanka.GeologicalSurveyDepartmentEconomicBulletin,No.3.


FLJUOROSIS AFFECTEDPATIENTS £~SRILANKA
U. Wirasinghe - - -
Radiologist,GeneralHospital, Kandy.
Fluorosis can manifest as dental fluorosis and skeletal fluomsis. Lowconcentrationssuch as two partsper million of~fluoride in water can causedentalmottling and is easilyrecognisecLIngestionof waterand foodsgrown in areasof highfluoride contentof eight parts per million or more, for a long period (over twentyyears)causebonefluorosis, with characteristicradiologicalfeaturesof increasedbonedensity (osteo-sclemsis), ligamentous, calcification or ossification, markedosteophytosisareseenmostly in the vertebralcolumn and pelvis. Long bonesare lessaffectedwith corticalthickeningandcalcificationof inter-osseanmembranes.Diffusedosteoscerosisis not dueto densityof fluoride depositedbut due to reactiveincreasedbonedepositionanddecreasedboneresorption.
Many patientsin endemicareascan be asymptornaticalthough theyhavebonechanges of fluorosis. Therefore,fluorosismaynot be clinically obvioustill advancestageof crippling fluorosis. Radiologyprovidesthe only meansof diagnosisof earlyandrelatively asymptonalicstageof the disease. On setof symptàms and degreeofdisability due to skeletalchangesare relatedto the concentrationof fluoride in water,length ofexposure,poornutritionand hardmanuallabour.
Somedetailsof sevenpatients diagnosedby radiological featuresare given intable 1. -
Although no statisticsare available for the incidents of skeletalfluorosis in SriLanka, fluorosis couldbecomea healthhazardto thepopulationliving in the endemicareastbralongperiod. - -
Only treatmentwhich will be helpfbl for thesepatients will be reductionoffluoride intake for a long duration,either by changeof residenceor by supplytg themwith low-costdefluoridationmethods. Preventionof diseaseoccurring in the youngerpopulationliving in theseareasare speciallyimportant. Since changeof residencewillbedifficult whendealingwith largepopulations,only solution left with will be useofdefluoridators.
it is knownthatpeopleliving in areasof watercontaining lessthanfour —per million, none developed bonefluorosis. Areas lessthan one part per million offluoride content will prevent dentalcariesand thereis lessincidence of agerelatedosteoporosisin peopleliving inareasofhighfluoridecontent.

32 U Wiraslnghe
Table 1: Details of palients.
Case Age(yrs)
Sex No. of yearslived inthe area
Presentsymptoms
1 62 M 57 yrs - Jayanthipura back-acheandstifflies~(10-12yrs) to recenton setofchestpain -
2 65 M 40 yrs - Medirigiriya back-ache,lossof appetite-
andweight -
3 44 M 22 yrs - Kekirawa neck painandnumbnessbelowneck andweaknessof all four limbs, inabilityto walk (CervicalMyelopathy)
4 42 F 22 yrs - Kekirawa neck pain
5 70 M 50 yrs - Mihintale-50 severebonepain,stiffnessand restrictedmovement
6 66~. M Girandurukotte back-ache
7 57 M >2Oyrs-
Kithulhitiyawaback-ache
8 43 F K~kirawa back-acheandinability towalk (Dersel Mye[opathy)

TREATMENT OFFLUOROSE])TEETH -
B. L. Wijeyewecrahead,Division ofFaedodontics, FatuityofDentalSciencesUniversityofPeradeniya.
Abslnett Dentalfluorosishasheatreportedfitim variouspartsofthe world. In SriLanka,it hasbeatrepostedmainly in the North CentralProvin Oncadental fluorosisoccwsit is seatas an ~ma~hdlcstainwhichsometimesintensifiedto abrownorblackishstain,speciallyregulatedto the painanentanteriorhicislors. Thiscausesagreatproblatito theclinicianwho isheedwith thedilemmawhattreatingthesepatients.
Severaltreatmentmodalitiessuchasjacketcrowns,vareres,chemical andligil awe compositesandvital bleachingmethodshavebeentied. Out ofthesemethods,jacketcrownsandv~sarenotvaypracticalin Sri Lanka, dueto the lack of labomtuzy theilhties and t*her expensiveeqthpmcnt. Alithugh 11* awecompositesrestorationsareconsideredasmoreccsivenlentmethods,thecostlnvloved hr thisis sohigh,therebymaking It Impossiblefor thepoorpatientto obtainthiskiniofexpensivefreatanent.
In thispaper,aresearchstudycarriedoil onvital bleachingIn treatingthesepatientaredescribed,Inthis study, ten different bleachingmethodswet tried in orderto identil~’a sln!ple andinexpensivetreatmenttechniquewhich ismiltahle forSriLanka,whereitcouldbenefitsevemlof thousands of poor affected peaple.
INTRODUCTION
Dentalfluorosishasbeenrepoitedfrom variouspaitsof the world. rn Sri Lanka it hasbeenrepoitedmainlyin theNorth Central Province , wheretheprevalencerateis55 to 77 percentin the 7 to 20 yearold school children.”~In additionGalewela,Kekirawa, WariyapolatandEmbilipitiya4hadbeenidentifiedasendemicareasof dental fluorosis.Furthermoreall theseabove mentionedareashave been shownto contain high levels of fluorides in drinkingwater.5’6Dental fluorosis is seenas anunaestheticstainwhich sometimesis intensified to abrownor ablackishstain,speciallyrelegatedto thepermanentanteriorincisors.Thiscausesagreatproblemto the clinicianwhois facedwith adilemmawhentreatingthesepatients.
Severaltreatmentmodalitiessuchas Jacketcrowns,veneers,chemicalandlight curecompositesandvital bleachingmethodshavebeentried.Out ofthesemethodsJacketcrownsandveneersarenot very practicalin Sri Lanka,due to the lack of laboratory facilities andother expensiveequipment Although light cure compositerestorations areconsideredamoreconvenientmethod,the cost involved is prohibitive and beyondthe reach of the poorerpatient& - =~- -
In this paper,a reseamhstudycarriedouton vital bleachingin treatingthesepatientsis described.In this study,ten differentbleachingmethodsweretried in order to identify asimpleandinexpensivetreatmenttechniepiewhichis suitablefor Sri Lanka,whereit couldbenefitseveralof thousandsofpoor peopleafflicted by this malaise.

34 RI. WI]eyeweera
METHODOLOGY
This researchprojectwasformulatedon the following four basicfactor!.1. Evaluatingthe effect of aweakacidwiuich is freelyavailableinourcountiy.2. Evaluatingthe effectof arelatively strongeracidwhich is freelyavailable.3. Effectivenessof a bleachingagent.4. Usageof non-toxiccocccntntionsof reagentstomakeit easytouse.
The tendifferentbleachingmethodsexperimentedaregivenbelow.
Metbodi:a) Application of30% orthpohosphoricacidon the labial surfaée ofthe experimentaltooth.
Leave fortwo minutes.b) Washoff with water for 30 ~tectindsunit polish with pumice, madeinto a slimy with
water,usingrubbercup andaslowhandpieceat 1000-2000imp.c) Application of non-acidulatediluoridegel on the labial surfaceof the tooth for three
minutes.
Method2:a) Application of 30% orthophosphoricacidonthe labial surfaceof the experimentaltooth.
Laaveforfourminines~ - -
b) Washoffwith waterfor 30secondsandrepeatsteps(b)anil(c)giveninMethod1.
Mcthod3: -
a) Application of 30% orthophosphdricacidonthe labial surfaceof theexperimentaltooth.Leavefortwo minutes.
b) Washfor3Oseconclswithwater. -
c) Applicationof 10%hydrogenperoxidesolutionon the labial surfacevf -
experimentaltooth. Leavefor five minutes.d) Repeatthe steps (b) and (c) giveninMethod 1.
Method4: -
a) Application of 30% orthophosphoricacidonthe labialsur~eofthe experimentaltooth.Leavçforfourminutes. - -
b) Repeatthesteps(b),(c)&(d)giveninMethod3.
Metbod5: - - - --
a) A 9% solutionofhydmchloricacid,madein to aslimywithpumicejubbedon the liablesurfaceofthe experimentaltooth. A seratedmetal instninient with alittle cottonwrappedattheendwasused,torubthe slurry on-to thetooth surface.
b) continuerubbingfor44) seconds.c) Washfor30 secondswith water.

TratmentofFluorosedTeeth 35
d) Steps(a),(b) and(c) repeatedfor amaximum number of five timesuntil animprovementisseen. - - - -
e) Polishwith pumice,madeinto aslurrywithwater,usingrubbercupandaslowhandpieceat 1000-2000q,ni aspreviouslydoriè in Method I. -
1) Apilicationof non-acidulatedfluoridegel on the labial surfaceofthetoojh for threeminutes. -
Method6: - -
a) A 18% solutionof hydrochloricacid, madeinto aslunywith pumice,rubbedon the labialsurfaceof the expethnentaltooth,usingthe samedeviceasstatedin Method5, Step(a).
b) Continuerubbingfor4Oseconds. -- - - - - - - -
c) Repeatthesteps(c),(d),(e)and(f)giveninMethod5.-
Method7:a) A 36% solutionof hydrochloricacid, madeinto aslurrywith pumice,rubbedonthe labial
surfaceofthe experimentaltooth,usingthesamedeviceasstatedin Method5, step(a).b) ComthnuetUbbing for4O seconds.c) Repeatthesteps(c),(d),(e)and(~giveñinMethod5. - -- -
Method8:a) Repeatsteps(a),(b), (c) and(d) statedin MethodS.b) Application of 10% hydrogen peroxide solution on to the labial surface of the
experimentaltooth- leavefor five minutes. -
c) Washoffwith waterfor 30 secondsandpolishwithpumicemadeinto aslurrywith waterusingrubbercup and aslowhandpieceat 1000-2000rpm, aspreviouslydonein Method1, Step(b).
d) Application of non-acidulatedfluoride gel on the labial surfaceof the tooth for threeminutes. -- -- - -
Method9: -- - - - - - --
a) Repeatsstepa(a)and(b) statedin Method6.b) Repeatthitfor amaximumnumberof five timesuntil animprovementis seen,while
washingfor 30secondswithwateraftereachrubbingoftheacid.c) Applicationof 10%hydrogenperoxidesolutionon the labial surfaceof the experimental
tooth- leavefor five minutes. -
d) Repeatsteps(c)and(d)inMethod8. -
Method10:a) Repeatsteps(a) and(b) statedin Method7.b) Repeatthis for amaximumof five times,until animprovementis seen,while washing
for30 secondswith water, aftereach‘rubbing’ of the acid.c) Application of 10% hydrogenperoxide solutiononthe labial surfaceofthe experimental
tooth- leavefor five minutes.d) Repeatsteps(c) and(d) stated in Method8.
36 JtL. Wj/eyeweera
RESULTS
Outof theten differentmethodstried, the methodthatinvolveda relatively strongeracid,which is hydrochloric acid with or without the bleachingagent(Hydiógein peroxide)gavesatisfactoryresults. When the severity of the discoloration was morn intensified, theconcanirationofthe relativelystrongeracidaisci hadto beincreased,in orderto obtaingoodresults. In summarythe usageof 18% - 36% hydrochloric acid madeinto a slurry withpumicegavegoodresultswith moderatelyseverecasesof fluorosis.
CONCLUSION~ - - -
Thisstudyshowsthatunaestheticstainsonteethdueto dentalfluorosiscanberemovedwithan application of 18% - 36% hydrochloric acid followed by 10% hydrogenperoxide,speciallywhenthe stainsare at moderatelevel.
The methoddescribedhereis amuchsimplerand a less expensiveonethatcouldbecarriedout in any partof Sri Lankaby any dentalsurgeon.This could bring immensereliefto severalthousandsof affectedpeople,speciallythe poorincomegroupswhocannotafibitisophisticatedexpensivetreatment. -- -
References
1. SeneviralneB., SeneviralneK., HettiarachchiJ.,andThambipillai 5. (1973):Bulletin ofthe WorldHealth Organization49: 419422.
2. SeneviralneB. (1974)TransRoySocTrop.Med.68: 105-113.
3. WamakulasUriyaK.A.A.S.(1990),CeylonMed J.35: 125-128.
4. AbayaralneS.(1989/90).SriLanlwDent.J.18/19:lO-16. - -
5. Dissanayake,CB. andSenaratheA. (1982).Water,AfrandSoil Pollution 17:17-28.
6: RaghavaRaoK.V.etal. (1987).Mappirighighfluoride contentingroundwater,SriLanka(NationalWaterSupply& DrainageBoaM) WHO Cominunicátibn.

DEFLTJOR1TDATION METHOD USING BO1~ECHARAS FILTER MEDIA
B.M.G.H. MaraslngheRegionalDentalSufrgeon,Kuninegala.
AIntract Thefilter usedfor defluoridationby Bonethar,GravltyFloor TechniqueIs simplein designandIsfa&ktl In Sri LankausingPVCpipe. Thefilter niediaprovidedwasIn thefonuofpolythenebagcontainingpebbles,batcharandcharcoal. l’hereare55 defluoridatorsdistributedanonghouseholdersthosewho havechildrenunder lOyanra of age. The born char very effectively reduces the fluoride rich water to acceptableleveloffluorideltrdrlnking water. Moreinquiresaremadefor thesedeilucridatcrsshowingthe succe~of&pilot jnuj~t It hasbeenfoundthatwith aflow rateof4 litrenan hour, this deThioridator reduced the fluoridecontentof480 luresofwater from 5mg/litre to lessthan1 mg/I. - -
INTRODUCTION
The excessiveflouride level in drinking water has undesirableeflèct on both teeth andbones! In temperatecountrieslike USA the ‘optimum’ beneficialfluoride level is 1.0 mg/I,but in areaswith hot climatesit is lessthan0.7mg/i. Severalmethodshavebeendeveloped.fromtimeto timefor activedefluoridationof drinking water. Thesemaybe dividedinto twobasic types - those basedupon an ion exchangeor adsorption,andthosebasedupon theadditionofchemicalstowaterduringtrealinent. The methodsreportedto havebeen.usedinadsorption or ion exchangeprocess include lime softening, alum, alum and alumina(Nalgondatechnique),activatedalumina, activatedcarbons,natural bone,bonechar, bonecharandcharcoal(ICOR Dàfluorldator),naturalor syntheticIricalcium phosphate, Bauxitehydroxyapatite,commerciallyproducedion-exhangeresins,electrodialysis,reverseosmosisandvariousothertreatmentagents. Othermethodsincludetine additionto fluoridewaterofmaterials like magnesia,calcium phosphate, bentonite, fullefs earth, bentonite anddiatomaceousearth. All thesemethodssufferfrom oneor more of the shortcomingsofhighinitial cost;high operationandmaintenancecosts~low fluorideremovalcapacities,lack of -
selectivity for fluorides, undesirableeffects on water, generationof sludge, complicatedproceduresandcomplicatedor expensiveregeneration.
The use of bone char or unheatedbone particles (bone meal) to remove excessfluoride is an old yet enduring technique. It was suggestedseveral decadesago byinvestigatorsin Arizona who establishedthelink betweenmottleddentalenamelandwaterfluoride levels and is still promotedtoday for use in home based systems.It has been
established that defluoridationis more efficient when bone is heatedlessseverely.Whenboneis heatedfor a shorttime at alow temperaturethe result is black or greymaterialcontainingconsiderablecarbonizedorganicmatterthat itselfmaybeactivein deflueridation
process.
Magnesiumoxideand bonemealwere usedin Kenya,as chemical defluoridatingagents. Theresultsshowedthat fluoride removalby 100mgbonemealis considerablemore

38 B.MG.H.Marasinghe
e~tivecomparedto the actionof 100 mg magnesiumoxide. The eflictivenessof bonemeal andmagnesiumoxide is directly related to the concentration of the absorbing agentsand the greatestabsorptiontakesplaceswithin 60 minutes. The water treated with bonemealwaspalatableand had a p11 017.5. The quality ofthis water would mostlikely findquicker acceptanceasdrinking water.
Another studywas conductedto improve the efficiencyof the bonecharmethodbypm-treatingthe water with brushiteand calciunihydroxide. The aim of this study was toexaminedefluoridationusingbrushiteasa sourceof ionic calcium and phosphate, calciumhydroxide as a sourceof calciumand as apHregulator, and bone char as a nucleatingmaterial. The addition of the two saltsto the watermayprolong the life of the bone charindefinitely, ensurethe removaloffluodde,and thusavoid theproblemof determiningwhenthebonecharisexhaustecL- --
The main objective of this researchproject is to reducethe incidence of DeiitalFluomsisin youngerchildrenat PathirennegamaVillage in Polpithigama, by providing withthedefluoridation filters.
METHODS AMY MATERIALS -
A baselinesurveywasconductedto detemninecariesprevalenceas well as to estimatetheprevalenceof Enamelopacities. In addition,a socio-demographicsurveywasconducted. Inthis study,water sampleswerecollectpdin plastic bottlesfrom wells in the Pathirennegamavillage in thePolpithigamaAGA division. The wells consideredfor this studywereshallow,deepandborehole wells. The sampleswereanalysedfor the fluorIde contentusingtheOrion FluorideAnalyser. The sameprocedurewasfollowed with respectto the well waterand defluoridatedwater samplesfrom 60 InS ñiffCentfeTOfOläl Health (ICON)defluoridatorsdisiributedin Pathirennegama,in the Kurunegaladistrict. The filter mediawasgiven to eachhouseholdat thetimeofhandingover ofthe ICOH diffizoridator. -
The - household ICOH defluoridator.2 The ICON defluoridator for individualhouseholdsdevelopedat the Inter-countryCentrefbr Oral Health,ChiangMai, in NorthernThailand wasfabricatedandusedinthisstudy(Figure1). = - - -
Thecontaineris made of apieceof polyvinyl chloridepipe (75 eth iii lengthand5.cm in diameter)with an outlet tap at the bottomand acap with a smallhole for input ofwaterat thetop. This [COffdefluoridatoris ~nssembledfrommaterials generally availablefor plumbingpurposesandso simple in its designthat thevifiagers themselvescanproduceit. -

DefluoridaflonzthingBonechar 39
Figure!: ICOU Defluoridator.
40 Bit aHMaraaighe
Thefilter contains300 g of crushedcharcoalat the bottom for absorptionofcolourandodour, 1000gof charred bone mealand200g of cleanpebble astop layer to preventtheintermediatelayerfrom floating. The ingredientsareplacedin a ploythenebagand insertedinto the PVC pipe. The waterfrom the well kept in a clay pot is siphonedto the top of thedefluoridatorby meansof asmallplastictube(salinetube)at a flow rateof4 litres perhour.Thedefluoridatedwateriscollectedintoaclay pot directly under the tap.
The filter hasbeenshownto reducethe fluoride content in 480 litres of water flxin 5mg/lFormoretolessthan1 mgt’lFataflowrateof4litresperhourbeforeregeneratidflordischargeofthe filter mediumis needed.Defluoridationmaterialshaveto berenewedafter3-4monthsofuse. - -
RESULTS AN]) DISCUSSION -
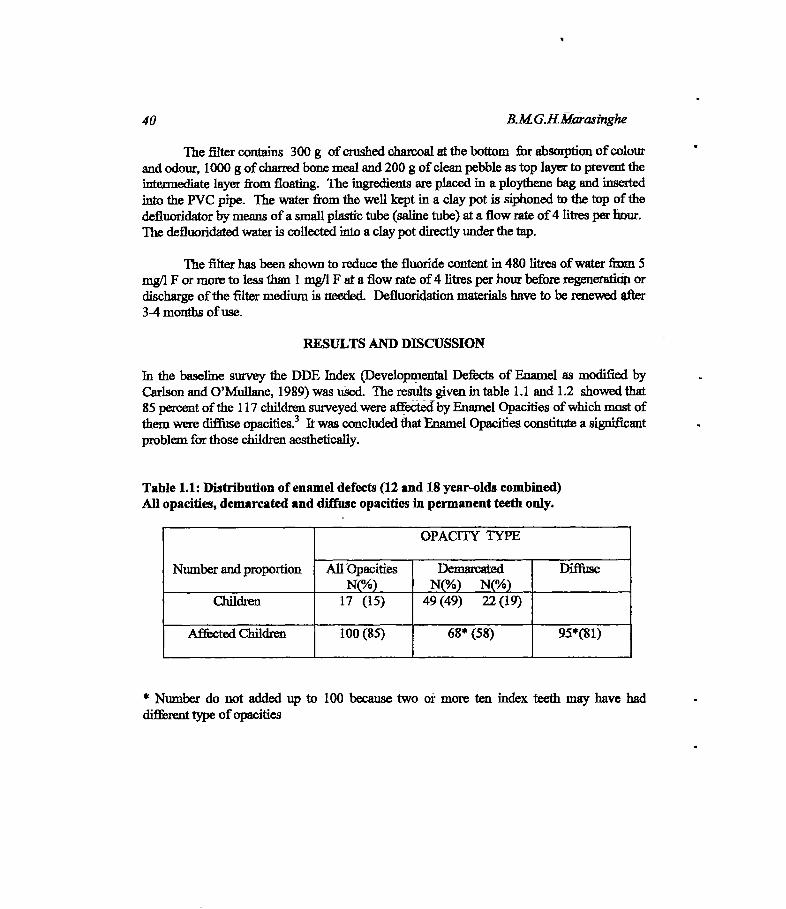
In the baseline surveythe DDE Index (DevelopmentalDefectsof Enamel as modifiedbyCarlson and O’Mullane, 1989)was tthed. The resultsgiven in table 1.1 and 1.2 showedthat85 percentofthe 117children surveyedwereaffectecibyEnamelOpacities of which mostofthemwerediffuse opacities.3 It wasconcludedthatFsamelOpacities constituteasignificantproblemfor thosechildrenaesthetically.
Table 1.1: Distribution of enameldefects(12and 18 year-oldscombined)All opacities,demarcatedanddiffuseopacitiesIn permanentteethonly.
Numberandproportion
OPAC11Y TYPE
All OpacitiesN(%)
DemarcatedN(%) N(%)
Diffuse
children 17 (15) 49(49) 22(19)
A~ctedChildren 10(1(85) 6lJ~(58) 95*(81)
* Number do not addedup to 100 becausetwo or more ten index teethmay have had
differenttypeof opacities

)iefiuoridationusttgBonechar 41
Table1.2: Distributionof enameldefects(12and18 yearoldscombined).
All opacitiesn-f
Demarcated- -
n-fDiffusen-f
0-17 0-49 0-22 -
1-0 1-5 1-42-5- 2-23 2--S3-1 3-10 - - 3-il4-2 4-15 4-145-10 5-8 5-136-20 6-4 6-197-5 7-0 7-108-21 8-1 &-149-9 9-1 9-110-27 10- 1 10-4
total=117 totalll7 total=1l7Note: n is thenumberofaffected teethperchild,outof theteripermanentteethexamined
andf is thefrequency-numberof children.
A socio - demographicsurveywas conductedin June, 1992, thud the infdhnationrelatedto the populationof thevillage,the numberofhouse- holds,typeof houses,childrenunder10 yearsof age; sourcesof watersupplyfor drinkingand for bathing,the qualityofdrinking water, thepatternof drinking ofteaandeatingfish andthe attitudestowardsusingbone-charfor removal of excessfluoride from waterweregatheredçFable2). flin results-
showthat59.3 percentof the64 families in the villagehadchildrenbelowSySársofage. 71percentof the housesbelongto the categoryofwattle and daub typrindicating the lowincomepatternof thevillagers. 83 percentof villagersusedwell waterasmainsource.
Table2: Socio-demographicsurvey.
01. Averagenumberof household member per houseRange02-12 Minimum=02 Maximum=12
02. Familieswith childrenunder five years — 59.3% -
Averagenumberof childrenunderfive years per family a 0.8
03. Typeof houseHouseswithwattleanddaubHouseswith brickwalls
=71.2%=28.8%
42 1&MGRMarasinghe
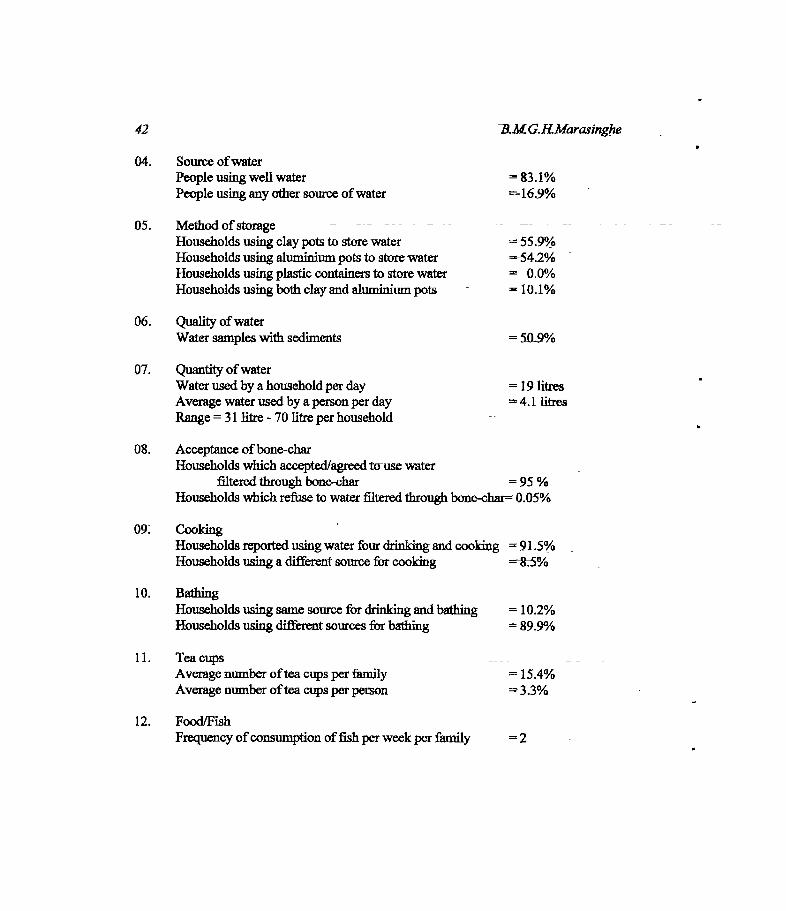
04. Source of waterPeopleusingwellwater =83.1%Peopleusinganyothersourceofwater =16.9%
05. Methodofstorage -- -- -
Householdsusingclaypotsto storewaterifouseholdsusingaluminiumpotstostorewater =.-54.2% -
Householdsusingplasticcontainersto storewater = 0.0%Householdsusingbothclayandaluminiumpots - a 10.1%
06. QualityofwaterWatersampleswith sediments = IOS%
07. Quantityof waterWaterusedbyahouseholdperday -i9litres -
Average waterusedby a person per day 4.1 litresRange= 31 litre -70litre perhousehold
08. Acceptanceófbone-charHouseholdswhichaccepted/agreedtcrusewater
filteredthroughbone-char = 95 %Householdswhichrefuseto waterfilteredthroughbone-char=0.05%
09~ CookingHouseholdsreportedusingwaterfour drinkingand cooking =‘91.5%Householdsusingadifferentsourcefor cooking
10. BathingHouseholdsusingsamesourcefor drinkingandbathing ~10.2%Householdsusingdifferentsourcesfor bathing 89.9%
11. TeacupsAveragenumberoftea cupsper family = 15.4%Averagenumber ofteacupsperperson 3.3%
12. Food/FishFrequencyofconsumption offish per weekper family =2=

Defluoridationitsing Bonechar 43
The table 3 shows the results of water samples analysedat 25 °Cprior toimplementationof the ICOH defluoridatorpn~rams.All the wells bad fluoride rich waterrangingfroml.4mg/ltoS.Omg(L - -
Table3: Fluoridecontentof wells: -
Well No. fluoride(asF),mg/I
01 5.002 1.803 3.6 -
04 4.205 4.106 2.007 1.908 1.509 1.410 1.6
AwarenessprogramWas carriedout at the village school,chairedby the ChiefPriest of theBuddhistTempleand defluoridatorswere distributed to the beneficiaries.Initially water sampleswere collectedfrom the inlet and the outlet of the filters onmonthlybasisandtheresultsaregivenintables4to8,where AandBrefertofluoridelevelsafterandbeforedefluoridation,respe~tlve1y.
In someinstancesthe fluoride removalwas not sufficient indicating the importanceof changingthe filter media from time to time. The field healthworkers assistedbyreminding the beneficiariesto change the filter media at appropriate intervals. Thedefluoridatorusagemaybeinterruptedby leakingthe tap, brokentap andcarelessnessofthebeneficiary. Thesedrawbackswereeliminatedto a certainextentby the help ofvolunteergroupleadersin thecommunityby attendingto repatnonihes$t The blockageoft inletsalinetubewasquitecommon. Thishasto bereplacedwith anewoneafter 3 monthsof usedueto the scalingofthetubewells. =

44 B.MGJ~LMarasinghe
Table4: Water samplesanalysedusingOrion Meter on 03.07.93.
DefluoridatorNo.~
ConcentrationofFluoride (m&’l) at 25°CB A
39 3.02 2.5441 3.17 2.5645 3.07 0.1243 3.09 1.1544 3.05 13546 3.15 0.6542 3.83 0.7510 3.78 0.33 -
11 7.30 6.78
Table 5: Water samplesanalysedusingOrion Meter on 19.10.93. -
DefluoridatorNo. ConcentrationofFluoride (mg/i) at25°CB A
190757505351
4.103.100.430.450.250.4~
2.81L92 -
0.040.190.130.32
DefluoridatorNo. ConcentrationofFluoride (mg/i) at25°CB A
54112426
0.200.203.203i10
0.10. 0.10
0.100.50
Table6: Water samplesanalysedusingOrion Meter on 11.07.94.

DefluoridationusingBonechar 45
Table7: Water samplesanalysedusingOrion Meter on 09.02.95.
DefluoridatorNo. ConcentralionofF!uoride(mg/i) at 25°CB A
57 0.44 0.0322 0.23 0.0305 0.14 0.0311 0.25 0.2449 0.47 0.1554 3.10 0.8620 2.10 0.3323 3.20 0.39 - -
10 2.30 0.7819 3.20 2.40
Table 8: Water samplesanalysedusingOrison Meter on 09.09.96.
DefluoridatorNo. Concentration ofFluoride (mg/I) at25°CB A
06 1.50 0.3814 3.50 - 3.50 -
22 2.50 1.6523 2.35 - 0.65 -
47 0.53 0.3550 0.49 0.35 -
52 4.10 0.6953 0.53 0.4254 0.39 0.2662 0.32 0.28
46 - B.MGiiMarasinghe
CONCLUSTONS
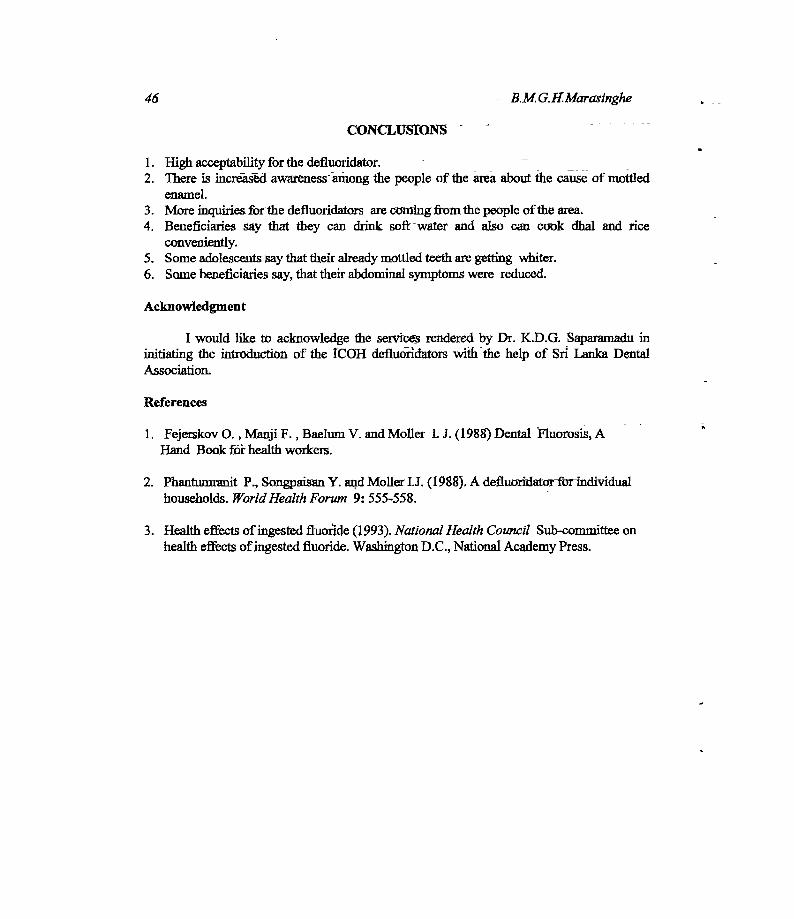
1. Highacceptabilitylbrthedefluoridator. - - - - - -
2. Thereii incrS.tl awareness~ithongthe peopleof the areaabout the causeof mottledenamel.
3. More inquiriestor the defluoridatorsarearmingfrom the peopleofthe area.4. Beneficiaries say that they can drink softwaterand. also can cook dhal and rice
conveniently.5. Someadolescentssaythattheiralreadymottledteetharegetting whiter.6. Somebeneficiariessay,thattheir abdominalsymptomswere reduced.
Acknowledgment
I would like to acknowledge the servicesrendered by Dr. KJ2G. Saparamaduininitiating the introduction of the ICOH defluoridators ~ththehe1p of Sri Lanka DentalAssociation.
References
1. Fejerskov 0. , Manji F. , Baelum V. andMolter L J. (1988)Dental TFluorosis,AHand BookfOi healthworkers.
2. PhantunnanitP., SongpaisanY. ax~dMoll~rLL (1988).A defluoridatortrindividualhouseholds.WorldHealth Forum 9: 555-558. -
3. Healtheffectsof ingestedfiuoiide (1993).National Health Council Sub-committeeonhealth effectsofingestedfluoride. WashingtonD.C., National AcademyPress.
LOW COST DEFLUORIDATLON USING BROKENPIECES OF BRICKS ASFILTERMEDIA
J.P.Padniathi,National Water Sup~rilyandDrainageBoard
Abstract: In recent studies, it was shown that more than fhiirty percent of walls hatfluthde rich waterIn the north central province. The fluoride content of more than 1 mg~lwas considered as fluoride richwiderin these wells. In addition, medical reports reveal that skeletal fluorosis patient has been identifiedin Sri Lanka.
In the present method discussed in this study, upward flow technique has been used to get moreretention time In the defluoridator. Inittdition, easily available, freshly burnt bricks broken into pieceshas been used as filter media in these defluridatort There are 300 detluoridators Inoperation in differentvillages such as Olukaranda, Mshaelagamuwa, Madatugama, Eppawals, Talawa, Thipotha andPatunagama inNorth Central Province. -
The results clearly shows that this low cost method could be easily canied out iaoit to getdefluoridated water. The beneficiaries themselves ware trained to change the filter media in time in orderto get bestout-put from these defluoridators. The efficiency level of these fluoridators changes from 85percent retnovalat the start and tapers down to 25 percentremovul afihé end of the cycle.
iNTRODUCTION
Knowledge of fluoride concentration iirdrinking water has become essential because ofits ugly stained teeth appearing on children especially of the age group 10-20 years.Fluoride concentration of 0.1 to 0.8 mg/i prevents dentalcaries, where as higher than 1mg/I leads to malgrowth and certain - health problems known a dental and skeletalfluorosis. The earlier work carried out by the researchers in this field has drawn afluoride map of Sri Lanka which had been used as -guidance in selecting fluorosisareas.t
MATERIALS AND METHODS
In the present ètudy water samples were collected in plastic- bottles from studentpopulation in rural schools of Anuradapura and Polonnaniwa districts while carryiiigout awareness - programmes with respect to fluorides. The wells considered for thisstudy were shallow, deep and bore hole wells. These samples were then brought to thelaboratory and were analysed for fluoride levels using culoriinetric method (Spandsreagent) using DR/2000RACH spectrophotometer.
Occasionally these samples were cross checked with fluoride ion analyseravailable at the Biochemistry laboratory of the MedicaL Faculty of the University ofPeradeniya. The same procedure was -followed with respect ta the well water anddefluoridated -water samples from 300 defluoridators distributed in north centralprovinceduring l994to 1996.
RESULTS AND DISCUSSIONS
The table 1 shows the fluoride contents of the wells from North Central Province. Thelimit of fluoride content of water of 1 mg/I is considered as safe for human beings.

48 J.F.Padmasiri
The data shows that in these areas more than 40 percent of these wells bus fluoride richwater. In some areas such as Patunagama, Olukaianda more than 65 percent of wellswith fluoride rich water.
Table 1: fluoride content of wells in. mg/I
Date Name of school Totalnumberofwells
Percentage
>2.0~2.0- 1.0 <1.094-04-27 A/Olukandara
Vidyalaya24 33.3 45.8 20.9
95-06-28 A/MahaElagamuwaVidyalaya
55 12.7 18.1 69.2
95-07-26 - A/MunmgabitikandeVidyalaya
38 15.8 28.9 55.3
95-07-28 A/KeleAmumikolaVidyalaya
33 6.1 21.2 72.7
94-10-28 P/LankapuraVidyalaya
40 37.5 20.0 42.5
95-05-05 - P/ GalamunaVidyalaya
21 23.8 28.8 47.4
95-05-OC P/PatunagamaVidyalaya
60 43.3 25.0 31.7
95-09-07 P/HingurakdamanaVidyalaya
133 11.3 42.1 46.6 -
96-03-27 p/ CiirithalegamaVidyalaya
16 6.2 37.5 56.3
96-05-17 P/ChandanapokunaVidyalaya -
68 23.2 18.8 58.0
The fabricated~ defluoridator is shown in figure 1. Subsequently, thedefluoridators ~ were distributed among villagers by the- staff of National WaterSupply and Drainage Board. In selecting beneficiary families, special emphasis wasplaced on selecting children of age group of less than five years in a fhmily. Once thevillage was selected the defluoridators were distributed irrespective of their familyincome and level of education, but the assistance was sought from the field healthofficer of the village concerned. This criteria was helpful because of long duration ofmonitoring required nearly five years to see the results of this programme. It is to beunderstood here that all of the 300 house holders selected for this study, that only 30wereusingboreholehandpumpwell& - -- -
The case study, defiuoridator No. 20 at Thibbatuwawa is shown in figure 2.These trials were mn at the beneficiaries household using laterite and broken pieces of

49Deftuoridation usingBricks
% 20 mm PVCINLET PIPE
A
05 10152O25303S.~o4s~OS56o657O7Sa05595 -- -~
NO0f days — -
INLET FUNNEL
BROKEN SRICKPiECES --
0 20 mm pvcOUT LET PIPE
PERFORATED PLATE
Figurel: Low costdefluoridator.
Diameter a 225 mm Height
Averags Fluoride content of
diameter well
75 c m
the large
2.0 mg/i
1;aI
Average withdrasscl at d.ftuorldated
waler per day 12 LIters
aaC4,
U
4~
U-
— — - - 2
BROKEN - BRICKS- SO dayLATERITE ——.-—--- —-SO dpy
- MDKEN ~RICPc5-50 day
Flgure2: DCfiüorldator no. 20 at Thibbatuwawa.

50 - JP.Padmasiri
bricks as ifiter media? The average fluoride -content of the well was 2 mg/I. The lifespan of the filtermedium laterite was longerthan that of broken pieces of bricks.
Figure 3 shows the case study defluoridator No. 42 at Thibbatuwawa. Theaverage fluoride content ofthe well was 5 mg/I. In this instance, larger diameter PVCpipes of 280 mm was used as defiuoridator. Average daily withdrawal of thedefluoridated water was 8.0 lilies because of high fluoride content of the well and thefamily consisted of parents and one child. In this instance, fleshly burnt broken piecesof brick has been used with a special emphasis on sizesofthe broken pieces of bricks.
Table 2 shows the case study of defluoridator No.46 at Mahaelagamuwa. Thespecial significance of this household was that the bread winner, farmer was siiftbringfrom skeletal fluorosis, bed ridden, 46 years Of age according to the medical reportsavailable with him. The fluoride content of the well was 7.0 mg/I and had been usingforlast20years. -
The householder was persuaded to change the- source -of water and able to findan alternative source close to his house, a well containing an average fluoride content of1.36 mg/i. The data show that he had been using the defluoridator No.46 in excellentmanner by changing the bricks at the appropriate time intervals.
Table 2 : Performances of the defiuridator 46.
Dates ofoperation
Number ofdays in
operation
Fluoride content offiltered water
start end
94-11-2695-04-05
135 - 0.24 0.86 -
95-04-1595-05-30
50 0.32 039
- 95-06-0 195-11-15
178 0.74 0.70
95-11-3095-07-22
23ff 0.18 0.6{ -
Note: The defiuoridator has been usedvery well and the filter media changed in time.
The table 3 shows several defluoridators run by beneficiaries at Olukaranda. Inthe column 4 of this table gives the fluoride content of the defluoridated water at thetime of changing filter media. The case of defluoridatorsNo.41 and 14 it was observedthat fluoride contents at the time of changing were high. The defluoridator No. 41 wellhas a minimum fluoride content of 3.02 mg/I and a maximum of 3.68 mg/i with an
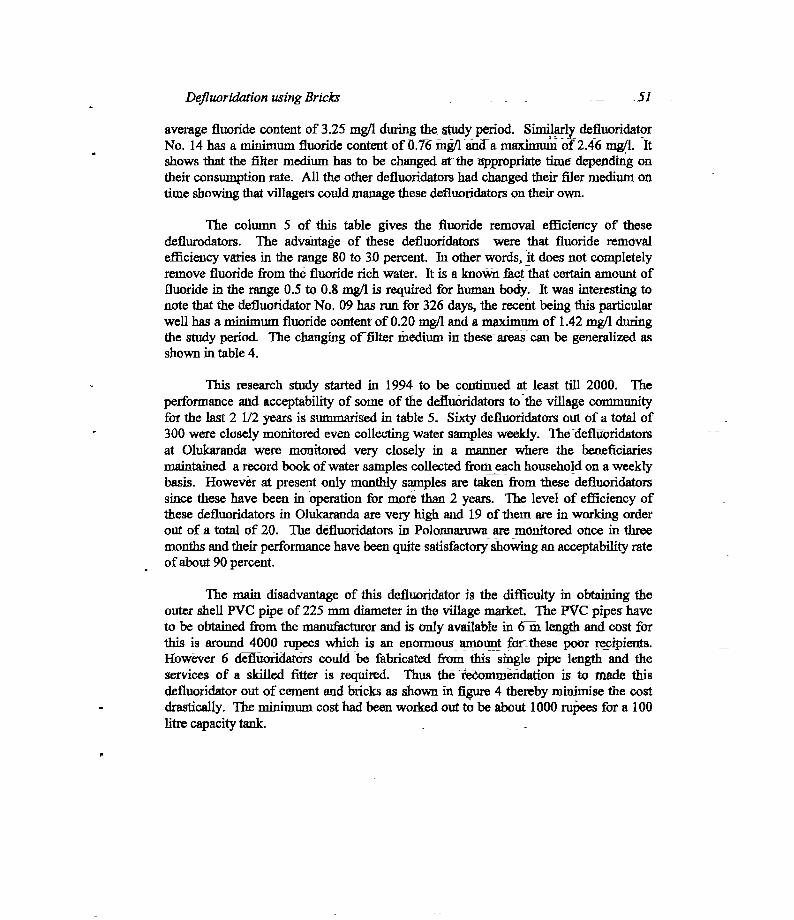
Defluoridation uring Bricks -51
average fluoride content of 3.25 mg/i during the study period. Similarly defluoridatorNo. 14 has a minimum fluoride content of 0.76 hug/I incla maximum of 2.46 mg/i. Itshows that the filter medium has to be changed at-the appropriate time depending ontheir consumption rate. All the other defluoridators had changed their filer medium ontime showing that villagers could manage these defluoridators on theft own.
The column S of this table gives the fluoride removal efficiency of thesedeflurodators. The advantage of these defluoridators were that fluoride removalefficiency varies in the range 80 to 31) percent. In other words, it does not completelyremove fluoride from the fluoride rich water. it is a known fact that certain amount offluoride in the range 0.5 t~0.8 mg/I is required for human body. It was interesting tonote that the defluoridator No. 09 has run for 326 days, the recent being this particularwell has a minimum fluoride content of 0.20 mg/i and a maximum of 1.42 mg/i duringthe study period. -The changing offilter ihedium in these- areas can be generalized asshown in table 4.
This research study started in 1994 to be continued at least till 2000. Theperformance and acceptability of some of The defiubridators to the vifiage communityfor the lastl 1/2 years is summarised in table 5. Sixty defluoridators out of a total of300 were closely monitored even collecting water samples weekly. The deflUbridatorsat Olukaranda were monitored very closely in a manner where the beneficiariesmaintained a record bookof water samples collected from each household on a weeklybasis. However at present only monthly samples are taken from these defluoridatorssince these have been in operation for more than 2 years. The level of efficiency ofthese defluoridators in Olukaranda are very high and 19 of them are in working orderout of a total of 20. The défluoridators in Polonnantwa are monitored once in threemonths and theft performance have been quite satisfactory showing an acceptability rateof about 90 percent.
The main disadvantage of this defluoridator is the difficulty in obtaining theouter shell PVC pipe of 225 mm diameter in the village market. The PVC pipes haveto be obtained from the manufacturer and is only available in 6Tn haugth and cost forthis is around 4000 rupees which is an enormous amount forithese poor recipients. -- -
HowOvir 6 deflhoridatóri could be fabricated from this single pipe length and theservices of a skilled fitter is required. Thus the ~otSddafion is - to made thisdefluoridator out of cement and bricks as shown in figure 4 thereby minimise the costdrastically. The minimum cost had been worked out ta be about 1000 iuj,ees for a 100litre capacity tank. -
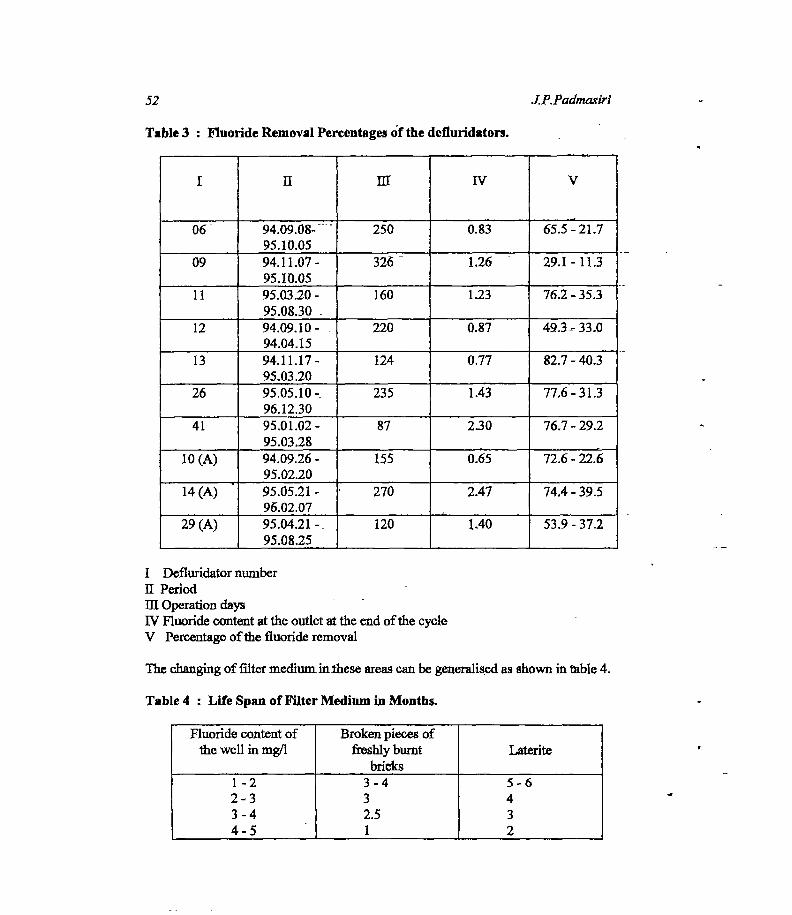
52 .JP.Pad.’naslrl
I ll~ - III IV V
06 94.09.08-~95.10.05
250 0.83 65.5:21.7
09 94.11.07-95.10.05
326 - 1.26 - 29.1-11.3
11 95.03.20-95.08.30 -
160 1.23 76.2-35.3
12 94.09.10 - -
94.04.15220 0.87 49.3- 33.0
13 94.11.17-95.03.20
124 0.77 82.7-40.3
26 95.05.10-96.12.30
235 - 1.43 77.6-31.3
41 95.01.02-95.03.28
87 230 76.7-29.2
10 (A) 94.09.26 -
95.02.20 -
155 0.65~- 72.6 - 22.6
14 (A) 95.05.21 -
96.02.07270 2.47
.
74.4 - 39.5
29(A) 95.04.21-95.08.25
120 1.40 53.9-37.2
I DefluridatornumberilPeriod -
lltOperationdays - -
1V Fluoride content at the outlet at the end of the cycleV Percentage of the fluoride removal
The changing of filter mediuniinthese areas can be generalised as shown in table 4.
Table 4 : Life Spanof FilterMediumin Months.
Fluoride content ofthe well in mg/I
Broken pieces offreshly burnt
bricksLaterite
1-22-33-44-5
3-432.51
5-6432
Table 3 : Fluoride RemovalPercentagesof the defluridators.

Defluoridarion uring Brick$ 53
Table 5 : Comparison of Performanceof theDeftuoridators.
Village I II ifi N Remarks,Monitoringaspec~
Al Olukaranda
P/ Talpotha
P/ Patunagama
20
10
31
19
04
22
01
04
07
00
02
02
Beneficiarieswereaskedto collectwatersan~pleseveryweekat thebeginningVisitedoncein 03monthsVisited oncein 03months
I Numberof defluoridatorsH Changedfilter mediaon timeandusagegood - -
ifi Changed filter mediaat irregular interv~lsandunsaxisfactoiyN Abandoned
CONCLUSIONS
1. The cement-bricktanksaremore appropriatefordefluoridatorsat villagelevelsthanPVCpipes. -
2. Thevillagecommunityis able top~~andchangethefilter mediumsincethebricksarefreelyavailableinvillage,thus achievingvillage level operationandmaintenance(VLOM status).
3. Thisdefluoridatorhasthe capacityto reducefluoride rich water of5 mg/I to Img/i. thus confomiingto WHOISL standanisof drinkingwaterfor fluorides.
4. Awareness programmesand follow-up services arerequiredto achievesustainability.
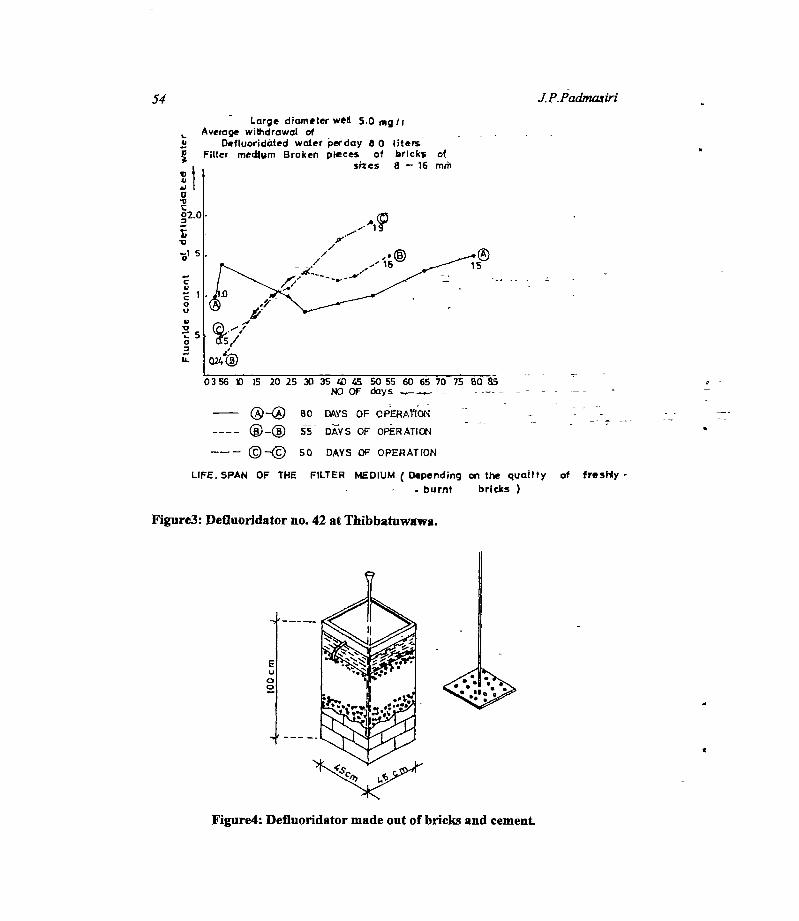
S
C4,
0U
41•0
0
Is.
0356 t 15 20 25 30 35 40 45 60 55 60 65 70 75 60’ 85~ -- -
NOOf days
— 80 DAYS OF OPERA ON -
55 DAYS OF O~RATI~1 - --
(©—© 50 DAYS OF OPERATION
UFE. SPAN OF THE FILTER MEDIUM (Depending on the qualItyburnt bricks
Figure3:Defluorldator no.42at Thibbatuwawa.
54 J.P.Padmasiii
- Large diameter weH 5.0 mg/iAverage withdrawal of - -
Defluoridátedwcder perday 8 0 lItersFIlter medium Broken pieces of bricks of
sites 8 — 16 mñi
4,
a~4,
t•0
0-S
Q24~
of freshly -
6U
a0
Figure4:Defluoridator madeout of bricks and cement.

Deftuoridation uring Bricks 55
Acknowledgment
The author is greatful to the NationalWaterSupply& DrainageBoard andits
employeeswhohelpedin manyways in this researchstudy.
References
1. DissanayakeC.B. (1991).The fluoride problem in the groundwaterofSri Lanka.InternationalJournalofEnvironmentalStudies38: 137-156.
2. PadmnasisriJ.P. & FonsekaW.S.C.A. (1994).Low costfluoride removalifiters.Proceedingsofthe20th Water EngineeringDevelopmentConference (WEDC) 295-300.
3. Padinasiri J.P.,FonsekaW.S.C.A. & WijeyeweeraRL (1994).Acceptanceoflow costfluorideremovalfilters at village level in Kekirawa.Sri LankaAssociationfortheAdvancementofScience-PartIll6.- --
4. PadmasiriJ.P. & DissanayakeC.B. (1995).A simple defluoridatorfor removingexcessfluoridesfrom fluoride-richdrinkingwater.International Journal ofEnvironmentalHealth 5: 153-160.
S


COMMUNiTY A~F1T1~EREGARDINGFLUOROSISAND LOW COSTDEFLUORIDATOES
N.LWlckramaainghe - - - -
NationalWaterSupply& DrainageBoard - - -
Abstract:High contentof fluoride in thinkingwatersourcesespeciallyhi the thy zone of Sri Lankahasbeenidentifiedas a cause fir dentalandskeletalfluorosis.Basedon the field experiaa~e,it has beaj revealed that asignificantpercentageof people live in liz dry zone have beensubjectedto suchhealthproblems,andthenumberofcases has considerablyinorcasedduringthepast.Unsightly,ugly stainedteethis asevemoitcome ofliz dental fluorosis and it couldbe Identified assnioutsocialproblemespeciallyfir the youngergenenitlonInfir dryzoneof SriLankaIn orderto arrestthissituation,a low-antckanesdcdefluoridatorhasbeen introducedenpilot scaleandthis studyhasbeenundertakento observethe viewa of the community aboutthe usageandaffituderegardingthesedefluoridatorn - - - -:
Theaiteria adoptedin collecting field datafir this studywas c.zaxluctlnginterviewswith housthoklIcatficlaries, commailty basedorganizatlons prhnaiy school teats and family health ivesicern for thequalitativeassessauntAlso the method adoptedwas by collectingdataftcan bczflciaries with -questionnairesusingrandomsamplingbasis for liz quiniltative assessment.
In conclusion, It can be stated thatmajorityofthepeople feel that ugly stainedteethis a acutesocialproblem.The usageof defluoridatot’shas been well adoptedby the ruralcommunitythan by the semi-urbancommunity. It is desirableto provide th scdefluoridatorsto low-incomethmilies , becausethey are alreadyburdenedwith other socio-econornicproblems.The changingof filter mediaby the beneficiaries hasbeenacceptedby thegreaterpartof thecommunity. -
HWTRODUCFION -
High contentof -fluoride in drinking waterhas beewidentified as a causefor dental andskeletalfluomsisespeciallyin the dry zoneof Sri Lanka. Field observationshaverevealedthat a significant percentageof people living in dry zone are subjected-th such healthproblemsandthe rateof increaseofvictimshasconsiderablyincreased.Unsightlyteethis thesevereoutcomeofthe dentalfluorosisandit could be identifiedasaserioussocialproblemespeciallyamongyoungergeneration. -- - -
A domesticdefluoridatorhasbeenintroducedby NationalWaterSupply& DrainageBoardas an apiyopiiatelow costsolution for the saidproblem. 400jif thesedefluoridatorshavebeendistributed during 1994 - 1996 amofig iiñil community in the North CentralProvince on pilot basis to intnxhice the defluoridatorsto the community.A study wasundertakento evaluatethe successof the pilot programmeby observingthe views andattitudesof the beneficiariesontheusageofthe defluoridators.
The objectiveof this study was to evaluate the effectivenessof the defluoridator onfluorosisprevailing in the North CentralProvince.The following componentswere usedinthisevaluadom

58 NJ Wickramasinghe
1. FluorosisDoesthecommunityrealizethatthe fluorosis is anacutehealthproblem.
2. Usageand maintenanceof thedefinoridators. -
Thelevel of usageandmaintenanceofthe defluoridàtors by beneflciaHesand the acontlation ofthe social featuressuchas level of educationsfamily income,aflbrdabilityfor the maintenanceofthe defluoridators. -
3. AwarenessUsefulnessandeffectivenessoldie cuirentawarenesspnSgrammesandstrategies.-
RESULTSTAND DISCUSSION
Geographicalfeaturesof the study area
NorthCentralprovince is a part ofdry zoneinSri lanka which covers10473Sqidhoflàndareawhich is 14 per centofthe-entirelandarea in Sri lanka. The populatioti densityof theprovince is very low compared to other provincesofthe country. - - -
Annual average rainfall is 1200 mm and average temperature is 27.3 0c inAnuradhapura district A high percentageof wells having fluoride rich water have beenidentifiedalonga irack from Habarana extendingin North-Western direction passingSouthofAnuradhapura city towards the Westernpart ofthe district and alsoin the Eastern, Centralpartofthedistrict(Figurel). - -
About 400numbersof domesticdefluoridatorswere distributedup to date within theAnuradhapuraandPolonnaruwadistHotandout of which 118nümbthiiave been±~ken-intoconsiderationonly from Anuradapuradistrict for this study.Details of’ suchdistribution isgivenin Table 1.
SoSeconomicSituation - - - - - -
Averageincomeofthe mostfamilies in Anuradhapura district is lessthan Rs. 700permouth. They are living on lubsidiesgivS by governmentMain occupationsof thesefarpiliesarefarmingandchenacultivation.- - - -
Theestimated-populationof thisdisirict is 0.75million G994)~92peróStofjopiilation livein ruralareas.67percentOfthe pojulationficilithtecl puredrinking water froni tube wells, -
watersupplyschemesandprotecteddugwells.60pacentOf thi~opu]a1ioithavesatisfactorysanitationfacifities.
Villages selectedfor this studyaresituatedclosetorural townssuchasKekiiIwa,Thalawa,Eppawalaandalsocloseto major road net work. Main drinkingwatersourceofthesefamiliesareshallowanddeepdugwells andhandpumpwells.
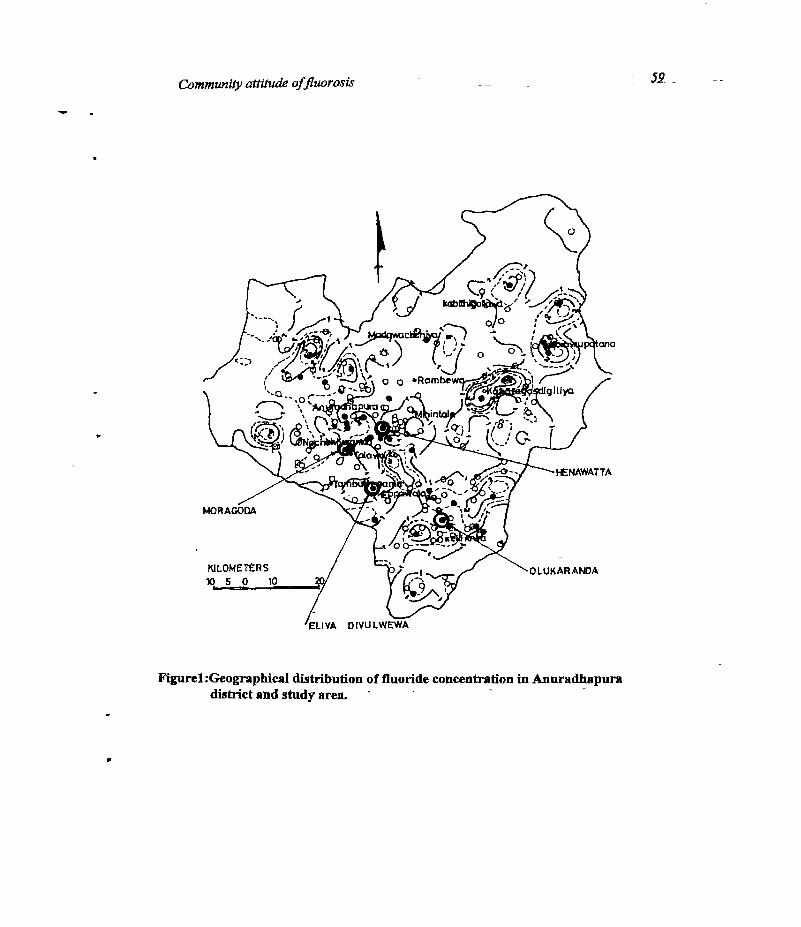
Communib’attitudeoffluorosis 52 -
Figurel:Geographicaldistribution of fluoride concentrationin Anuradhapuradistrict and studyarea. -
p

60 - N.I. Wickramas’Inghe
Table 1: Distribution of defluoridators.
Village NearestTown Implementalion period
Numberofdefluoridators
Studysample
OlulcazmlaHenewatteMoragoda -
Eliyadivulwewa
KekirawaAnuradhapuraThalawaEppawela
April 94June 94Dec 95June -96
32102056
08080808
TOTAL - - -- - 118 32
The samplepopulationof the studyarea(
agegro~sandsexasgivenin table2.
Table 2 : Age and sexclassification.
32 families) could 1~dividedaccordingto
Agein Years PercentageofPopulafion
PercentageofSex-
Male •Female
0-5 -
6-12
13-17
18-35
>35
19
,18
9
34
20
9
8 -
4
17
10
10
10
5
17
10
Total 100 48 52
Theagegroup below 5 years could be consideredas the target group thr this studybecauseoftheir vulnerability on dentalfluorosis.Henàeit is important to concentrateon the19per centto seethe successof this defluoridatorprogramme.

Communx~yattitudeoffiuorosir 61
Study criteria
1. Thefollowing methodshavebeenadoptedtocollectnecessaryfield dataforthis study.
2.Datacollectedfrombeneficiariesthroughquestionnairesadoptingrandomsamplingmechanism.Forthis,quantitativeassessment,about30 percentof stratified randomsamplesweretakenoutof 400defluoridators.Apart from that 10 numbersof beneficiarieswere interviewedfor the qualitative assessment. - - -
3. Interviewswereconductedwithrandomsamplesoffollowing categoriesforthe purposeofqualitativeassessment. - -- - - -~---- -- 1~ =
- beneficiary groups- office bearersof village level community basedorganizations(CBO) - - - - -
- ike IPrimaryschoolteachers - -
Study constrains
This study was carried out within a short period to evaluate the beneficiary responseandattitudes in connection with the usageand the maintenance of domestic defluoridators. Ingeneral social behavioron a particular aspect might have seasonaland time dependentvariation. Hence limitations of time for the studywas a constraint and it is proposedtocontinuesimilarexerciseswith a considerablelime interval.
Although the domestic defluoridators were distributed in Anuradhapura andPolonnamwa districtswhich cover onlypartofthe dry zoneasa representativesampleunder
the pilot programme.The studymentionedherein is only limited to the evaluationof plotprogrammewithin the Anuradhapura district. As a result, the analytical data might have somedeviationswith respectto the application in theentirethy zone.
In social studiescomparisonsare being madewith a control group to obtain betterunderstandingof the groundsituatioaHoweverunderthis studycontrol groupshavenotbeenselecteddue to the limitations of resourceswithin the National Water Supply andDrainageBoard(NWS&DB).
Attitudeof the communityon iluonmis
It is the duty of a social researcherto make an attemptto investigatethe reality of thecommunityfeelings on fluoroals. In other words it is important to see whetherthe ruralcommunityhasrealizedby themselvesthe acutenessof the healthhazarddue to fluorosis.Hencesome direct and indirect-questionswereaskedfrom samplegroupsto evaluatethesituation. Table3 showsthebeneficiariespreviewofthe fluorosisproblem.

62 - N.Lwickramasizzghe
Table3: DirectQuestioningTabulation.
Huorosisis anacutehealthproblem Respànsepercentage -
YES - - 44 =
NO 31
Noldea 25
*
Table4 givesthe beneficiariesattitudetowardsthe other health problemsin thestudyarea.
Table 4 : Indirect QuestioningTabulation.
According to the classification of~the above sample survey, it is clear that thebeneficiary groupsdo not have a clear mind on the acutenessoffluorosis.B.veathough thedirect questioninghave satisfactoryresults, the real feelings are indicated from the lowpriority given at indirect questioning.Hence it couldbe statedthat user preview on fluorosisis to have a minor affect to theft day to day operationsand by which they considerthis as a -
lowpriorityhealtheffect. - = -- - - - --
Usageof lowcostdomesticdefluoridator -
Though the defluoridatorshavebeendistributedamongthe selected( orprioritized)communitygroups,it is Importantto seewhetherthe defluoridatedwateris usedfordrinkingand cooking in orderto achievethe desiredobjective of having cleanteeth for the nextgeneration.On theotherhandpitperchangingofthe filter mediumat the recommendedtimeperiodis also imp6rtantThesetwo featdSarecoitelateéwith the othersocial factors toanalysistheposition.Table5 givestheresultof thefield test. - -
4
Orderofpriority onhealthproblem Beneficiaries -
responsepercentage
Priority onotherhealthproblems such
as Malaria,Diarrhoea,Viral feveretc. - -
Priorityonfluorosis. - -
Notclearonpriority.
77
‘I
19
a

CommunityattitudeoffluorosLr 63
Table5 : Usageof defluoridators.
UsageofDefluoridatedWater Percentage
Drinking andCooking 66.0
Drinkingonly 19.0
Not used 15.0
Usagerelated to level of ncome -
The levelof incomehassomerelationshipwith the usagepattern, that is, wheretheincomeis high , usageof defluoridatedwater for the correct purposeis also high. In thisgroupnone of themhas discardedthe defluoridatorsas shownin Table6 Column 4. In thelow incomegroup drawing lessthan Rs.2000per month 23 percentofdefluoridatorswerenotinuse~ - -- -
Thisshows thatthe families who have coi.up~u~utivelylow income might have otherpriorities ontheft hard life thangivingweightageon filter maintenance.
Table 6 : Usagepattern. -
Monthly income inrupees -
Grouppercentage-
Usagepatternaspercentage
Drinking &Cooking
Drinkingonly
NoTUsed
<2000 -
2001 - 3000
3001 -4000
4001 - 5000
>5000
41.0
12.0
20.0
9.0
18.0
62.0
100.0
57.0
100.0
40.0 -
15.0
-
15.0
-
60.0
23.0 -
-
28.0
-
-
100.0 66.0 19.0 15.0

64 N.L Wiclcramasinghe
The usagethe defluoridators has beenwell adoptedby the temporary housetypebeneficiariesthan the other groups.This infer that the techniqueof defluoridation hasbeenwell communicated to the peopleconcernet The type of houseswas correlatedwith theusagepattern as shownin Table 7.
Table 7: Type of housesusing defluoridators.
It is importantto evaluatewhether the usagepatternhas any correlation with thelevel of education .The usage ofdefluoridated water for correct purposewith the level ofunderstandingand awarenessis tabulated in Table 8.
Table 8: EducatIon levelandusigepattern.
Level of education Group
percentage
Usageof defluoridatedwater
Cooking&Drinking
Drinkingonly
Notused
Highereducationabovegrade11
Secondaryeducationgrade6-1(1
Primaryeducationgrade 0-6
31.0 -
59.0
10.0
80.0
68.0
-
20.0
16.0
33.0
16.0
67.0
100.0 66.0 19.0 15.0
t
Housetype Grouppercentage
Purposeof defluoridatedwater usageinpercentages
Cooking &Drinking
Drinkingonly
Notused
Temporary
Semi-permanent
Permanent
53.0
3.0
44.0
76.0 -
lOOM
50.0
18.0
-
21.0
6.0
-
24.0
100.0 6&0 19JL 15.0

Communi&attitudeofftuorosLc 65
A comparativelyhigherpercentageofuser groupswho have usedthe,defluoridatedwater for the correct purposeare in the categoriesofsecondaryandhighereducationlevels.Userswho have only primaryeducationaremostly not obtainedthe proper benefit from thedefluoridators.Hence it is clear that thereis a need for more awarenessprogrammestoeducate community for the usage of defluoridated water correctly. Further more ,theregular - maintenance of the said defluoridatorsare also connectedwith the properawarenessof theend users.
Awareness& implementationstrategies -
Different implementation strategieshave beenadopted underthe pilot programmeto introduce the defluoridators. Along with that, different options Were taken in toconsiderationto launch the awareness programmes for beneficiary groups. The basicimplementationmodelsare listed below.
1. NWS&DB asa key player2. NWS&DB asafacilitator and introducedthroughcommunitybasedorganisation
(CBO)
Implementation steps have some differencesbasedon the level of authority.Suchdifferencescouldbeidentified from the following chartin Table 9.
Mode of awareness
Study ofthe user perceptionon awarenessadoptedin the processis alsoimportantin the context of developinga suitable communication systemsto conveythe messagetothe community.
In the beneficiary point of view the methodology they received regarding thedefluoridationwouldbecategorisedasinTablelo.. - - - -
The highest percentagebeing 59 per cent indicates that the most eflbctiveawarenessstrategyfor the implementation of this programmeis through village schoolawarenessprogrammes. - -
F
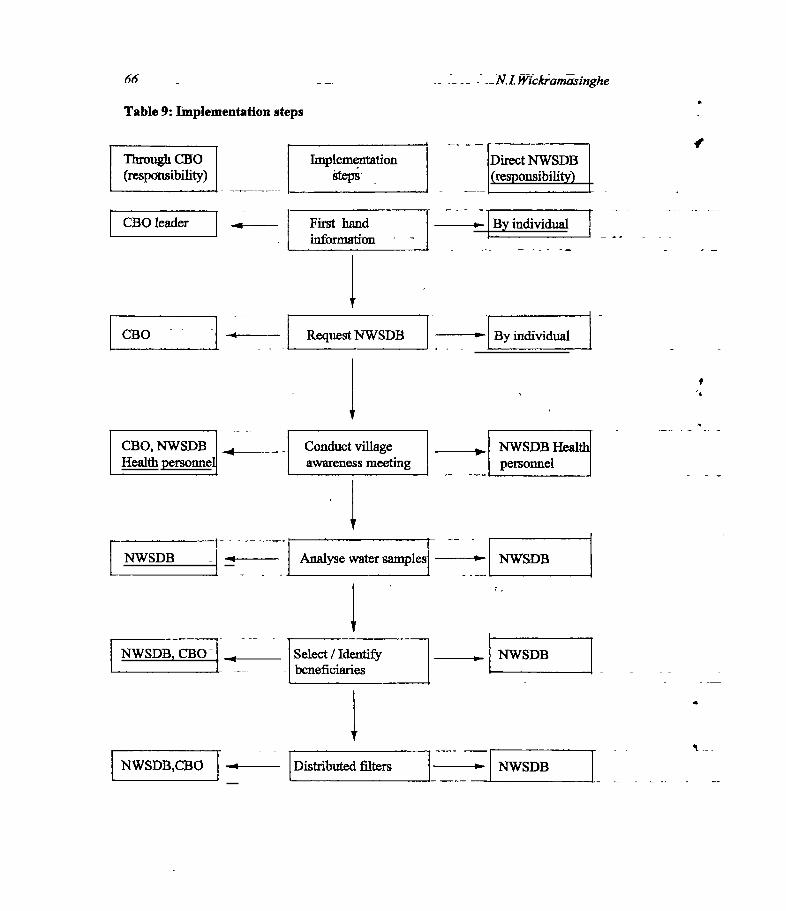
66 -
Table 9: Implementation steps
_N.I.Wickramorlnghe
Through 030
~~P0Mli~)
DirectNWSDB(resPonsibilitY)J
I
CBOleader
CEO -- -
J .l~
4
First handinformation
RequestNWSDR
fr~Bymdividual
- - ~IByinth~~~a1
CBO, NWSDB _____ -
Healthpersonne -- - -
Conduct villageawarenessmeeting
,. NWSDB Healthpersonnel
Analysewatersamples
Select/Identify- beneficiaries
NWSDB,CBO -~ Distributedfilters‘~NWSDB
Implementation
NWSDB -~ -~ I -~- NWSDB
NWSDB~CBOj _____ NWSDB

Communityattitudeoffluorosls 67
Table 10: Mode of comniunicatlon.
Bètieficiarypreview
Percentage
Throughneighbours
Schoolawarenessprogrammes
Othersource
30.0
39.0
11.0
The highestpercentagebeing 59 percent indicatesthatthe mostefièctive awarenessstrategy for the implementation of this programme is through village school awarenessprogrammes. - —
t -
CONCL1JS~ON - =
The following conclusionsaremadein this studyfor the continuation of this work.
1. Representativesampletobe obtainedto coverthe entiredry znne. -
2. Seasonaland time dependentsocial factors to be studiedin depth with companitivelylongdurationoffieldobservatiotis. - -
3. Analytical resultsto be compared with the similar factors of a control group for its
validity.
4. Awarenessprogrammesthrough village schoolscouldbemore beneficial.
5. Joint implementation through village level community basedorgariisation for theimplementation ismore advantageous.
6. Application of proper selectioncriteriafor selecting beneficiariesto include thechildren below 7 years. -
7. Somelevel of subsidyis essentialfor the low incomegroupsin orderto encouragetheusageof defluoridators. -
8. Close follow up actionandmonitoringof defluoridatorsareessentialin working withprimary educated,low incomegroups. -

68 - - - N.L Wickramasinghe
Acknowledgemenb
The author is grateful to the NationalWater Supply andDrainage Board for providingthisopportunity to write the sociologicalimplication of thisstudy. -
References
1. PadronsiriJ.P. andFonsekaW.S.C.A. (1994).Low costfluoride removal filter.Proceedingsof the2O1! WaterEngineering Developmentconference(WEDC)295-300. - -
2. PadmasiriJ.P. andDissanayakeC.B. (1995).A simpledefluoridatorfor removingexcessfluoride from fluoride rich water. InternationalJou.rnaiofEnvironmentalHealth. 5: 153-163. - - - - - - - -
3. COWl consultMasterplanfor waterandsanitation -Anuradhapuradistrict -
Exlstiizgsituation.(1994). - - 24. ShanthasiriH.K.S. (1995). Usagepatternbfdomesticdefluoridator (3~1nhalareport)
National Water Supply & Drainage Bôãrd.
5. RatnapalaN. Basicconceptsofsocialresearch(Sinhala report) 1994.
I
69
SYMPOSIUMONPREVENTIONOF FLUOROSIS LN SRI LANKADISCUSSION AND RECOMMENDATIONS
It wasdecidedto introduceindividual house-holddefluoridators in the affectedareas ofSri Lanka. Large scale community-operated plants are less practicalbecausetherewould be difficulties to~antngethe cleaningresponsibility.Further,communityplantsare more expensivethan individual ones as reportedby some foreign countries. Thecostof an individual defluoridator is thousandrupees.
The awarenessofthe fluorosis problem in Sri Lanka can be enhancedthoroughproper publicity. The activitiessuch as educationalprogrammes, workshops,seminars,distribution of pamphletsetc. should be organised by the National Water Supply &DrainageBoard, Sri Lanka Association for the Advancementof Science,Institute ofDental Servicesand relatedinstitutesespeciallyin the affectedareas.The enrollment ofother interestedparties such asNon Government Organisationsandprivatesectorhastobe encouraged.
Additionally, the political authorities such as Cabinet Ministers and ProvincialCouncil Ministers should be contacted and made aware to accept defluoridationofdrinking wateras a policy matter. The Ministry of Health should take the initiative totake that policy decision,and the implementation of the policy by the Governmentwouldbe the next step. At implementation, economical factorsshouldbe considered,and one suggestionis to subsidise defluoridatorsdependingon the income of thefamily.
Pilot programmes should also be continued while the above stated processisbeing carded out. The outcome of suchprogramme will be known after about fiveyears. The National Water Supply and Drainage Board needs support from theDepartmentof Health, Non GovernmentOrganisations,Departmentof Education,Community Leaders,etc. on this matter, to eradicate fluorosis from Sri Lanka.
Compiled by: Dr. NamalPriyanthaSecretary SLAAS, E-2
a
4

t
r


![Download the report in English [1.48 MB]](https://img.dokumen.tips/doc/110x75/586b9e6e1a28ab2a738bfa3d/download-the-report-in-english-148-mb.jpg)