Embed Size (px)
Citation preview
Slurry Jet Pump Performance: Under Different Design and Operational parameters
*A.H. Hammoud and **A.A. Abdel Naby
Mechanical Engineering Department, Beirut Arab University,
P.O. Box:11-5020 Beirut, Lebanon
E-mails : * [email protected], **[email protected]
Abstract: Slurry jet pumps are used in many industrial applications and in particular in dredging, handling water -sand and aggregates. The performance of slurry jet pump is affected by the discharge volumetric concentration ratio and jet pump dimensions as well. The present paper investigates the performance of slurry jet pump under different design and operation parameters. In the first stage of the investigation, the tests were performed under different nozzle-to-throat spacing to nozzle diameter ratio “X”. The second stage was to determine the effect of discharge volumetric concentration ratio “CVD” for water-sand mixture ratios on the pump performance at different operating conditions. Finally a comparative study between the slurry jet pump performance and water-water jet pump under different “X” ratios was also obtained. Experimental results showed that the nozzle-to-throat spacing to nozzle diameter ratio “X” and the discharge volumetric concentration ratio “CVD” are important parameters for design and operational aspects.
Keywords:
Hydraulic transportation, jet pump, mixing chamber, slurry pumping, sand lifting
1.Introduction
Jet pump is a simple device that transfers momentum
from high velocity primary jet flow to a secondary flow. It is geometrically simple, since it consists of five main components, namely nozzle, suction chamber, mixing throat, diffuser and suction inlet pipe, as schematically shown in Figure (1). The absence of moving mechanical parts eliminates the operational problems associated with bearing, sealing and lubrication. Such pumps are widely used because of their simplicity and highly reliability in the fields of civil engineering in dewatering, foundation excavations in fine soils and dredging. It is also used in several industrial engineering applications especially in solid transmission. The liquid – liquid jet pump dates back to the application by Thompson [1] in 1852. A number of one dimensional model describing the jet pump have been presented by [2,3,4], using various design parameters and loss coefficients as well. The effect of nozzle–throat spacing on the jet pump performance have been carried out experimentally by many investigators [5,6]. They found that L/D > 0 is required for optimum performance.
Cunningham [7] examined the liquid jet pump to determine the optimum axial dimensions comparing the theoretical and the experimental results based on one-dimensional theory. Winoto et al. [8] studied the efficiency of water – water jet pump both theoretically and experimentally. Jet pumps are also frequently used under conditions where the primary and secondary fluids are different. It is modified to be used for pumping water mixture containing solids to cover a wide range of applications in civil and industrial engineering. There are many investigations predicting the performance of slurry jet pump to cover the wide range of its applications. Zandi and Govateos [9], Fish [10] and Mikail et al. [11] carried out experimental and theoretical work on water and slurry jet pumps to develop equations which may be used in designing a slurry jet pump. Siwiec et al [12] described a new design procedure for multi – jet pump that is used in dewatering and excavations in fine soils. Recently a theoretical study for a centrally driven jet pumps for lifting solids was presented by Chamlong et
Proceedings of the 4th WSEAS International Conference on Fluid Mechanics and Aerodynamics, Elounda, Greece, August 21-23, 2006 (pp237-244)
al [13]. They concluded that, the performance of both solid handling jet pump and water jet pump are effected by nozzle –throat ratio and they found that, the maximum efficiency is attained when d/D =0.5-0.6. Furthermore, Chamlong et al [14] developed a numerical prediction to find the optimum mixing throat length with respect to nozzle diameter. They concluded, that, the optimum ratio of the mixing throat length to the nozzle diameter,(Lm/D) is 2 - 3.5. From the previous investigations, it is clear that the jet pump performance is extremely affected by pump design dimensions, especially when it is used in handling solids. In practice, the concentration of solids in water as a secondary
stream affects the performance of the jet pump due to the presence of sand of an unexpected quantity and size. This unexpected mixture affects the design dimensions of the jet pump. Therefore, an experimental investigation for the slurry jet pump is presented to determine the effects of both nozzle–to–throat spacing to nozzle diameter ratio “X” and the discharge volumetric concentration “CVD” on the pump performance. Also a comparative study between slurry jet pump performance and water-water jet pump is made for lifting configuration (negative suction head) at different motive pressure for the two pump configurations.
Nomenclature :
Ar = Area ratio = Aj/Am , (area of nozzle to area of mixing chamber). AJ = Cross sectional area of the jet. Am = Cross sectional area of the mixing chamber. CVD = Discharge volumetric concentration. D = Nozzle (jet) diameter. L = Nozzle-to-throat spacing . Lm = Length of the mixing chamber P = Total pressure = Pd - Ps Pa = Motive pressure Pd = Discharge Pressure
Pr = Pressure ratio Ps = Suction Pressure Qr = Flow ratio X = Ratio of nozzle-to-throat spacing to nozzle diameter (L/D) γ = Specific weight. η = pump efficiency
Subscripts :
d = discharge j = Nozzle tip m = mixing chamber r = ratio s = solid or suction w =water
2. Test rig description and experimental procedure 2.1 Experimental set-up The experimental set-up is schematically shown in Figure (2), whereas the jet pump assembly used in the present investigation is shown in Figure (1). Full description and details of the test rig is presented in our paper [17] 2.2 Experimental procedure
The experimental procedure applied in the present study was carried out to determine the jet pump performance. Experiments were performed in two stages: Firstly, pumping fresh water to determine water-water jet pump performance and secondly pumping water- sand mixture to determine slurry pump performance. This procedure is detailed below:
1- Water temperature and atmospheric pressure in the laboratory are recorded. 2- The water tank is filled with fresh water and kept at constant water level, using a float switch and an overflow pipe line to maintain a constant suction head for the centrifugal pump. 3- The nozzle-to-throat spacing to nozzle diameter ratio “X” is set to 1.
Proceedings of the 4th WSEAS International Conference on Fluid Mechanics and Aerodynamics, Elounda, Greece, August 21-23, 2006 (pp237-244)

4- The pump was turned on, keeping the angle valve in the pump delivery side fully opened. 5- The pump pressure was adjusted to 3 bars and then the jet pump discharge valve was gradually closed. 6- When a steady state condition was attained; the readings of the rota-meter, U-tube manometers, pressure gauges and data about the discharge mixture sample were recorded during a defined period of time. 7- The volume flow rate and the weight flow rate were then determined. 8- Steps (4) to (7) were repeated with different motive pressures 1, 1.5, 2 and 2.5 bar, while the nozzle-to-throat spacing to nozzle diameter ratio “X” is kept constant. 9- The nozzle-to-throat spacing to nozzle diameter ratio “X” was adjusted to 1.25 and steps (4) to (6) were repeated with different motive fluid pressure varying from 1.5 to 3 bar, in order to investigate the effect the nozzle-to-throat spacing to nozzle diameter ratio “X” on the jet pump performance.
10- Data was recorded for nozzle-to-throat spacing to nozzle diameter ratio “X” varying as 1, 1.25, 1.5 and 1.75. In the second stage of the experiment, different amounts of sand were added to water to give a discharge volumetric concentration CVD of 8.5%, 13.9 %, 15% and 18.3 % and the same procedure used previously for water was followed for pumping water-sand mixture. The sand used in this investigation has a grain size varying from 0.5 to 1.25 mm and a specific gravity of 2.64. The discharge volumetric concentration CVD is determined as follows:
Where γd, γs and γW are the specific weight of discharge mixture (water-sand), solids and water respectively. The specific weight of discharge mixture is determined by collecting a sample of the discharge mixture in a measuring tank. Then, dividing the sample weight by its corresponding volume yields the discharge mixture specific weight. The performance of jet pump is generally considered to be a function of the parameters defined in the following: i- Flow ratio Qr = Q suction / Q motive, ii- Pressure ratio Pr = (Pd-Ps)/(Pa-Pd), iii- Efficiency, η = The ratio of the total energy increase of suction flow to the total energy increase of driving flow
as , η = Pr xQr
3. Tests, results and discussion 3.1 Effect of nozzle-to-throat spacing to nozzle diameter ratio “X” on jet pump performance (water-
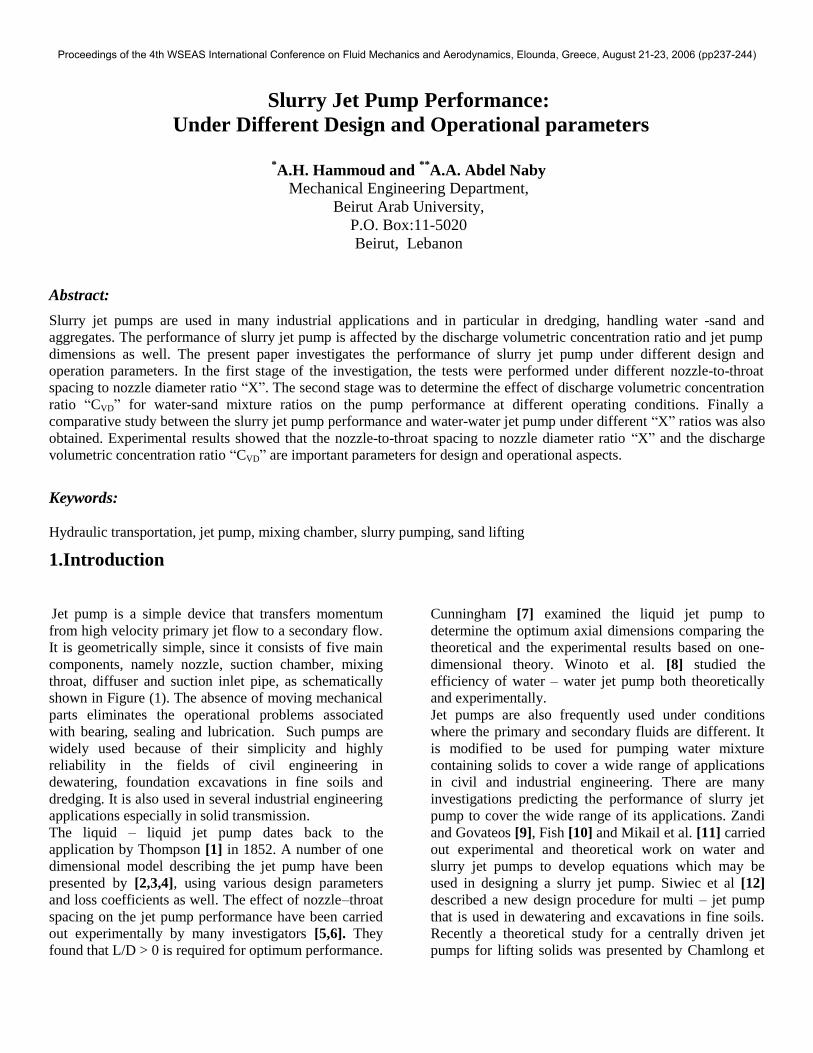
water) First, water jet pump is tested to determine the effect of jet pump dimensions as design parameters on the jet pump performance. The most effective design parameter is the ratio between the nozzle-to-throat spacing length “L” and the nozzle diameter “D” which is defined here as the ratio “X”. At certain fixed nozzle-to-throat spacing to nozzle diameter ratio “X” and a pump drive pressure Pa , the relations between the head ratio against the flow ratio and the pump efficiency against the flow ratio are plotted in figure 3 for different drive pressures and various "X". The test was repeated for different drive pressures of the centrifugal pump from 3 to 1.5 steps of 0.5 bars and different nozzle-to-throat spacing to nozzle diameter ratio “X” = 1, 1.25, 1.5 and 1.75 ,see Figure[3].
For nozzle-to-throat spacing to nozzle diameter ratio “X = 1”, the optimum jet pump performance was obtained for a drive pressure of 1.5 bar, while increasing the motive pump pressure the pump performance decreased, that’s due to pressure reduction at high pump driving pressure which increases the head loss in the jet pump causing swirl and eddy losses inside the mixing chamber. The effect of flow ratio on the jet pump efficiency is also presented. Typical results of the water jet performance and pump efficiency were obtained at the optimum motive pressure Pa = 1.5 bar for nozzle-to-throat spacing to nozzle diameter ratio “X” = 1, 1.25, 1.5 and 1.75. The attained highest jet pump efficiency is about 24 % at X= 1.25.
Proceedings of the 4th WSEAS International Conference on Fluid Mechanics and Aerodynamics, Elounda, Greece, August 21-23, 2006 (pp237-244)
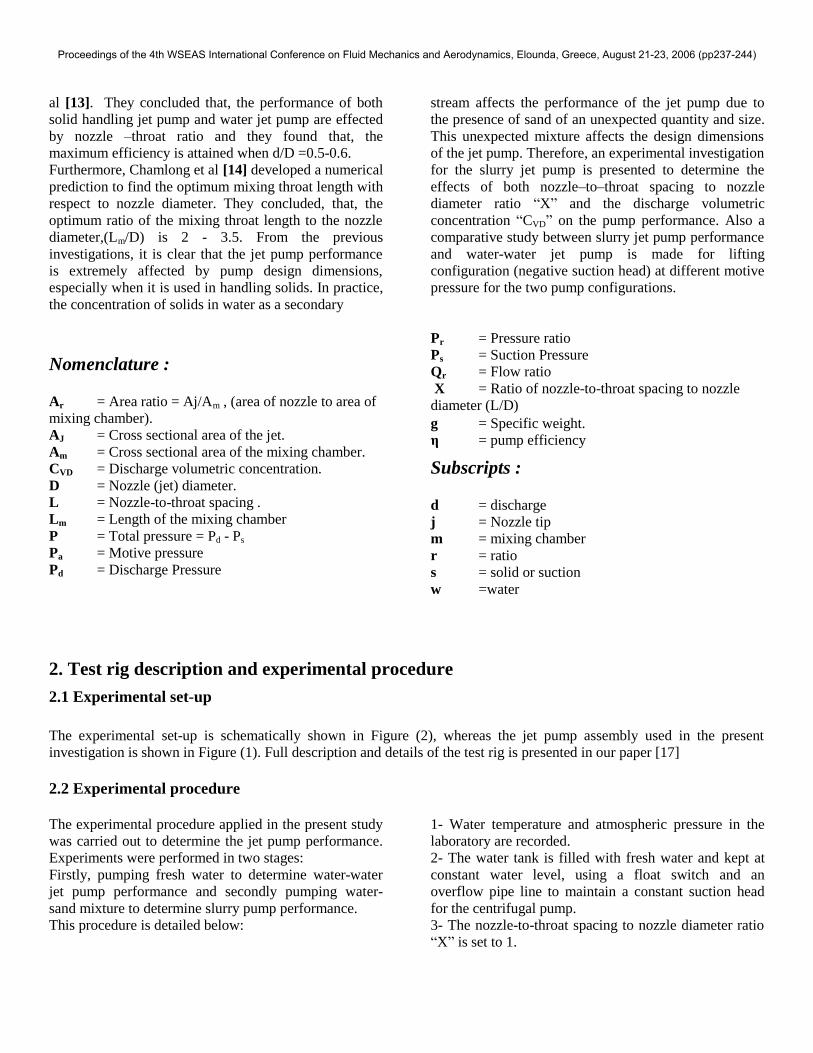
3.2 Effect of nozzle-to-throat spacing to nozzle diameter ratio “X” on slurry jet pump performance (water-sand mixture) at various discharge volumetric concentrations CVD. The experimental results for the performance curves of slurry jet pump are plotted in Figure (4) for the same nozzle-to-throat spacing to nozzle diameter ratio “X” = 1, 1.25, 1.5 and 1.75 at the same driving pressure values 1.5, 2, 2.5 and 3 bar. Examination of these tests reveals that there is a similarity between the tests carried with water and those carried with water-sand mixture. In both cases, the pressure ratio decreases with increasing flow rate ratio. The major difference between the two tests is that the head /flow ratio curve for the derived pressure value of 3 bar is higher than that of 1.5 bar (obtained in the case of water only) for all nozzle-to-throat spacing to nozzle diameter ratio “X” = 1, 1.25, 1.5 and 1.75. That’s may be due to in the case for pumping water and sand mixture, two phase solid and liquid, higher driving pressure is needed more than that ‘s required for driving water only, single phase. Furthermore, the highest efficiency was obtained at a pump derived pressure of 3 bar instead of 1.5 bar for all values of “X”. More details For that optimum driving pressure P = 3 bar, the effect of nozzle-to-throat spacing to nozzle diameter ratio “X” on the pump performance and pump efficiency is plotted in Figure (5). Slurry pump efficiency is nearly the same for both X equals 1 and 1.25 for discharge ratio less than 0.6.For discharge ratio greater than 0.6 the efficiency for X = 1 is higher
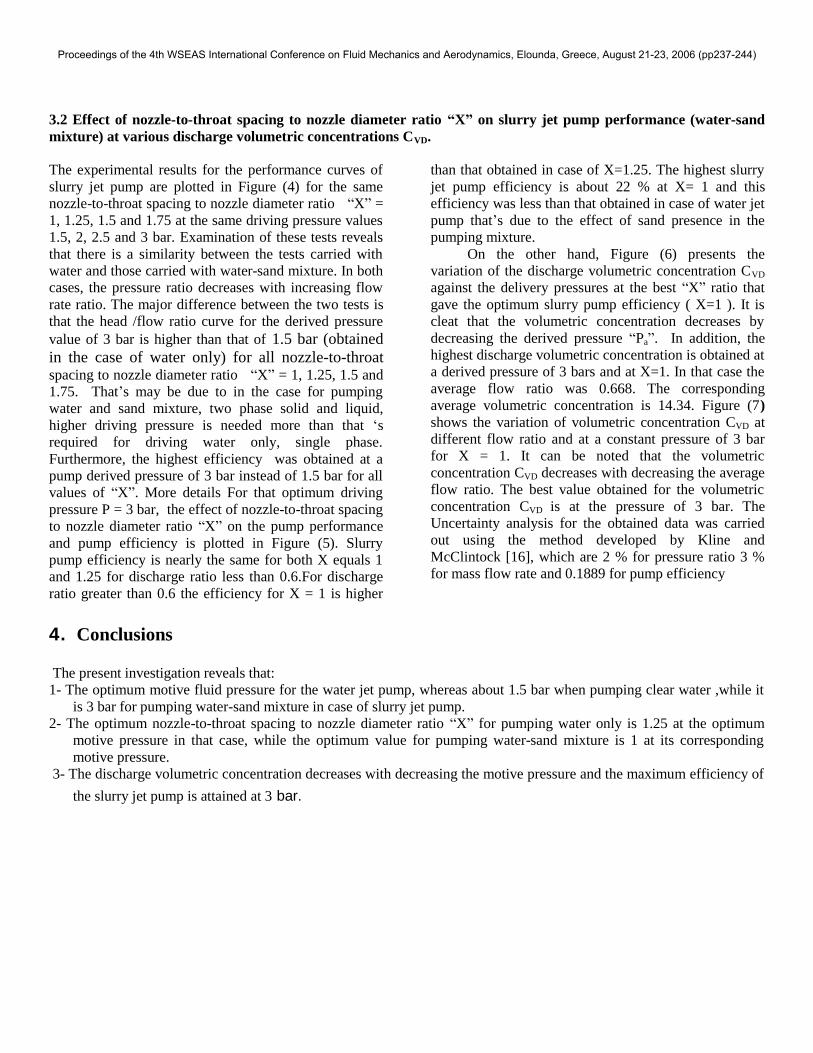
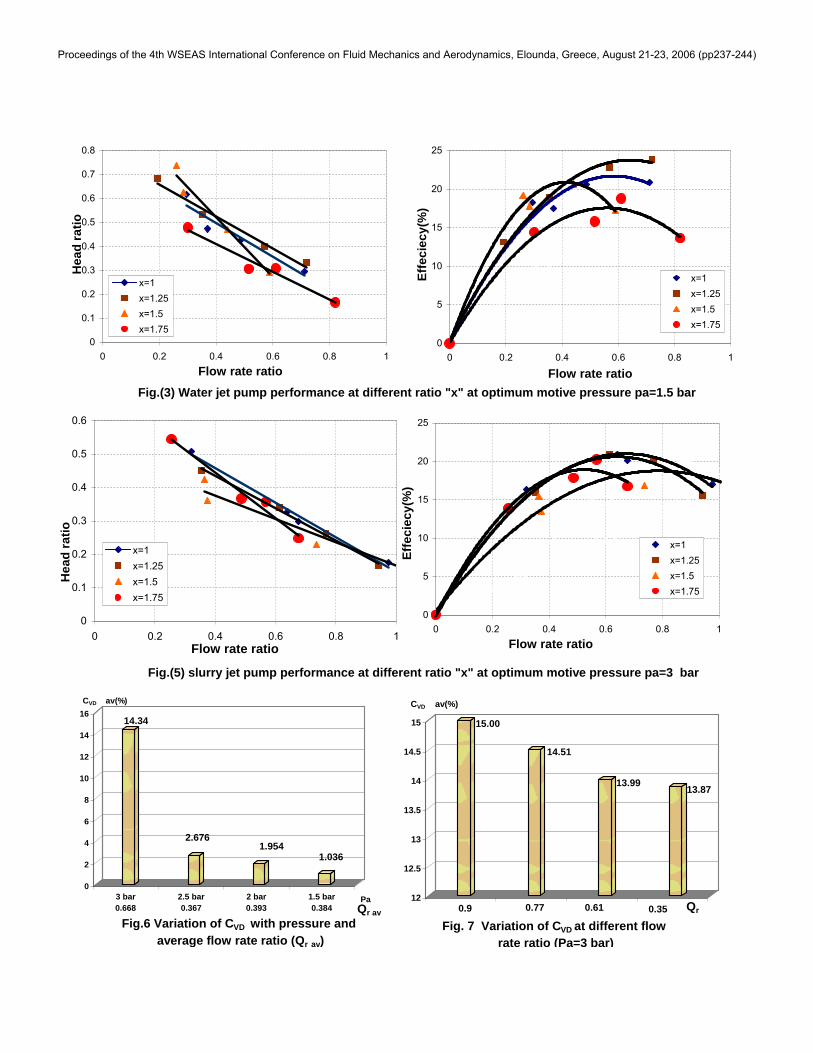
than that obtained in case of X=1.25. The highest slurry jet pump efficiency is about 22 % at X= 1 and this efficiency was less than that obtained in case of water jet pump that’s due to the effect of sand presence in the pumping mixture. On the other hand, Figure (6) presents the variation of the discharge volumetric concentration CVD against the delivery pressures at the best “X” ratio that gave the optimum slurry pump efficiency ( X=1 ). It is cleat that the volumetric concentration decreases by decreasing the derived pressure “Pa”. In addition, the highest discharge volumetric concentration is obtained at a derived pressure of 3 bars and at X=1. In that case the average flow ratio was 0.668. The corresponding average volumetric concentration is 14.34. Figure (7) shows the variation of volumetric concentration CVD at different flow ratio and at a constant pressure of 3 bar for X = 1. It can be noted that the volumetric concentration CVD decreases with decreasing the average flow ratio. The best value obtained for the volumetric concentration CVD is at the pressure of 3 bar. The Uncertainty analysis for the obtained data was carried out using the method developed by Kline and McClintock [16], which are 2 % for pressure ratio 3 % for mass flow rate and 0.1889 for pump efficiency
4. Conclusions The present investigation reveals that: 1- The optimum motive fluid pressure for the water jet pump, whereas about 1.5 bar when pumping clear water ,while it
is 3 bar for pumping water-sand mixture in case of slurry jet pump. 2- The optimum nozzle-to-throat spacing to nozzle diameter ratio “X” for pumping water only is 1.25 at the optimum
motive pressure in that case, while the optimum value for pumping water-sand mixture is 1 at its corresponding motive pressure.
3- The discharge volumetric concentration decreases with decreasing the motive pressure and the maximum efficiency of the slurry jet pump is attained at 3 bar.
Proceedings of the 4th WSEAS International Conference on Fluid Mechanics and Aerodynamics, Elounda, Greece, August 21-23, 2006 (pp237-244)

References:
[1] Thompson,J., " On Jet Pump or Apparatus for Drawing up Water by Power of Jet Report, British Assn., London, England, PP. 130 (1852). [2] Gosline, J., and O'Brien, M., "The Water Jet Pump", University of California Publications in Engineering, Vol. 3, No. 3, PP. 167-190,(1934). [3] Cunningham, R. G., and River, w., "Jet-Pump Theory and Performance with a Fluid of High Viscosity", Trans. ASME, 79, PP. 1807-1820, (1957). [4] Hansen, Arthu G. and Kinnavy, Roger., " The Design of Water –Jet Pumps. Part-I, Experimental Determination of Optimum Design Parameters ", ASME paper 65-WA/FE-31, PP. 8, (1965). [5] Mueller, N.H.G., " Water Jet Pump ", ASCE Proceedings, Journal of Hydraulic Division ASCE, Vol. 90, No. HY3, PP. 83-113. (1964). [6] Sanger, N. L., " An Experimental Investigation of Sevral Low-Area Water Jet Pumps ", Journal of Basic Engineering, Trans. ASME, Series D, Vol. 92, 1, PP.11-20, (1970). [7] Cunningham, R.G. " Liquid Jet Pump Modeling: Effects of Axial Dimensions on Theory-Experimental Agreement ", 2nd symposium on Jet Pumps&Ejectors and Gas lift techniques, PP F1.1-F1.15, (1975) [8 ]Winoto, S.H., Li, H. and Shah, D. A., " Efficiency of Jet Pumps ", Journal of Hydraulic Engineering, PP. 150-156, (2000). [9] Zandi, I., and Govatos, G., "Jet Pump Slurry Transport', Hydro transport I, 1st International Conference on the Hydraulic Transport of Solids in Pipes, BHRA, Held at the University of Warwick, U.K. 1st September, Paper L2, PP. L2.17-L2.32.March, (1970), [11] Fish, G., " The solids –handling jet pump". Hydro-transport 1, First international conference on the hydraulic transport of solids in pipes, (BHRA) Held at the University of Warwick, U.K., 1st September, Paper L.1, PP. L1.1– L1.15. (1970) [12] Mikail, S., Morcos, S.M., and Shaheen, Y.A, “ Experimental investigations of a slurry jet pump.” Proc. Third International Symposium on Liquid-Solid Flows, ASME, Winter Annual Meeting, Chicago, Illinois, Nov.27-Dec.2, FED Vol. 75, PP.203-210., (1988). [13] Siwiec, T.M., White, J.K. and DPhil , “ A Design Procedure For a Multi-Jet Pump Installation.Proc. Instn Civ. Engrs Wat., Marit. & Energy, PP.304-315, Dec. (1995). [14] Chamlong , P., and Aoki , “ Theoretical analysis on hydraulic transportation of . solids using the jet pump”. Proceeding of Engineering School , Tokai Univ., Ser. E, PP. 11-17. (2001) [15] Chamlong, P., and Aoki, K., “Numerical prediction on the optimum mixing throat length for drive nozzle position of the central jet pump”. Tenth international symposium on flow visualization, August 26-29, Kyoto, Japan (2002). [16] Holman,J.P, Experimental Methods for Engineers.,3rd ed., McGraw-Hill, New York.,(1978). [17] Hammoud A.H., “ Effect of Design and Operational Parameters on Jet Pump Performance”, The 4th WSEAS International Conf. On Fluid Mech. Aerodynamics, August, 21-23, 2006.
Proceedings of the 4th WSEAS International Conference on Fluid Mechanics and Aerodynamics, Elounda, Greece, August 21-23, 2006 (pp237-244)

6
100 mm 70 mm 100 mm 100 mm
25.4 mm
19 mm
25.4 mm
L
101.4 mm7
d= 12 mm
Figure (1) Construction details of jet pump. 1- Nozzle , 2- Suction chamber , 3-Mixing throat , 4- Diffuser , 5- Suction inlet pipe
Figure (2) Experimental set-up
1- jet pump 2- centrifugal pump 3- water tank 4- discharge pipes 5- suction pipe 6- mixing tank 7- mercury manometers 8- angle valve 9- ball valve 10- graduated vessel 11- calibrated digital balance 12- by-pass 13- flow-meter 14- pressure gauge
4 3 2
1
5
Proceedings of the 4th WSEAS International Conference on Fluid Mechanics and Aerodynamics, Elounda, Greece, August 21-23, 2006 (pp237-244)

Fig.4 Slurry Jet pump performance for different pump motive pressure and at specific ratio "X"
0
0.1
0.2
0.3
0.4
0.5
0.6
0.7
0.8
0.9
1
0 0.2 0.4 0.6 0.8 1 1.2
Hea
d ra
tio
Pa=3 bar
Pa= 2.5 bar
Pa=2 bar
Pa= 1.5 bar
0
5
10
15
20
25
0 0.2 0.4 0.6 0.8 1 1.2
Effic
ienc
y (%
)
Pa=3 bar
Pa=2.5 bar
Pa=2 bar
Pa=1.5 bar
0
0.1
0.2
0.3
0.4
0.5
0.6
0.7
0.8
0.9
1
0 0.2 0.4 0.6 0.8 1 1.2
Hea
d ra
tio
Pa=3 bar
Pa=2.5 bar
Pa=2 bar
Pa=1.5 bar
0
5
10
15
20
25
0 0.2 0.4 0.6 0.8 1 1.2
Effic
ienc
y (%
)Pa=3 bar
Pa= 2.5 bar
Pa=2 bar
Pa=1.5 bar
0
0.1
0.2
0.3
0.4
0.5
0.6
0.7
0.8
0.9
1
0 0.2 0.4 0.6 0.8 1 1.2
Hea
d ra
tio
Pa=3 bar
Pa=2.5 bar
Pa= 2 bar
Pa=1.5 bar
X = 1.5
0
5
10
15
20
25
0 0.2 0.4 0.6 0.8 1 1.2
Effic
ienc
y (%
)
Pa=3bar"
Pa=2.5bar"
Pa=2bar"
Pa=1.5 bar"
0
0.1
0.2
0.3
0.4
0.5
0.6
0.7
0 0.2 0.4 0.6 0.8 1 1.2
Hea
d ra
tio
Pa=3 bar
Pa=2.5 bar
Pa=2 bar
Pa= 1.5 bar
X = 1.75
0
5
10
15
20
25
0 0.2 0.4 0.6 0.8 1 1.2
Effic
ienc
y (%
)
Pa=3 bar
Pa= 2.5 bar
Pa=2 bar
Pa=1.5 bar
Flow rate ratio Flow rate ratio
Flow rate ratio Flow rate ratio
Flow rate ratio Flow rate ratio
Flow rate ratio Flow rate ratio
X = 1 X = 1.25Proceedings of the 4th WSEAS International Conference on Fluid Mechanics and Aerodynamics, Elounda, Greece, August 21-23, 2006 (pp237-244)
15.00
14.51
13.99 13.87
12
12.5
13
13.5
14
14.5
15
3 bar
CVD av(%)
0
5
10
15
20
25
0 0.2 0.4 0.6 0.8 1
x=1x=1.25x=1.5x=1.75
Flow rate ratio
Effe
ciec
y(%
)
0
0.1
0.2
0.3
0.4
0.5
0.6
0.7
0.8
0 0.2 0.4 0.6 0.8 1
x=1x=1.25x=1.5x=1.75
Flow rate ratio
Hea
d ra
tio
Fig.(3) Water jet pump performance at different ratio "x" at optimum motive pressure pa=1.5 bar
Hea
d ra
tio
0
0.1
0.2
0.3
0.4
0.5
0.6
0 0.2 0.4 0.6 0.8 1
x=1x=1.25x=1.5x=1.75
Flow rate ratio
Fig.(5) slurry jet pump performance at different ratio "x" at optimum motive pressure pa=3 bar
0
5
10
15
20
25
0 0.2 0.4 0.6 0.8 1
x=1x=1.25x=1.5x=1.75
Flow rate ratio
Effe
ciec
y(%
)
0
2
4
6
8
10
12
14
16
3 bar0.668
2.5 bar0.367
2 bar0.393
1.5 bar0.384
CVD av(%)
Pa Qr av
14.342
2.6761.954
1.036
Fig.6 Variation of CVD with pressure and average flow rate ratio (Qr av)
Fig. 7 Variation of CVD at different flow rate ratio (Pa=3 bar)
0.61 0.350.9 0.77 Qr
Proceedings of the 4th WSEAS International Conference on Fluid Mechanics and Aerodynamics, Elounda, Greece, August 21-23, 2006 (pp237-244)