Embed Size (px)
Citation preview

Slope Stabilization Using EPS Geofoamat Route 23A
4.1 IntroductionGeofoam introduced in recent years has provided solutions to a number of engineering problems. One ofthese problems is the slope stability problem. In a slope stability problem a slip surface develops betweentwo portions of the soil as in figure 4-1. One portion tends to slip over the other making it unsafe forengineering constructions on the top or at the toe of the slope.
Two main forces appear in the slope stability problem: the driving force and the stabilizing force. Thedriving force is due to the weight of the top portion of the slip area that tends to slip downward. Thestabilizing force appears in two forms; the shear strength along the slip surface and the weight of the soilin the toe of the slope. One way to increase the factor of safety of a slope is to reduce the driving weightby replacing an amount of soil by foam. For a soil with friction, reducing the weight will result inreducing the shear strength of the soil, which in turn will reduce the stabilizing force. Foam must beplaced in such a way that the overall factor of safety is increased.
Two techniques of analyses are used in this study; the limiting equilibrium method and the finitedifference method. Each method is used in distinct numerical simulation softwares. Results from themodels in both softwares are compared for cases with and without geofoam. Softwares results arecompared with Taylor charts (Taylor, 1949) for the case without geofoam. A parametric study is done tocover the practical ranges of slopes with different heights, slope inclination, soil type, geofoam shape,etc.
4
file:///T|/Test Reports/Slope Stabilization Using Geofoam at Route 23A (AE)/ch4.html (1 of 63) [9/6/2000 2:57:58 PM]

Figure 0�1 Driving and Resisting Blocks in a Failure Zone
Horizontal seismic coefficient is used to represent the effect of dynamic forces on slope equilibrium.Important results of this study are presented. A case history concludes this chapter. More related researchworks were presented in chapter two.
4.2 Geofoam Block Alignment
Generally, the cross section of a geofoam stabilized slope embankment contains layers of foam blocks,each layer being about 0.6m-0.83m (2ft-2.75ft) thick. These layers are underlined by about 0.15m (0.5ft)thick sand or filter. Reinforced concrete slab of about 0.15m (0.5ft) lays on the top of the geofoamblocks. The concrete slab acts as a load distributing layer as well as a protection for the foam. The pavingmaterial and sub base layers are laid over the top of the distributing slab.
Two configurations for the distribution of foam blocks within the slope were studied. Figure 4-2 showsthe traditional configuration where the foam blocks are arranged such that the side of the blocks facingthe slope is inclined to an angle equivalent to that of the slope. The other edge of geofoam configurationis vertical. In this case, the soil is either excavated to its normal angle of repose by using compacted
4
file:///T|/Test Reports/Slope Stabilization Using Geofoam at Route 23A (AE)/ch4.html (2 of 63) [9/6/2000 2:57:58 PM]

backfill or supporting the soil with sheeting while excavating and constructing the embankment. In somecases, the vibratory driver that may be used in installation of the sheeting can make the whole slope failor at least move because of the vibration produced. The sheeting itself may be expensive, making thegeofoam solution uneconomical. Moreover the installation and the extraction of the sheeting is a timeconsuming process. The advantage of this configuration, though, is that the excavated space is less andthe usable space for construction is more.
The configuration shown in figure 4-3 requires neither sheeting nor compacted back fill. The shape of thefoam fill tends to take the shape of a slip surface; hence the factor of safety will be higher for the sameamount of foam, as shown later in the report.
A number of parameters will affect the factor of safety of a geofoam-stabilized slope. The characteristicsof the soil such as its shear strength, density, and its hydraulic conductivity constitute the most importantfactors. The geometry of the slope itself, such as its height and inclination also affect its factor of safety.The geometry and the position of the foam fill also control the factor of safety.
Figure 0�2 Typical Cross Section of a Geofoam Stabilized Slope
4
file:///T|/Test Reports/Slope Stabilization Using Geofoam at Route 23A (AE)/ch4.html (3 of 63) [9/6/2000 2:57:58 PM]

Figure 0�3 Arrangement of Geofoam Blocks with Two Inclined Edges
4.3 Methods Of Analysis
4.3.1 The Limiting Equilibrium Method
GeoSlope software (GEOCOMP Corp., 1992) calculates the factor of safety and draws the slip surface ofa slope. Soil Characteristics such as density, cohesion, and friction angle are used to represent soil inGeoSlope.
Foam is idealized as stiff clay with very low density to insure that the slip surface does not pass throughit. Horizontal seismic coefficient can be represented in GeoSlope. GeoSlope uses Bishop circular methodof analysis that is capable of detecting only circular slip surface.
4.3.2 The Finite Difference Analysis Method
Fast Lagrangian Analyses of Continua (FLAC) software (Itasca 1998) is used to analyze soil mechanicsproblems using the finite difference method. In the FLAC model, the cross section of the problem isdivided into a mesh of preferably square elements. Mohr-Coulomb model is used to represent the soil.Cohesion, friction angle, dilation angle, density, shear modulus and bulk modulus are used in the model.
4
file:///T|/Test Reports/Slope Stabilization Using Geofoam at Route 23A (AE)/ch4.html (4 of 63) [9/6/2000 2:57:58 PM]

Elastic model is used to represent geofoam. Geofoam density, shear modulus and bulk modulus are usedin the elastic model. Values of these properties were chosen so as to cover the practical range of theseproperties (Negussey, 1997). The boundary is selected to be far away from the expected slip surface.Failure occurs when the solution doesn’t converge. The safety factor of the cross section is calculated bydividing the shear strength of the soil by the shear strength at failure. The failure slip surface can bemonitored using different ways; one of which is by monitoring the zones where the shear strainincrement is maximum.
4.4 Effect of Using Geofoam in Increasing theFactor of SafetySlopes with circular slip surfaces were found to have the same factor of safety and identical slip surfacesusing either software, FLAC or GeoSlope. This is examined for both cases, with foam and without foam.GeoSlope and FLAC gave the same factor of safety and the same starting point of the circular slipsurface for slopes (not having geofoam) as given by Taylor charts.
4.4.1 Cohesionless Soil
Failure surface for homogenous cohesionless soil is generally shallow (McCarthy, 1995). It forms on thesloped edge as shown in figure 4-4. The limiting equilibrium analysis gave the same result and the samefailure zone as the finite difference analysis. By using geofoam, the factor of safety and the failuresurface does not change.
Geofoam affects neither the driving force nor the stabilizing force as shown in figure 4-5. Figure 4-5shows that failure zones develop in the area between the foam and the sloped edge. By replacing thiszone with a more stiff soil, failure zones develop somewhere else along the sloped edge, maintainingalmost the same factor of safety.
4
file:///T|/Test Reports/Slope Stabilization Using Geofoam at Route 23A (AE)/ch4.html (5 of 63) [9/6/2000 2:57:58 PM]

Figure 0�4 Shear Strain Contours in a Cohesionless Soil Slope
Figure 0�5 Shear Strain Contours in a Geofoam-Stabilized Cohesionless Soil Slope
4
file:///T|/Test Reports/Slope Stabilization Using Geofoam at Route 23A (AE)/ch4.html (6 of 63) [9/6/2000 2:57:58 PM]

4.4.2 Cohesive Soil
The slip surface for a general slope of a homogeneous cohesive soil is either a deep-seated circle or a toecircle (McCarthy, 1995). In both cases, a large amount of soil next to the slope edge acts in the drivingforce. Figure 4-6 shows the failure zones for a clay soil obtained using FLAC. The soil profile of thiscross section is a cohesive soil underlined by stiffer soil. For such cases, the failure surface almosttouches the stiff soil. The same failure surface is developed using GeoSlope.
By using geofoam in the cross section, failure zones extend to surround the foam blocks. Thesurface is no more circular. In this case, the limiting equilibrium method does not predict the correctfactor of safety automatically. One have to assume a certain slip surface and calculate its correspondingfactor of safety and repeat that a number of times to reach the minimum value of factor of safety whichmay not be ever reached by this method It was found from FLAC results that the factor of safetyincreases by using geofoam. And it was found that failure zones surround the amount of foam as shownin figure 4-7. If the cohesive soil has a considerable amount of friction, i.e. has a high internal frictionangle, then by increasing the amount of foam the failure surface will continue to form in such a way thatit will surround the foam. The failure surface beyond a certain factor of safety will begin to form in thearea between the foam and the slope edge. Any increase in the amount or any change in the shape of thecross section of the foam fill will never increase the factor of safety.
Figure 0�6 Shear Strain Contours in a Cohesive Soil Slope
4
file:///T|/Test Reports/Slope Stabilization Using Geofoam at Route 23A (AE)/ch4.html (7 of 63) [9/6/2000 2:57:58 PM]

Figure 0�7 Shear Strain Contours in Geofoam-Stabilized a Cohesive Soil Slope
4.4.3 Increasing The Factor of Safety
One way to increase the factor of safety of a slope is to decrease the inclination of the slope. This mayresult in the reduction of the usable space. Geofoam stabilization may maintain the inclination of theslope and increase the factor of safety. In fact, the slope can still be steep with a high factor of safety atthe same time as shown in figure 4-8. The more the amount of foam that is added, the larger the failurearea become resulting in a higher factor of safety. The distribution of a certain amount of foam will affectthe factor of safety as shown in figure 4-9. The closer is the shape of the foam fill to the slip surfaceshape the higher is the factor of safety. This holds good as long as the foam does not encroach upon thearea of the stabilizing force.
4
file:///T|/Test Reports/Slope Stabilization Using Geofoam at Route 23A (AE)/ch4.html (8 of 63) [9/6/2000 2:57:58 PM]

Figure 0�8 Effect of Geofoam Width on the Factor of Safety for Different Slopes
Figure 0�9 Effect of Geofoam Width on the Factor of Safety for Different Geofoam Configurations
4
file:///T|/Test Reports/Slope Stabilization Using Geofoam at Route 23A (AE)/ch4.html (9 of 63) [9/6/2000 2:57:58 PM]

Figures 4-10 & 4-11 show the variation of the factor of safety for both static and dynamic conditions,with the width and the depth of the foam fill. The purpose of showing the figures is to represent thebenefit of using geofoam to increase the factor of safety.
Figure 0�10 Effect of foam Width on the Factor of Safety for Different Thickness
4
file:///T|/Test Reports/Slope Stabilization Using Geofoam at Route 23A (AE)/ch4.html (10 of 63) [9/6/2000 2:57:58 PM]

Figure 0�11 Effect of Using Geofoam on the Factor of Safety for Different Horizontal Accelerations
4.5 Route 23A
4
file:///T|/Test Reports/Slope Stabilization Using Geofoam at Route 23A (AE)/ch4.html (11 of 63) [9/6/2000 2:57:58 PM]

4.5.1 Background
Geofoam is used in an unstable 100m long on route 23A east of the Village of Jewett Center in the Townof Jewett in Greene County (Jutkofsky, 1998). In 1966 in order to meet the current safety requirementsand future traffic needs the New York State Department of Public Works reconstructed Rte 23A betweenthe Village of Hunter and Jewett Center in Green County. Shortly after the reconstruction, a 100-m-longsection of the roadway embankment began moving laterally towards the creek, as shown figure 4-12. Ascarp showed up on the north side of the cross section as shown in photo 4-1. By frequent patching anormal grade was maintained through the following years. Although the average annual movement wasless than 0.025 m it was a traffic hazard and maintenance costing.
In 1978, a subsurface exploration program began. The general subsurface profile up to a maximumexplored depth of 21 m, consist of compact gravelly silt (clayey); over layered clayey silt (silty clay);underlain by clayey silt gravelly. Ground water was found at 1.5 to 5m below surface. In 1979, a clusterof 22 horizontal drains was installed in a fan-shaped pattern along the toe of the slope in an attempt toreduce the movement by lowering the water table. At the same time, a monitoring program began.Inclinometer A, shown in figure 4-12, was installed near the center of the failure area to determine thezone and the rate of movement. Inclinometer reading was taken for the following 14 years.
Photo 0�1 Main Crack Before 1996
4
file:///T|/Test Reports/Slope Stabilization Using Geofoam at Route 23A (AE)/ch4.html (12 of 63) [9/6/2000 2:57:59 PM]

Figure 0�12 Positions of the Slope Indicators
As the results of the inclinometer showed progressive movement, the horizontal drain treatment wasconsidered unsuccessful. That was partly due to the nature of clayey soils and also their low strength. In1994, a permanent treatment was pursued. The weight reduction by using EPS geofoam to reduce thedriving force and using a sand filter to provide a positive drainage with lowering the water table tostrengthen the soil was chosen as a solution as shown in figure 4-13. This could be accomplished withfast reconstruction, without property- taking from the adjoining homeowners and maintaining the samegeometry of the slope.
A 15m long sheeting was required to handle two construction problems; retaining surrounding soilsduring excavation and functioning as a safety barrier for the detour traffic while construction. Theexcavation level was chosen to be the 100-year flood level to prevent of the uplifting of the geofoam.That made the excavated depth equal to 5m. A typical cross section in figure 4-13 shows 0.6m crushedstone - filter below the 5 layers of foam. Besides functioning as a drainage blanket the horizontal sandlayer established a clean stabilized working platform over the soft saturated soils. 0.6m crushed stoneacts as a filter extended between the foam blocks and the sheeting as shown in figure 4-2. The mainpurpose of this arrangement was to lower the water table to the bottom drainage layer. The vertical layerfunctioned as a protection to the foam from damage as the sheeting was extracted, it filled the voidswhen the sheeting was vibrated out.
4
file:///T|/Test Reports/Slope Stabilization Using Geofoam at Route 23A (AE)/ch4.html (13 of 63) [9/6/2000 2:57:59 PM]

Figure 0�13 Typical Cross Section in Route 23a
Photo 0�2 The crushed stone filter
4
file:///T|/Test Reports/Slope Stabilization Using Geofoam at Route 23A (AE)/ch4.html (14 of 63) [9/6/2000 2:57:59 PM]

Photo 0�3 Pouring the concrete slab
Photo 0�4Backfilling over the foam side
4
file:///T|/Test Reports/Slope Stabilization Using Geofoam at Route 23A (AE)/ch4.html (15 of 63) [9/6/2000 2:57:59 PM]

The foam was type VIII Expanded Polystyrene with nominal density of 20 kg/m3. The blocks were 0.6mX 1.2m X 2.4m. The minimum shear strength of such Type was between 159kpa (ASTM D732). Theminimum compressive strength at 10% deformation according to ASTM D1621 was 90 kg/m3. A 0.1 mconcrete slab was placed on the top of the 3m height foam blocks to serve as a protection from petroleumspilling and to distribute the traffic load on the foam.
In August 1995 inclinometer B, shown in figure 4-13, was installed. In October sheeting driving began.Excavation started after about 70 percent of the sheeting was instaled. On November 20 the foam blockswere placed. Backfilling began after several geofoam courses were placed. Earth fill was placed over thestepped face of the block mass. This operation continued as geofoam courses were added up to the finishgrade. Only the earth fill was compacted.
By December 1 1995, the first half of the blocks was in place and ready to receive the concrete slab asshown in photo 4-3. The graded sub base crushed stone was placed after concrete curing and completingbackfilling as shown in photo 4-4. The sheeting was completely removed in January 1996. Placing of0.23 m asphalt pavement was completed in April 1996. The total thickness of the base and the sub baseranged from to 0.6m to 1.2m because of the road banked and inclined geometry. Figure 4-14 shows theconstruction sequence.
Figure 0�14 Construction Time Line
4
file:///T|/Test Reports/Slope Stabilization Using Geofoam at Route 23A (AE)/ch4.html (16 of 63) [9/6/2000 2:57:59 PM]

4.5.2 Field Results
Figures 4-15 through 4-26 show the results obtained from inclinometer A. The inclinometer gives thedisplacement in two directions, the main direction and the secondary direction. The main direction is theNorth/South direction as shown in figure 4-12. The secondary direction is the East/West direction, whichis the direction out of plane of figure 4-12. The total displacement is calculated by taking the square rootof sum of squares of the displacement in the main and secondary directions. The angle that the totaldirection makes with the North/South direction is 6 degrees based on the maximum North/Southdisplacement and its correspondence in the East/West direction. The results were obtained for a 20.72mdepth each 0.6m from the top surface, elevation 439.83, all the way down to elevation 419.09m. Theresults were obtained from September 4th 1979 up to October 7th 1993. It must be kept in mind theinvolved maintenance that occurred in the roadway cross-section and the change in the water table levelas well as the creek level during this fourteen years period. The twelve figures show that there is amovement but of a slow rate. An overall failure did not occur. The factor of safety can be considered tobe 1.0 or slightly less.
Figure 4-15 is the North/South direction creep. The movement for zone between Elevation 419.09m and428.85m can be considered zero with no creep effect. Up to 0.6m above this zone, i.e. between elevations428.85m and 429.46m, displacement increases with time. The top zone between elevations 429.46m andelevation 439.8m has the same trend of increasing displacement. Thus a slip surface can be consideredpassing between the two zones and at elevation 429.46 at inclinometer a position. A number ofexplanations can be given for the displacement values for the last point. For example, it could be due tothe effect of a sudden drop in the water level or an error in the reference level. Figure 4-16 shows theEast/West direction creep. The displacement values are generally a tenth of those in the North/Southdirection. Two zones appear in this figure. Below elevation 428.85m, the soil has less creep. Above thiszone, the displacements are almost equal for all monitored elevations with more creep effect. The lasttwo readings show different trends from the previous readings and again, this could be due to the error inthe reference level or a sudden change in the applied load such as change in the water table.
4
file:///T|/Test Reports/Slope Stabilization Using Geofoam at Route 23A (AE)/ch4.html (17 of 63) [9/6/2000 2:57:59 PM]
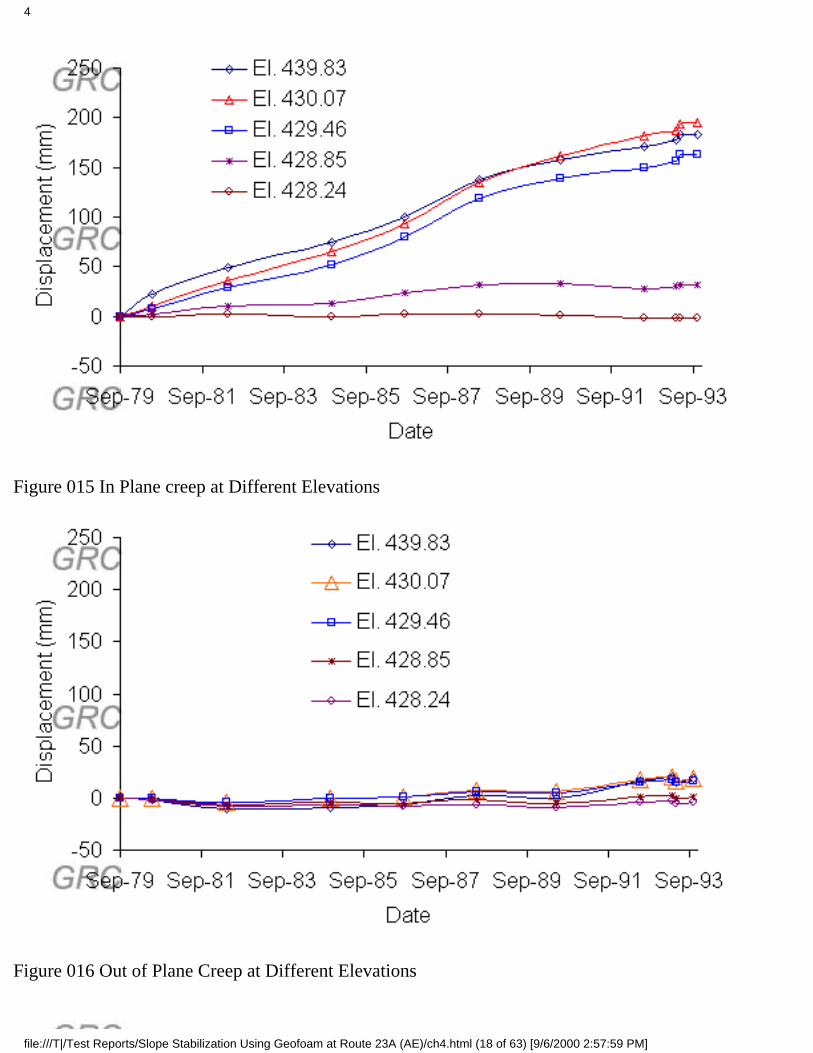
Figure 0�15 In Plane creep at Different Elevations
Figure 0�16 Out of Plane Creep at Different Elevations
4
file:///T|/Test Reports/Slope Stabilization Using Geofoam at Route 23A (AE)/ch4.html (18 of 63) [9/6/2000 2:57:59 PM]

Total creep measured by inclinometer A is shown in figure 4-17. The maximum displacement isequal to 0.2m, which is equal to what was measured in the North/South direction. By comparing figure4-17 with figure 4-15 we can say that the effect of the out of plane movement can be neglected.
Figures 4-18, 4-19 and 4-20 show the vertical distribution of the horizontal displacement on threedifferent instants in the 14-year period. Figure 4-18 is for the North/South direction, figure 4-19 is for theEast/West Direction and figure 4-20 is the resultant. The displacement was initially zero in 1979. For thethree figures, it can be seen that the movement below elevation 428.85m is negligible. A sudden increasestarted at elevation 429.46m.
Figure 0�17 Total Creep at Different Elevations
4
file:///T|/Test Reports/Slope Stabilization Using Geofoam at Route 23A (AE)/ch4.html (19 of 63) [9/6/2000 2:57:59 PM]

Figure 0�18 In Plane Movement in 14 Years
4
file:///T|/Test Reports/Slope Stabilization Using Geofoam at Route 23A (AE)/ch4.html (20 of 63) [9/6/2000 2:57:59 PM]

Figure 0�19 Out of Plane Movement in 14 Years
Figure 0�20 Total Movement in 14 Years
Movements above elevation 429.46m are almost equal. Movements in the East/West Direction are atenth of that in the North/South Direction. Results at three instants were presented in these figures. Forthe East/West, movement was towards the east up to April 1982 and after that it moved towards the west.The maximum movement was less than 2 cm. Movements in the North/South direction was towards thesouth throughout the 14 years (i.e. towards the creek).
Figures 4-21, 4-22 and 4-23 represent the displacement rate with time for the North/South, theEast/West and the resultant directions respectively. The values in East/West direction are one half that inthe North/South Direction. There was an increase in the displacement rate from 1997 to 1986 when apeak of 0.022 m/year was reached. Between 1986 and 1992, there was a reduction in the creep rate.
4
file:///T|/Test Reports/Slope Stabilization Using Geofoam at Route 23A (AE)/ch4.html (21 of 63) [9/6/2000 2:57:59 PM]

Figure 0�21 In Plane Displacement Rate at Different Elevations
Figure 0�22 Out of Plane Displacement Rate at Different Elevations
4
file:///T|/Test Reports/Slope Stabilization Using Geofoam at Route 23A (AE)/ch4.html (22 of 63) [9/6/2000 2:57:59 PM]

Figure 0�23 Total Displacement Rate at Different Elevations
After 1992, the results gave a large increase in the displacement rate where the rest of the results in thisyear are not plotted. As mentioned before, this is an indication that the factor of safety is equal to orslightly less than 1.0, as in this case any small changes in the applied loads can jump the situation fromstable to unstable equilibrium or vise versa.
Figures 4-24, 4-25 and 4-26 show the increment strain distribution over a 20m height for theNorth/South, East/West and the resultant directions. The increment strain distribution is for the periodbetween 1979 and 1993. For the three directions, there are large strains in the 2.44m thick zone betweenelevations 428.24m and 430.68m. Both the total and the North/South strain increment exceeded a 20%strain value. The east/West direction reached only a 3.5%strain increment. Strain values were calculatedby dividing the difference in displacement at the ends of the 0.6m deep intervals by the thickness. Thepeak strain for the three directions is at elevation 429.46.
4
file:///T|/Test Reports/Slope Stabilization Using Geofoam at Route 23A (AE)/ch4.html (23 of 63) [9/6/2000 2:57:59 PM]

Figure 0�24 In Plane Shear Strain in 14 Years
Figure 0�25 Out of Plane Shear Strain in 14 Years
4
file:///T|/Test Reports/Slope Stabilization Using Geofoam at Route 23A (AE)/ch4.html (24 of 63) [9/6/2000 2:57:59 PM]

Figure 0�26 Total Strain in 14 Years
Results obtained from inclinometer B are shown in figures 4-27 to 4-38. The results were for the periodfrom August 1995 to June 1999. Parts of the results were obtained during the construction period, August1995 to April 1996.
Figures 4-27, 4-28 and 4-29 show the creep behavior for the three directions the North/South, theEast/West and the resultant respectively. The results were shown for different elevations. For all threedirections, the displacement increase from zero to a certain level until construction is done after whichthere was no increase in the displacement values. Both the North/South and the East/West directionsshow comparable displacement values. The North/South direction reached a value of 8cm while theEast/West reached 7cm displacement during construction.
4
file:///T|/Test Reports/Slope Stabilization Using Geofoam at Route 23A (AE)/ch4.html (25 of 63) [9/6/2000 2:57:59 PM]

Figure 0�27 In Plane Creep at Different Elevations after 1995
Figure 0�28 Out of Plane Creep at Different Elevation Before 1995
4
file:///T|/Test Reports/Slope Stabilization Using Geofoam at Route 23A (AE)/ch4.html (26 of 63) [9/6/2000 2:57:59 PM]

Figure 0�29 Total Creep at Different Elevations Before 1995
Figures 4-30, 4-31 and 4-32 represent the movement distribution all over the 12m depth from the surfacefor the North/South, the East/West and the resultant direction respectively. Three dates are shown in thisfigure; November 1995 was during construction, August 1996 was when the first readings were availableafter construction and the third date is one for which the most recent reading is available. Three zonescan be determined in these figures; the first zone is below elevation 426.1m, the second zone is betweenelevations 426.1m and 429.1m and the third zone is above elevation 429.1m. No movement showed up inthe lower zone for the 4-year period during and after construction. The top zone has uniform movementall over the height of the zone during and after construction. The movement in the top zone is occurredduring the construction period and none showed up after construction. The middle zone has linearmovement distribution all over the zone height. It acts as a transition zone between the two other zones.All the movement in this zone occurred during construction.
4
file:///T|/Test Reports/Slope Stabilization Using Geofoam at Route 23A (AE)/ch4.html (27 of 63) [9/6/2000 2:57:59 PM]

Figure 0�30 In Plane Movement after 1995
Figure 0�31 Out of Plane Movement after 1995
4
file:///T|/Test Reports/Slope Stabilization Using Geofoam at Route 23A (AE)/ch4.html (28 of 63) [9/6/2000 2:57:59 PM]

Figure 0�32 Total Movement after 1995
Figures 4-33, 4-34, and 4-35 show the displacement rate for the North/South, East/West and the resultantdirections respectively. After the construction is done in April 1996, the displacement rate is equal tozero for the three directions. During construction a displacement rate of 2mm per day was reached in theNorth/South direction and 1.4mm/day in the East/West direction. The peak for both directions did notoccur at the same time. The Displacement rate was calculated by dividing the difference in twosuccessive dates by the duration between them and was plotted at the initial date. So the zero values ofthe displacement rate can be extended to June 1999 in the three figures.
4
file:///T|/Test Reports/Slope Stabilization Using Geofoam at Route 23A (AE)/ch4.html (29 of 63) [9/6/2000 2:57:59 PM]

Figure 0�33 In Plane Displacement Rate at Different Elevations after 1995
Figure 0�34 Out of Plane Displacement Rate at Different Elevations after 1995
4
file:///T|/Test Reports/Slope Stabilization Using Geofoam at Route 23A (AE)/ch4.html (30 of 63) [9/6/2000 2:57:59 PM]

Figure 0�35 Total Displacement Rate at Different Elevations after 1995
Figures 4-36, 4-37 and 4-38 represent the strain distribution obtained from inclinometer B in theNorth/South, the East/West and the resultant direction respectively. The results are for a 4 years period.Three dates were presented in these figures during construction and just after construction and threeyears after construction. A maximum strain of 3.8% was obtained in the North/South direction. Thisamount was obtained during construction, from August 1996 to June 1999.
Figures 4-39 through 4-50 show the same results for figures 4-27 through 4-38 with the results for theperiod after April 1996, i.e. after the construction is ended. Figure 4-51 shows the Creep trend over 20years.
4
file:///T|/Test Reports/Slope Stabilization Using Geofoam at Route 23A (AE)/ch4.html (31 of 63) [9/6/2000 2:57:59 PM]

Figure 0�36 In Plane Strain at Different Elevations after 1995
4
file:///T|/Test Reports/Slope Stabilization Using Geofoam at Route 23A (AE)/ch4.html (32 of 63) [9/6/2000 2:57:59 PM]

Figure 0�37 Out of Plane Strain at Different Elevations after 1995
Figure 0�38 Total Strain at Different Elevations after 1995
4
file:///T|/Test Reports/Slope Stabilization Using Geofoam at Route 23A (AE)/ch4.html (33 of 63) [9/6/2000 2:57:59 PM]

Figure 0�39 In Plane Creep after Construction
Figure 0�40 Out of Plane Creep after Construction
4
file:///T|/Test Reports/Slope Stabilization Using Geofoam at Route 23A (AE)/ch4.html (34 of 63) [9/6/2000 2:57:59 PM]

Figure 0�41 Total Creep after Construction
4
file:///T|/Test Reports/Slope Stabilization Using Geofoam at Route 23A (AE)/ch4.html (35 of 63) [9/6/2000 2:57:59 PM]

Figure 0�42 In Plane Displacement after Construction
Figure 0�43 Out of Plane Displacement after Construction
4
file:///T|/Test Reports/Slope Stabilization Using Geofoam at Route 23A (AE)/ch4.html (36 of 63) [9/6/2000 2:57:59 PM]

Figure 0�44 Total Displacement after Construction
Figure 0�45 In Plane Displacement Rate after Construction
4
file:///T|/Test Reports/Slope Stabilization Using Geofoam at Route 23A (AE)/ch4.html (37 of 63) [9/6/2000 2:57:59 PM]

Figure 0�46 Out of Plane Displacement Rate after Construction
Figure 0�47 Total Displacement Rate after Construction
4
file:///T|/Test Reports/Slope Stabilization Using Geofoam at Route 23A (AE)/ch4.html (38 of 63) [9/6/2000 2:57:59 PM]

Figure 0�48 In Plane Strain after Construction
4
file:///T|/Test Reports/Slope Stabilization Using Geofoam at Route 23A (AE)/ch4.html (39 of 63) [9/6/2000 2:57:59 PM]

Figure 0�49 Out of Plane Strain after Construction
Figure 0�50 Total Strain after Construction
4
file:///T|/Test Reports/Slope Stabilization Using Geofoam at Route 23A (AE)/ch4.html (40 of 63) [9/6/2000 2:57:59 PM]

Figure 0�51 Creep Trend Before and after utilizing Geofoam
Four Extensometers were installed between geofoam layers to detect and measure any movements of theblocks and between the blocks as shown in figure 4-38. Extensometers A and B were located between thevertical stone drainage gallery and the blocks. Extensometers C and D were located within the Blocks.Figure 4-39 shows the results of Extensometer B and D. Movement occurred during the constructionperiod. Extensometer B moved about 6 cm towards the Greek while Extensometer D moved 2.5 cm only.The movement is believed to be the closing of the gaps between the blocks. The difference in the valuecan be explained to be due to the position of the Extensometer within the geofoam mass. More gaps arerequired to be closed for the case of Extensometer B. After Construction no movement was measured byboth Extensometers. Extensometers A and C measured zero movement.
4
file:///T|/Test Reports/Slope Stabilization Using Geofoam at Route 23A (AE)/ch4.html (41 of 63) [9/6/2000 2:57:59 PM]

Figure 0�52 Positions of the Extensometers
Figure 0�53 Extensometers B & D Readings
4
file:///T|/Test Reports/Slope Stabilization Using Geofoam at Route 23A (AE)/ch4.html (42 of 63) [9/6/2000 2:57:59 PM]

4.5.3 Numerical Analysis
Rt23a Geofoam stabilized cross-section is numerically modeled. A finite difference mesh is shown infigure 4-54. The problem is simulated as an in plane problem. The dimensions of the cross-section arechosen such that the boundaries are away from the stressed zones. A plastic model, Coulomb-Mohr isused to simulate the soil. The model can be represented using the shear modulus, the bulk modulus, thefriction angle, the cohesion and the density of the soil. After applying the loads and the boundaryconditions, the numerical analysis software is run in a large strain mode. Large strain mode will adjustthe dimensions of the mesh after each solution step to take account of the deformations that will occur.Although failure and large deformations may occur, the solution will continue until either equilibriumoccurs with a new grid dimensions or the ratio of any rectangular element reaches a ratio of 10. In thelater case the solution will stop running. The problem can be solved in a small strain mode. In the smallstrain mode the dimensions of the grid will not change during stepping. In the case of no failure,implying very small movements, convergence will occur. The solution will stop if there are largedeformations in the dimensions of the elements. Large strain mode can converge even after deformationsof the order of 10 meters. Figure 4-55 shows the grid distortion for the cross-section before 1996 as wellas the boundary of the cross section before starting the solution. The grid is magnified 60 times. Themaximum displacement is 8 cm. This is a static equilibrium situation. No creep effect is encountered inthis solution. Slightly reducing the strength the displacement will be in the order of meters and may notconverge. That means the factor of safety equals one for the situation before 1996. The failure surfacecan be figured from figure 4-55 by tracing the skew rectangle elements where excessive shear straintakes place. Small deformation can be seen in the first three rows where the soil in these rows is stifferthan the upper rows. The upper line of the exaggerated grid profile shows settlement in the road area aswell as high deformation in the north side of the road where the scarp occurred.
4
file:///T|/Test Reports/Slope Stabilization Using Geofoam at Route 23A (AE)/ch4.html (43 of 63) [9/6/2000 2:57:59 PM]

Figure 0�54 The Finite Difference Grid
Displacement vectors are shown in figure 4-56. The directions of the arrows represent the direction of themovement. The movements are due to two reasons; the own weight and the effect of the sloped edge.Only vertical movements occurred near the north vertical boundary implying that the boundary was farenough from the zone of the slope effect. On the other side very small diagonal arrow shows up on thesouth vertical boundary. Although moving that boundary few meters to the south will increase theaccuracy of the results the current solution gives good results with reasonable solution time. The failuresurface can be determined by the large change in the length of the two adjacent arrows.
4
file:///T|/Test Reports/Slope Stabilization Using Geofoam at Route 23A (AE)/ch4.html (44 of 63) [9/6/2000 2:57:59 PM]

Figure 0�55 Exaggerated Grid Distortion before 1996
4
file:///T|/Test Reports/Slope Stabilization Using Geofoam at Route 23A (AE)/ch4.html (45 of 63) [9/6/2000 2:57:59 PM]

Figure 0�56 Displacement Vectors before 1996
Three zones are shown in figure 4-57. The zone with small circles has tension failure. The zone with themark (*) is a shear failure zone. No failure occurred in the rest of the cross section. A scarp occurrednorth of the road in the tension failure zone. The failure surface will pass through the tension and shearfailure zones and as can be seen from the flattered shear failure zone next to the lower stiff layer, it willnot be a circular surface.
Figure 4-58 shows the shear strain distribution before 1996. The values are due to static equilibrium,which means that no creep effect is taken into consideration. Comparing this figure with figure 4-23, itcan be seen that at horizontal distance equals to 26m where inclinometer A is located, maximum strainoccurs at elevation 429.5m for both figures. Again, the difference in values is equal to that due to thecreep effect. The maximum shear strain in the cross section occurs at distance 42m and is too close to thestiffer lower layers. An inclinometer may give very high readings if installed in this location. The failuresurface can be located by passing a line through the points of highest strain at each vertical section.
Figure 4-59 shows the horizontal displacement contours. The failure surface can be easily identified bythe contour B, the first nonzero contour. Again, it is not a circular surface, and the creep effect is notincluded in these results. Comparing the in plane horizontal distribution in figure 4-17 with a verticalsection at horizontal distance 26m, the position of inclinometer A, one can find that both distributionsstart with a zero value and continue up to 427m-428 m. A rapid increase of the horizontal displacementwith height occurs in the upper 3 meters. The horizontal displacement does not change mush above anelevation of 431m.
The vertical displacement contours are shown in figure 4-60. The movement is the result of the ownweight and the slope effect. The maximum settlement will occur beneath the road. Before 1996, it wasessential to repave the settled portion of the road to maintain leveled driving surface from time to time.Creep effect was the main reason of this progressive settlement. The vertical parts of the contours showthat a horizontal section through this portion of the cross-section will have a sloped vertical movementwhere the maximum value will be on the north side. As the soil is not compressible, this can only occurby allowing lateral movement towards the creek. Two material models are used for the case after 1996 asshown in figure 4-61. Elastic model is used for foam. Young’s Modulus, Poisson’s ratio and the densityare the parameters used in the elastic model. Coulomb-Mohr is used for soil. No interface elementsbetween the geofoam blocks and the soil or between the foam blocks are modeled in this solution. Fromthe results that are shown later, shear stresses are too low to reduce slippage.
To reach the case after 1996 cross-section, construction sequence is modeled in this solution. Afterreaching equilibrium using the soil cross-section, the sheet pile is added to the model, excavation is doneand the drainage filter, foam blocks and back filling are placed finally followed by removal of sheet pile.In each construction step, the solution has to reach equilibrium before proceeding to the following step.
4
file:///T|/Test Reports/Slope Stabilization Using Geofoam at Route 23A (AE)/ch4.html (46 of 63) [9/6/2000 2:57:59 PM]

Figure 4-62 shows the displacement vectors after excavation. A lateral movement of 0.6m of the sheetpile was reported. It was noticed that several inches of settlement occurred behind the sheet pile as soilwas removed. In the FLAC model, 0.2m settlement occurred just after excavation. The exact value fromthe field is not known as they paved the road behind the sheet pile to maintain safe driving environment.
After removing the sheet pile in the FLAC model, the solution was allowed to reach convergence tostudy the geofoam-stabilized slope. Figure 4-63 shows the shear strain distribution in the cross section.The maximum value reached is 0.1% compared to the 0.2% reached in figure 4-35. In both figures, theshear strain can be considered zero. Inclinometer B can be located at a distance of 35.5 m from the edgeof the model.
Figure 0�57 Failure Zones before 1996
4
file:///T|/Test Reports/Slope Stabilization Using Geofoam at Route 23A (AE)/ch4.html (47 of 63) [9/6/2000 2:57:59 PM]

Figure 0�58 Shear Strain Contours Before 1996
Figure 0�59 Horizontal Displacement Contours Before 1996
4
file:///T|/Test Reports/Slope Stabilization Using Geofoam at Route 23A (AE)/ch4.html (48 of 63) [9/6/2000 2:57:59 PM]
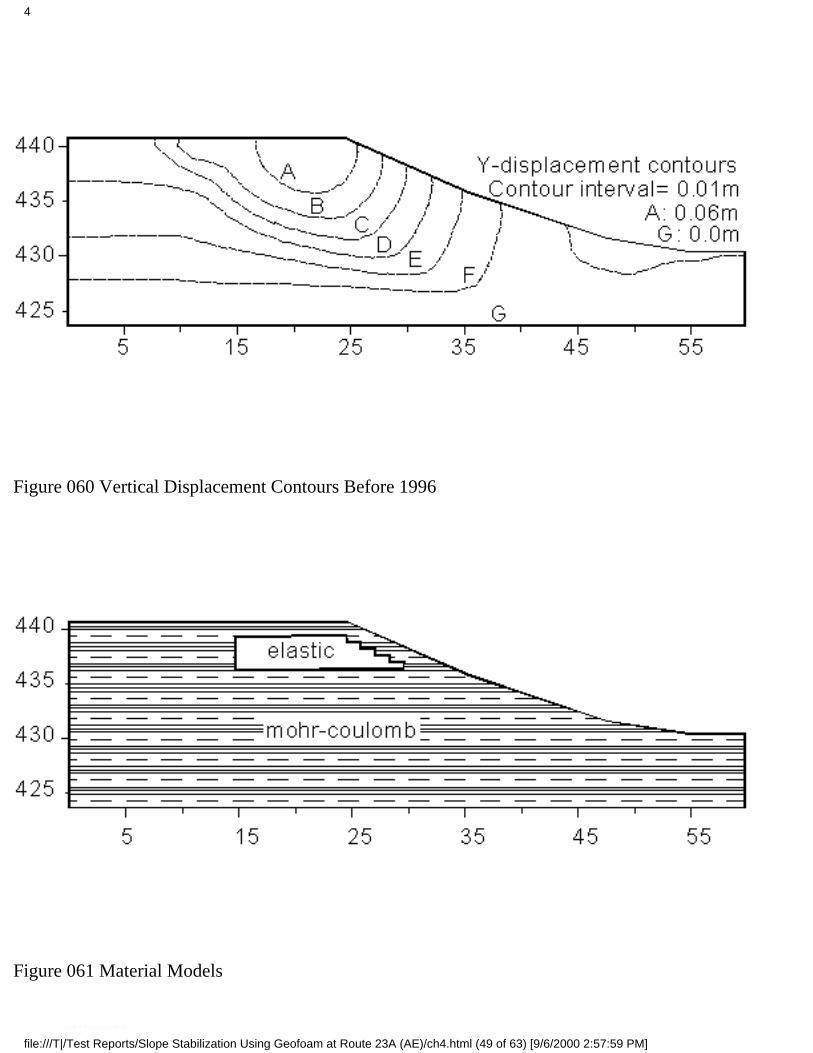
Figure 0�60 Vertical Displacement Contours Before 1996
Figure 0�61 Material Models
4
file:///T|/Test Reports/Slope Stabilization Using Geofoam at Route 23A (AE)/ch4.html (49 of 63) [9/6/2000 2:57:59 PM]

Figure 0�62 Displacement Vectors after Excavation
Figure 0�63 Shear Strain Contours after 1996
4
file:///T|/Test Reports/Slope Stabilization Using Geofoam at Route 23A (AE)/ch4.html (50 of 63) [9/6/2000 2:57:59 PM]

Figure 4-64 shows the horizontal displacement contours after 1996. The maximum value of horizontaldisplacement is 0.5 cm. Figure 4-35 gives the same results all over the body of the inclinometer with thepeak at its top. The horizontal movement in the numerical model shows up near the sloped surface.
Figure 4-65 shows the vertical displacement contours after 1996. The maximum value is 1.8 cm. Thesettlement is due to the elasticity of both the soil and the Foam. The main load for this settlement is thefill on the top of the foam as the own weight of the foam is negligible.
Ground water is considered in the numerical solution. FLAC calculates the pore pressure. Figure 4-66shows the pore pressure contours before 1996. The Drain blanket changes the water table level as shownin figure 4-67 and new pore pressure contour is calculated.
Figure 0�64 Horizontal Displacement Contours after 1996
4
file:///T|/Test Reports/Slope Stabilization Using Geofoam at Route 23A (AE)/ch4.html (51 of 63) [9/6/2000 2:57:59 PM]

Figure 0�65 Vertical Displacement Contours after 1996
Figure 0�66 Pore Pressure Contours Before 1996
4
file:///T|/Test Reports/Slope Stabilization Using Geofoam at Route 23A (AE)/ch4.html (52 of 63) [9/6/2000 2:57:59 PM]

Figure 0�67 Pore Pressure Contours after 1996
Figures 4-68 through 4-71 show the stresses in three directions: vertical direction, in plane horizontaldirection and out-of-plane direction. All stresses are shown for the two cases (total stresses and effectivestresses). In-plane shear stress is also shown. The figures are shown for the two cases before and after1996.
The total horizontal in plane stresses in the foam zone is reduced after 1996 as shown in figure 4-68compared to figure 4-69. For the same zone, the effective stresses are the same (figures 4-70 and 4-71).
The total Vertical stresses in the foam zone and below it is reduced after 1996 as shown in figure 4-72compared to figure 4-73. This is due to the effect of the lightweight fill. In front and on the back of thefoam blocks the stresses are the same before and after 1996. The same distribution can be observed infigures 4-74 and 4-75 but with reduction in the stresses because of the effect of the pore water pressure.
The total and the effective shear stress contours are identical, as Mohr circle at each point will have thesame radius for both cases. Figure 4-76 shows the in plane shear stress for the case before 1996. Themaximum value reached for the zone between the weak and the stiffer soil is 35 kPa. For the case after
4
file:///T|/Test Reports/Slope Stabilization Using Geofoam at Route 23A (AE)/ch4.html (53 of 63) [9/6/2000 2:57:59 PM]

1996 the same spot has a 30 kPa stress as shown in figure 4-77. The factor of safety of the slope will be35/30. 1.17 as a factor of safety would have been increased by redistribution of the same foam amount inthe cross section as mentioned earlier. The out of plane stresses behaved like the in plane horizontalstresses. As shown in figures 4-78 and 4-79 the total stresses are less before 1996 for the geofoam zone.For the same zone, the effective stresses are a little less before 1996 (figures 4-80 and 4-81).
Figure 0�68 Horizontal Stress Contours Before 1996
4
file:///T|/Test Reports/Slope Stabilization Using Geofoam at Route 23A (AE)/ch4.html (54 of 63) [9/6/2000 2:57:59 PM]

Figure 0�69 Horizontal Stress Contours after 1996
4
file:///T|/Test Reports/Slope Stabilization Using Geofoam at Route 23A (AE)/ch4.html (55 of 63) [9/6/2000 2:57:59 PM]

Figure 0�70 Effective Horizontal Pressure Contours before 1996
Figure 0�71 Effective Horizontal Stress after 1996
4
file:///T|/Test Reports/Slope Stabilization Using Geofoam at Route 23A (AE)/ch4.html (56 of 63) [9/6/2000 2:57:59 PM]

Figure 0�72 Vertical Stress Contours before 1996
Figure 0�73 Vertical Stress Contours after 1996
4
file:///T|/Test Reports/Slope Stabilization Using Geofoam at Route 23A (AE)/ch4.html (57 of 63) [9/6/2000 2:57:59 PM]

Figure 0�74 Effective Vertical Stress Contours before 1996
Figure 0�75 Effective Vertical Stress Contours after 1996
4
file:///T|/Test Reports/Slope Stabilization Using Geofoam at Route 23A (AE)/ch4.html (58 of 63) [9/6/2000 2:57:59 PM]

Figure 0�76 Shear Stress Contours before 1996
Figure 0�77 Shear Stress Contours after 1996
4
file:///T|/Test Reports/Slope Stabilization Using Geofoam at Route 23A (AE)/ch4.html (59 of 63) [9/6/2000 2:57:59 PM]

Figure 0�78 Out of Plane Stress Contours before 1996
Figure 0�79 Out of Plane Stress Contours after 1996
4
file:///T|/Test Reports/Slope Stabilization Using Geofoam at Route 23A (AE)/ch4.html (60 of 63) [9/6/2000 2:57:59 PM]

Figure 0�80 Out of Plane Effective Stress Contours before 1996
Figure 0�81 Out of Plane Effective Stress Contours after 1996
4
file:///T|/Test Reports/Slope Stabilization Using Geofoam at Route 23A (AE)/ch4.html (61 of 63) [9/6/2000 2:57:59 PM]
4.6 Summary· The factor of safety of slopes can be increased using geofoam stabilization for both static anddynamic conditions.
· A number of parameters including the amount and the distribution of foam blocks, soilcharacteristics, geometry of slope affect the factor of safety of a geofoam stabilized slope.
· The effect of amount and distribution of foam on the factor of safety are controlled by the type ofsoil.
· Using geofoam blocks in cohesionless soil slopes, where shallow failure surface occurs, will notaffect the factor of safety at all.
· Both the finite difference analysis and the limiting equilibrium analysis give the same factor ofsafety and the same failure surface for general type of soil slopes having circular slip surfaces with aswell as without foam.
· Software simulation results match with those given by Taylor charts for circular slip surface whenfoam is not used.
· Modeling geofoam blocks as cohesive soil with a very high cohesion value using the limitingequilibrium analysis is same as modeling geofoam blocks as elastic material using finite differenceanalysis.
· For cohesive soil, the failure surface of geofoam-stabilized slopes is deep, either surrounding thewhole amount of foam or forming on the slope side of the foam.
· For geofoam stabilized cohesive soil where failure surface tends to develop only on one side of thefoam, increasing the amount and the distribution of foam will increase the factor of safety of the slopeuntil the slip surface occurs. Any further amount of foam will not increase the factor of safety of theslope.
· For geofoam stabilized cohesive soil slopes in which the failure surface develops on one side of thefoam and ends on the other side of the foam, increasing the amount of foam increases the factor of safetyup to a certain amount. Beyond this point, the slip surface starts to form only on one side of the slope.Any further amount of foam will not increase the factor of safety of the slope.
· For cohesive soil with an amount of friction particles, the failure surface of geofoam-stabilizedslopes is shallow and develops on the slope side of the foam. Any increase in the amount of the foam inthis case does not affect the factor of safety.
· In general, the more the amount of foam, the more the factor of safety as long as the slip surfacedoes not develop on the slope side of the foam.
· For the same amount of foam, the closer is the foam to the slope side the higher is the factor ofsafety, as long as the failure surface does not develop on the foam slope side.
· For the same amount of foam, the closer is the distribution of the foam to the circular shape (i.e.with two inclined edges) the higher is the factor of safety, so long as the failure surface does not develop
4
file:///T|/Test Reports/Slope Stabilization Using Geofoam at Route 23A (AE)/ch4.html (62 of 63) [9/6/2000 2:57:59 PM]

on the slope side of the foam.
· Parameters affecting the factor of safety of geofoam-stabilized slopes under static loading willaffect the factor of safety under dynamic loading.
· Geofoam stabilization leads to a steeper slope whose factor of safety is higher. A steep slope alsoincreases the usable space.
Geofoam Research Center220 Hinds Hall
Syracuse UniversitySyracuse,New York 13244
Copyright© 2000 Geofoam Research Center. All Rights Reserved.
4
file:///T|/Test Reports/Slope Stabilization Using Geofoam at Route 23A (AE)/ch4.html (63 of 63) [9/6/2000 2:57:59 PM]