Embed Size (px)
Citation preview

Slide 4-1Copyright © 2006 Pearson Education, Inc. Publishing as Pearson Addison-Wesley

Copyright © 2006 Pearson Education, Inc. Publishing as Pearson Addison-Wesley
Exponential and Logarithmic Functions
Chapter 4

Copyright © 2006 Pearson Education, Inc. Publishing as Pearson Addison-Wesley
4.1 Inverse Functions
Determine whether a function is one-to-one, and if it is, find a formula for its inverse.
Simplify expressions of the type (f f 1)(x) and (f 1 f)(x).

Slide 4-4Copyright © 2006 Pearson Education, Inc. Publishing as Pearson Addison-Wesley
Inverses
When we go from an output of a function back to its input or inputs, we get an inverse relation. When that relation is a function, we have an inverse function.
Interchanging the first and second coordinates of each ordered pair in a relation produces the inverse relation.
Example: Consider the relation g given by g = {(2, 4), (3, 4), (8, 5). Solution: The inverse of the relation is {(4, 2), (4, 3), (5, 8)}.

Slide 4-5Copyright © 2006 Pearson Education, Inc. Publishing as Pearson Addison-Wesley
Inverse Relation
If a relation is defined by an equation, interchanging the variables produces an equation of the inverse relation.
Example: Find an equation for the inverse of the relation: y = x2 2x.
Solution: We interchange x and y and obtain an equation of the inverse: x = y2 2y.
Graphs of a relation and its inverse are always reflections of each other across the line y = x.

Slide 4-6Copyright © 2006 Pearson Education, Inc. Publishing as Pearson Addison-Wesley
Inverses of Functions
If the inverse of a function f is also a function, it is named f 1 and read “f-inverse.” The negative 1 in f 1 is not an exponent. This does not mean the reciprocal of f. f 1(x) is not equal to .1
( )f x

Slide 4-7Copyright © 2006 Pearson Education, Inc. Publishing as Pearson Addison-Wesley
One-to-One Functions
A function f is one-to-one if different inputs have different outputs.
That is,
if a b
then
f(a) f(b).
A function f is one-to-one if when the outputs are the same, the inputs are the same.
That is,
if f(a) = f(b)
then
a = b.
Slide 4-8Copyright © 2006 Pearson Education, Inc. Publishing as Pearson Addison-Wesley
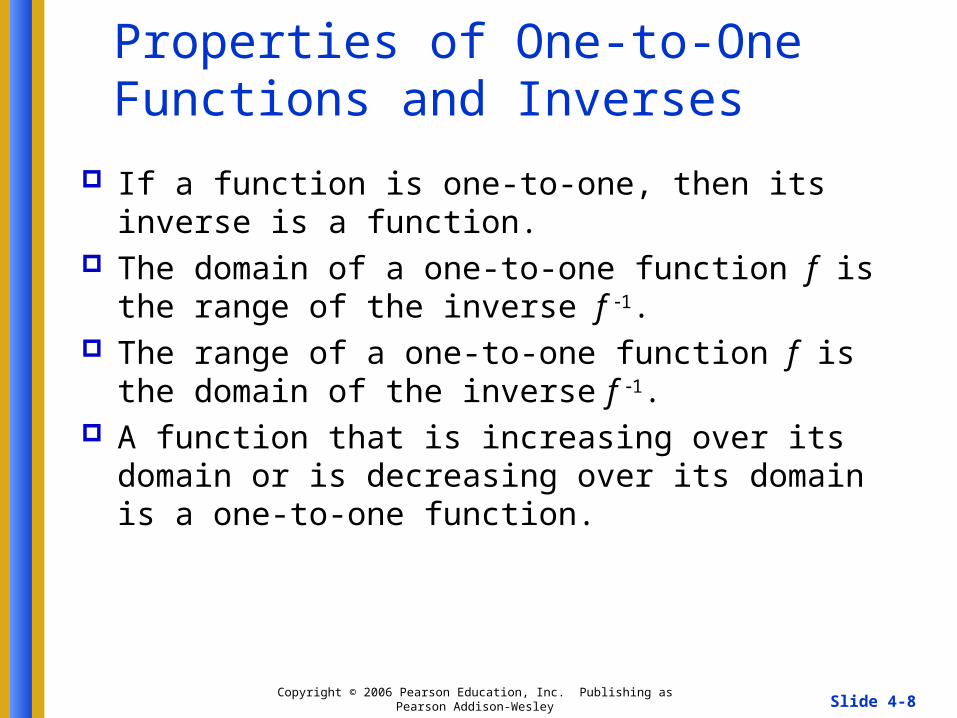
Properties of One-to-One Functions and Inverses
If a function is one-to-one, then its inverse is a function. The domain of a one-to-one function f is the range of
the inverse f 1. The range of a one-to-one function f is the domain of
the inverse f 1. A function that is increasing over its domain or is
decreasing over its domain is a one-to-one function.

Slide 4-9Copyright © 2006 Pearson Education, Inc. Publishing as Pearson Addison-Wesley
Horizontal-Line Test
If it is possible for a horizontal line to intersect the graph of a function more than once, then the function is not one-to-one and its inverse is not a function.

Slide 4-10Copyright © 2006 Pearson Education, Inc. Publishing as Pearson Addison-Wesley
Horizontal-Line Test
Graph f(x) = 3x + 4. Example: From the graph at the left, determine whether the function is one-to-one and thus has an inverse that is a function.
Solution: No horizontal line intersects the graph more than once, so the function is one-to-one. It has an inverse that is a function.
f(x) = 3x + 4

Slide 4-11Copyright © 2006 Pearson Education, Inc. Publishing as Pearson Addison-Wesley
Horizontal-Line Test
Graph f(x) = x2 2. Example: From the graph at the left, determine whether the function is one-to-one and thus has an inverse that is a function.
Solution: There are many horizontal lines that intersect the graph more than once. The inputs 1 and 1 have the same output, 1. Thus the function is not one-to-one. The inverse is not a function.

Slide 4-12Copyright © 2006 Pearson Education, Inc. Publishing as Pearson Addison-Wesley
Obtaining a Formula for an Inverse
If a function f is one-to-one, a formula for its inverse can generally be found as follows: Replace f(x) with y. Interchange x and y. Solve for y. Replace y with f 1(x).

Slide 4-13Copyright © 2006 Pearson Education, Inc. Publishing as Pearson Addison-Wesley
Example
Determine whether the function f(x) = 3x 2 is one-to-one, and if it is, find a formula for f 1(x).
Solution: The graph is that of a line and passes the horizontal-line test. Thus it is one-to-one and its inverse is a function.
1. Replace f(x) with y: y = 3x 2 2. Interchange x and y: x = 3y 2 3. Solve for y: x + 2 = 3y
4. Replace y with f 1(x):
f 1(x) =
2
3
xy
2
3
x

Slide 4-14Copyright © 2006 Pearson Education, Inc. Publishing as Pearson Addison-Wesley
Example
Graph f(x) = 3x 2 and
f 1(x) =
using the same set of axes. Then compare the two graphs.
Solution: The solutions of the inverse function can be found from those of the original function by interchanging the first and second coordinates of each ordered pair. The graph f 1 is a reflection of the graph f across the line y = x.
2
3
x

Slide 4-15Copyright © 2006 Pearson Education, Inc. Publishing as Pearson Addison-Wesley
Solution
73
42
20
51
f(x) = 3x 2x
24
11
02
15
f 1(x)
=
x
+ 2
3
x

Slide 4-16Copyright © 2006 Pearson Education, Inc. Publishing as Pearson Addison-Wesley
Inverse Functions and Composition
If a function f is one-to-one, then f 1 is the unique function such that each of the following holds:
for each x in the domain of f, and
for each x in the domain of f 1.
1 1
1 1
( )( ) ( ( ))
( )( ) ( ( ))
f f x f f x x
f f x f f x x

Slide 4-17Copyright © 2006 Pearson Education, Inc. Publishing as Pearson Addison-Wesley
Example
Given that f(x) = 7x 2, use composition of functions to show that f 1(x) = (x + 2)/7.
Solution: 1 1
1
( )( ) ( ( ))
(7 2)
(7 2) 2
77
7
f f x f f x
f x
x
x
x
1 1( )( ) ( ( ))
2( )
72
7( ) 272 2
f f x f f x
xf
x
x
x

Slide 4-18Copyright © 2006 Pearson Education, Inc. Publishing as Pearson Addison-Wesley
Restricting a Domain
When the inverse of a function is not a function, the domain of the function can be restricted to allow the inverse to be a function. In such cases, it is convenient to consider “part” of the function by restricting the domain of f(x). If the domain is restricted, then its inverse is a function.

Copyright © 2006 Pearson Education, Inc. Publishing as Pearson Addison-Wesley
4.2 Exponential Functions
and Graphs Graph exponential equations and functions. Solve applied problems involving exponential
functions and their graphs.

Slide 4-20Copyright © 2006 Pearson Education, Inc. Publishing as Pearson Addison-Wesley
Exponential Function
The function f(x) = ax, where x is a real number, a > 0 and a 1, is called the exponential function, base a.
The base needs to be positive in order to avoid the complex numbers that would occur by taking even roots of negative numbers.
Examples:
1( ) 3 ( ) ( ) (4.23)
3
xx xf x f x f x

Slide 4-21Copyright © 2006 Pearson Education, Inc. Publishing as Pearson Addison-Wesley
Graphing Exponential Functions
To graph an exponential function, follow the steps listed:
1. Compute some function values and list the results
in a table.
2. Plot the points and connect them with a smooth curve. Be sure to plot enough points to
determine how steeply the curve rises.

Slide 4-22Copyright © 2006 Pearson Education, Inc. Publishing as Pearson Addison-Wesley
Example
Graph the exponential function y = f(x) = 3x.
(3, 1/27)1/273
(2, 1/9)1/92
(1, 1/3)1/31
(3, 27)273
9
3
1
y = f(x) = 3x
(2, 9)2
(1, 3)1
(0, 1)0
(x, y)x

Slide 4-23Copyright © 2006 Pearson Education, Inc. Publishing as Pearson Addison-Wesley
Example
Graph the exponential function . 1
( )3
x
y f x
(3, 1/27)1/273
(2, 1/9)1/92
(1, 1/3)1/31
(3, 27)273
9
3
1
(2, 9)2
(1, 3)1
(0, 1)0
(x, y)x 1( )
3
x
y f x

Slide 4-24Copyright © 2006 Pearson Education, Inc. Publishing as Pearson Addison-Wesley
Example
Graph y = 3x + 2.
The graph is the graph of y = 3x shifted to left 2 units.
2433
812
271
90
3
1
1/3
y
1
2
3
x
Slide 4-25Copyright © 2006 Pearson Education, Inc. Publishing as Pearson Addison-Wesley
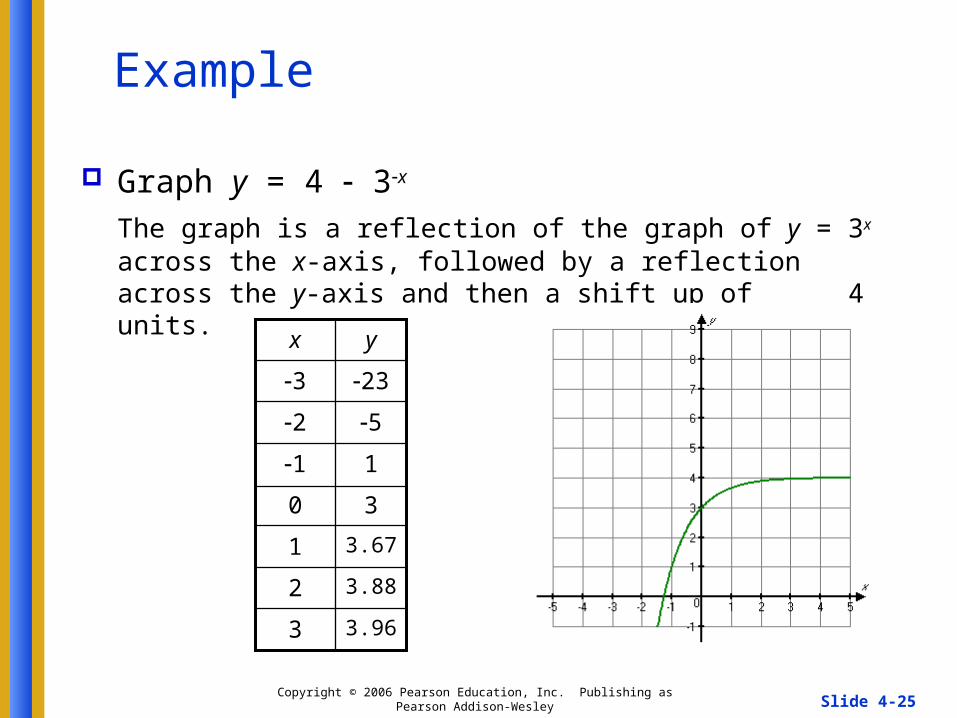
Example
Graph y = 4 3x
The graph is a reflection of the graph of y = 3x across the x-axis, followed by a reflection across the y-axis and then a shift up of 4 units.
3.963
3.882
3.671
30
1
5
23
y
1
2
3
x

Slide 4-26Copyright © 2006 Pearson Education, Inc. Publishing as Pearson Addison-Wesley
The Number e
e 2.7182818284…
Find each value of ex, to four decimal places, using the ex key on a calculator.
a) e4 b) e0.25
c) e2 d) e1
a) 54.5982 b) 0.7788 c) 7.3891 d) 0.3679

Slide 4-27Copyright © 2006 Pearson Education, Inc. Publishing as Pearson Addison-Wesley
Graphs of Exponential Functions, Base e
Graph f(x) = ex.
7.3892
2.7181
1
0.368
0.135
f(x)
0
1
2
x

Slide 4-28Copyright © 2006 Pearson Education, Inc. Publishing as Pearson Addison-Wesley
Example
Graph f(x) = 2 e3x.
1.992
1.951
1
18.09
401.43
f(x)
0
1
2
x

Slide 4-29Copyright © 2006 Pearson Education, Inc. Publishing as Pearson Addison-Wesley
Example
Graph f(x) = ex+2.
0.1354
0.3683
20.0861
7.389
2.718
1
f(x)
0
1
2
x

Copyright © 2006 Pearson Education, Inc. Publishing as Pearson Addison-Wesley
4.3 Logarithmic Functions
and Graphs Graph logarithmic functions. Convert between exponential and logarithmic
equations. Find common and natural logarithms with and
without using a calculator. Change logarithm bases

Slide 4-31Copyright © 2006 Pearson Education, Inc. Publishing as Pearson Addison-Wesley
Logarithmic Functions
These functions are inverses of exponential functions.
Graph: x = 3y.
1. Choose values for y.
2. Compute values for x.
3. Plot the points and connect them with a smooth curve.
* Note that the curve does not touch or cross the y-axis.

Slide 4-32Copyright © 2006 Pearson Education, Inc. Publishing as Pearson Addison-Wesley
Logarithmic Functions continued
(1/27, 3)31/27
(1/9, 2)21/9
(1/3, 1)11/3
2
1
0
y
(9, 2)9
(3, 1)3
(1, 0)1
(x, y)x = 3y
Graph: x = 3y

Slide 4-33Copyright © 2006 Pearson Education, Inc. Publishing as Pearson Addison-Wesley
Logarithmic Function, Base a
We define y = loga x as that number y such that x = ay, where x > 0 and a is a positive constant other than 1.
We read loga x as “the logarithm, base a, of x.”

Slide 4-34Copyright © 2006 Pearson Education, Inc. Publishing as Pearson Addison-Wesley
Finding Certain Logarithms
Find each of the following logarithms. a) log2 16 b) log10 1000 c) log16 4 d) log10 0.001
a) The exponent to which we raise 2 to obtain 16 is 4; thus log2 16 = 4.b) The exponent to which we raise 10 to obtain 1000 is 3;
thus log10 1000 = 3.c) The exponent we raise 16 to get 4 is ½, so log16 4 = ½.d) We have The exponent to which we raise 10
to get 0.001 is 3, so log10 0.001 = 3.
33
1 110 .
1000 10

Slide 4-35Copyright © 2006 Pearson Education, Inc. Publishing as Pearson Addison-Wesley
Logarithms
loga 1 = 0 and loga a = 1, for any logarithmic base a.
Convert each of the following to a logarithmic equation.
a) 25 = 5x
log5 25 = x
b) ew = 30
loge 30 = w
log A logarithm is an exponent!ayyx x a
The base remains the same.
The exponent is the logarithm.

Slide 4-36Copyright © 2006 Pearson Education, Inc. Publishing as Pearson Addison-Wesley
Example
Convert each of the following to an exponential equation.
a) log7 343 = 3 log7 343 = 3 73 = 343
b) logb R = 12
logb R = 12 b12 = R
The logarithm is the exponent.
The base remains the same.

Slide 4-37Copyright © 2006 Pearson Education, Inc. Publishing as Pearson Addison-Wesley
Example
Find each of the following common logarithms on a calculator. Round to four decimal places.
a) log 723,456
b) log 0.0000245
c) log (4)
Does not existERR: nonreal anslog (4)
4.61084.610833916log 0.0000245
5.85945.859412123log 723,456
RoundedReadoutFunction Value

Slide 4-38Copyright © 2006 Pearson Education, Inc. Publishing as Pearson Addison-Wesley
Natural Logarithms
Logarithms, base e, are called natural logarithms. The abbreviation “ln” is generally used for natural logarithms. Thus,
ln x means loge x.
ln 1 = 0 and ln e = 1, for the logarithmic base e.

Slide 4-39Copyright © 2006 Pearson Education, Inc. Publishing as Pearson Addison-Wesley
Example
Find each of the following natural logarithms on a calculator. Round to four decimal places.
a) ln 723,456
b) ln 0.0000245
c) ln (4)
Does not existERR: nonreal ansln (4)
10.616810.61683744ln 0.0000245
13.491813.49179501ln 723,456
RoundedReadoutFunction Value

Slide 4-40Copyright © 2006 Pearson Education, Inc. Publishing as Pearson Addison-Wesley
Changing Logarithmic Bases
The Change-of-Base Formula
For any logarithmic bases a and b, and any positive number M,
loglog .
loga
ba
MM
b
Slide 4-41Copyright © 2006 Pearson Education, Inc. Publishing as Pearson Addison-Wesley
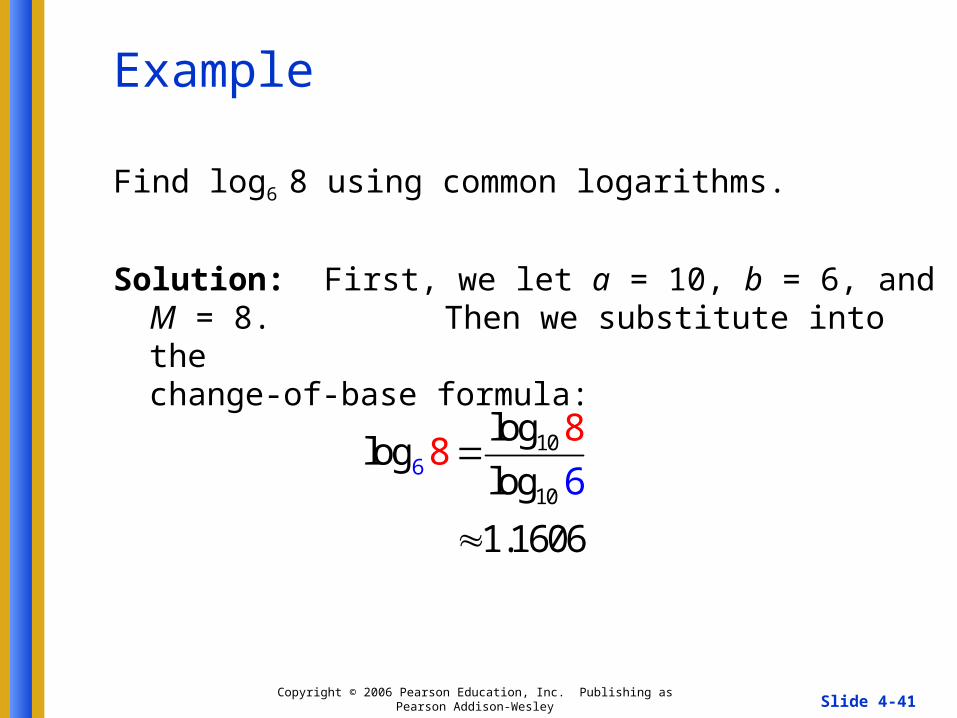
Example
Find log6 8 using common logarithms.
Solution: First, we let a = 10, b = 6, and M = 8. Then we substitute into the change-of-base formula:
10
16
0
loglog
l
8
og
1.1606
68

Slide 4-42Copyright © 2006 Pearson Education, Inc. Publishing as Pearson Addison-Wesley
Example
We can also use base e for a conversion.
Find log6 8 using natural logarithms.
Solution: Substituting e for a, 6 for b and 8 for M, we have
6 6
loglog
log
ln81.1606
ln 6
88 e
e

Slide 4-43Copyright © 2006 Pearson Education, Inc. Publishing as Pearson Addison-Wesley
Graphs of Logarithmic Functions
Graph: y = f(x) = log6 x.
Select y. Compute x.
21/36
11/6
3216
236
16
01
yx,or 6y
Slide 4-44Copyright © 2006 Pearson Education, Inc. Publishing as Pearson Addison-Wesley
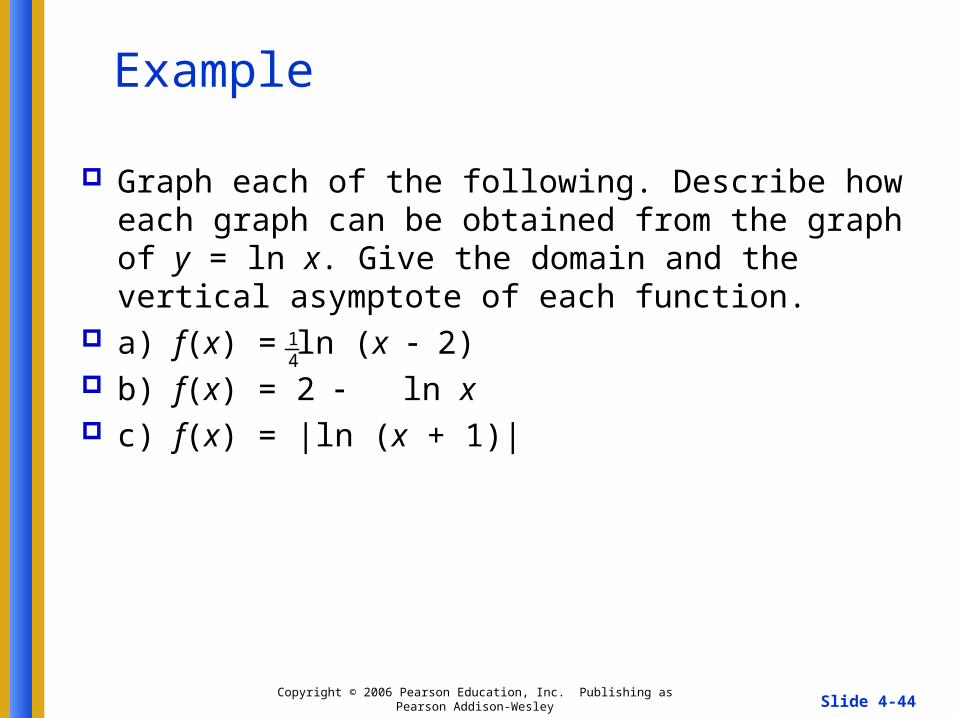
Example
Graph each of the following. Describe how each graph can be obtained from the graph of y = ln x. Give the domain and the vertical asymptote of each function.
a) f(x) = ln (x 2) b) f(x) = 2 ln x c) f(x) = |ln (x + 1)|
14

Slide 4-45Copyright © 2006 Pearson Education, Inc. Publishing as Pearson Addison-Wesley
Graph f(x) = ln (x 2)
The graph is a shift 2 units right. The domain is the set of all real numbers greater than 2. The line x = 2 is the vertical asymptote.
1.0995
0.6934
03
0.6932.5
1.3862.25
f(x)x

Slide 4-46Copyright © 2006 Pearson Education, Inc. Publishing as Pearson Addison-Wesley
Graph f(x) = 2 ln x
The graph is a vertical shrinking, followed by a reflection across the x-axis, and then a translation up 2 units. The domain is the set of all positive real numbers. The y-axis is the vertical asymptote.
14
1.5985
1.7253
21
2.1730.5
2.5760.1
f(x)x

Slide 4-47Copyright © 2006 Pearson Education, Inc. Publishing as Pearson Addison-Wesley
Graph f(x) = |ln (x + 1)|
The graph is a translation 1 unit to the left. Then the absolute value has the effect of reflecting negative outputs across the x-axis. The domain is the set of all real numbers greater than 1. The line x = 1 is the vertical asymptote.
1.9466
1.3863
0.6931
00
0.6930.5
f(x)x

Slide 4-48Copyright © 2006 Pearson Education, Inc. Publishing as Pearson Addison-Wesley
Application: Walking Speed
In a study by psychologists Bornstein and Bornstein, it was found that the average walking speed w, in feet per second, of a person living in a city of population P, in thousands, is given by the function
w(P) = 0.37 ln P + 0.05.

Slide 4-49Copyright © 2006 Pearson Education, Inc. Publishing as Pearson Addison-Wesley
Application: Walking Speed continued
The population of Philadelphia, Pennsylvania, is 1,517,600. Find the average walking speed of people living in Philadelphia.
Since 1,517,600 = 1517.6 thousand, we substitute 1517.6 for P, since P is in thousands: w(1517.6) = 0.37 ln 1517.6 + 0.05
2.8 ft/sec.The average walking speed of people living in Philadelphia is about 2.8 ft/sec.

Copyright © 2006 Pearson Education, Inc. Publishing as Pearson Addison-Wesley
4.4 Properties of Logarithmic
Functions Convert from logarithms of products, powers,
and quotients to expressions in terms of individual logarithms, and conversely. Simplify expressions of the type loga ax and .
loga xa

Slide 4-51Copyright © 2006 Pearson Education, Inc. Publishing as Pearson Addison-Wesley
Logarithms of Products
The Product Rule
For any positive numbers M and N and any logarithmic base a,
loga MN = loga M + loga N.
(The logarithm of a product is the sum of the logarithms of the factors.)
Slide 4-52Copyright © 2006 Pearson Education, Inc. Publishing as Pearson Addison-Wesley
Example
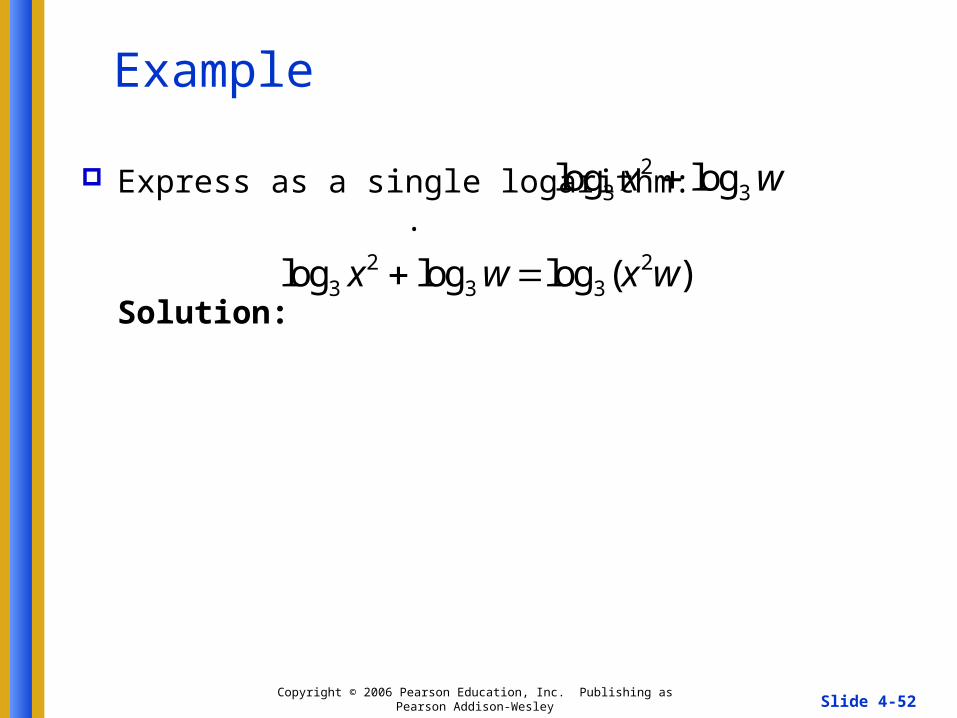
Express as a single logarithm: .
Solution:
23 3log logx w
2 23 3 3log log log ( )x w x w

Slide 4-53Copyright © 2006 Pearson Education, Inc. Publishing as Pearson Addison-Wesley
Logarithms of Powers
The Power Rule
For any positive number M, any logarithmic base a, and any real number p,
loga Mp = p loga M.
(The logarithm of a power of M is the exponent times the logarithm of M.)

Slide 4-54Copyright © 2006 Pearson Education, Inc. Publishing as Pearson Addison-Wesley
Examples
Express as a product. Express as a product.
3log 7a
3log 7 3log 7a a
5log 11a
1/ 55log 11 log 11
1log 11
5
a a
a

Slide 4-55Copyright © 2006 Pearson Education, Inc. Publishing as Pearson Addison-Wesley
Logarithms of Quotients
The Quotient Rule
For any positive numbers M and N, and any logarithmic base a,
.
(The logarithm of a quotient is the logarithm of the numerator minus the logarithm of the denominator.)
log log loga a a
MM N
N

Slide 4-56Copyright © 2006 Pearson Education, Inc. Publishing as Pearson Addison-Wesley
Examples
Express as a difference of logarithms.
Express as a single logarithm.
10log
log 10 log
a
a a
bb 125
log log 525w w
log 125 log 25w w

Slide 4-57Copyright © 2006 Pearson Education, Inc. Publishing as Pearson Addison-Wesley
Applying the Properties
Express in terms of sums and differences of logarithms.
3 43 4 2
2
3 4 2
log log ( ) log
log log log
3log 4log 2log
a a a
a a a
a a a
w yw y z
z
w y z
w y z
3 4
2loga
w y
z

Slide 4-58Copyright © 2006 Pearson Education, Inc. Publishing as Pearson Addison-Wesley
Example
Express as a single logarithm.
16log 2log log
3b b bx y z
6 2 1/ 3
61/ 3
2
6 1/ 3 6 3
2 2
16log 2log log log log log
3
log log
log , or log
b b b b b b
b b
b b
x y z x y z
xz
y
x z x z
y y

Slide 4-59Copyright © 2006 Pearson Education, Inc. Publishing as Pearson Addison-Wesley
Final Properties
The Logarithm of a Base to a PowerFor any base a and any real number x,
loga ax = x.(The logarithm, base a, of a to a power is the power.)
A Base to a Logarithmic PowerFor any base a and any positive real number x,
(The number a raised to the power loga x is x.)
log .a xa x

Slide 4-60Copyright © 2006 Pearson Education, Inc. Publishing as Pearson Addison-Wesley
Examples
Simplify.
a) loga a6
b) ln e8
Solution:
a) loga a6 = 6
b) ln e8 = 8
Simplify.
a)
b)
Solution:
a)
b)
7log7 w
7log7 w w
ln 8e
log 8ln 8 8ee e

Copyright © 2006 Pearson Education, Inc. Publishing as Pearson Addison-Wesley
4.5 Solving Exponential and Logarithmic Equations
Solve exponential and logarithmic equations.

Slide 4-62Copyright © 2006 Pearson Education, Inc. Publishing as Pearson Addison-Wesley
Solving Exponential Equations
Equations with variables in the exponents, such as
3x = 40 and 53x = 25, are called exponential equations.
Base-Exponent Property
For any a > 0, a 1,
ax = ay x = y.

Slide 4-63Copyright © 2006 Pearson Education, Inc. Publishing as Pearson Addison-Wesley
Example
Solve: .
Write each side with the same base.
Since the bases are the same number, 5, we can use the base-exponent property and set the exponents equal:
Check: 52x 3 = 125
52(3) 3 ? 125
53 ? 125
125 = 125 True
The solution is 3.
2 35 125x
2 3 35 5x
2 3 3
2 6
3
x
x
x

Slide 4-64Copyright © 2006 Pearson Education, Inc. Publishing as Pearson Addison-Wesley
Graphical Solution
We will use the Intersect method. We graph y1 = and y2 = 53 2 35 x

Slide 4-65Copyright © 2006 Pearson Education, Inc. Publishing as Pearson Addison-Wesley
Another Property
Property of Logarithmic Equality
For any M > 0, N > 0, a > 0, and a 1,
loga M = loga N M = N.
Solve: 2x = 50
log 2 log50
log 2 log50
log50
log 2
x
x
x
This is an exact answer. We cannot simplify further, but we can approximate using a calculator.
x 5.6439
We can check by finding 25.6439 50.

Slide 4-66Copyright © 2006 Pearson Education, Inc. Publishing as Pearson Addison-Wesley
Graphical Solution
We will use the Intersect method. We graph y1 = 2x and y2 = 50

Slide 4-67Copyright © 2006 Pearson Education, Inc. Publishing as Pearson Addison-Wesley
Example
Solve: e0.25w = 12
The solution is about 9.94.
0.25
0.25
12
ln ln12
0.25 ln12
ln12
0.259.93963
w
w
e
e
w
w
w

Slide 4-68Copyright © 2006 Pearson Education, Inc. Publishing as Pearson Addison-Wesley
Solving Logarithmic Equations
Equations containing variables in logarithmic expressions, such as log2 x = 16 and log x + log (x + 4) = 1, are called logarithmic equations.
To solve logarithmic equations algebraically, we first try to obtain a single logarithmic expression on one side and then write an equivalent exponential equation.
Slide 4-69Copyright © 2006 Pearson Education, Inc. Publishing as Pearson Addison-Wesley
Example
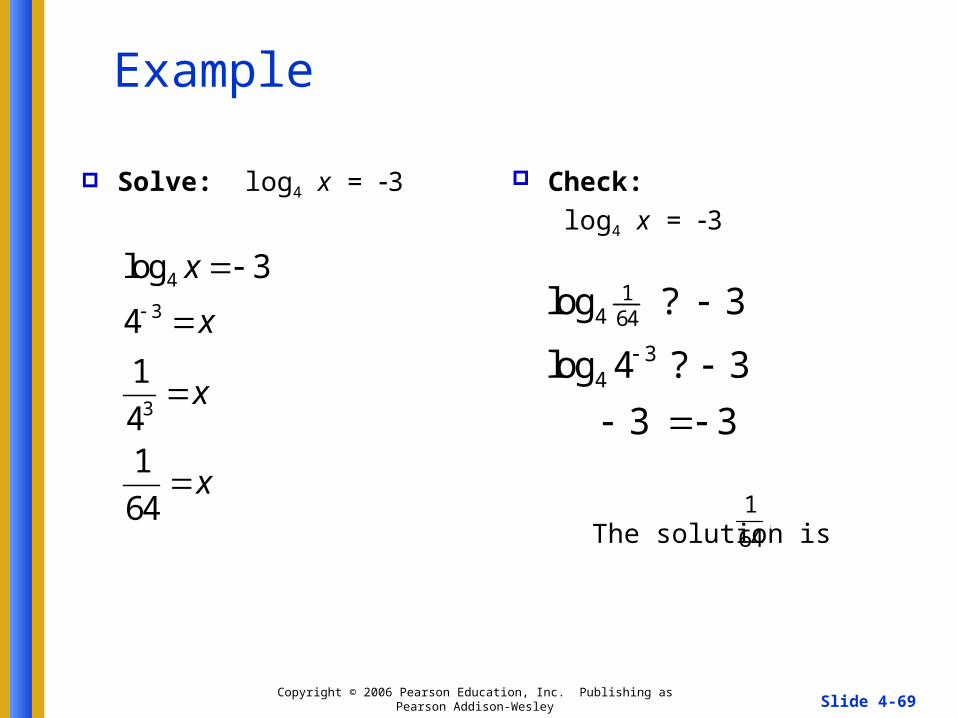
Solve: log4 x = 3 Check:
log4 x = 3
The solution is
4
3
3
log 3
4
1
41
64
x
x
x
x
14 64
34
log ? 3
log 4 ? 3
3 3
1.
64

Slide 4-70Copyright © 2006 Pearson Education, Inc. Publishing as Pearson Addison-Wesley
Graphical Solution
We use the change of base formula and graph the equations
y1 =
y2 = 34
lnlog 3
ln 4
xx

Slide 4-71Copyright © 2006 Pearson Education, Inc. Publishing as Pearson Addison-Wesley
Example
Solve: Check: For x = 3:
For x = 3:
2 2
2
3
2
2
log ( 1) log ( 1) 3
log ( 1)( 1) 3
( 1)( 1) 2
1 8
9
9
3
x x
x x
x x
x
x
x
x
2 2log ( 1) log ( 1) 3x x 2 2
2 2
2
2
log ( 1) log ( 1) 3
log 4 log 2 ? 3
log (4 2) ? 3
log 8 ? 3
3
3
3
3
2 2
2 2
log ( 1) log ( 1)? 3
log ( 2) log ( 4)? 3
3 3
Negative numbers do not have real-number logarithms. The solution is 3.
Slide 4-72Copyright © 2006 Pearson Education, Inc. Publishing as Pearson Addison-Wesley
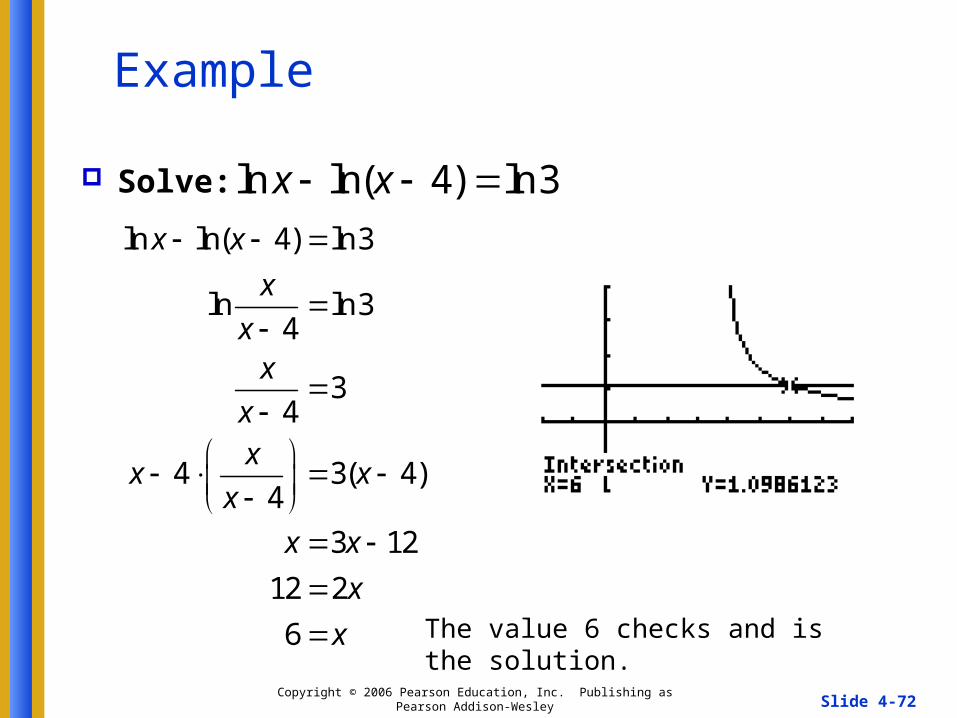
Example
Solve: ln ln( 4) ln3x x ln ln( 4) ln3
ln ln34
34
4 3( 4)4
3 12
12 2
6
x x
x
xx
xx
x xx
x x
x
x
The value 6 checks and is the solution.

Copyright © 2006 Pearson Education, Inc. Publishing as Pearson Addison-Wesley
4.6 Applications and Models:
Growth and Decay Solve applied problems involving exponential
growth and decay and compound interest. Find models involving exponential and
logarithmic functions.

Slide 4-74Copyright © 2006 Pearson Education, Inc. Publishing as Pearson Addison-Wesley
Population Growth
The function P(t) = P0ekt, k > 0 can model many kinds of population growths.
In this function:
P0 = population at time 0,
P = population after time,
t = amount of time,
k = exponential growth rate.
The growth rate unit must be the same as the time unit.
Slide 4-75Copyright © 2006 Pearson Education, Inc. Publishing as Pearson Addison-Wesley
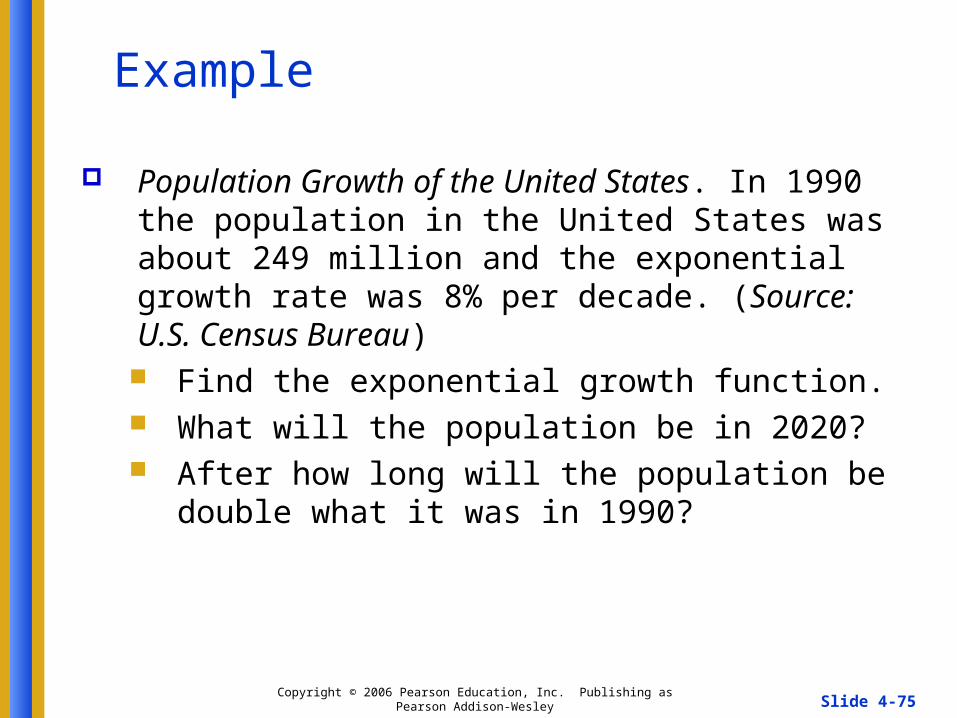
Example
Population Growth of the United States. In 1990 the population in the United States was about 249 million and the exponential growth rate was 8% per decade. (Source: U.S. Census Bureau) Find the exponential growth function. What will the population be in 2020? After how long will the population be double what it
was in 1990?

Slide 4-76Copyright © 2006 Pearson Education, Inc. Publishing as Pearson Addison-Wesley
Solution
At t = 0 (1990), the population was about 249 million. We substitute 249 for P0 and 0.08 for k to obtain the exponential growth function.
P(t) = 249e0.08t
In 2020, 3 decades later, t = 3. To find the population in 2020 we substitute 3 for t:
P(3) = 249e0.08(3) = 249e0.24 317.
The population will be approximately 317 million in 2020.

Slide 4-77Copyright © 2006 Pearson Education, Inc. Publishing as Pearson Addison-Wesley
Solution continued
We are looking for the doubling time T.
498 = 249e0.08T
2 = e0.08T
ln 2 = ln e0.08T (Taking the natural logarithm on both sides)
ln 2 = 0.08T (ln ex = x)
= T
8.7 T
The population of the U.S. will double in about 8.7 decades or 87 years. This will be approximately in 2077.
ln 2
0.08

Slide 4-78Copyright © 2006 Pearson Education, Inc. Publishing as Pearson Addison-Wesley
Interest Compound Continuously
The function P(t) = P0ekt can be used to calculate interest that is compounded continuously.
In this function:
P0 = amount of money invested,
P = balance of the account,
t = years,
k = interest rate compounded continuously.

Slide 4-79Copyright © 2006 Pearson Education, Inc. Publishing as Pearson Addison-Wesley
Example
Suppose that $2000 is deposited into an IRA at an interest rate k, and grows to $5889.36 after 12 years.
What is the interest rate? Find the exponential growth function. What will the balance be after the first 5 years? How long did it take the $2000 to double?

Slide 4-80Copyright © 2006 Pearson Education, Inc. Publishing as Pearson Addison-Wesley
Solution
At t = 0, P(0) = P0 = $2000. Thus the exponential growth function is P(t) = 2000ekt. We know that P(12) = $5889.36. We then substitute
and solve for k: $5889.36 = 2000e12k
The interest rate is about 9%.
12
12
5889.36
20005889.36
ln ln2000
5889.36ln 12
20005889.36
ln200012
0.09
k
k
e
e
k
k
k

Slide 4-81Copyright © 2006 Pearson Education, Inc. Publishing as Pearson Addison-Wesley
Solution continued
The exponential growth function is
P(t) = 2000e0.09t.
The balance after 5 years is
P(5) = 2000e0.09(5)
= 2000e0.45
$3136.62

Slide 4-82Copyright © 2006 Pearson Education, Inc. Publishing as Pearson Addison-Wesley
Solution continued
To find the doubling time T, set P(T) = 2 P0 = $4000 and solve for T.
4000 = 2000e0.09T
2 = e0.09T
ln 2 = ln e0.09T
ln 2 = 0.09T
= T
7.7 T
The original investment of $2000 doubled in about 7.7 years.
ln 2
0.09

Slide 4-83Copyright © 2006 Pearson Education, Inc. Publishing as Pearson Addison-Wesley
Growth Rate and Doubling Time
The growth rate k and the doubling time T are related by
kT = ln 2
or
or
* The relationship between k and T does not depend on P0.
ln 2k
T
ln 2T
k

Slide 4-84Copyright © 2006 Pearson Education, Inc. Publishing as Pearson Addison-Wesley
Example
A certain town’s population is doubling every 37.4 years. What is the exponential growth rate?
Solution: ln 2 ln 21.9%
37.4k
T

Slide 4-85Copyright © 2006 Pearson Education, Inc. Publishing as Pearson Addison-Wesley
Models of Limited Growth
In previous examples, we have modeled population growth. However, in some populations, there can be factors that prevent a population from exceeding some limiting value.
One model of such growth is
which is called a logistic function. This function increases toward a limiting value a as t approaches infinity. Thus, y = a is the horizontal asymptote of the graph.
( )1 kt
aP t
be

Slide 4-86Copyright © 2006 Pearson Education, Inc. Publishing as Pearson Addison-Wesley
Exponential Decay
Decay, or decline, of a population is represented by the function P(t) = P0ekt, k > 0.
In this function:
P0 = initial amount of the substance, P = amount of the substance left after time, t = time, k = decay rate.
The half-life is the amount of time it takes for half of an amount of substance to decay.

Slide 4-87Copyright © 2006 Pearson Education, Inc. Publishing as Pearson Addison-Wesley
Graphs

Slide 4-88Copyright © 2006 Pearson Education, Inc. Publishing as Pearson Addison-Wesley
Example
Carbon Dating. The radioactive element carbon-14 has a half-life of 5750 years. If a piece of charcoal that had lost 7.3% of its original amount of carbon, was discovered from an ancient campsite, how could the age of the charcoal be determined?
Solution: We know (from Example 5 in our book), that the function for carbon dating is
P(t) = P0e-0.00012t.
If the charcoal has lost 7.3% of its carbon-14 from its initial amount P0, then 92.7%P0 is the amount present.

Slide 4-89Copyright © 2006 Pearson Education, Inc. Publishing as Pearson Addison-Wesley
Example continued
To find the age of the charcoal, we solve the equation for t :
The charcoal was about 632 years old.
0.000120 0
0.00012
0.00012
92.7%
0.927
ln 0.927 ln
ln 0.927 0.00012
ln 0.927
0.00012632
t
t
t
P P e
e
e
t
t
t