Embed Size (px)
Citation preview

Slide 1
Labour Market Conditions inNorth West/Northern Tasmania
and Burnie
Presenter: Ivan Neville
Branch Manager, Labour Market Research and Analysis
This Presentation includes information from a survey of employers’ recruitment experiences, March 2013, receiving more than 500 responses from employers across Tasmania.

Slide 2
North West and Northern TasmaniaPriority Employment Area
The North West and Northern Tasmania Priority Employment Area (PEA) is made of the entire Mersey-Lyell Labour Force Region (LFR) and part of the Northern LFR. Together, the two LFRs provide a good indicator of what is occurring within the PEA. • Burnie is a priority LGA. • There are 12 Local Government Areas (LGAs) that make up the PEA: Myersey-Lyell LFR *Burnie Central Coast Circular Head Devonport Kentish Latrobe Waratah/Wynyard West Coast Northern LFR Dorset George Town Launceston West Tamar

Slide 3
Source: ABS, Population Estimates be Age and Sex, Regions of Australia, 2006 and 2011; ABS, Census of Population and Housing, 2011
Regional profile
RegionAdult
Population 2011
PopulationGrowth
2006-2011
% WAPIndigenous
2011
Median Age2011
Burnie 16,200 5% 5% 38
NW/N Tasmania PEA 175,300 5% 4% 40
Tasmania 415,700 6% 3% 40
Australia 18,111,500 9% 2% 37
Profile of the NW/N Tasmania PEA Source: ABS, Population Estimates by Age and Sex, Regions of Australia, 2006 and 2011; ABS, Census of Population and Housing, 2011 • The adult population in the Burnie LGA increased by 5 per cent between 2006 - 2011.
Population growth for persons aged 15-24 years was 8 per cent. • Indigenous populations located in:
• Circular Head (11 per cent) • Burnie (5 per cent)
Slide 4
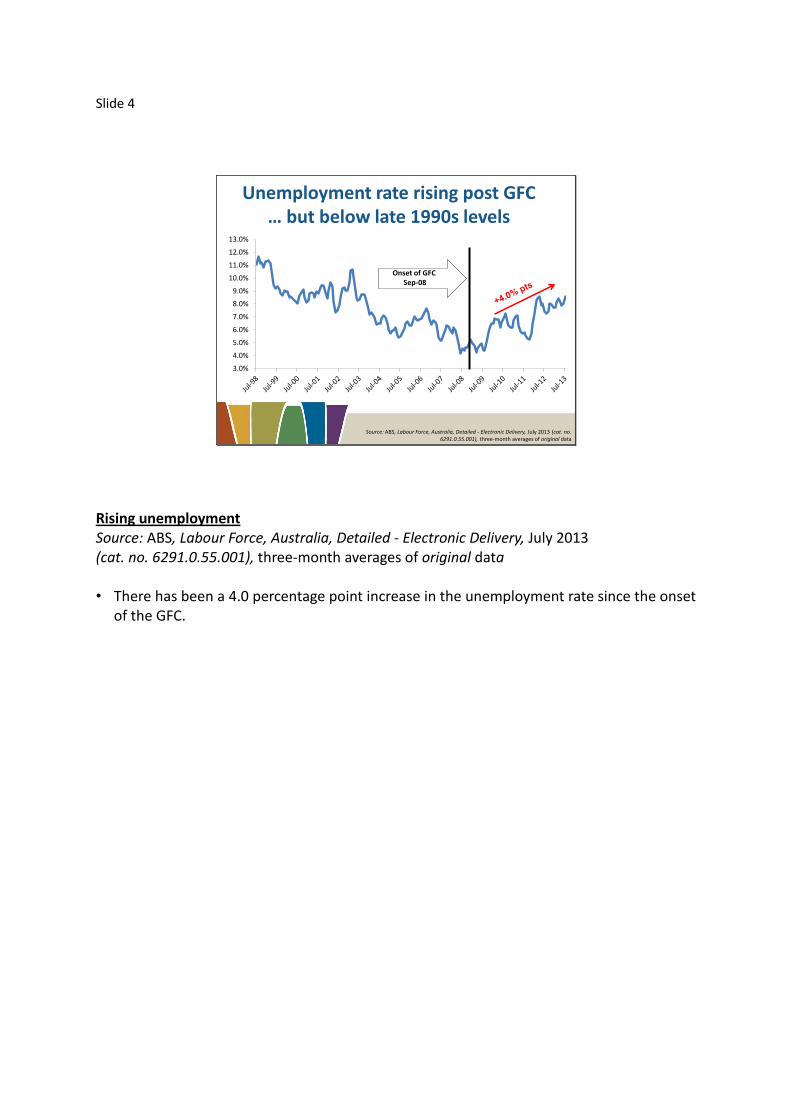
Unemployment rate rising post GFC… but below late 1990s levels
Source: ABS, Labour Force, Australia, Detailed - Electronic Delivery, July 2013 (cat. no. 6291.0.55.001), three-month averages of original data
3.0%
4.0%
5.0%
6.0%
7.0%
8.0%
9.0%
10.0%
11.0%
12.0%
13.0%
Onset of GFCSep-08
Rising unemployment Source: ABS, Labour Force, Australia, Detailed - Electronic Delivery, July 2013 (cat. no. 6291.0.55.001), three-month averages of original data • There has been a 4.0 percentage point increase in the unemployment rate since the onset
of the GFC.

Slide 5
Region Unemployment Rate
Burnie 10.5%
Launceston 8.0%
Circular Head 5.2%
North West and Northern Tasmania PEA 8.3%
Tasmania 8.2%*
Australia 5.7%*
Source: DEEWR, Small Area Labour Markets, June quarter 2013; *ABS, Labour Force –Australia, July 2013 (cat. no. 6202.0), seasonally adjusted estimates
Regional disparity
Regional disparity – some areas worse off than others Source: DEEWR, Small Area Labour Markets, June quarter 2013; *ABS, Labour Force – Australia, July 2013 (cat. no. 6202.0), seasonally adjusted estimates Unemployment rates vary considerably across the PEA.

Slide 6
Low levels of labour force participation
55%
57%
59%
61%
63%
65%
67%
Jan
-08
Ap
r-0
8
Jul-
08
Oct
-08
Jan
-09
Ap
r-0
9
Jul-
09
Oct
-09
Jan
-10
Ap
r-1
0
Jul-
10
Oct
-10
Jan
-11
Ap
r-1
1
Jul-
11
Oct
-11
Jan
-12
Ap
r-1
2
Jul-
12
Oct
-12
Jan
-13
Ap
r-1
3
Jul-
13
NW/N Tasmania PEA Australia
Source: ABS, Labour Force, Australia, Detailed - Electronic Delivery, July 2013, (cat. no. 6291.0.55.001), three-month averages of original data
Low levels of labour force participation Source: ABS, Labour Force, Australia, Detailed - Electronic Delivery, July 2013 (cat. no. 6291.0.55.001), three-month averages of original data The labour market participation rate in the NW/N Tasmania PEA has been consistently lower compared with Australia.
Slide 7
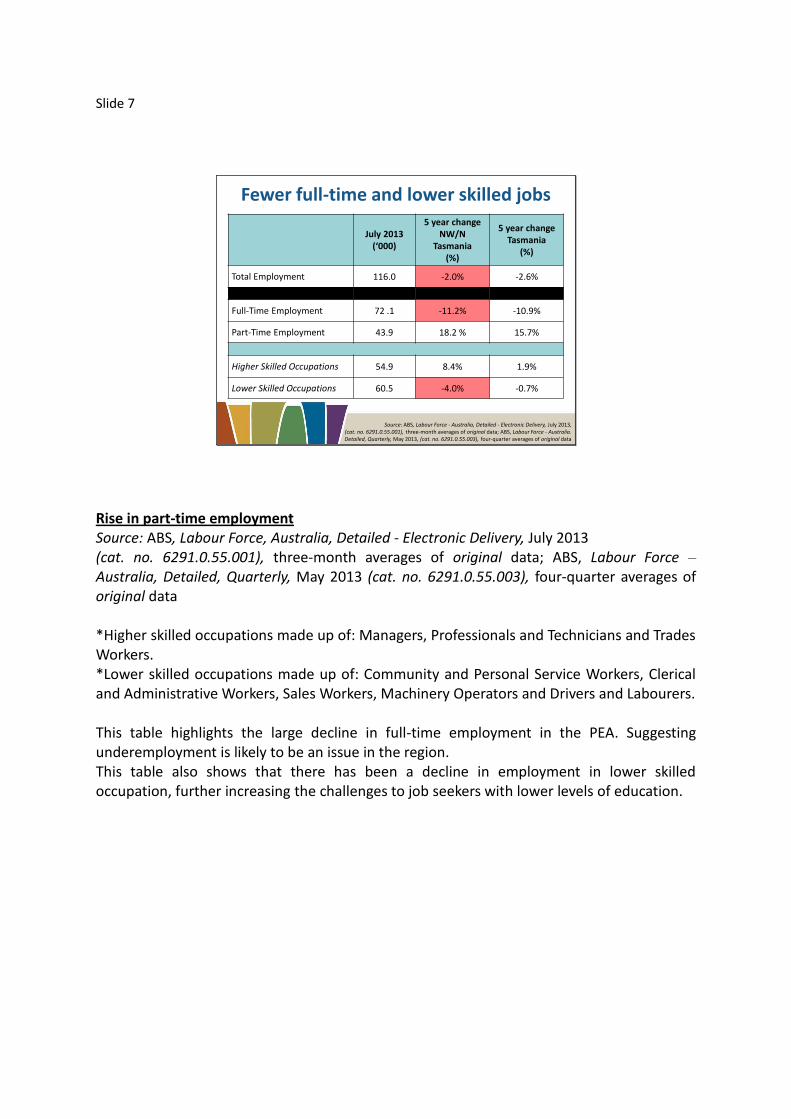
Fewer full-time and lower skilled jobs
Source: ABS, Labour Force - Australia, Detailed - Electronic Delivery, July 2013, (cat. no. 6291.0.55.001), three-month averages of original data; ABS, Labour Force - Australia. Detailed, Quarterly, May 2013, (cat. no. 6291.0.55.003), four-quarter averages of original data
July 2013 (‘000)
5 year change NW/N
Tasmania(%)
5 year change Tasmania
(%)
Total Employment 116.0 -2.0% -2.6%
Full-Time Employment 72 .1 -11.2% -10.9%
Part-Time Employment 43.9 18.2 % 15.7%
Higher Skilled Occupations 54.9 8.4% 1.9%
Lower Skilled Occupations 60.5 -4.0% -0.7%
Rise in part-time employment Source: ABS, Labour Force, Australia, Detailed - Electronic Delivery, July 2013 (cat. no. 6291.0.55.001), three-month averages of original data; ABS, Labour Force – Australia, Detailed, Quarterly, May 2013 (cat. no. 6291.0.55.003), four-quarter averages of original data *Higher skilled occupations made up of: Managers, Professionals and Technicians and Trades Workers. *Lower skilled occupations made up of: Community and Personal Service Workers, Clerical and Administrative Workers, Sales Workers, Machinery Operators and Drivers and Labourers. This table highlights the large decline in full-time employment in the PEA. Suggesting underemployment is likely to be an issue in the region. This table also shows that there has been a decline in employment in lower skilled occupation, further increasing the challenges to job seekers with lower levels of education.
Slide 8
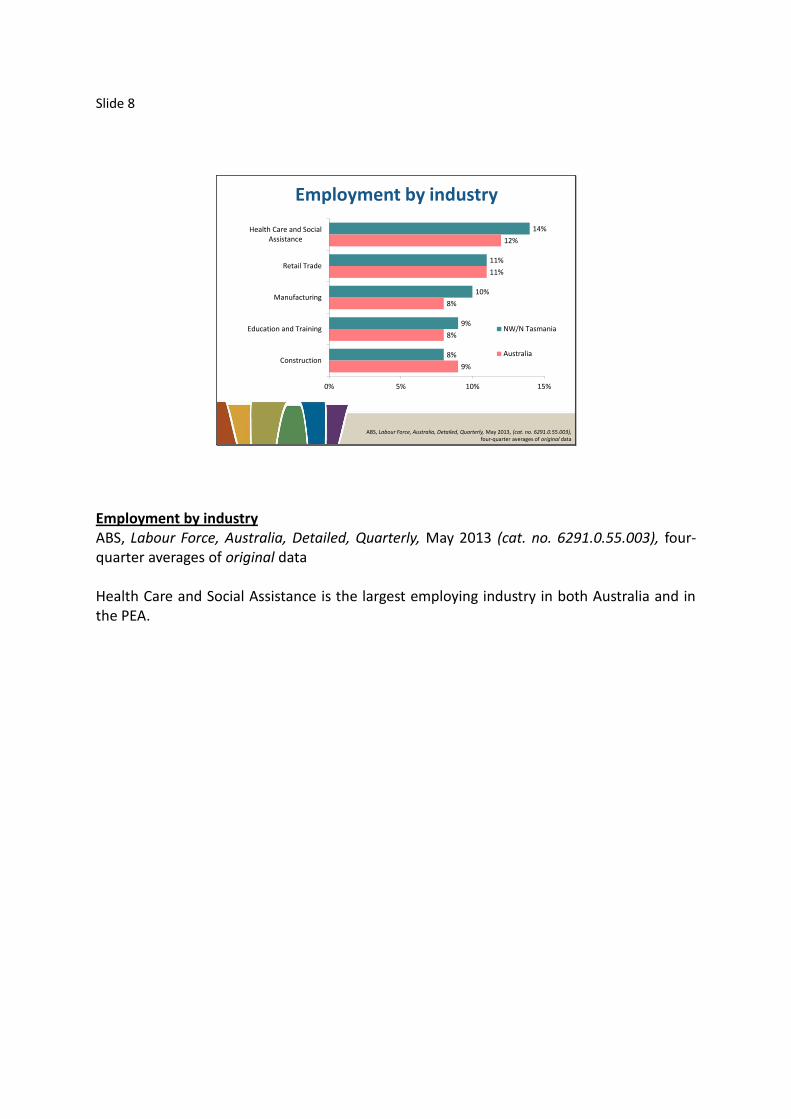
Employment by industry
ABS, Labour Force, Australia, Detailed, Quarterly, May 2013, (cat. no. 6291.0.55.003), four-quarter averages of original data
14%
11%
10%
9%
8%
12%
11%
8%
8%
9%
0% 5% 10% 15%
Health Care and SocialAssistance
Retail Trade
Manufacturing
Education and Training
Construction
NW/N Tasmania
Australia
Employment by industry ABS, Labour Force, Australia, Detailed, Quarterly, May 2013 (cat. no. 6291.0.55.003), four-quarter averages of original data Health Care and Social Assistance is the largest employing industry in both Australia and in the PEA.

Slide 9
Estimated employment growth5 years to May 2013
ABS, Labour Force, Australia, Detailed, Quarterly, May 2013, (cat. no. 6291.0.55.003), four-quarter averages of original data
3,500
2,100
2,000
1,100
-1,100
-1,900
-4,000 -3,000 -2,000 -1,000 0 1,000 2,000 3,000 4,000
Health Care and Social Assistance
Education and Training
Professional, Scientific and TechnicalServices
Wholesale Trade
Agriculture, Forestry and Fishing
Manufacturing
Employment growth by industry over five years ABS, Labour Force, Australia, Detailed, Quarterly, May 2013 (cat. no. 6291.0.55.003), four-quarter averages of original data • Employment in Health Care and Social Assistance grew by 21 per cent (or 3,500 people)
across the PEA, in the last five years.

Slide 10
Region
Long-termunemployed
(52 weeks or more)
Average duration of
unemployment
(weeks)Persons
Incidence
North West/Northern Tasmania PEA 2400 23% 46
Tasmania 4500 24% 47
Australia 125,900 19% 37
Long-term unemployment
Source: ABS, Labour Force, Australia, Detailed - Electronic Delivery, July 2013 (cat. no. 6291.0.55.001), 12-month averages of original data
Long-term unemployment Source: ABS, Labour Force - Australia, Detailed - Electronic Delivery, July 2013 (cat. no. 6291.0.55.001), 12-month averages of original data • As at July 2013, nearly one in four (23 per cent) unemployed people were long-term
unemployed, which was higher than the national average. • The average duration of unemployment, at 46 weeks, was also higher than the national
average (of 37 weeks). • Across Tasmania, the average duration of unemployment for persons aged 45 and older is
63 weeks.

Slide 11
Region
% Working age population (15-64) receiving
CentrelinkAllowance
UnemploymentAllowance
Disability Support
Allowance
Burnie 29% 10% 10%
Devonport 28% 9% 10%
Kentish 29% 9% 10%
NW/N Tasmania PEA 25% 9% 8%
Tasmania 24% 8% 8%
Australia 17% 5% 5%
High rates of income support
Source: DEEWR, Administrative Data, June quarter 2013; ABS, Population Estimates by Age and Sex, Regions of Australia, 2011
High rates of income support in some areas Source: DEEWR, Administrative Data, June quarter 2013; ABS, Population Estimates by Age and Sex, Regions of Australia, 2011

Slide 12
Jobless Families with children under 15
Region
Number of jobless families
Proportion of all families who are jobless
Burnie 500 25%
Launceston 1300 21%
NW/N Tasmania PEA 4100 20%
Tasmania 8900 18%
Australia 294,900 14%
Source: ABS, Census of Population and Housing, 2011
Jobless families Source: ABS, Census of Population and Housing, 2011

Slide 13
Disengaged youth20-24 Years
Source: ABS, Census of Population and Housing, 2011
11%
5%9%
5% 6% 4%
5%22%
6%18%
6% 11%
0%
5%
10%
15%
20%
25%
30%
Male Female Male Female Male Female
Burnie NW/N Tasmania PEA Australia
Not in the labour force and not studying
Unemployed and not studying
Disengaged youth - 20-24 years Source: ABS, Census of Population and Housing, 2011
Slide 14
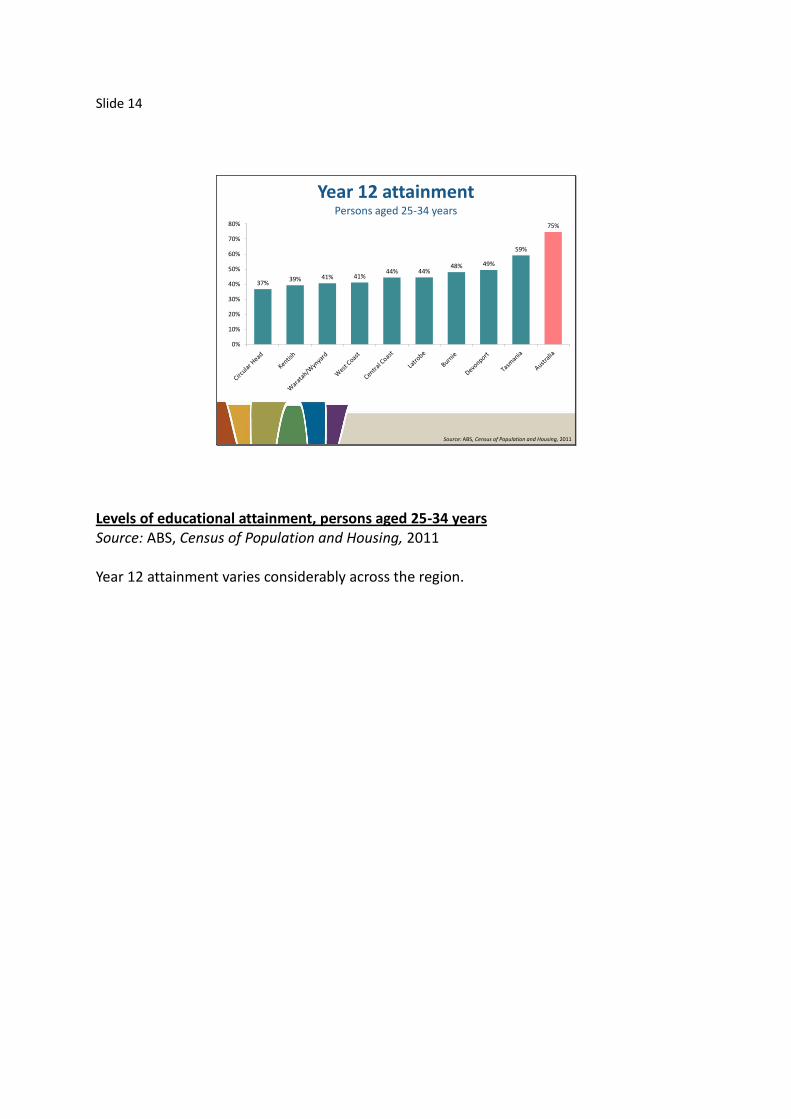
Source: ABS, Census of Population and Housing, 2011
Year 12 attainment Persons aged 25-34 years
37%39% 41% 41%
44% 44%48% 49%
59%
75%
0%
10%
20%
30%
40%
50%
60%
70%
80%
Levels of educational attainment, persons aged 25-34 years Source: ABS, Census of Population and Housing, 2011 Year 12 attainment varies considerably across the region.

Slide 15
Education and labour market outcomes(25 – 34 year olds)
Source: ABS, Census of Population and Housing, 2011
2.9%
4.3% 4.6%
9.7%
15.7%
13.1%
88.8%
82.8%87.5%
73.9%
68.2% 65.6%
0%
10%
20%
30%
40%
50%
60%
70%
80%
90%
100%
0%
2%
4%
6%
8%
10%
12%
14%
16%
18%
Bachelor orhigher
AdvancedDiploma &
Diploma Level
Certificate III &IV Level
Year 12 Certificate I & IILevel
Below Year 12
Unemployment Rate (LHS)
Participation Rate (RHS)
Education and labour market outcomes Source: ABS, Census of Population and Housing, 2011

Slide 16
Source: DEEWR, Survey of Employers’ Recruitment Experiences, March 2013
BurnieNorth West/Northern
Tasmania PEA
2013 2011 2013 2011
Employers who recruited 58% 81% 62% 69%
Vacancies per 100 staff 16 18 16 20
Vacancies unfilled 5.8% 11.1% 2.9% 4.9%
Experienced difficulty 44% 67% 44% 62%
Survey resultsRecruitment experiences in the 12 months preceding the survey
Survey results Source: DEEWR, Survey of Employers’ Recruitment Experiences, March 2013 and 2011 Employer survey results suggest that overall recruitment conditions in the NW/N Tasmania PEA may have deteriorated since 2011. • Indicators of recruitment activity have softened since 2011, with fewer employers
recruiting and annual vacancies per 100 staff decreasing slightly. • Employers were less likely to say that recruitment was ‘difficult’ than was the case in
2011.

Slide 17
Most employers sitting tightChange in staff numbers, past 12 months
14%
29%
56%
0%
10%
20%
30%
40%
50%
60%
Increased Decreased Remained the same
Source: DEEWR, Survey of Employers’ Recruitment Experiences, March 2013
Most employers sitting tight - change in staff numbers, past 12 months Source: DEEWR, Survey of Employers’ Recruitment Experiences, March 2013 • 70 per cent of employers either increased staff numbers or kept them the same in the 12
months to March 2013.
Slide 18
4.8%
10.2%
2.5%
3.8%
1.0%
2.6%
0.8%
2.9%
0.0%
2.0%
4.0%
6.0%
8.0%
10.0%
12.0%
Managers andProfessionals
Techniciansand Trades
Workers
Communityand Personal
ServiceWorkers
Clerical andAdministrative
Workers
Sales Workers MachineryOperators and
Drivers
Labourers AllOccupations
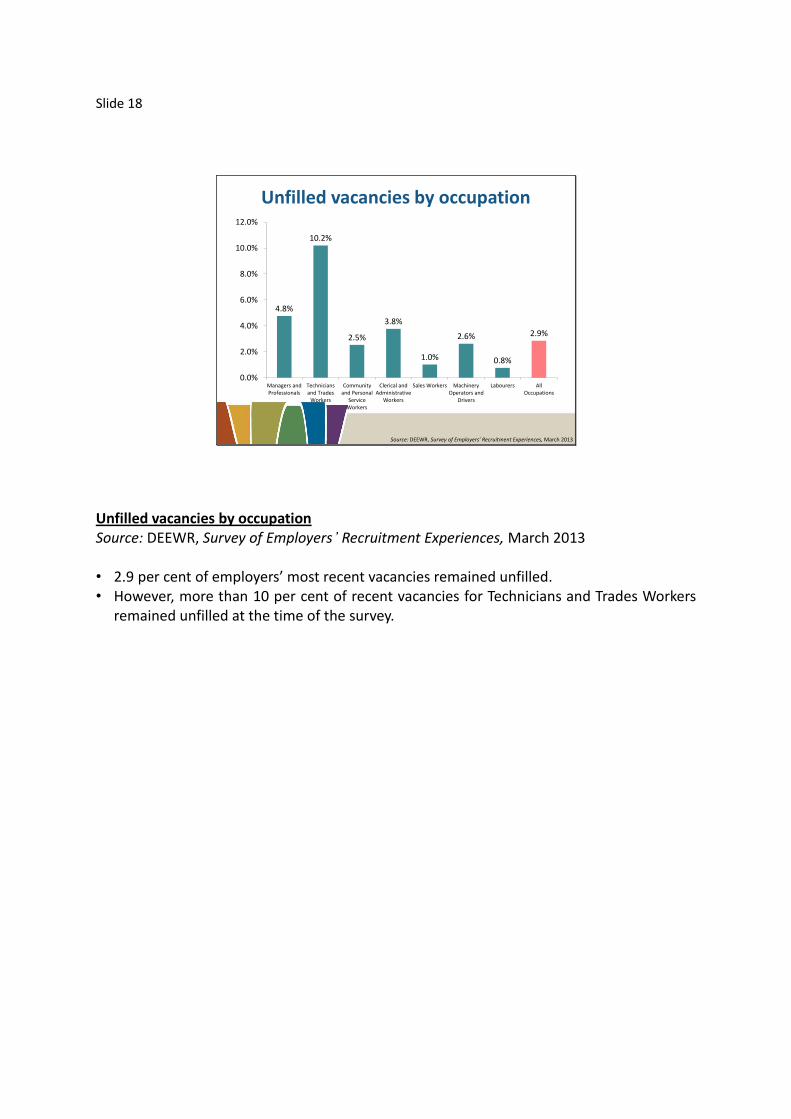
Unfilled vacancies by occupation
Source: DEEWR, Survey of Employers’ Recruitment Experiences, March 2013
Unfilled vacancies by occupation Source: DEEWR, Survey of Employers’ Recruitment Experiences, March 2013 • 2.9 per cent of employers’ most recent vacancies remained unfilled. • However, more than 10 per cent of recent vacancies for Technicians and Trades Workers
remained unfilled at the time of the survey.

Slide 19
Source: DEEWR, Survey of Employers’ Recruitment Experiences, March 2013
Most applicants don’t get an interviewAverages, per vacancy
Not interviewed6.0
Total applicants8.5
Got an interview2.5
Unsuitable1.1
Suitable1.429% of applicants
interviewed
Applicants and suitability Source: DEEWR, Survey of Employers’ Recruitment Experiences, March 2013 This diagram breaks down the number and suitability of applicants in employers’ most recent recruitment round. • There was an average of 8.5 applicants per vacancy
• With 6 not interviewed • Of the 2.5 average applicants who were interviewed more than half were
considered to be suitable for the job.

Slide 20
What is essential in an applicant?
49%
29%
25%
11%
9%
0% 10% 20% 30% 40% 50% 60%
Employability skills
Qualifications
Experience
Technical skills
Knowledge
Communication
Computer skills
People skills
Friendly
Motivation
Source: DEEWR, Survey of Employers’ Recruitment Experiences, March 2013
Basic employability skills Source: DEEWR, Survey of Employers’ Recruitment Experiences, March 2013 Employers were asked whether there were any skills or personal qualities essential in an applicant. Some 49 per cent of responding employers said that some form of employability skill, such as communication, people skills or motivation, was essential for an applicant to be successful.

Slide 21
Informal Method Only
53%
47%
Source: DEEWR, Survey of Employers’ Recruitment Experiences, March 2013
Informal recruitment methodsLess competition for job seekers
14.8 applicants per vacancy
3.2 applicants per vacancy
Formal method
Competition for vacancies by method of recruitment Source: DEEWR, Survey of Employers’ Recruitment Experiences, March 2013 Almost half of employers used informal methods only to fill vacancies in their most recent recruitment round. Informal methods include using worked of mouth, putting a sign in the window and considering applicants who asked them if they had any job vacancies.
Slide 22
*Chefs *Registered Nurses
Early Childhood (Pre-Primary School) Teachers
Generalist Medical Practitioners
*Metal Fitters and MachinistsArchitectural, Building and Surveying
Technicians
*Bar Attendants and Baristas Café Workers
Child Carers *Truck Drivers
Source: DEEWR, Survey of Employers’ Recruitment Experiences, March 2013
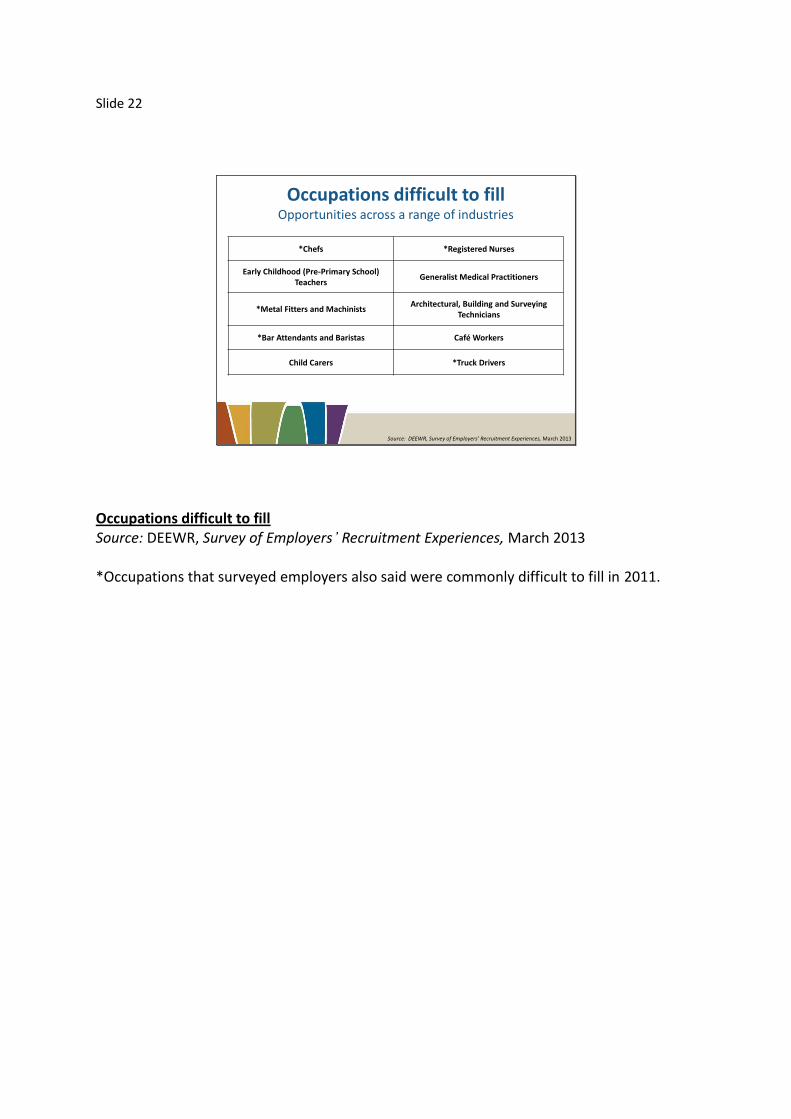
Occupations difficult to fillOpportunities across a range of industries
Occupations difficult to fill Source: DEEWR, Survey of Employers’ Recruitment Experiences, March 2013 *Occupations that surveyed employers also said were commonly difficult to fill in 2011.

Slide 23
Recruitment expectationsExpected change to staff numbers, next 12 months
16%
10%
70%
0%
20%
40%
60%
80%
Increase Decrease Remain the same
Source: DEEWR, Survey of Employers’ Recruitment Experiences, March 2013
Subdued recruitment expectations Source: DEEWR, Survey of Employers’ Recruitment Experiences, March 2013
Slide 24
Employers most concerned about economySingle greatest concern
Source: DEEWR, Survey of Employers’ Recruitment Experiences, March 2013
11%
6%
55%
0%
10%
20%
30%
40%
50%
60%
No concerns Recruitment or retentiondifficulty/ skill shortages
Demand/economy
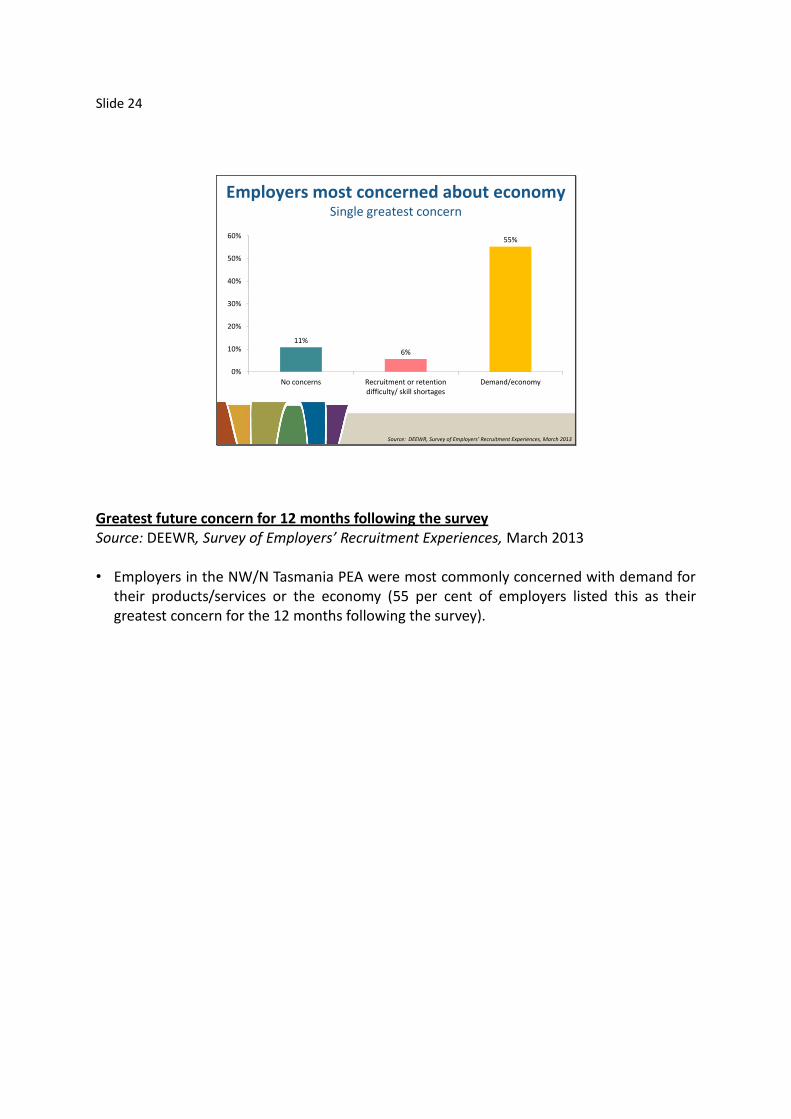
Greatest future concern for 12 months following the survey Source: DEEWR, Survey of Employers’ Recruitment Experiences, March 2013 • Employers in the NW/N Tasmania PEA were most commonly concerned with demand for
their products/services or the economy (55 per cent of employers listed this as their greatest concern for the 12 months following the survey).

Slide 25
Conclusion• Labour market conditions soft across the PEA
– High unemployment, low labour force participation and decline in full-time jobs
– Persistently high unemployment in Burnie
• Challenges– Low educational attainment levels; youth disengagement; jobless families; long-term
unemployment
• Opportunities exist– Strongly growing industries (Health Care and Social Assistance) and ageing workforce
– Broad range of occupations difficult to fill
– Vacancies still being advertised
• Job seekers need to be job ready– Apprenticeships and work experience; education and training; employability skills.
• Collaboration amongst all key stakeholders
Conclusion • Labour market conditions soft across the PEA
• High unemployment, low labour force participation and decline in full-time jobs • Persistently high unemployment in Burnie
• Challenges • Low educational attainment levels; youth disengagement; jobless families; long-
term unemployment • Opportunities exist
• Strongly growing industries (Health Care and Social Assistance) and ageing workforce
• Broad range of occupations difficult to fill • Vacancies still being advertised
• Job seekers need to be job ready • Apprenticeships and work experience; education and training; employability skills.
• Collaboration amongst all key stakeholders
Slide 26
Further Information
– www.deewr.gov.au/regionalreports
– www.deewr.gov.au/lmip
– www.deewr.gov.au/SkillShortages
– www.deewr.gov.au/australianjobs
– www.joboutlook.gov.au
– www.deewr.gov.au/news/aussie-jobs-publication-highlights-employment-growth
Further Information More information on labour market conditions and other research on small areas can be found on these web sites:
• www.deewr.gov.au/RegionalReports • www.deewr.gov.au/LMIP • www.deewr.gov.au/SkillShortages • www.deewr.gov.au/australianjobs • www.joboutlook.gov.au
Thank you.

Slide 27
1. Final Slide 1: Department Emblem