Embed Size (px)
Citation preview
www.tropicalplantresearch.com 609 Received: 11 May 2020 Published online: 31 December 2020
https://doi.org/10.22271/tpr.2020.v7.i3.075
7(3): 609–618, 2020
DOI: 10.22271/tpr.2020.v7.i3.075
ISSN (Online): 2349-1183; ISSN (Print): 2349-9265
TROPICAL PLANT RESEARCH The Journal of the Society for Tropical Plant Research
Research article
Slenderness coefficient models for tree species in Omo biosphere
reserve, South-western Nigeria
A. O. Oladoye1*, P. O. Ige
2, N. Baurwa
1, Q. A. Onilude
3 and Z. T. Animashaun
3
1Federal University of Agriculture, Abeokuta, Nigeria 2University of Ibadan, Ibadan, Nigeria
3Forestry Research Institute of Nigeria, Ibadan, Nigeria
*Corresponding Author: [email protected] [Accepted: 17 November 2020]
Abstract: This study was carried out to aid the prediction of tree slenderness coefficient using
non-linear regression models for tree species in Omo Biosphere Reserve, Southwestern Nigeria.
Systematic line transect design was adopted for the study. Three transects were laid with four plots
on each transect at alternate positions which made a total of 12 sample plots (50 m × 50 m) in the
study area. Diameter at breast height (DBH), diameter at the top, diameter at the middle and
diameter at the base as well as total height and merchantable height of all trees were measured.
Descriptive statistics, Pearson’s correlation and regression analysis were adopted for the study.
The study showed that about 23.5% of the trees in the study area are susceptible to wind-throw
damage. Correlation analysis revealed that DBH is a better predictor of Slenderness coefficient
than other tree growth characteristics. Six non-linear models were adopted for the tree slenderness
coefficient prediction. The best models were selected based on the highest Adj.R2, lowest AIC and
SEE values. Normal logarithmic equation SLC = 30.72 + (-41.21) In(D) was selected as the
candidate model for the pooled data. The same candidate model (Natural logarithm) was selected
for both the Desplatsia lutea and Strombosia pustulata species with the equation SLC = -0.04 + (-
63.82) In(D) and SLC = 22.12 + (-51.40) In(D) respectively while exponential model with
equation SLC = 170.94e(-1.93) was selected for Sterculia rhinopetala. These equations were
recommended for predicting slenderness coefficient for each of the tree species in Omo Biosphere
with apparently valid potentials for enhancing reasonable quantification of the stands’ stability.
Keywords: Non-linear models - Omo biosphere reserve - Slenderness coefficient - Tree growth
characteristics.
[Cite as: Oladoye AO, Ige PO, Baurwa N, Onilude QA & Animashaun ZT (2020) Slenderness coefficient
models for tree species in Omo biosphere reserve, South-western Nigeria. Tropical Plant Research 7(3): 609–
618]
INTRODUCTION
Trees show considerable variations and flexibility in their shape and size of crowns, height and trunk
diameters (Givnish 2002). These are governed by an inherited developmental tendency, which may in turn be
altered by the environment where the tree develops. The size of a tree canopy and its height above the ground is
significant to a tree in that it determines the aggregate sum of light that the tree intercepts for photosynthesis
(Midgley 2003). The adaptive significance of tree height, have been through a mathematical model, that the
higher a tree is, the more light it captures over the span of the day (Jahnke & Lawrence 1965). The tree trunk
size likewise has its own adaptive significance to a tree. It must be sufficiently able to withstand the forces that
act on it and the force exerted on it by the wind. These forces are the weight of the tree and the drag exerted on
it by the wind, as demonstrated by Fraser (1962). Experimentally, wind has been found to be substantially more
significant in determining how thickness of tree trunk is fundamental to tree stability (Onilude & Adesoye
2007).
The most promising approaches for determining tree and stand stability to wind throw are those which
incorporate tree stability characteristics (e.g., slenderness coefficient) with local stand (e.g., average tree height),

Oladoye et al. 2020
www.tropicalplantresearch.com 610
site, topography, and windiness features (Navratil et al. 1994). Wang et al. (1998) stated that susceptibility of a
tree to wind damage is principally influenced by the slenderness coefficient or taper of the tree. The slenderness
coefficient of a tree is defined as the ratio of total height (H) to diameter outside bark at 1.3 m above ground
(DBH) when both H and DBH are measured in the same unit (Wang et al. 1998). Eguakun & Oyebade 2015
opined the existence of linear relationship between the slenderness coefficient of a tree and the risk of stem
breakage or tree fall due to abiotic factors such as the wind.
However, besides basic structural variables such as the basal area, tree slenderness is also a measure
recognized as a good indicator of the wind-throw stability of trees. The shape of trees can be influenced by
silvicultural interventions, if applied early in the stand development. It indicates the shape of trees and together
with tree vitality provides insight into the general stability of planted forests (Dodan & Perić 2019). Tree
slenderness coefficient (TSC) often serves as an index of tree stability, or the resistances to wind throw (Navratil
1996, Onilude & Adesoye 2007). A low slenderness coefficient value typically indicates a longer crown, lower
centre of gravity, and a better developed root system. Therefore, trees with higher slenderness coefficient values
(slender trees) are much more susceptible to wind damage. Actions improving the stability of trees and stands
could considerably limit these damages. Because of tree slenderness coefficient importance for indexing tree
resistance to wind throw, it is therefore crucial and important to understand slenderness of trees, considered to
be a measure of their stability, especially for most of the indigenous tree species available in Omo biosphere as
well as developing models that can predict these values.
One of the major drawbacks of forestry development in Nigeria is the dearth of periodic information on tree
stands condition. However, sustainable management of forest stands can only be ensured if current and reliable
information on growth condition of the stand is available which can be used by forest managers to provide
accurate and timely information on current growing stock. A good management of the Omo Biosphere Reserve,
Soutwestern Nigeria must have on the table, current, accurate and up to date information on the growing tree
species in their forest, to help them possibly plan for the future growth potentials of the trees. The objective of
this study is to develop, estimate and assess slenderness coefficient for the tree species in Omo Biosphere
Reserve, Southwestern Nigeria to develop slenderness coefficient predictive models that can be used for better
wind-throw hazard management.
MATERIALS AND METHODS
Study area
Figure 1. Map of the Study Area (Omo Biosphere Reserve).
Tropical Plant Research (2020) 7(3): 609–618
www.tropicalplantresearch.com 611
Omo Biosphere Reserve is located between latitudes 6°38' to 7° 05' N and longitudes 4° 19' and 4° 10' E in
Ijebu Area of Ogun State, Southwest of Nigeria (Badejo & Ola-Adams 2000; Fig. 1). The topography of the area
is undulating dominated by slopes of up to 15% and elevation reaches between 15 m and 150 m above sea level.
The uneven topography has numerous small hills rising to 300 m which are dissected by tributaries of Omo,
Shasha and Oluwa rivers.
Omo Biosphere reserve is located within the tropical wet and dry climate, characterized by two rainfall
peaks with a relatively less humidity period usually in the month of August. The mean annual rainfall is about
175 mm and mean relative humidity is 80%. Mean daily temperature is 26.4ºC. Relative humidity is generally
around 95% at dawn, normally the time of minimum temperature. Soil temperature measured at different depths
(100 mm, 200 mm and 300 mm) showed variation in terms of both depth and time of days.
In many places schist’s (mainly low grades muscovite-biotite) and gneisses can be found. Good flow
banding and folding are also visible, usually on outcrops on top of hills. In other places homogeneous outcrops
of Granodiorite can be found as well as quartzite’s outcrops in one or two locations. About 80% of the area are
well-drained into the watershed of Omo River,the major river that traverses the area and the river Oni which
forms the eastern and southern boundaries. The area is underlain by metamorphic rocks of the pre-cambian
basement complex. The soils are predominantly ferruginous tropical.
Sampling design and data processing
50 m 50 m
100 m
520 m 520 m
20 m 20 m
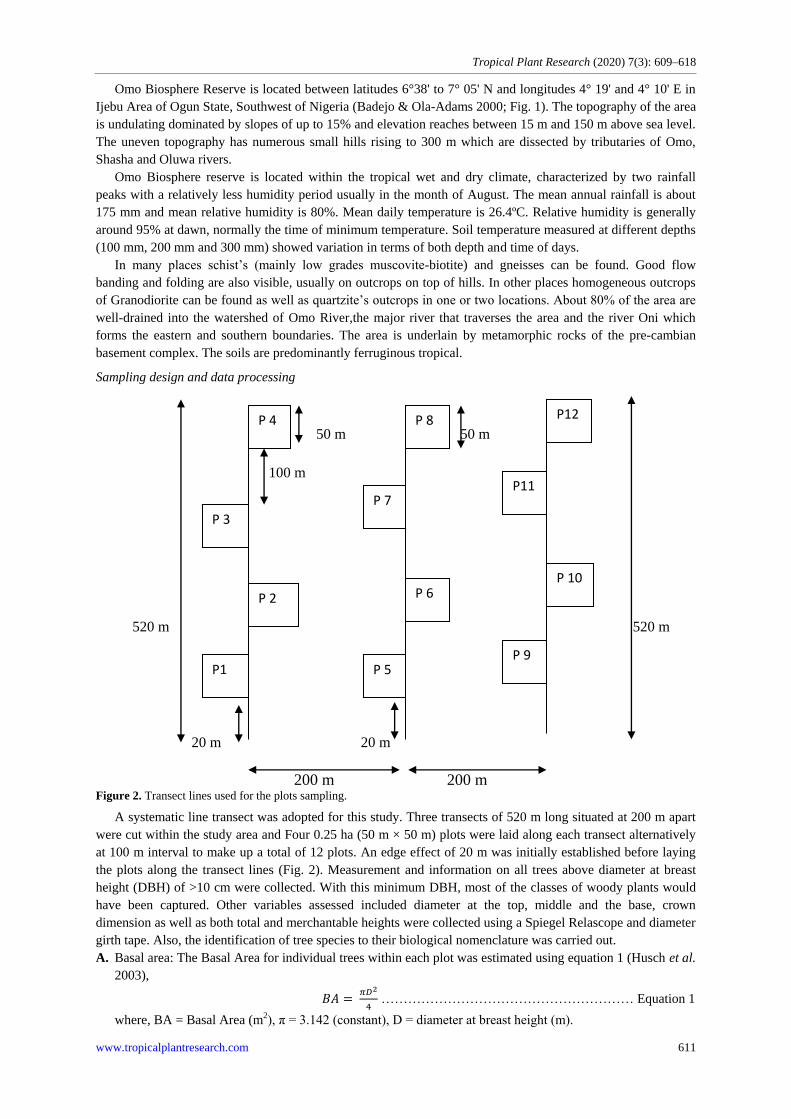
200 m 200 m Figure 2. Transect lines used for the plots sampling.
A systematic line transect was adopted for this study. Three transects of 520 m long situated at 200 m apart
were cut within the study area and Four 0.25 ha (50 m × 50 m) plots were laid along each transect alternatively
at 100 m interval to make up a total of 12 plots. An edge effect of 20 m was initially established before laying
the plots along the transect lines (Fig. 2). Measurement and information on all trees above diameter at breast
height (DBH) of >10 cm were collected. With this minimum DBH, most of the classes of woody plants would
have been captured. Other variables assessed included diameter at the top, middle and the base, crown
dimension as well as both total and merchantable heights were collected using a Spiegel Relascope and diameter
girth tape. Also, the identification of tree species to their biological nomenclature was carried out.
A. Basal area: The Basal Area for individual trees within each plot was estimated using equation 1 (Husch et al.
2003),
………………………………………………… Equation 1
where, BA = Basal Area (m2), π = 3.142 (constant), D = diameter at breast height (m).
P 4
P 3
P 2
P1
P 8
P 7
P 6
P 5
P12
P11
P 10
P 9

Oladoye et al. 2020
www.tropicalplantresearch.com 612
B. Stem volume: The Stem Volume of individual trees within each plot was estimated using the processed
Newton’s formula:
(
)
……………………………………… Equation 2
where SV= stem volume of individual tree (m2), π = 3.142 (constant), H =Merchantable height (m), Db=
diameter at the base (m), Dm= diameter at the middle (m), Dt =diameter at the top (m).
C. Slenderness coefficient: The ratio of total height (H) to diameter outside bark at 1.3 m above ground (DBH)
when both H and DBH are measured in the same units.
………………………………….. Equation 3
In silvicultural studies, the tree slenderness coefficient often serves as an index of tree stability, or the
resistance to windthrow (Onilude & Adesoye 2007). According to Navratil (1995), Onilude & Adesoye (2007)
and Ige (2017) slenderness coefficient values can be classified into three categories. Low slenderness coefficient
value indicates high resistance to wind damage (good stand stability) while high slenderness coefficient show
low resistance to wind throw, which can cause damage to trees. The trees in the moderate categories will show
resistance to high tree velocity though can be slightly or partially damaged.
SLC values > 99…………… High slenderness coefficient
70 < SLC values > 99……….Moderate slenderness coefficient
SLC values < 70 …………….Low slenderness coefficient
Data analysis
Descriptive statistics, Pearson’s correlation and regression analysis were used to analysed the measured data.
Pearson’s correlation analysis was done to investigate the nature of the relationship between the dependent and
selected independent tree variables, while regression analysis was used to identify appropriate functional
relationships between the independent and dependent variables.
Development of slenderness coefficient (SLC) model functions
In the study, Non- linear models (four exponential models and two growth models) were proposed to be used
as the candidate models for prediction of SLC for three (3) most abundant tree species in Omo biosphere reserve
as adopted by Ige (2017). The model functions were developed and tested to predict tree slenderness coefficient
using Curve Expert Professional 2.6.5. The tree slenderness coefficient was used as a function of tree growth
characteristics. DBH was used as the main predictor since it is one of the easiest growth variables that can be
easily measured on the field (Ige 2017). In the model functions, SLC was used as the dependent variable while
DBH was used as the independent variable (Table 1).
Table 1. List of selected SLC model functions.
Model number Model name Equation
Exponential models
7 Exponential
8 Modified Exponential
9 Natural Logarithm 10 Reciprocal Logarithm
Growth models
11 Exponential Association 2
12 Saturation Growth Rate Note: SLC- Slenderness coefficient, D- Diameter at breast height (DBH (m)), e-
Exponential, ln- Natural logarithm, a and b- Model parameters.
Evaluation of the fitted models
The evaluation of the fitted models was based on the numerical analysis of the residuals. The evaluation was
based on the least values of the standard error of estimate (SEE), least values of Akaike information criterion
(AIC) and the highest values of adjusted coefficient of determination (Adj.R2). They are mathematically
expressed as follows:
√∑ ̂
…………………………….…………… Equation 4
( )
…………………………………… Equation 5
Tropical Plant Research (2020) 7(3): 609–618
www.tropicalplantresearch.com 613
…………………………….. Equation 6
Where,
𝑌𝑖= observed value of Y for observation i
�̂�i= predicted value i
n =the total number of observations 𝑌𝑖 (trees) used in fitting the model,
K = Number of estimated parameters in the model
Log-likelihood is a measure of model fit
The overall best candidate model was validated using an independent data of about one-third of the data used
for the model calibration and fitting. The t-test for paired samples was adopted as the validation method in this
study. In all statistical analyses, 95% confidence level was used for statistical significance.
RESULTS AND DISCUSSION
Summary of the descriptive Statistics for tree growth variables
According to Avery & Burkhart (2002), forest management decisions are predicated on information about
current and future resource conditions. For this study, the three most common tree species that were found for
the study included Desplatsia lutea A. Chev. ex Hutch. & Dalziel D, Sterculia rhinopetala K Schum. and
Strombosia pustulata Oliv. with a frequency of 28, 44 and 54 stems ha-1 respectively. Before the model
development, correlation analysis was carried out to give an insight on the kind of association between the SLC
and other tree growth variables.
Table 2. Summary of pooled tree growth characteristics observed in the study area.
Variables Minimum Maximum Mean
DBH (cm) 10 180 36.3±0.01
MHT (m) 4 36 15.9±0.35
THT (m) 7.2 45 23.2±0.39
Db (cm) 7.5 300 46.0±0.02
Dm (cm) 20 95 18.9±0.01
Dt (cm) 22 56 11.0±0.00
BA (m2 ha-1) 0.008 2.531 0.158±0.01
VOL (m3 ha-1) 0.013 47.225 1.565±0.23
SLC 17.4 180 79.4±1.64 Note: DBH- Diameter at breast height, MHT- Merchantable height, THT- Total height,
Db- Diameter at the base, Dm- Diameter at the middle, Dt- Diameter at the top, CL-
Crown length, BA- Basal area, VOL- Volume, SLC- Slenderness coefficient.
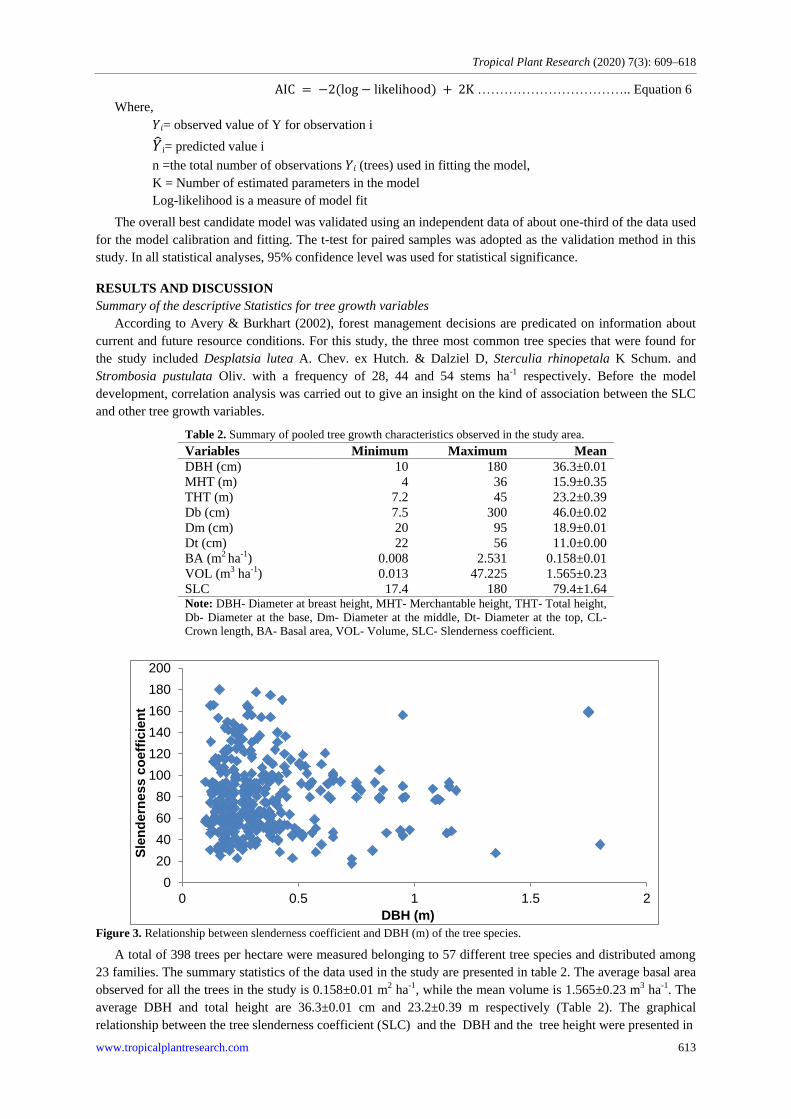
Figure 3. Relationship between slenderness coefficient and DBH (m) of the tree species.
A total of 398 trees per hectare were measured belonging to 57 different tree species and distributed among
23 families. The summary statistics of the data used in the study are presented in table 2. The average basal area
observed for all the trees in the study is 0.158±0.01 m2 ha-1, while the mean volume is 1.565±0.23 m3 ha-1. The
average DBH and total height are 36.3±0.01 cm and 23.2±0.39 m respectively (Table 2). The graphical
relationship between the tree slenderness coefficient (SLC) and the DBH and the tree height were presented in
0
20
40
60
80
100
120
140
160
180
200
0 0.5 1 1.5 2
Sle
nd
ern
es
s c
oe
ffic
ien
t
DBH (m)

Oladoye et al. 2020
www.tropicalplantresearch.com 614
figure 3 and 4 respectively.
Figure 4. Relationship between slenderness coefficient and Tree height (m) of the tree species.
Correlation matrix
Correlation analysis was used to show the kind of relationship that exists between tree slenderness
coefficient and the tree growth characteristics for the trees species in the study bearing in mind the possibility of
spurious correlations between tree slenderness coefficient and the tree growth characteristics. The result of the
correlation analysis is presented in table 3. The result revealed a negative correlation between the slenderness
coefficient and the growth characteristics with values of DBH (-0.645), Tree height (-0.091) while basal area
and volume were (-0.511) and (-0.373) respectively (Table 3).
Table 3. Correlation matrix between SLC and the growth variables.
Tree variables Slenderness coefficient values
(SLC) (Sig. = 5%)
DBH -0.645*
Tree total height -0.091
Merchantable height -0.127*
BA -0.511*
Vol -0.373*
Cl -0.049 Note: *- Significant, DBH- Diameter at breast height, BA- Basal
Area, Vol.- Volume, Cl- Crown length.
Slenderness coefficient classification
Most trees species (44.2%) in the study were observe to be within low slenderness coefficient (<70) (Fig. 5),
this indicates good stability during high wind velocity, about 32.2% of the trees had moderate slenderness
category (70–90). Although trees with moderate slenderness such usually show resistance to high wind velocity,
however, it may be thrown off by excessive wind velocity. For the high slenderness coefficient, 23.6% of the
trees species were observed in the forest. This indicated that 23.6% of the trees in the study have low resistance
to wind-throw, thus, can be thrown off whenever there is heavy wind throw (Fig. 5).
Figure 5. Percentage (%) distribution of Slenderness coefficient values for the tree species.
0
20
40
60
80
100
120
140
160
180
200
0 10 20 30 40 50
Sle
nd
ern
es
s c
oe
ffii
cie
nt
Tree height (m)
0
10
20
30
40
50
< 70 70-99 > 99
Sle
nd
ern
ess c
oeff
icie
nt
(%)
Slenderness coefficient categories
Tropical Plant Research (2020) 7(3): 609–618
www.tropicalplantresearch.com 615
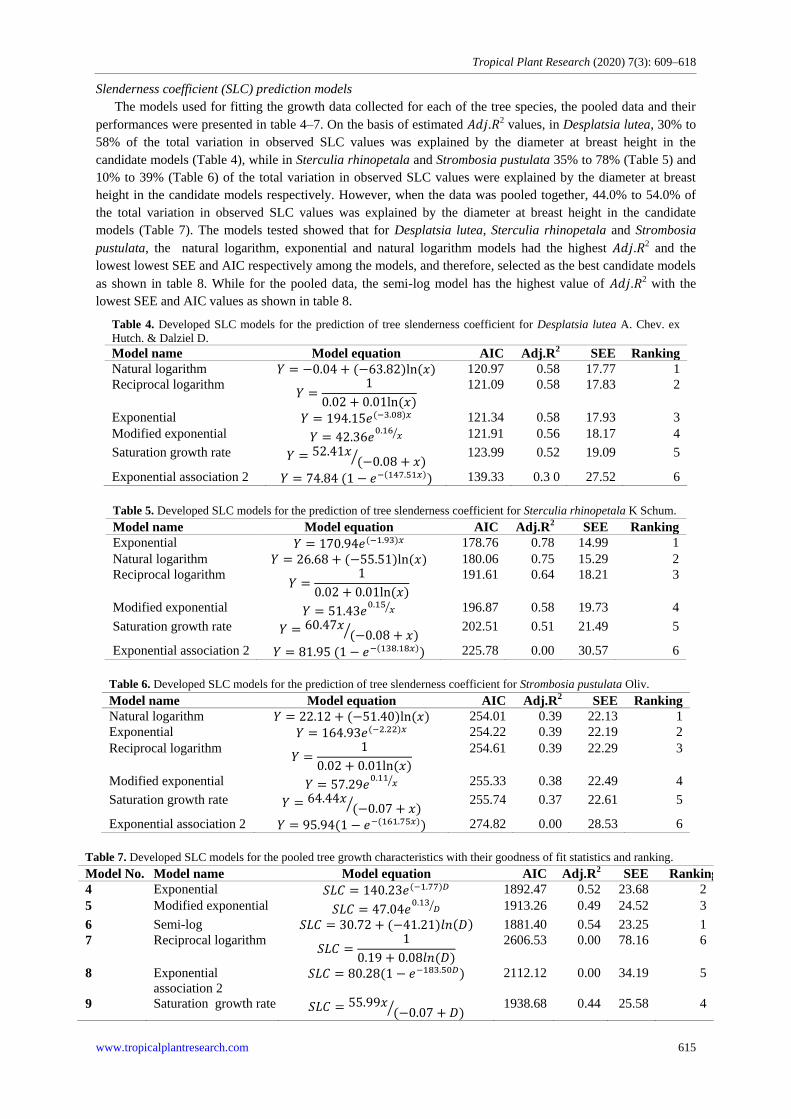
Slenderness coefficient (SLC) prediction models
The models used for fitting the growth data collected for each of the tree species, the pooled data and their
performances were presented in table 4–7. On the basis of estimated . 2 values, in Desplatsia lutea, 30% to
58% of the total variation in observed SLC values was explained by the diameter at breast height in the
candidate models (Table 4), while in Sterculia rhinopetala and Strombosia pustulata 35% to 78% (Table 5) and
10% to 39% (Table 6) of the total variation in observed SLC values were explained by the diameter at breast
height in the candidate models respectively. However, when the data was pooled together, 44.0% to 54.0% of
the total variation in observed SLC values was explained by the diameter at breast height in the candidate
models (Table 7). The models tested showed that for Desplatsia lutea, Sterculia rhinopetala and Strombosia
pustulata, the natural logarithm, exponential and natural logarithm models had the highest . 2 and the
lowest lowest SEE and AIC respectively among the models, and therefore, selected as the best candidate models
as shown in table 8. While for the pooled data, the semi-log model has the highest value of . 2 with the
lowest SEE and AIC values as shown in table 8.
Table 4. Developed SLC models for the prediction of tree slenderness coefficient for Desplatsia lutea A. Chev. ex
Hutch. & Dalziel D.
Model name Model equation AIC Adj.R2
SEE Ranking
Natural logarithm 𝑌 120.97 0.58 17.77 1
Reciprocal logarithm 𝑌
121.09 0.58 17.83 2
Exponential 𝑌 121.34 0.58 17.93 3
Modified exponential 𝑌
⁄ 121.91 0.56 18.17 4
Saturation growth rate 𝑌 ⁄ 123.99 0.52 19.09 5
Exponential association 2 𝑌 139.33 0.3 0 27.52 6
Table 5. Developed SLC models for the prediction of tree slenderness coefficient for Sterculia rhinopetala K Schum.
Model name Model equation AIC Adj.R2
SEE Ranking
Exponential 𝑌 178.76 0.78 14.99 1
Natural logarithm 𝑌 180.06 0.75 15.29 2
Reciprocal logarithm 𝑌
191.61 0.64 18.21 3
Modified exponential 𝑌
⁄ 196.87 0.58 19.73 4
Saturation growth rate 𝑌 ⁄ 202.51 0.51 21.49 5
Exponential association 2 𝑌 225.78 0.00 30.57 6
Table 6. Developed SLC models for the prediction of tree slenderness coefficient for Strombosia pustulata Oliv.
Model name Model equation AIC Adj.R2
SEE Ranking
Natural logarithm 𝑌 254.01 0.39 22.13 1
Exponential 𝑌 254.22 0.39 22.19 2
Reciprocal logarithm 𝑌
254.61 0.39 22.29 3
Modified exponential 𝑌
⁄ 255.33 0.38 22.49 4
Saturation growth rate 𝑌 ⁄ 255.74 0.37 22.61 5
Exponential association 2 𝑌 274.82 0.00 28.53 6
Table 7. Developed SLC models for the pooled tree growth characteristics with their goodness of fit statistics and ranking.
Model No. Model name Model equation AIC Adj.R2
SEE Ranking
4 Exponential 1892.47 0.52 23.68 2
5 Modified exponential
⁄ 1913.26 0.49 24.52 3
6 Semi-log 1881.40 0.54 23.25 1
7 Reciprocal logarithm
2606.53 0.00 78.16 6
8 Exponential
association 2 2112.12 0.00 34.19 5
9 Saturation growth rate ⁄ 1938.68 0.44 25.58 4
Oladoye et al. 2020
www.tropicalplantresearch.com 616
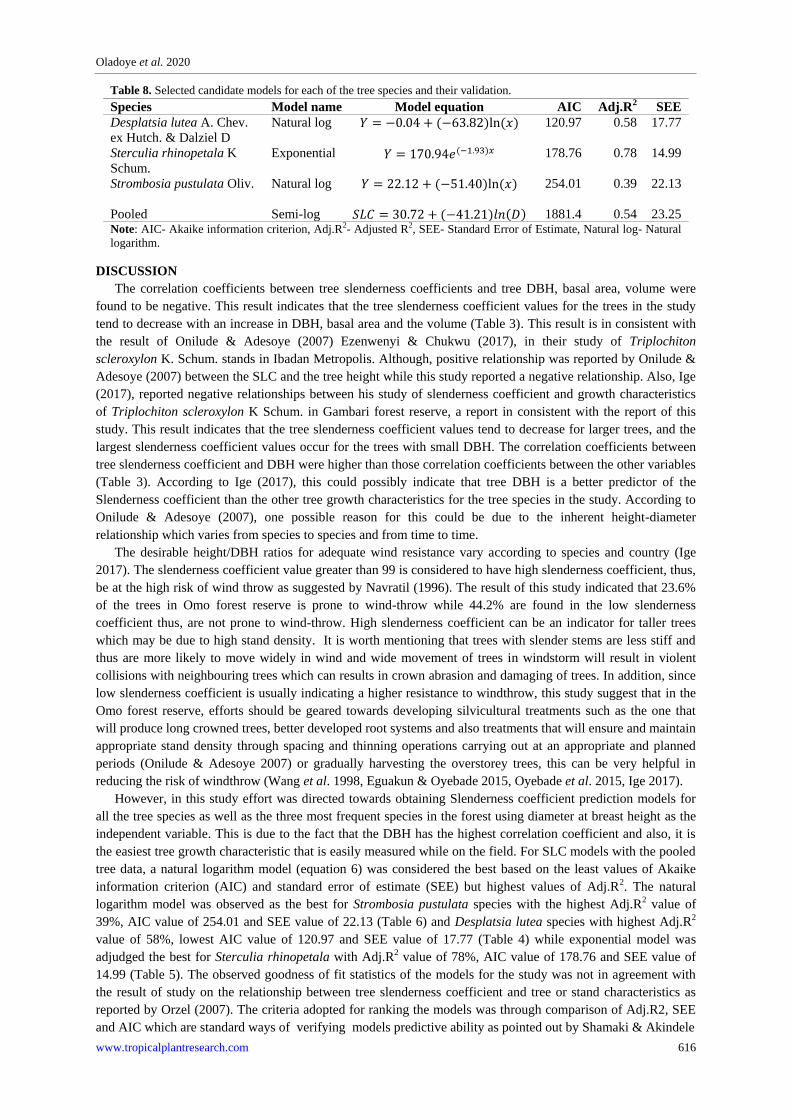
Table 8. Selected candidate models for each of the tree species and their validation.
Species Model name Model equation AIC Adj.R2
SEE
Desplatsia lutea A. Chev.
ex Hutch. & Dalziel D
Natural log 𝑌 120.97 0.58 17.77
Sterculia rhinopetala K
Schum.
Exponential 𝑌 178.76
0.78
14.99
Strombosia pustulata Oliv. Natural log 𝑌 254.01
0.39 22.13
Pooled Semi-log 1881.4 0.54 23.25 Note: AIC- Akaike information criterion, Adj.R2- Adjusted R2, SEE- Standard Error of Estimate, Natural log- Natural
logarithm.
DISCUSSION
The correlation coefficients between tree slenderness coefficients and tree DBH, basal area, volume were
found to be negative. This result indicates that the tree slenderness coefficient values for the trees in the study
tend to decrease with an increase in DBH, basal area and the volume (Table 3). This result is in consistent with
the result of Onilude & Adesoye (2007) Ezenwenyi & Chukwu (2017), in their study of Triplochiton
scleroxylon K. Schum. stands in Ibadan Metropolis. Although, positive relationship was reported by Onilude &
Adesoye (2007) between the SLC and the tree height while this study reported a negative relationship. Also, Ige
(2017), reported negative relationships between his study of slenderness coefficient and growth characteristics
of Triplochiton scleroxylon K Schum. in Gambari forest reserve, a report in consistent with the report of this
study. This result indicates that the tree slenderness coefficient values tend to decrease for larger trees, and the
largest slenderness coefficient values occur for the trees with small DBH. The correlation coefficients between
tree slenderness coefficient and DBH were higher than those correlation coefficients between the other variables
(Table 3). According to Ige (2017), this could possibly indicate that tree DBH is a better predictor of the
Slenderness coefficient than the other tree growth characteristics for the tree species in the study. According to
Onilude & Adesoye (2007), one possible reason for this could be due to the inherent height-diameter
relationship which varies from species to species and from time to time.
The desirable height/DBH ratios for adequate wind resistance vary according to species and country (Ige
2017). The slenderness coefficient value greater than 99 is considered to have high slenderness coefficient, thus,
be at the high risk of wind throw as suggested by Navratil (1996). The result of this study indicated that 23.6%
of the trees in Omo forest reserve is prone to wind-throw while 44.2% are found in the low slenderness
coefficient thus, are not prone to wind-throw. High slenderness coefficient can be an indicator for taller trees
which may be due to high stand density. It is worth mentioning that trees with slender stems are less stiff and
thus are more likely to move widely in wind and wide movement of trees in windstorm will result in violent
collisions with neighbouring trees which can results in crown abrasion and damaging of trees. In addition, since
low slenderness coefficient is usually indicating a higher resistance to windthrow, this study suggest that in the
Omo forest reserve, efforts should be geared towards developing silvicultural treatments such as the one that
will produce long crowned trees, better developed root systems and also treatments that will ensure and maintain
appropriate stand density through spacing and thinning operations carrying out at an appropriate and planned
periods (Onilude & Adesoye 2007) or gradually harvesting the overstorey trees, this can be very helpful in
reducing the risk of windthrow (Wang et al. 1998, Eguakun & Oyebade 2015, Oyebade et al. 2015, Ige 2017).
However, in this study effort was directed towards obtaining Slenderness coefficient prediction models for
all the tree species as well as the three most frequent species in the forest using diameter at breast height as the
independent variable. This is due to the fact that the DBH has the highest correlation coefficient and also, it is
the easiest tree growth characteristic that is easily measured while on the field. For SLC models with the pooled
tree data, a natural logarithm model (equation 6) was considered the best based on the least values of Akaike
information criterion (AIC) and standard error of estimate (SEE) but highest values of Adj.R2. The natural
logarithm model was observed as the best for Strombosia pustulata species with the highest Adj.R2 value of
39%, AIC value of 254.01 and SEE value of 22.13 (Table 6) and Desplatsia lutea species with highest Adj.R2
value of 58%, lowest AIC value of 120.97 and SEE value of 17.77 (Table 4) while exponential model was
adjudged the best for Sterculia rhinopetala with Adj.R2 value of 78%, AIC value of 178.76 and SEE value of
14.99 (Table 5). The observed goodness of fit statistics of the models for the study was not in agreement with
the result of study on the relationship between tree slenderness coefficient and tree or stand characteristics as
reported by Orzel (2007). The criteria adopted for ranking the models was through comparison of Adj.R2, SEE
and AIC which are standard ways of verifying models predictive ability as pointed out by Shamaki & Akindele

Tropical Plant Research (2020) 7(3): 609–618
www.tropicalplantresearch.com 617
(2013) Onilude et al. (2015) and Ige (2017).
Table 9. Model validation table for A. Chev. ex Hutch. & Dalziel D. trees in the study area with the t-test result.
Model name Model equation T-Value Df P-Value Remark
Natural logarithm 𝑌 2.18 12 0.77 ns
Reciprocal logarithm 𝑌
2.18 12 0.75 ns
Exponential 𝑌 2.18 12 0.79 ns
Modified exponential 𝑌
⁄ 2.18 12 0.61 ns
Saturation growth rate 𝑌 ⁄ 2.18 12 0.66 ns
Exponential association 2 𝑌 2.18 12 0.64 ns
Note: ns- Not Significant; s- Significant.
Table 10. Model validation table for Sterculia rhinopetala K Schum. trees in the study area with the t-test result.
Model name Model equation T-Value Df P-Value Remark
Exponential 𝑌 2.09 20 0.94 ns
Natural logarithm 𝑌 2.09 20 0.90 ns
Reciprocal logarithm 𝑌
2.09 20 0.00 s
Modified exponential 𝑌
⁄ 2.09 20 0.72 ns
Saturation growth rate 𝑌 ⁄ 2.09 20 0.64 ns
Exponential association 2 𝑌 2.09 20 0.28 ns
Note: ns- Not Significant; s- Significant.
Table 11. Model validation table for Strombosia pustulata Oliv. trees in the study area with the t-test result.
Model name Model equation T-Value Df P-Value Remark
Natural logarithm 𝑌 2.06 24 0.56 ns
Exponential 𝑌 2.06 24 0.61 ns
Reciprocal logarithm 𝑌
2.06 24 0.05 ns
Modified exponential 𝑌
⁄ 2.06 24 0.37 ns
Saturation growth rate 𝑌 ⁄ 2.06 24 0.27
ns
Exponential association 2 𝑌 2.06 24 0.03 ns
Note: ns- Not Significant; s- Significant.
Table 12. Model validation table with t-test result for the pooled data in the study area.
S.N. Model Name Model Equation T-Value Df P-Value Remark
1 Exponential 𝑌 1.97 196 0.17 ns
2 Modified exponential 𝑌
⁄ 1.97 196 0.33 ns
3 Natural logarithm 𝑌 1.97 196 0.16 ns
4 Reciprocal logarithm 𝑌
1.97 196 0.00 s
5 Exponential association 2 𝑌 1.97 196 0.09 ns
6 Saturation growth rate 𝑌 ⁄ 1.97 196 0.34 ns
Note: ns- Not Significant; s- Significant.
The results of the t-test used for the validation of the models (Table 9–12) at 95% probability levels shows
that there is no significant difference (p>0.05) between the predicted and observed values except for the
reciprocal logarithm model in Sterculia rhinopetala (Table 10) and in the pooled data (Table 12) which have a
significant difference between their observed and predicted values for SLC. That is, the independent dataset
used for the validation are not significantly different from the fitting dataset except in the reciprocal logarithm
model in table 10 and 12.
CONCLUSION
The study revealed that about 23.4% of the trees in the study area are susceptible to wind-throw damage.
Although, large percentage of the trees can still withstand wind-throw. DBH is a better predictor of the
Slenderness coefficient than the other tree growth characteristics for the tree species in the study. This study

Oladoye et al. 2020
www.tropicalplantresearch.com 618
further concluded that, the Slenderness coefficient for the tree species can be more accurately and precisely
predicted from the DBH using the selected model for each of the three most common tree species in the forest.
They are: Natural Logarithm model [Y = -0.04 + (-63.82) In(x)] for Desplatsia lutea; Exponential model [Y =
170.94e(-1.93)] for Sterculia rhinopetala and Natural Logarithm model [Y = 22.12 + (-51.40) In(x)] for
Strombosia pustulata while for the pooled data Semi-log function [Y = 30.72 + (-41.21) In(x)] hould be used.
These models are therefore recommended for the management of Omo Biosphere Reserve.
REFERENCES
Avery TE & Burkhart HE (2002) Forest measurements, 5th edition. McGraw-Hill, New York.
Badejo MA & Ola-Adams BA (2000) Abundance and Diversity of Soil mites of Frgamented habitats in a
biosphere reserve in southern Nigeria. Pesquisa Agropecuária Brasileira 35(11): 212–218.
Dodan M & Perić S (2019) Windthrow Resistance of Norway Spruce (Picea abies (L.) Karst.) Forest Cultures -
Preliminary Results. South-east European Forestry 10(1): 77–88.
Eguakun FS & Oyebade BA (2015) Linear and nonlinear slenderness coefficient models for Pinus caribaea
(Morelet) stands in southwestern Nigeria. IOSR Journal of Agriculture and Veterinary Science 8(3): 26–30.
Ezenwenyi JU & Chukwu O (2017) Effects of slenderness coefficient in crown area prediction for Tectona
grandis Linn. f. in Omo Forest Reserve, Nigeria, Current Life Science 3(4): 65–71.
Fraser AI (1962) Wind tunnel studies of the forces acting on the crown of small trees. Report on Forest
Research 4: 178–183.
Givnish TJ (2002) Ecological constraints on the evolution of plasticity in plants. Evolutionary Ecology 16: 213–
242.
Husch B, Beers TW & Kershaw JA (2003) Forest mensuration, 4th edition. Wiley, 443 p.
Ige PO (2017) Relationship between tree slenderness coefficient and tree or stand growth characteristics for
Triplochiton scleroxylon K.Schum stands in Oniganbari forest reserve, Nigeria. Journal of Forestry
Research and Management 14(2): 166–180.
Jahnke LS & Lawrence DB (1965) Influence of Photosynthetic Crown structure on potential productivity of
vegetation, based primarily on Mathematical models. Ecology 46: 319–326.
Midgley JJ (2003) Is bigger better in plants? The hydraulic costs of increasing size in trees. Trends in Ecology
and Evolution 18: 5–6.
Navratil S (1995) Minimizing wind damage in alternative silvicultural systems in boreal mixedwoods. Publ. No.
Fo 42-91/124/1995E. Canadian Forest Service and Alberta Land and Forest service, Edmonton Alta.
Navratil S (1996) Silvicultural systems for managing deciduous and mixedwood stands with white spruce
understory. In: Comeau G & Thomas KD (eds) Silvicultural of temperate and boreal broadleaf-conifer
mixture. Ministry of Forests, Victoria, pp. 35–46.
Navratil S, Brace LG, Sauder EA & Lux S (1994) Silvicultural and harvesting options to favor immature white
spruce and aspen regeneration in boreal mixedwoods. Canadian Forest Service, Northwest Region, Northern
Forestry Centre, Edmonton, Alberta. Information Report NOR-X-337.
Onilude QA & Adesoye PO (2007) Relationship between tree slenderness coefficient and tree growth
characteristics of Triplochiton scleroxylon K.Schum stands in Ibadan metropolis. Obeche Journal 25(2): 16–
23.
Onilude QA, Akinyemi O, Julius AJ, Ogunremi OC & Ogunremi OR (2015) Modelling DBH and Crown
diameter for Triplochiton scleroxylon K. Schum in Nigeria. Academia Journal of Scientific Research 3(11):
178–183.
Oyebade BA, Eguakun FS, Egberibin A (2015) Tree slenderness coefficient (TSC) and tree growth
characteristics (TGCS) for Pinus caribaea in Omo Forest Reserve, Nigeria. IOSR Journal of Environmental
Science, Toxicology and Food Technology 9(3): 56–62
Orzel S (2007) A comparative analysis of slenderness of the main tree species of the Niepolomice Forest.
Electronic Journal of Polish Agricultural Universities. Series: Forestry 10(2): 13.
Shamaki SB & Akindele SO (2013) Volume estimation models from stump diameter for teak (Tectona grandis
Linn f.) plantation in Nimbia forest reserve, Nigeria. Journal of Environmental Science and Water Resources
2(3): 89–94.
Wang Y, Titus SJ & Lemay VM (1998) Relationship between Tree Slenderness Coefficients and Tree or Stand
Characteristics for Major species in Boreal Mixed Forest. Canadian Journal of Forest Research 28: 1171–
1183.