Embed Size (px)
Citation preview
SLEEP APNEA SIMULATION:AN EXPERIMENTAL ASSESSMENT OF PHARYNGEAL COLLAPSE
May ChengChristopher Phaneuf
Brian TovarDepartment of Mechanical Engineering
The Cooper Union for the Advancement of Science and ArtNew York, New York 10003
ABSTRACTIn this study, obstructive sleep apnea (OSA) was examined
from the perspective of a physical airway model capable of sim-ulating and measuring the behavior of the human pharynx. As acontinuation of previous research based on a rigid model pairedwith computational fluid dynamics analysis consisting of flowthrough stationary airway boundaries, the goal of this experi-ment is to take a new step in the progression toward an instru-mented, compliant airway model to parallel the development of adynamic, virtual model. Our efforts yielded a collapsible airwaymodel based on simplified geometry to capture the narrowed,highly flexible nature of the anatomy observed in conjunctionwith OSA. A data acquisition system was installed to interfacewith differential transducers for measuring pressures upstreamand downstream of the airway and flowrate. Findings suggesta need for adjustments to the instrumentation and further modelrefinement before proceeding to the casting and testing of a re-alistic airway. The project has reached a milestone in the pathtoward reliable simulations and has established an intermediatestep in the development of optimal methods for the realization ofa meaningful simulation.
NOMENCLATUREOSA Obstructive Sleep ApneaPDMS PolydimethylsiloxanePP PolypropylenePcrit Critical pressure
INTRODUCTIONObjective
The primary research objective is to advance the study of ob-structive sleep apnea through the construction of an experimen-tal flow apparatus capable of simulating the flow characteristicsof a compliant pharynx subject to abnormal tissue geometry andvariable collapsibility. The model should possess means of directcollapse observation, via materials with optical access and instru-mentation for measurements at critical upstream and downstreamlocations. Material choices should comply with MRI compatibil-ity criteria as well. A simplified airway will provide the founda-tion for future models possessing higher degrees of realism, de-tail, and variability. The physical model will serve to validate theresults of finite element models developed in parallel to ensureproper correlations.
BackgroundAn understanding of the basics of obstructive sleep apnea
syndrome and the context of our research helps to highlight ourmotivations behind each design choice and allows a clearer inter-pretation of our results.
The Physiology of OSA. Obstructive Sleep Apnea(OSA) is a sleep disorder effecting flow through the human air-way. Breathing is disrupted when adverse pressures cause thewalls of the airway to collapse. In order for the classificationof OSA to apply, as opposed to phenomena such as hypopnea,
1
a measure of severity must be considered. Several indices areused to assess severity, including arousal or disturbance index,apnea-hypopnea index, and apnea index [1]. These are usuallyprovided on an occurance per hour basis to capture a sense of fre-quency during a night’s sleep. A simple definition of apnea is atemporary cessation of breath. More precise definitions prescibeconditions such as stoppage of breath or less than 25% of a nor-mal breath for a period of 6 seconds or more [2]. A numberof anatomic risk factors are associated with this disease and in-volve changes in the upper airway craniofacial and soft tissuestructures, particularly the enlargement of the lateral pharyngealwalls, which studies have shown to be the most compliant tissueand a dominant risk factor among men [1,3]. The airway sizeis determined by the soft tissues of the pharynx (which includethe tonsils, soft palate, uvula, tongue, and the lateral pharyngealwalls) and the craniofacial bone structures (which include themaxilla, mandible and hyoid bone). Retrodisplacement of themandible and/or maxilla has been confirmed in 2/3 of OSA pa-tients [3]. Factors that contribute to the changes in these struc-tures are abnormalities in the upper airway structure, neck cir-cumference, and obesity [1]. In addition to anatomy-based con-tributors, reduction in dilator muscle tone plays an important rolein the collapsing behavior of the pharynx [3].
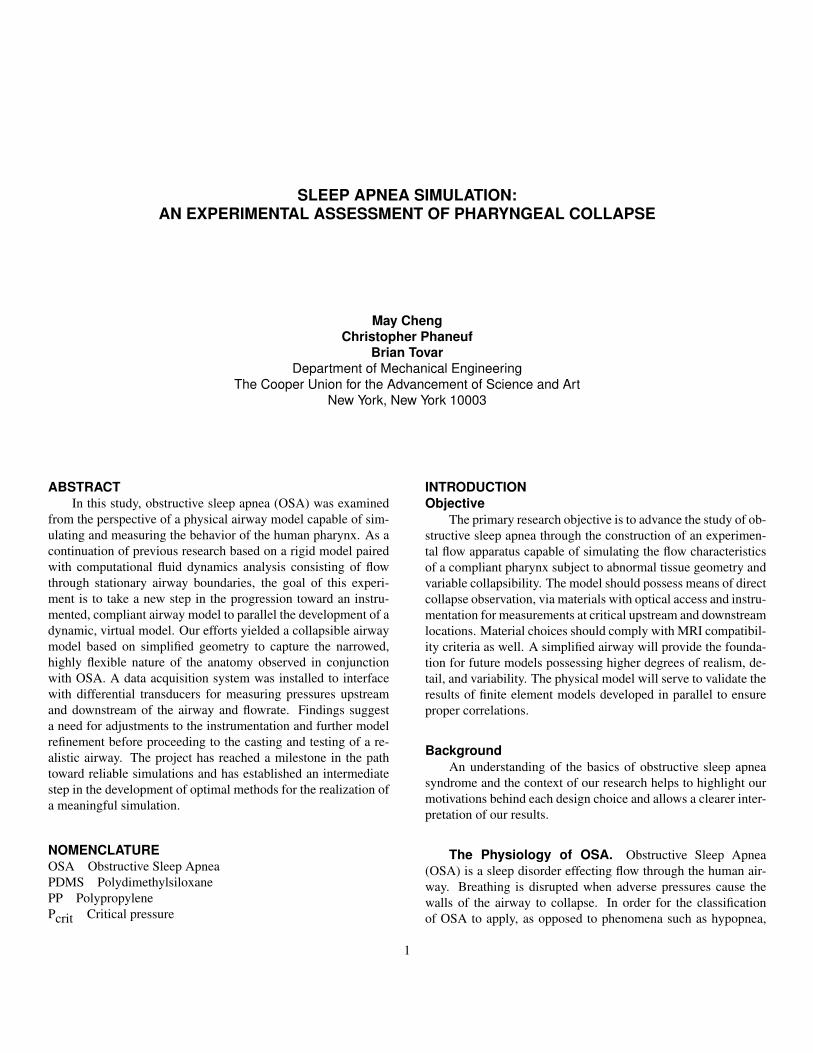
Figure 1. Sagittal cross-section of the upper airway. [4]
A separation of the pharynx into discrete sections can besummarized by the following division: 1) nasopharynx - nasalturbinates to the superior part of the soft palate, 2) oropharynx- soft palate to the epiglottis, and 3) hypopharynx - epiglottis tothe larynx. The oropharynx is the most widely discussed seg-ment, with statistics showing this area to be the site of collapsein 56-75% of OSA patients. Collapse at the base of the tongue
is reported for 25-44% of patients and 0-33% experience occlu-sion of the hypopharynx. Detecting the site of collapse is ac-complished by a variety of methods, including cine fluoroscopy,video endoscopy, pressure catheters, computerized tomography,and magnetic resonance imaging (MRI). The shape of the pha-ryngeal cross-section is often an indicator of the likelihood of air-way collapse. Normal subjects possess an elliptical airway withthe major axis in the lateral dimension while snorers or sufferersof obstructive sleep apnea exhibit a more circular airway, some-times forming an ellipse with the major axis in the posterior-anterior dimension [3]. This makes sense when considering theprominence of lateral wall collapse. Rapid eye movement (REM)is known to induce increasing collapsing pressure without an in-crease in upper airway dilator activity, promoting collapse of tehupper airway. Surface tension, central neurotransmitters, gender,and racial factors may also contribute to upper airway collapse[3].
Previous progress and related research. The ideasand goals of this project grew from past research by Dr. DavidWootton at Drexel University. Students constructed an airwaymodel to study the effects of airway geometry on internal airwaypressure in children. A 3D model of the airway was generatedfrom MRI scans. This model was meshed for use with compu-tational fluid dynamics (CFD) simulations. Inspiratory pressuredrop was found to be strongly correlated to area restriction andproportional to the square of the flowrate. A rigid airway (Fig2) based on the MRI-derived virtual model was manufacturedusing stereolithography rapid prototyping to validate the CFDmodel results. A test bed was assembled to conduct experimentsto simulate flow through the rigid model. One of the critical com-ponents used to drive flow was a computer-controlled pump [5].Many studies have explored numerical models, computationalfluid dynamics flow simulations, and finite element analyses asmeans of shedding more light on the underlying mechanics ofthe collapsible airway. A study on airflow in the human nasalcavity found the nasal pressure drop between the nostrils andthe nasopharynx to be about 50 Pa for rest breathing [6]. Previ-ous research concerning compliant tube segments, often relatedto biological elements such as the pharynx and blood vessels,commonly use the starling resistor as a simple model. Thismodel consists of an elastic tube mounted between two rigidtubes through which a flow of air is driven through the system[7]. Noteworthy implications of this model include 1) increas-ing flowrate corresponds with pressure drop between the inletand outlet of the tube (i.e. driving pressure) and 2) oscillatingflowrates can be described by a characteristic frequency [8]. Arigid model study found pressure drop in the pharynx to rangefrom 200 to 500 Pa [9].
2

Figure 2. Rigid model of a child’s airway.
MATERIALS AND METHODS
Figure 3. Experimental flow diagram.
Breathing BranchThe breathing branch of the test bed is comprised of the
computer, the motor/pump, and the airway and involves control-ling the flow of air through a flow apparatus simulating breathsthrough a human airway. The components for this branch werethe first items approached in the process of building and instru-menting an experimental platform.
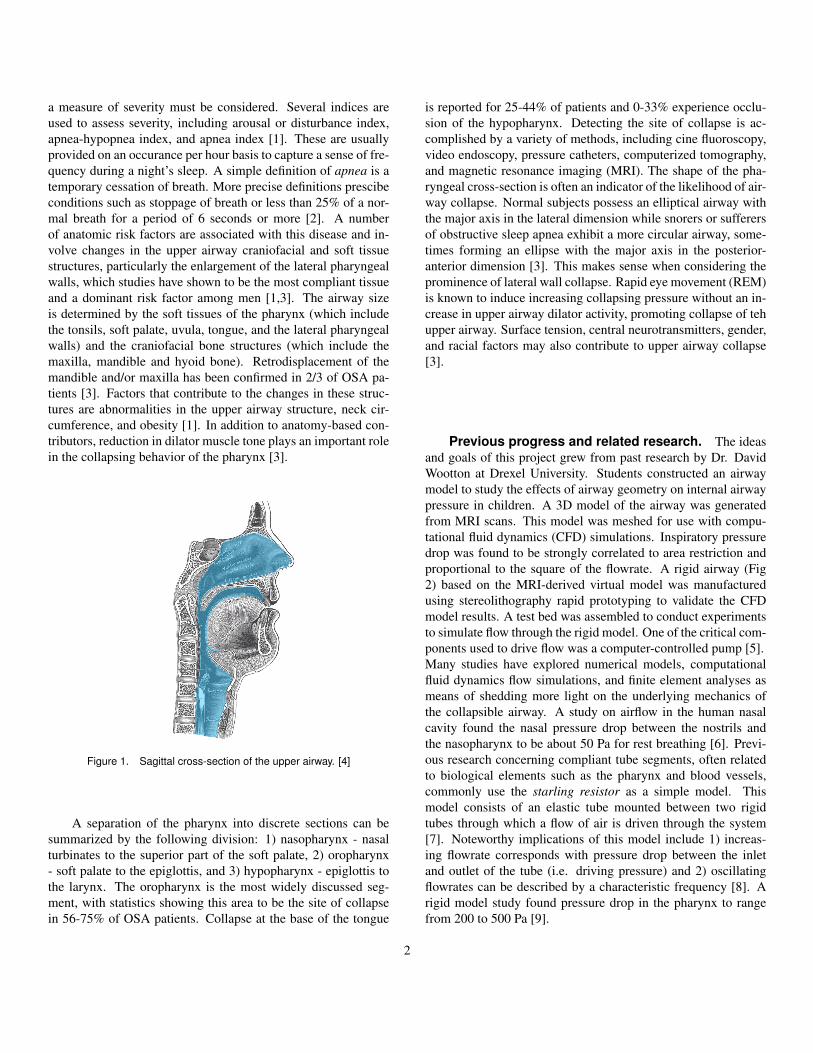
Computer-controlled pump. A computer-controlledpump, pictured in Figure 4(a), functions as our respiratory drivesystem. This critical piece of equipment was constructed duringa previous phase of this study by students at Drexel. The primarycomponents of this pump include a high-resolution stepper mo-tor, motor controller, and a piston-cylinder assembly. Every partis rigidly mounted to an aluminum stand.
The motion of the piston is operated through a motor con-troller that is programmed using a personal computer. IMS Ter-
minal, a free program used for communication with the MicroL-ynx stepper motor module, was used to send instructions to thecontroller and execute a series of tasks. The simulation of a typ-ical breathing cycle and the ability to vary flow parameters wasdeveloped through extensive use of documentation and a greatdeal of trial and error. As listed in Appendix A, the final codesets maximum velocity of the piston to a constant speed that isdefined with the internal unit system known as the munit, or Mo-tor UNIT variable. This system allows the user to control thenumber of microsteps of the motor, which, depending on the typeof stepper motor, relates to the number of rotor revolutions. Thisdetermines the displacement of the leadscrew of a known pitch.Our munit translates to inches of leadscrew displacement (Eq 1).
1.8◦ stepping motor = 200 stepsrevolution
Resolution = 256 microsteps
200 steps×256 microsteps = 512 microstepsrevolution
Leadscrew pitch = 0.200 inchesrevolution
5 revolutions×512 microsteps = 256000 munits
1 inch = 256000 munits (1)
Acceleration current and run current are set as percentagesof the maximum value. After this acceleration period, the motorslews at constant velocity then decelerates until it reaches its de-sired position, or exceeds the limit of the leadscrew.There was an attempt to establish communication between thedata acquisition interface and the motor controller in order tomanage the starting and stopping of the motor from a single userinterface, eliminating the current need to switch between twoprograms. Digital signals could be sent from the computer to thecontroller to trigger anticipated stop or start commands by con-tinuously checking pin values on the motor’s expansion module.The attempt was only partially successful, with only the ability tosend signals but no way of receiving them. Unclear motor con-trol documentation and the extensive experimentation requireddid not allow time for a thorough effort.
Collapsible pharynx. Paramount to the success of thisendeavor is the production of a compliant segment analogousto the collapsible human airway of an OSA sufferer. Fabricat-ing this defining component is a formidable task for any engi-neer. The many unknowns and design considerations faced in
3
(a) Pump
(b) Close-up: controller and powersupply
Figure 4. Respiratory drive system.
approaching this key point led to the concept of an intermedi-ate model to test with the entire system prior to final stages ofresearch involving the detailed airway model. This intermedi-ate model represents a simplified interpretation of the narrowinggeometry of the oropharynx that contributes to pharyngeal col-lapse. By addressing the uncertainties of the casting processeswithout potentially sacrificing the time and material required bya final model, the difficult-to-anticipate issues are solved and thelater phases of the project are able to run more smoothly.Modeling a part of the human body and simulating the complexi-ties of its operation demands the use of materials that will last un-der the stresses of repeated tests and behave true to their anatom-ical analogs. To match the behavior, the mechanical properties ofthe upper respiratory tract were taken into consideration. Reflect-ing characteristics of the human pharynx, the model is designedto handle pressure between -20 and 20 cm H2O and exhibit amodulus between 5 and 25 kPa. The tissue substitute chosen wasSylgard 527, which consists of polydimethylsiloxane (PDMS),a dielectric silicone based organic polymer with stiffness in therelevant range of biological mechanical properties. A 1:1 compo-nent A:B mix of PDMS loaded at 0.0006s-1 resulted in a Young’smodulus of about 6 kPa [10]. Some of its advantageous charac-teristics include ease of preparation, transparency, low electricalconductivity, low polarity, elasticity, and resistance to swell incontact with water [11].
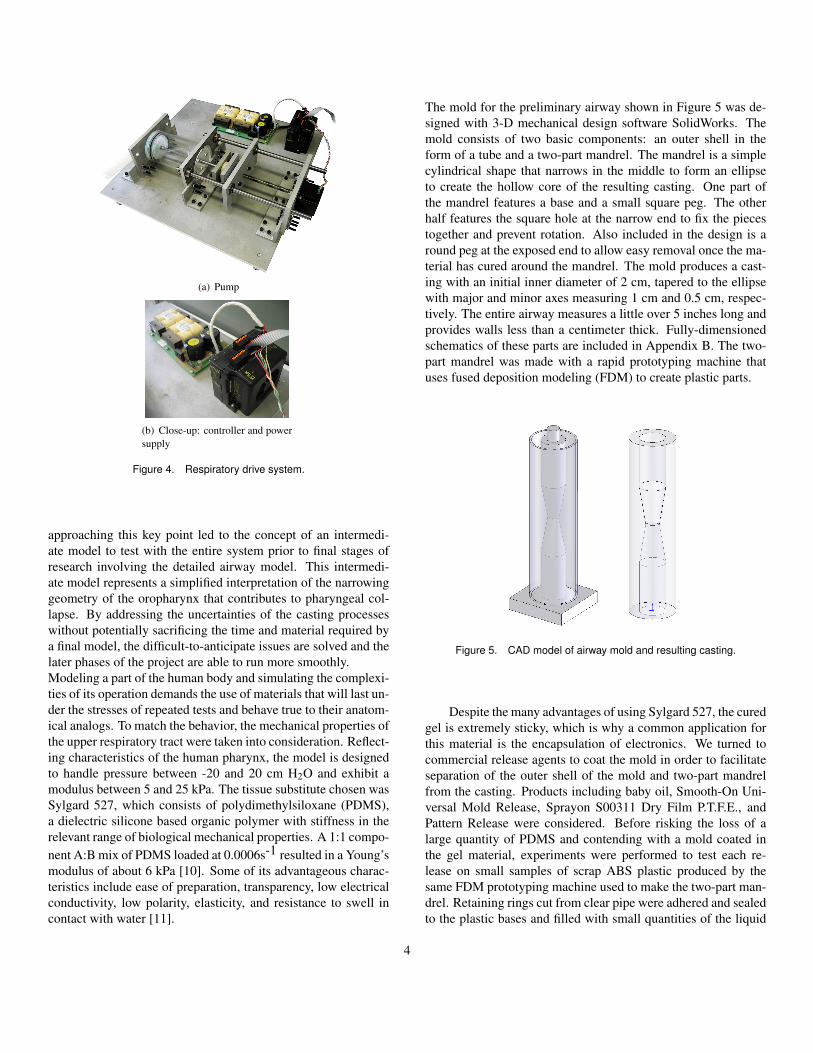
The mold for the preliminary airway shown in Figure 5 was de-signed with 3-D mechanical design software SolidWorks. Themold consists of two basic components: an outer shell in theform of a tube and a two-part mandrel. The mandrel is a simplecylindrical shape that narrows in the middle to form an ellipseto create the hollow core of the resulting casting. One part ofthe mandrel features a base and a small square peg. The otherhalf features the square hole at the narrow end to fix the piecestogether and prevent rotation. Also included in the design is around peg at the exposed end to allow easy removal once the ma-terial has cured around the mandrel. The mold produces a cast-ing with an initial inner diameter of 2 cm, tapered to the ellipsewith major and minor axes measuring 1 cm and 0.5 cm, respec-tively. The entire airway measures a little over 5 inches long andprovides walls less than a centimeter thick. Fully-dimensionedschematics of these parts are included in Appendix B. The two-part mandrel was made with a rapid prototyping machine thatuses fused deposition modeling (FDM) to create plastic parts.
Figure 5. CAD model of airway mold and resulting casting.
Despite the many advantages of using Sylgard 527, the curedgel is extremely sticky, which is why a common application forthis material is the encapsulation of electronics. We turned tocommercial release agents to coat the mold in order to facilitateseparation of the outer shell of the mold and two-part mandrelfrom the casting. Products including baby oil, Smooth-On Uni-versal Mold Release, Sprayon S00311 Dry Film P.T.F.E., andPattern Release were considered. Before risking the loss of alarge quantity of PDMS and contending with a mold coated inthe gel material, experiments were performed to test each re-lease on small samples of scrap ABS plastic produced by thesame FDM prototyping machine used to make the two-part man-drel. Retaining rings cut from clear pipe were adhered and sealedto the plastic bases and filled with small quantities of the liquid
4
gel mixture. This process also served as the first opportunity tobecome familiar with the proper preparation of PDMS, whichinvolves degassing the mixture in a vacuum and allowing it tocure for approximately 24 hours. Some of the release compoundswere more effective than others and the Smooth-On was deemedthe best. Unfortunately, the results of the small-scale tests didnot hold up when attempting to use Smooth-On for the full-scalecasting. Once painstakingly cleaned of PDMS, the casting pro-cess was repeated with the more tedious but reliable approach ofcoating every surface of the mold with parafilm, the one materialwe knew to resist sticking to the gel. Later release experimentswere conducted with paraffin wax with the anticipation of com-plex geometry that would not be conducive to the parafilm-layermethod. Although our technique was not totally effective, theresult showed promise, especially with better care to uniformlyapplying the wax and more effective techniques of melting theparaffin out of the gap it fills in order to release the mandrel.
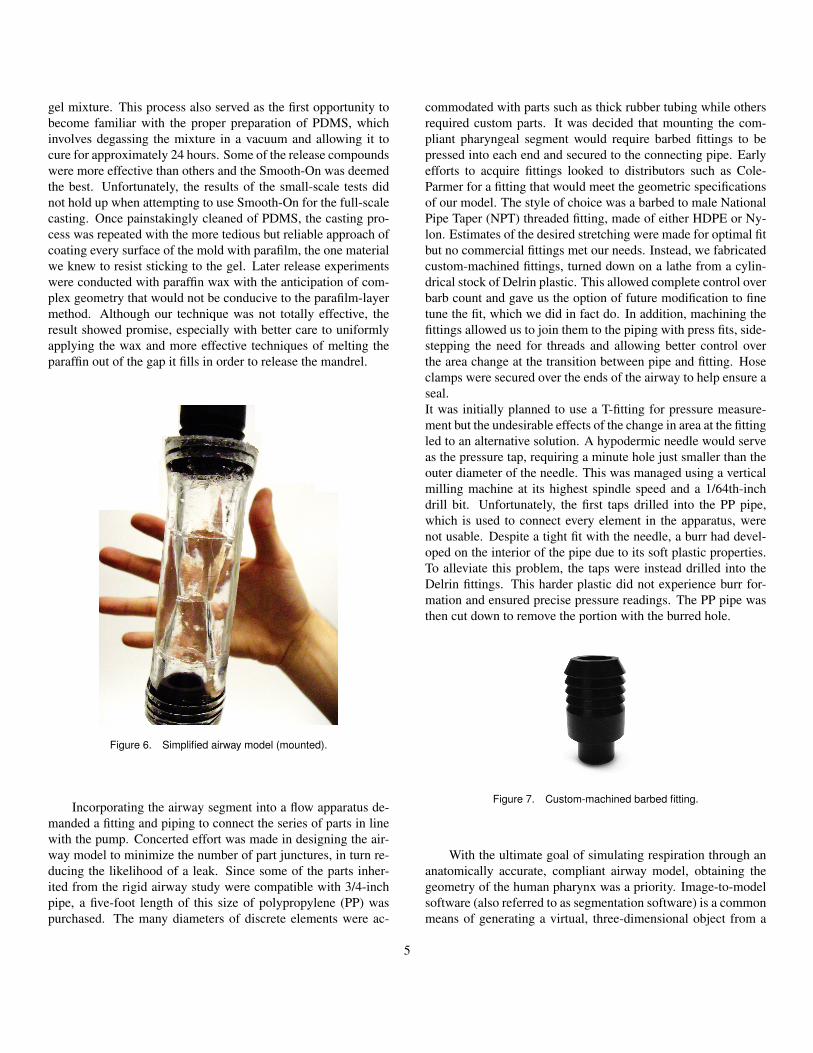
Figure 6. Simplified airway model (mounted).
Incorporating the airway segment into a flow apparatus de-manded a fitting and piping to connect the series of parts in linewith the pump. Concerted effort was made in designing the air-way model to minimize the number of part junctures, in turn re-ducing the likelihood of a leak. Since some of the parts inher-ited from the rigid airway study were compatible with 3/4-inchpipe, a five-foot length of this size of polypropylene (PP) waspurchased. The many diameters of discrete elements were ac-
commodated with parts such as thick rubber tubing while othersrequired custom parts. It was decided that mounting the com-pliant pharyngeal segment would require barbed fittings to bepressed into each end and secured to the connecting pipe. Earlyefforts to acquire fittings looked to distributors such as Cole-Parmer for a fitting that would meet the geometric specificationsof our model. The style of choice was a barbed to male NationalPipe Taper (NPT) threaded fitting, made of either HDPE or Ny-lon. Estimates of the desired stretching were made for optimal fitbut no commercial fittings met our needs. Instead, we fabricatedcustom-machined fittings, turned down on a lathe from a cylin-drical stock of Delrin plastic. This allowed complete control overbarb count and gave us the option of future modification to finetune the fit, which we did in fact do. In addition, machining thefittings allowed us to join them to the piping with press fits, side-stepping the need for threads and allowing better control overthe area change at the transition between pipe and fitting. Hoseclamps were secured over the ends of the airway to help ensure aseal.It was initially planned to use a T-fitting for pressure measure-ment but the undesirable effects of the change in area at the fittingled to an alternative solution. A hypodermic needle would serveas the pressure tap, requiring a minute hole just smaller than theouter diameter of the needle. This was managed using a verticalmilling machine at its highest spindle speed and a 1/64th-inchdrill bit. Unfortunately, the first taps drilled into the PP pipe,which is used to connect every element in the apparatus, werenot usable. Despite a tight fit with the needle, a burr had devel-oped on the interior of the pipe due to its soft plastic properties.To alleviate this problem, the taps were instead drilled into theDelrin fittings. This harder plastic did not experience burr for-mation and ensured precise pressure readings. The PP pipe wasthen cut down to remove the portion with the burred hole.
Figure 7. Custom-machined barbed fitting.
With the ultimate goal of simulating respiration through ananatomically accurate, compliant airway model, obtaining thegeometry of the human pharynx was a priority. Image-to-modelsoftware (also referred to as segmentation software) is a commonmeans of generating a virtual, three-dimensional object from a
5

set of scans obtained via MRI or CT, depending on the type oftissue to be isolated. Two common segmentation software pack-ages were examined for the purposes of this project: Amira (Mer-cury Computer Systems) and Mimics (Materialise). The latteroption was selected under considerations of price, capabilities,and company responses to requests for information, as well asthe convenience of having previously purchased a seat for thesoftware. Mimics would be able to generate 1) a model for con-struction of the physical airway and 2) the mesh to be used forfinite element analyses.Tutorials aided in familiarizing us with standard procedures suchas setting density thresholds based on the shades of the scans.One prominent feature is the extensive preprocessing capabilty ofan add-on called Remesh. One of the tutorials demonstrated thestep-by-step process of selecting the pockets of air throughoutthe virtual stack of scans and isolating a section of the pharynx.The process of meshing the resulting 3D object is considerablymore tedious and time-consuming than other parts of Mimics butstands out as impressively automated and efficient when com-pared to the use of conventional preprocessing packages such asGAMBIT. Figure 8 depicts the mesh generated using the tutorial.
Figure 8. Mimics-generated mesh of the pharynx.
Nasal resistor. The first airway structures encounteredon inspiration are the nasal passages. Our model takes this crit-ical feature into account by including an interchangeable orificein the flow path. The simplification of this relatively complicatedsection of airway anatomy is justified by the notion that nasalpassage collapse is not an issue when considering the pathogen-esis of obstructive sleep apnea. Without any need to model dy-
Table 1. Pressure drops through nasal resistor as measured experimen-tally and calculated theoretically
Orifice (mm) Experiment (cmH2O) Theory (cmH2O)
6 0.23 0.46
5 0.53 0.98
3 3.5 7.79
namic behavior, only the effective pressure loss is reproduced.The nasal resistor component is comprised of a modified plas-tic coupling and a set of interchangeable, aluminum discs, eachcharacterized by the theoretical pressure drop corresponding tothe diameter of the hole in its center. Three discs were fabricatedusing a standard lathe to drill three differently sized holes withdiameters of 3, 5, and 6 mm. These values were calculated usinga simple, theory-based equation dependent on pipe diameter, de-sired pressure drop, and flowrate (Eq 2). The availability of drillbit sizes limited the resolution of pressure drops achieved withthe orifices. A three-part coupling for like-sized tubes facilitatesthe ability to swap the orifices. A vertical milling machine wasused to modify the coupling’s o-ring seat to accept the customnasal restrictor disc. This entire assembly is fitted directly on topof the pneumotachometer.
∆p =8ρQ2
π2
(1
D42− 1
D41
)(2)
Figure 9. Theoretical relationship between orifice diameter and pressuredrop.
6
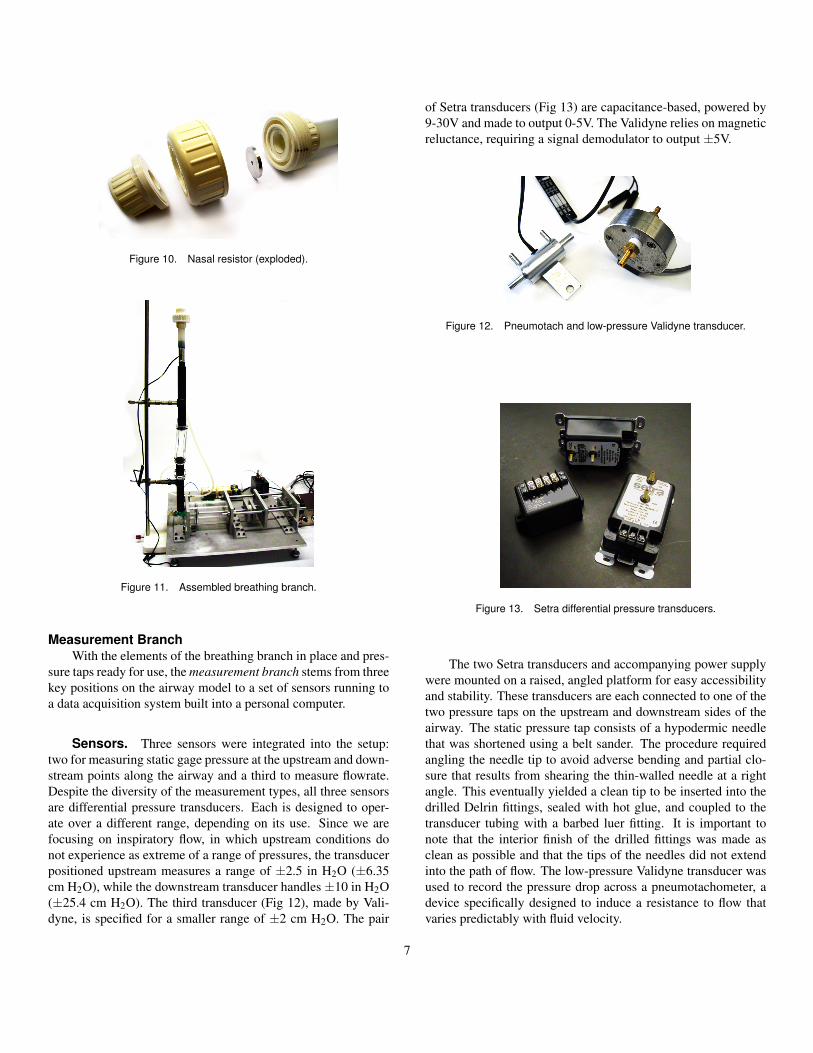
Figure 10. Nasal resistor (exploded).
Figure 11. Assembled breathing branch.
Measurement BranchWith the elements of the breathing branch in place and pres-
sure taps ready for use, the measurement branch stems from threekey positions on the airway model to a set of sensors running toa data acquisition system built into a personal computer.
Sensors. Three sensors were integrated into the setup:two for measuring static gage pressure at the upstream and down-stream points along the airway and a third to measure flowrate.Despite the diversity of the measurement types, all three sensorsare differential pressure transducers. Each is designed to oper-ate over a different range, depending on its use. Since we arefocusing on inspiratory flow, in which upstream conditions donot experience as extreme of a range of pressures, the transducerpositioned upstream measures a range of ±2.5 in H2O (±6.35cm H2O), while the downstream transducer handles ±10 in H2O(±25.4 cm H2O). The third transducer (Fig 12), made by Vali-dyne, is specified for a smaller range of ±2 cm H2O. The pair
of Setra transducers (Fig 13) are capacitance-based, powered by9-30V and made to output 0-5V. The Validyne relies on magneticreluctance, requiring a signal demodulator to output ±5V.
Figure 12. Pneumotach and low-pressure Validyne transducer.
Figure 13. Setra differential pressure transducers.
The two Setra transducers and accompanying power supplywere mounted on a raised, angled platform for easy accessibilityand stability. These transducers are each connected to one of thetwo pressure taps on the upstream and downstream sides of theairway. The static pressure tap consists of a hypodermic needlethat was shortened using a belt sander. The procedure requiredangling the needle tip to avoid adverse bending and partial clo-sure that results from shearing the thin-walled needle at a rightangle. This eventually yielded a clean tip to be inserted into thedrilled Delrin fittings, sealed with hot glue, and coupled to thetransducer tubing with a barbed luer fitting. It is important tonote that the interior finish of the drilled fittings was made asclean as possible and that the tips of the needles did not extendinto the path of flow. The low-pressure Validyne transducer wasused to record the pressure drop across a pneumotachometer, adevice specifically designed to induce a resistance to flow thatvaries predictably with fluid velocity.
7

Figure 14. Pressure tap.
Calibration. Calibration of each pressure transducer wasdone using a manometer featuring millimeter gradations. A pres-sure was applied to the transducer using a syringe. Both themanometer and transducer are exposed to atmospheric pressureat their free ends. Using either an oscilloscope or the DAQ volt-age measurement running continuously (we used the latter), ad-justments were made to the zero and span settings. Aligning zeropressure with a voltage meant setting the Validyne to output zerovolts and the Setra transducers to output 2.5 V. To maximize theresolution of the sensors, the maximum pressures were alignedwith the maximum voltages and span was adjusted accordingly.These analog voltage signals are read using a PCI-6120 DAQCard channelled into an interactive user interface within Na-tional Instruments LabView. This interface is referred to as aVI or Virtual Interface. Calibration in LabView involves a pair-ing of manometer readings with an averaged voltage collectedover a period of time long enough to eliminate the influence ofnoise. These points were then correlated using a linear regres-sion (Appendix C). In this instance, we used Microsoft Excel asour linear regression tool. The coefficients of the line of bestfit were transferred to a formula module for collecting dynamicpressure data. For converting the pressures measured from thepneumotachometer into flowrates, calibration data supplied bythe manufacturer produced an additional conversion formula. Inorder to validate the manufacturer’s calibration data, a check wasperformed by calculating volumetric flowrate from the piston-cylinder geometry and the set speed. This revealed a negligible
discrepancy.After calibration curves were programmed into LabView, dy-namic data was collected and logged during pump operation.LabView reads the three sensor channels simultaneously and aformula function converts the measured voltage data to pressuresand flowrates in real-time, logging them in a measurement fileand plotting the results in a series of convenient charts. Thesecharts can serve dually as a presentation medium and a debug-ging tool.
Data collection. To measure flow and pressures, weused National Instruments LabView Software interfaced with thePCI-6120 DAQ Card available from the same company. This par-ticular card can convert four channels simultaneously with 16-bitresolution at one million samples per second. Our system designallows the user to set the number of samples and the samplingrate, either in the DAQ Assistant dialog box located in the blockdiagram or from the Data Collection tabs in the front panel. Af-ter the analog voltage has been converted into a digital signal ata certain sampling rate, the stream of numbers is logged into adata file using a Write To File module. The stream consists of3 channels of data. By default, LabView logs a time variablenested within this stream. To prevent these unwanted data frombeing recorded, we have enabled the Empty Time Column settingfrom within the Write To File dialog box.Although processing data can be done at a later time and in anexternal program, LabView makes it possible to do this dynam-ically while data is being collected. Generating results in real-time can provide the user with the ability to decide to disregardflawed data and repeat the experiment. After the raw data hasbeen read in from file using the Read From File module, it isparsed into its three channels and ready for processing. Eachchannel is converted into a pressure given an equation that wasproduced from the previously mentioned linear regression of thecalibration data. While two of these channels are pressures, thethird stream is converted first into a pressure and then into aflowrate.
RESULTSMeasurements of flowrate and upstream and downstream
pressures were recorded for trials of varying orifice sizes andvarying pump speeds. Every data set was collected by startingthe pump on an expiration stroke using IMS terminal, switchingto LabView and initiating data collection at the best perceivedmoment at which the inspiration stroke began. The plotted datademonstrates that although a small segment of the first inspira-tion cycle was not measured (most likely due to software lag),the offset is repeatable and the waveform alignment is accept-able for plots of changing nasal resistance with pump speed heldconstant.
8
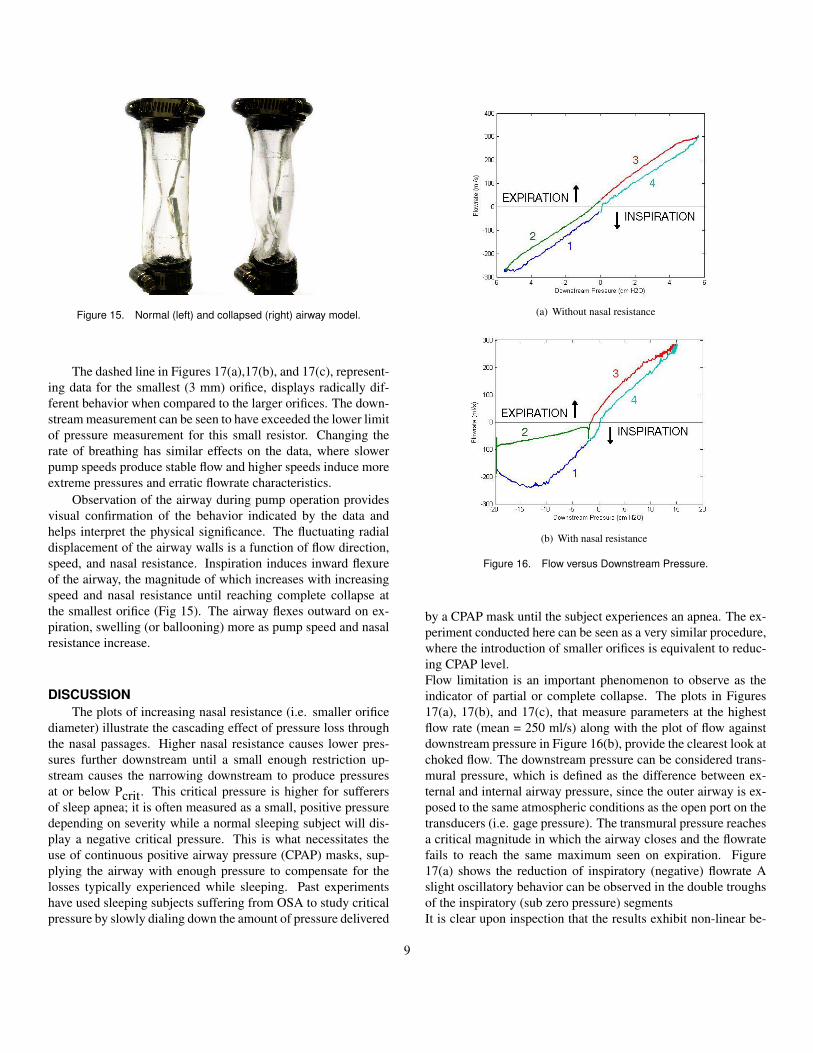
Figure 15. Normal (left) and collapsed (right) airway model.
The dashed line in Figures 17(a),17(b), and 17(c), represent-ing data for the smallest (3 mm) orifice, displays radically dif-ferent behavior when compared to the larger orifices. The down-stream measurement can be seen to have exceeded the lower limitof pressure measurement for this small resistor. Changing therate of breathing has similar effects on the data, where slowerpump speeds produce stable flow and higher speeds induce moreextreme pressures and erratic flowrate characteristics.
Observation of the airway during pump operation providesvisual confirmation of the behavior indicated by the data andhelps interpret the physical significance. The fluctuating radialdisplacement of the airway walls is a function of flow direction,speed, and nasal resistance. Inspiration induces inward flexureof the airway, the magnitude of which increases with increasingspeed and nasal resistance until reaching complete collapse atthe smallest orifice (Fig 15). The airway flexes outward on ex-piration, swelling (or ballooning) more as pump speed and nasalresistance increase.
DISCUSSIONThe plots of increasing nasal resistance (i.e. smaller orifice
diameter) illustrate the cascading effect of pressure loss throughthe nasal passages. Higher nasal resistance causes lower pres-sures further downstream until a small enough restriction up-stream causes the narrowing downstream to produce pressuresat or below Pcrit. This critical pressure is higher for sufferersof sleep apnea; it is often measured as a small, positive pressuredepending on severity while a normal sleeping subject will dis-play a negative critical pressure. This is what necessitates theuse of continuous positive airway pressure (CPAP) masks, sup-plying the airway with enough pressure to compensate for thelosses typically experienced while sleeping. Past experimentshave used sleeping subjects suffering from OSA to study criticalpressure by slowly dialing down the amount of pressure delivered
(a) Without nasal resistance
(b) With nasal resistance
Figure 16. Flow versus Downstream Pressure.
by a CPAP mask until the subject experiences an apnea. The ex-periment conducted here can be seen as a very similar procedure,where the introduction of smaller orifices is equivalent to reduc-ing CPAP level.Flow limitation is an important phenomenon to observe as theindicator of partial or complete collapse. The plots in Figures17(a), 17(b), and 17(c), that measure parameters at the highestflow rate (mean = 250 ml/s) along with the plot of flow againstdownstream pressure in Figure 16(b), provide the clearest look atchoked flow. The downstream pressure can be considered trans-mural pressure, which is defined as the difference between ex-ternal and internal airway pressure, since the outer airway is ex-posed to the same atmospheric conditions as the open port on thetransducers (i.e. gage pressure). The transmural pressure reachesa critical magnitude in which the airway closes and the flowratefails to reach the same maximum seen on expiration. Figure17(a) shows the reduction of inspiratory (negative) flowrate Aslight oscillatory behavior can be observed in the double troughsof the inspiratory (sub zero pressure) segmentsIt is clear upon inspection that the results exhibit non-linear be-
9

(a) Flowrate
(b) Upstream pressure
(c) Downstream pressure
Figure 17. Effect of varying orifice size (nasal resistance) with constantpump speed = 2.5 in/s.
havior (Fig 16(b)), resembling a hysteresis curve. The path lead-ing up to inspiration does not identically match the path return-ing from inspiration. This is the case for the trial where collapseoccurs, and for the trial where it does not. These results are ex-pected given the compliant characteristics of airway.It has been mentioned that collapse is described by flow limi-tation. If we understand flow to have a direction and a magni-tude associated with it, then the flow reaches a local maximumdespite a continuously increasing negative transmural pressureat the point of limited flow. A complete collapse would resultin blocked flow and a rapid drop in downstream pressure (Fig
(a) Flowrate
(b) Upstream pressure
(c) Downstream pressure
Figure 18. Effect of varying pump speed (breathing effort).
17(c)) since the airway now acts like an enclosed space: vol-ume increases, pressure decreases. This causes the downstreamportion of the narrowing to propagate the collapse downstream.While this cascade effect is visually observed, the phenomenonis not fully portrayed in results due to sensor limitations.Flutter might be caused by the continuous cycling of flowthrough the compliant region, subjecting the walls to alternatingpressures and presenting the chance of complex fluid-structureinteractions possibly described by mutual bouncing of the walls.Although this is theoretically possible, it is highly unlikely giventhe adhesive tendency of PDMS. We can locate on Figure 16(b)where, after the piston begins to stop during inspiration, the
10
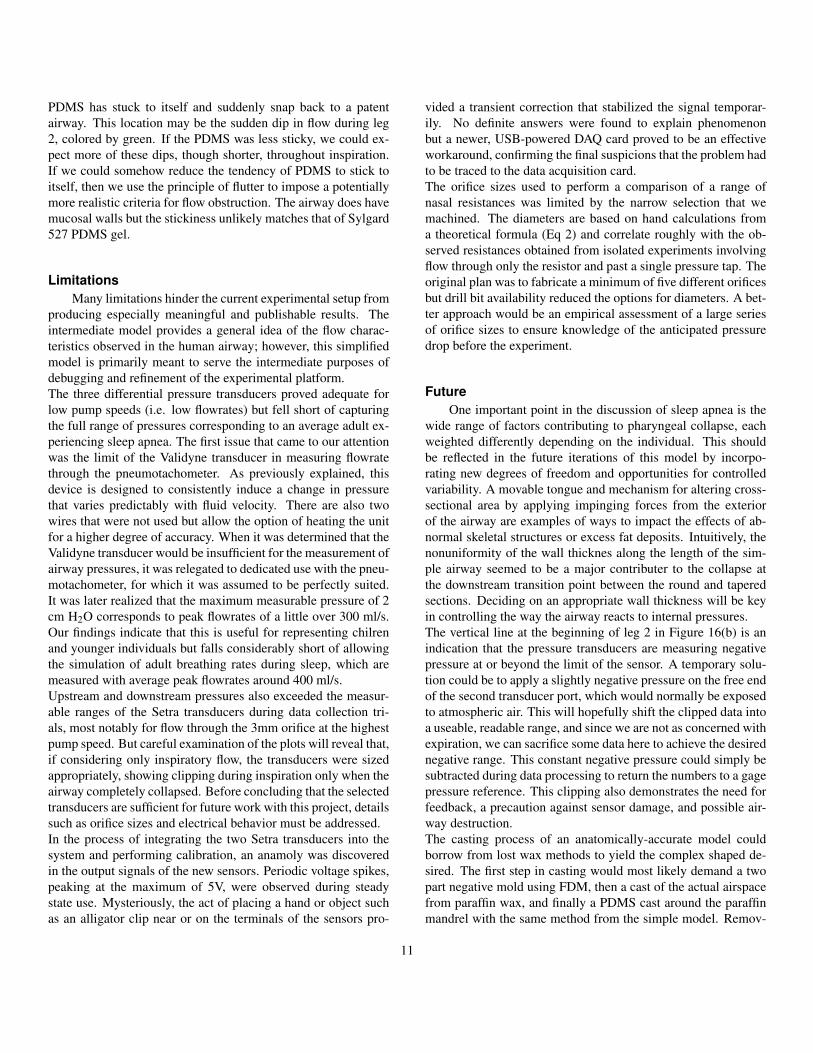
PDMS has stuck to itself and suddenly snap back to a patentairway. This location may be the sudden dip in flow during leg2, colored by green. If the PDMS was less sticky, we could ex-pect more of these dips, though shorter, throughout inspiration.If we could somehow reduce the tendency of PDMS to stick toitself, then we use the principle of flutter to impose a potentiallymore realistic criteria for flow obstruction. The airway does havemucosal walls but the stickiness unlikely matches that of Sylgard527 PDMS gel.
LimitationsMany limitations hinder the current experimental setup from
producing especially meaningful and publishable results. Theintermediate model provides a general idea of the flow charac-teristics observed in the human airway; however, this simplifiedmodel is primarily meant to serve the intermediate purposes ofdebugging and refinement of the experimental platform.The three differential pressure transducers proved adequate forlow pump speeds (i.e. low flowrates) but fell short of capturingthe full range of pressures corresponding to an average adult ex-periencing sleep apnea. The first issue that came to our attentionwas the limit of the Validyne transducer in measuring flowratethrough the pneumotachometer. As previously explained, thisdevice is designed to consistently induce a change in pressurethat varies predictably with fluid velocity. There are also twowires that were not used but allow the option of heating the unitfor a higher degree of accuracy. When it was determined that theValidyne transducer would be insufficient for the measurement ofairway pressures, it was relegated to dedicated use with the pneu-motachometer, for which it was assumed to be perfectly suited.It was later realized that the maximum measurable pressure of 2cm H2O corresponds to peak flowrates of a little over 300 ml/s.Our findings indicate that this is useful for representing chilrenand younger individuals but falls considerably short of allowingthe simulation of adult breathing rates during sleep, which aremeasured with average peak flowrates around 400 ml/s.Upstream and downstream pressures also exceeded the measur-able ranges of the Setra transducers during data collection tri-als, most notably for flow through the 3mm orifice at the highestpump speed. But careful examination of the plots will reveal that,if considering only inspiratory flow, the transducers were sizedappropriately, showing clipping during inspiration only when theairway completely collapsed. Before concluding that the selectedtransducers are sufficient for future work with this project, detailssuch as orifice sizes and electrical behavior must be addressed.In the process of integrating the two Setra transducers into thesystem and performing calibration, an anamoly was discoveredin the output signals of the new sensors. Periodic voltage spikes,peaking at the maximum of 5V, were observed during steadystate use. Mysteriously, the act of placing a hand or object suchas an alligator clip near or on the terminals of the sensors pro-
vided a transient correction that stabilized the signal temporar-ily. No definite answers were found to explain phenomenonbut a newer, USB-powered DAQ card proved to be an effectiveworkaround, confirming the final suspicions that the problem hadto be traced to the data acquisition card.The orifice sizes used to perform a comparison of a range ofnasal resistances was limited by the narrow selection that wemachined. The diameters are based on hand calculations froma theoretical formula (Eq 2) and correlate roughly with the ob-served resistances obtained from isolated experiments involvingflow through only the resistor and past a single pressure tap. Theoriginal plan was to fabricate a minimum of five different orificesbut drill bit availability reduced the options for diameters. A bet-ter approach would be an empirical assessment of a large seriesof orifice sizes to ensure knowledge of the anticipated pressuredrop before the experiment.
FutureOne important point in the discussion of sleep apnea is the
wide range of factors contributing to pharyngeal collapse, eachweighted differently depending on the individual. This shouldbe reflected in the future iterations of this model by incorpo-rating new degrees of freedom and opportunities for controlledvariability. A movable tongue and mechanism for altering cross-sectional area by applying impinging forces from the exteriorof the airway are examples of ways to impact the effects of ab-normal skeletal structures or excess fat deposits. Intuitively, thenonuniformity of the wall thicknes along the length of the sim-ple airway seemed to be a major contributer to the collapse atthe downstream transition point between the round and taperedsections. Deciding on an appropriate wall thickness will be keyin controlling the way the airway reacts to internal pressures.The vertical line at the beginning of leg 2 in Figure 16(b) is anindication that the pressure transducers are measuring negativepressure at or beyond the limit of the sensor. A temporary solu-tion could be to apply a slightly negative pressure on the free endof the second transducer port, which would normally be exposedto atmospheric air. This will hopefully shift the clipped data intoa useable, readable range, and since we are not as concerned withexpiration, we can sacrifice some data here to achieve the desirednegative range. This constant negative pressure could simply besubtracted during data processing to return the numbers to a gagepressure reference. This clipping also demonstrates the need forfeedback, a precaution against sensor damage, and possible air-way destruction.The casting process of an anatomically-accurate model couldborrow from lost wax methods to yield the complex shaped de-sired. The first step in casting would most likely demand a twopart negative mold using FDM, then a cast of the actual airspacefrom paraffin wax, and finally a PDMS cast around the paraffinmandrel with the same method from the simple model. Remov-
11

ing the wax will involve techniques yet to be determined, buttwo methods have been proposed. The first involves a thin steelbar cast within the paraffin mandrel, through the axis of the air-way, to be heated in order to melt the wax. The second woulduse boiling water or steam to melt the wax but prevent damagingthe PDMS, which has demonstrated a favorable tolerance to heatfrom our experiments with paraffin and the simple model. Moreexperiments would be recommended for these methods beforeimplementing them. This task may demand more sophisticatedequipment and techniques.As aforementioned, the two branches of our experimental circuitare currently disconnected. A computer-controlled pump, op-erating from IMS Terminal, drives flow through the collapsibleairway while pressure and flowrate data are being collected andlogged using LabView. Connecting the branches by introducingfeedback into the loop could enable an option for instructing themotor to react to predefined pressure thresholds. In order to attainbetter alignment of data for the same time period and directionof air flow, the sensors would be syncronized with the pump forcomparisons of trial to trial measurements. Using digital outputsfrom LabView, the motor could be triggered to stop, to preventpotential damage to the airway and, more importantly, the threesensors. Another feedback mechanism could function to simu-late more realistic breathing responses, such as increased effortdue to the body’s ability to sense negative transmural pressures.Both of these options require an in-depth understanding of themotor controller software, a level of which we were unable toachieve during the course of this project. For an enhanced meansof interpreting results, rangefinding sensors could track the mo-tion of the piston and superimpose pump position over a data plotto add another dimension of depth for easier visualization of thephysical ramifications of the results.
Other directions for future efforts include more streamlinedsensor calibration by incorporating the Curve Fitting moduleinto the VI in LabView. Also, reversing the tube connectionson the pneumotachometer would make inspiratory flow mea-surements positive for easier reading. MRI compatibility wasprescribed as an objective from the outset of the project. Aninvestigation into the specifics of compatibility criteria for MRIscanning is in order.
ACKNOWLEDGMENTThanks go to Dr. David Wootton for his guidance and in-
sights throughout the project. Mike Eilenfeldt was integral to ma-chine access for the various fabrication needs. We would like tothank Christian Sevilla, Hyun Soo Ko, and students from DrexelUniversity who conducted the rigid model study for their contri-butions to the progress of our work.
REFERENCES[1] Schellenberg J., Maislin G., Schwab R., 2000, “Physical
Findings and the Risk for Obstructive Sleep Apnea,” Am.J. Respir. Crit. Care Med., 162, pp.740-748.
[2] Fregosi R.F., Quan S.F., Kaemingk K.L., Morgan W.J., Goodwin J.L., Cabrera R., Gmitro A., 2003, “Sleep-disordered Breathing, Pharyngeal Size and Soft TissueAnatomy in Children,” J. Appl. Physiol., 95, pp. 2030-2038.
[3] Ryan C.M., Bradley T.D., 2005, “Pathogenesis of obstruc-tive sleep apnea,” J. Appl. Physiol., 99, pp. 24402450.
[4] Gray H., 1918, Anatomy of the Human Body, Lea &Febiger, Philadelphia.
[5] Arens R, Guez A., McDonough J., Sin S., Udupa J., Woot-ton D., and Xu C., 2006, “Computational Fluid DynamicsModeling of the Upper Airway of Children with Obstruc-tive Sleep Apnea Syndrome in Steady Flow,” BiomechanicsJ., 39, pp.2043-2054.
[6] Chometon F., Gillieron P., Laurent J., Ebbo D., KoifmanP., Lecomte F., and Sorrel-Dejerine N., “Aerodynamics ofNasal Airways with Application to Obstruction”
[7] Jensen, O.E., 2002, “Flow Through Deformable Airways,”Urbino.
[8] Shapiro A., 1977, “Steady Flow in Collapsible Tubes,”Biomedical Engineering J., pp.126-147.
[9] Roberts D., Santare M.H., Shome B, Szeri A.Z., and WangL.-P., 1998, “Modeling of Airflow in the Pharynx with Ap-plication to Sleep Apnea,” Biomechanical Engineering J.,120, pp.416-422.
[10] Sevilla C., 2008, “Validation of MRE-Acquired Young’sModulus Using a Uniaxial Soft Tissue Tester.”
[11] Lee J., Ng C., and Whitesides G., 2003, “Solvent Compat-ibility of Poly(dimethylsiloxane)-Based Microfluidic De-vices,” Analytical Chemistry, 75, pp.6544-6554.
12