Embed Size (px)
Citation preview

SKF Nine-month results 2012
Tom Johnstone, President and CEO
17 October 2012

© SKF Group 17 October 2012Slide 2
Strong performance in a challenging market
• Weaker sales during the quarter, impacted by overall economy
• Significantly lower manufacturing and inventories reduced
• Good operating margin
• Strong cash flow
• Further investments to support long-term growth and profitability

© SKF Group 17 October 2012Slide 3
• Acquisition and divestments completed
- acquisition of General Bearing Corporation (GBC)
- divestment of the SKF distributor businesses in Australia and New Zealand
• New businesses - magnetic bearings to two new major gas projects in Australia - five-year contract with LKAB for maintenance services - third strategic partnership agreement with Baosteel Group Corporation - SKF Bus Door Actuator to Volvo Buses - SKF’s bonded piston seals to Mazda Motor Corporation
• Three new SKF Solution Factories - USA, Romania and Italy
• SKF Distributor College - awarded its 160,000th certificate
Highlights Q3 2012

© SKF Group 17 October 2012Slide 4
Highlights Q3 2012
• SKF celebrated 100 years of business in China
- inaugurated a new bearing and truck hub unit factory in Jinan
- broke ground on a new regional distribution centre in Shanghai
- announced the establishment of a new SKF Campus in Jiading, Shanghai, containing a new factory for automotive and the Global Technical Centre China, SKF Solution Factory and SKF College
• Debt structure - new eurobond of 500m with maturity 2019 - revolving credit facility of EUR 500m extended to 2017
• Dow Jones Sustainability Indexes and FTSE4Good - member of DJSI indexes for the 13th successive year - included for the 12th successive year in the FTSE4Good Index Series

© SKF Group 17 October 2012Slide 5
New products Q3 2012
SKF ChainLube oil projection system for food processing
New low friction
bearing seal for railway
New temperature monitoring system for railway
Self powered wireless sensor for railway
New range of freight bearings, tapered roller bearing units
Device for monitoring freight car mileage and
maintenance history

© SKF Group 17 October 2012Slide 6
SKF Group – Q3 2012
Financial performance Q3 2012Q3 2011Net sales, SEKm 15,486 16,545Operating profit, SEKm 1,913 2,479Operating margin, % 12.4 15.0Profit before tax, SEKm 1,734 2,345Cash flow, SEKm 1,097 1,323
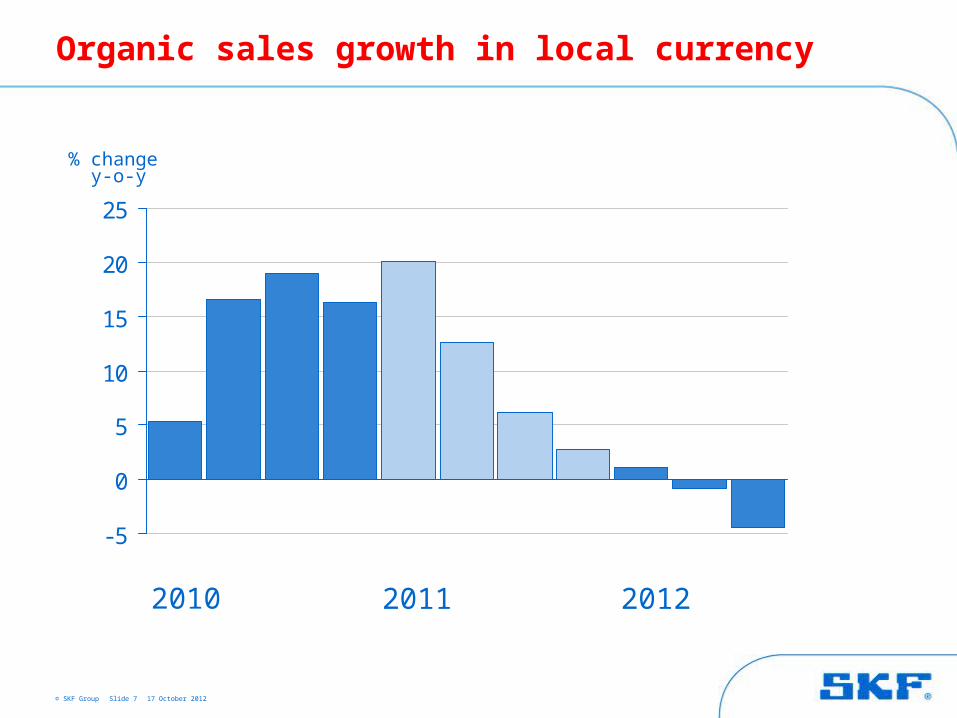
Organic sales growth in local currency:
SKF Group: -4.5%Industrial market, Strategic Industries: -5.6% Regional Sales and Service:-4.7% Automotive: -3.5% Key points Sales volumes down by 5.0% y-o-yManufacturing significantly lower y-o-yInventories down to 20% of sales
Europe: -7%North America: +5%Asia: -11%Latin America: +8%
© SKF Group 17 October 2012Slide 7
Organic sales growth in local currency
-5
0
5
10
15
20
25
20122010 2011
% change y-o-y

© SKF Group 17 October 2012Slide 8
Europe-7%
Asia/Pacific -11%
Latin America
8%Middle East & Africa -4%
NorthAmerica
5%
Growth development by geography Organic growth in local currency Q3 2012 vs Q3 2011

© SKF Group 17 October 2012Slide 9
Europe-4%
Asia/Pacific -
9%
Latin America
12%Middle East &
Africa 0%
North America
8%
Growth development by geography Organic growth in local currency YTD 2012 vs YTD 2011

© SKF Group 17 October 2012Slide 10
Components in net sales
Q1 Q2 Q3 Q4 Q1 Q2 Q3 Q4 Q1 Q2 Q3
5.3 16.6 19.0 16.3 20.1 12.6 6.2 0.0 -0.8 -2.8 -5.0
0.0 0.0 0.0 0.0 5.0 4.4 5.1 4.8 -0.1 0.0 0.8
-0.3 -0.5 0.3 0.9 1.3 1.6 2.0 2.8 1.9 2.0 0.5
5.0 16.1 19.3 17.2 26.4 18.6 13.3 7.6 1.0 -0.8 -3.7
-7.7 -5.2 -3.2 -6.2 -10.8 -12.2 -6.3 -2.1 0.4 3.6 -2.7
-2.7 10.9 16.1 11.0 15.6 6.4 7.0 5.5 1.4 2.8 -6.4
Percent y-o-y
Volume
Structure
Price/mix
Sales in local currency
Currency
Net sales
2010 2011 2012

© SKF Group 17 October 2012Slide 11
-5
0
5
10
15
20
2010 2011 YTD 2012
Growth in local currency, including structure
% y-o-y
Structure in 2011: 4.8%Structure in 2012: 0.2%
14.2%
16.3%
-1.4%

© SKF Group 17 October 2012Slide 12
Operating profit
0
300
600
900
1 200
1 500
1 800
2 100
2 400
2 700
SEKm
2010
One-time items
2011 2012
© SKF Group 17 October 2012Slide 13
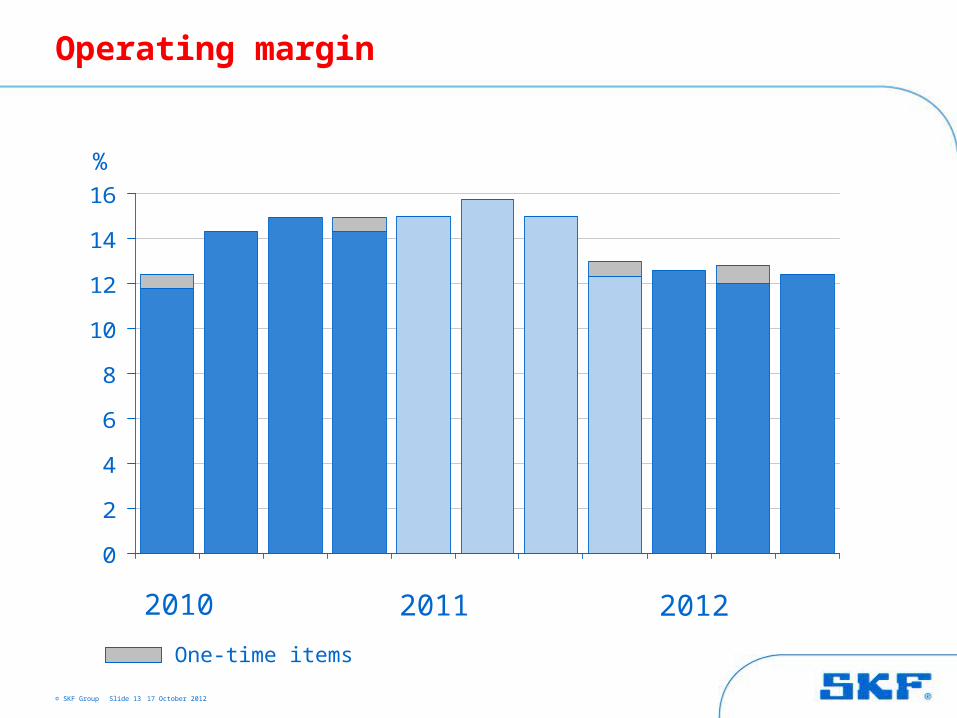
%
0
2
4
6
8
10
12
14
16
2010
One-time items
2011 2012
Operating margin

© SKF Group 17 October 2012Slide 14
0
2
4
6
8
10
12
14
16
2010 2011 YTD 2012
%
One-time items * Excluding one-time items
14.7*14.2*
13.8 14.5 12.6*
Operating margin
12.3
© SKF Group 17 October 2012Slide 15
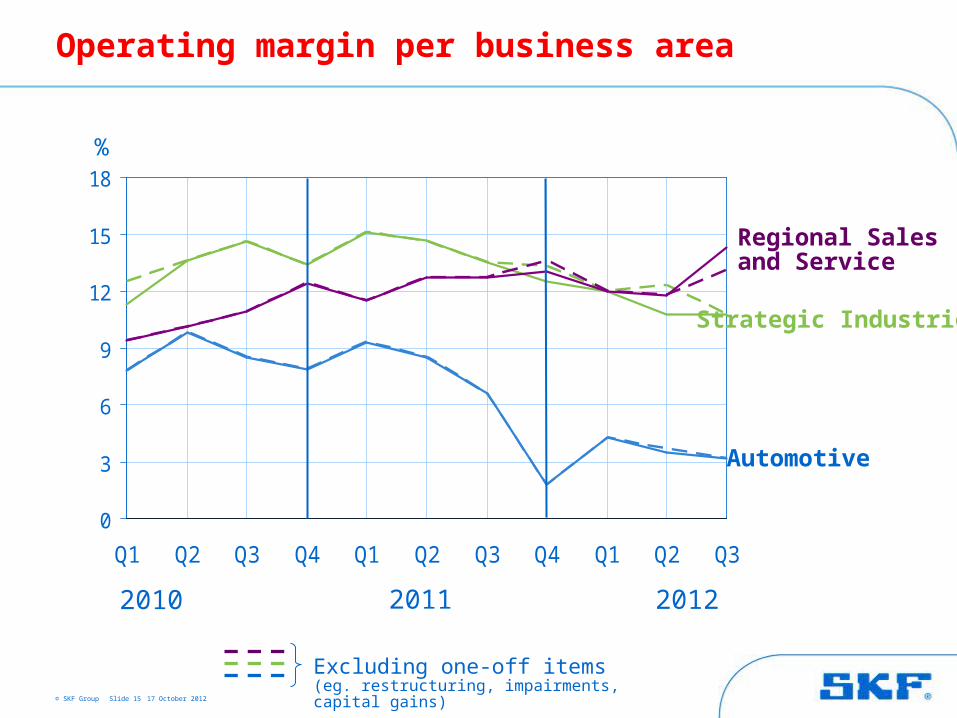
0
3
6
9
12
15
18
Q1 Q2 Q3 Q4 Q1 Q2 Q3 Q4 Q1 Q2 Q3
Operating margin per business area
Strategic Industries
Regional Sales and Service
Automotive
%
2010 2011 2012
Excluding one-off items(eg. restructuring, impairments, capital gains)

© SKF Group 17 October 2012Slide 16
SEKm 2012 2011
Net sales 15,486 16,545
Operating profit 1,913 2,479
Operating margin, % 12.4 15.0
Profit before taxes 1,734 2,345
Net profit 1,266 1,656
Basic earnings per share, SEK 2.71 3.52
Cash flow, after investments before financing
1,097 1,323
Third quarter 2012

© SKF Group 17 October 2012Slide 17
SEKm 2012 2011
Net sales 49,591 49,959
Operating profit 6,106 7,606
Operating margin, % 12.3 15.2
Profit before taxes 5,516 7,109
Net profit 3,867 5,019
Basic earnings per share, SEK 8.22 10.72
Cash flow, after investments before financing
2,479 2,995
Nine month 2012
© SKF Group 17 October 2012Slide 18
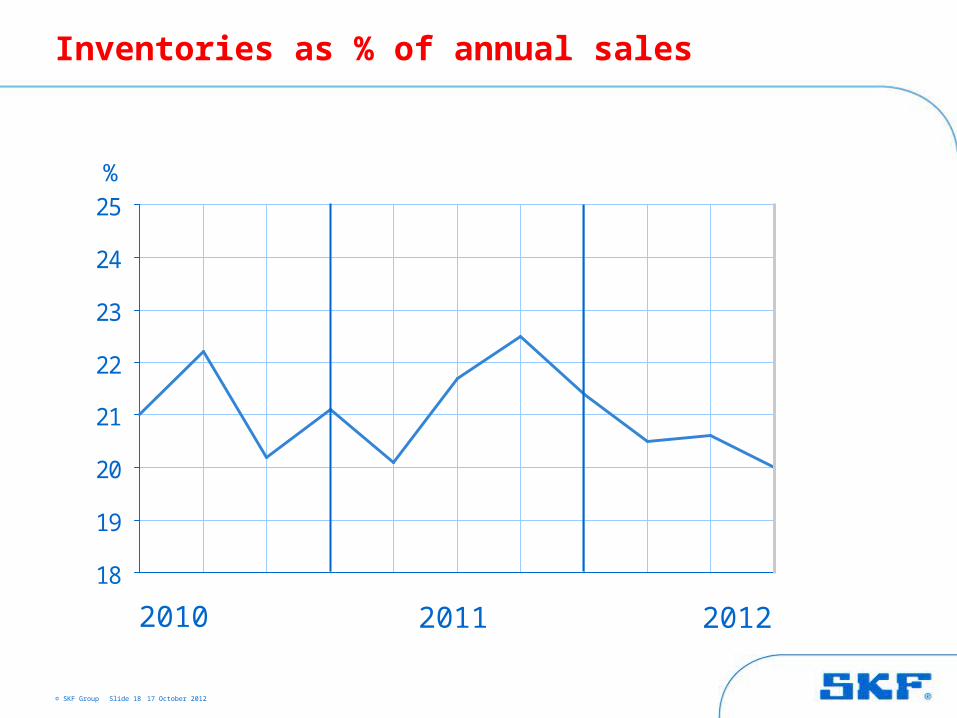
18
19
20
21
22
23
24
25
Inventories as % of annual sales
%
2010 2011 2012
© SKF Group 17 October 2012Slide 19
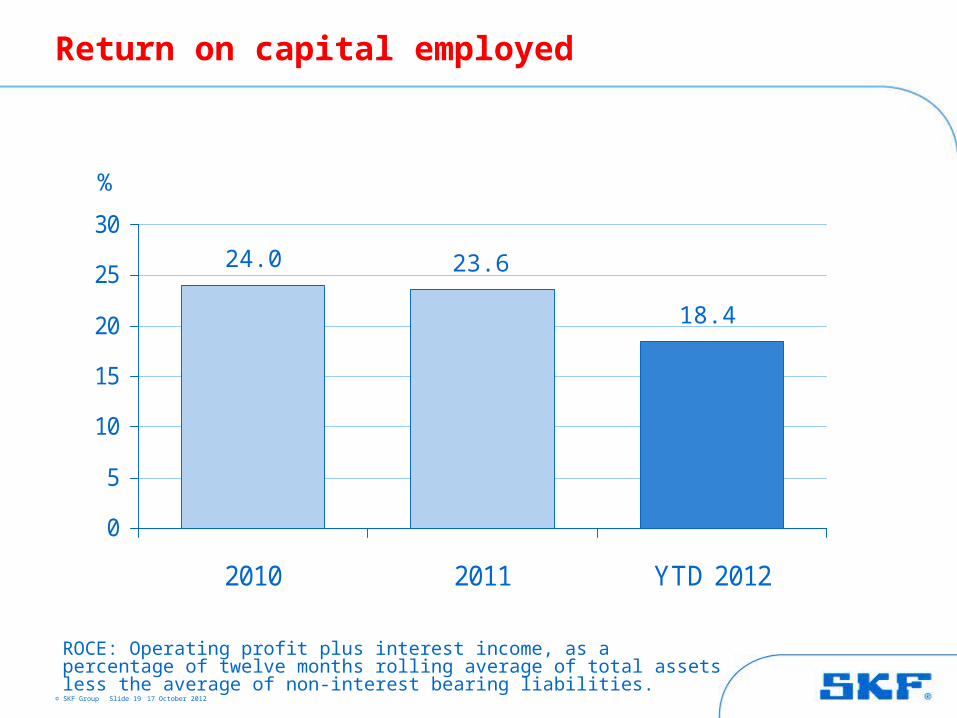
Return on capital employed
0
5
10
15
20
25
30
2010 2011 YTD 2012
ROCE: Operating profit plus interest income, as a percentage of twelve months rolling average of total assets less the average of non-interest bearing liabilities.
%
18.4
24.0 23.6

© SKF Group 17 October 2012Slide 20
Cash flow, after investments before financing
-6 000
-5 000
-4 000
-3 000
-2 000
-1 000
0
1 000
2 000
SEKm
2010 2011 2012
* SEK 798 million, excluding SEK 6,799 million for the acquisition of Lincoln.
**SEK 1,707 million, excluding acquisitions and divestments.
*
**

© SKF Group 17 October 2012Slide 21
Net debt
-20 000
-18 000
-16 000
-14 000
-12 000
-10 000
-8 000
-6 000
-4 000
-2 000
0
SEKm
AB SKF, dividend paid (SEKm):2010 Q2 1,5942011 Q2 2,2772012 Q2 2,504
2010 2011 2012
Net debt: Loans and net provisions for post-employment benefits less short-term financial assets excluding derivatives.
© SKF Group 17 October 2012Slide 22
0
100
200
300
400
500
600
2012 2013 2014 2015 2016 2017 2018 2019
EURm
396
100100130
500
110
0
500
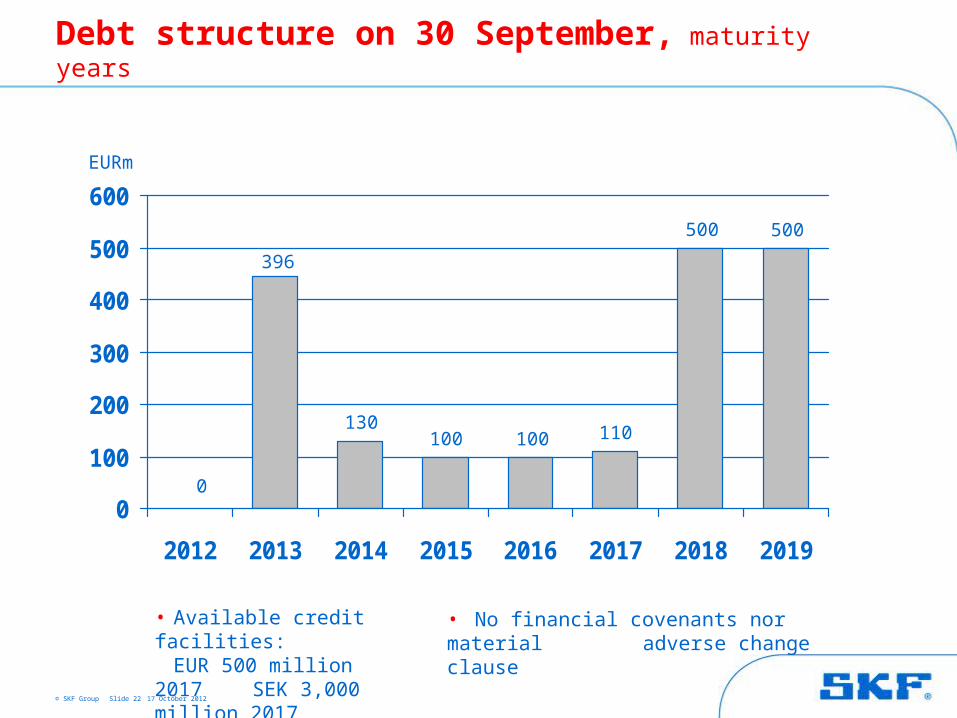
• Available credit facilities:
EUR 500 million 2017 SEK 3,000 million 2017
• No financial covenants nor material adverse change clause
Debt structure on 30 September, maturity years
© SKF Group 17 October 2012Slide 23
October 2012: SKF demand outlook Q4 2012
Demand compared to the fourth quarter last yearThe demand for SKF’s products and services is expected to be lower for the Group and for Europe. For Asia it is expected to be slightly lower and for North America and Latin America relatively unchanged. The demand is expected to be lower for Industrial Strategic Industries and Industrial Regional Sales and Service and relatively unchanged for Automotive.
Demand compared to the third quarter 2012
The demand for SKF’s products and services is expected to be slightly lower for the Group, for all the business areas and for Europe, Asia and North America. For Latin America demand is expected to be relatively unchanged.
Manufacturing
Manufacturing is expected to be lower year on year and slightly lower compared to third quarter.

© SKF Group 17 October 2012Slide 24
SKF demand outlook Q4 2012, regions(based on current assumptions)
Share of net sales2011*
Europe 44%
Asia Pacific 28%
North America
19%
Latin America 8%
Total
Q4 2012 vs Q4 2011
--
-
+/-
+/-
--
* Previously published shares have been restated to reflect the total Group business and customer delivery locations.
Sequential trend for Q4
2012

© SKF Group 17 October 2012Slide 25
Sequential trend for Q4 2012
Share of net sales2011
Strategic Industries
31%
Regional Sales and Service
39%
Automotive 27%
Total
Q4 2012 vs Q4 2011
--
--
+/-
--
SKF demand outlook Q4 2012, business areas(based on current assumptions)

© SKF Group 17 October 2012Slide 26
5%
13%
4%
28%
13%
12%
10%
5%
5%
3%
Aerospace
Cars and light vehicles
Railway
Industrial distribution
Industrial, general
Industrial, heavy, special and off-highway
Vehicle service market
Energy
Trucks
Two-wheelers and electrical
Share of net sales 2011*
* Previously published shares have been restated to reflect the total Group business and customer delivery locations.
SKF sequential volume trend Q4 2012, main segments(based on current assumptions)

© SKF Group 17 October 2012Slide 27
Guidance for the fourth quarter 2012
• Tax level: around 30%
• Financial net for the fourth quarter:Around SEK 200 million
• Exchange rates on operating profit versus 2011Q4: SEK -50 millionFull year: SEK 200 million
• Additions to PPE: Around SEK 2.0 billion for 2012
Guidance is approximate and based on current assumptionsand exchange rates
© SKF Group 17 October 2012Slide 28
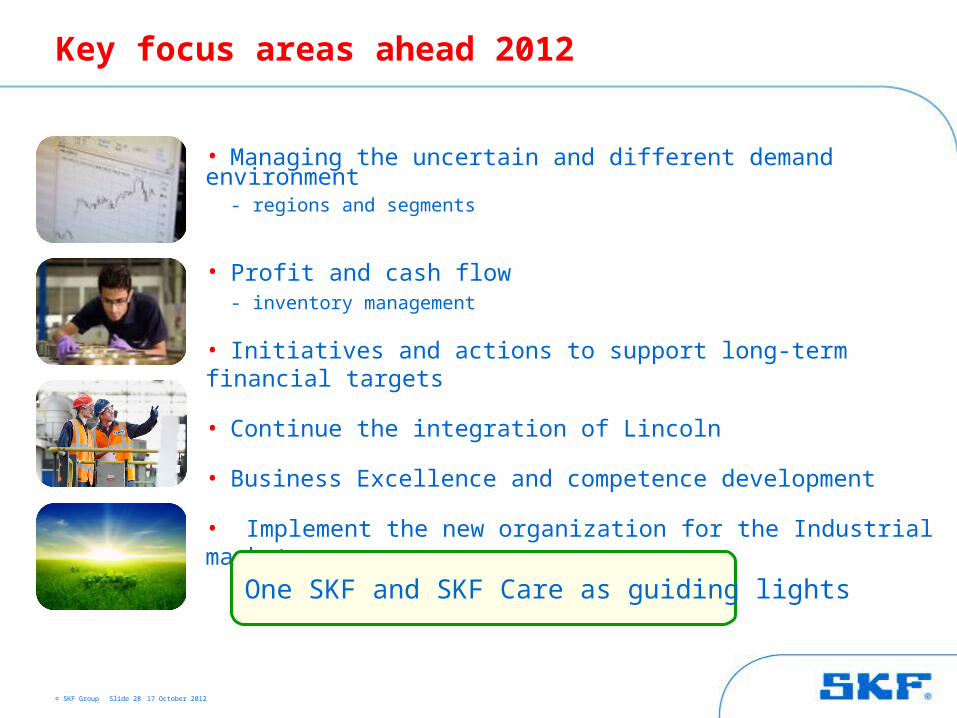
Key focus areas ahead 2012
• Managing the uncertain and different demand environment
- regions and segments
• Profit and cash flow- inventory management
• Initiatives and actions to support long-term financial targets
• Continue the integration of Lincoln
• Business Excellence and competence development
• Implement the new organization for the Industrial market
One SKF and SKF Care as guiding lights

© SKF Group 17 October 2012Slide 29
Long-term financial targets
27% Return on capital employed
8% Annual sales growth in local
currencies
15% Operating margin, level

© SKF Group 17 October 2012Slide 30
• Accelerate profitable growth- intensify the platform and industry approach- launch more new offerings – green and BZ
portfolio- strengthen the service business- focus on faster growing regions/ industries- develop other brands
• Reduce cost and eliminate waste- Business Excellence throughout the Group- BCC manufcaturing and sourcing- integrated cost reduction activities (ICR)
• Invest in growth- Sales and engineering resources- Factories in growth markets- Solution factories- R&D- Acquisitions- New IT systems
Main initiatives going forward
© SKF Group 17 October 2012Slide 31
Cautionary statement
This presentation contains forward-looking statements that are based on the current expectations of the management of SKF.
Although management believes that the expectations reflected in such forward-looking statements are reasonable, no assurance can be given that such expectations will prove to have been correct. Accordingly, results could differ materially from those implied in the forward-looking statements as a result of, among other factors, changes in economic, market and competitive conditions, changes in the regulatory environment and other government actions, fluctuations in exchange rates and other factors mentioned in SKF's latest annual report (available on www.skf.com) under the Administration Report; “Important factors influencing the financial results", "Financial risks" and "Sensitivity analysis”.

© SKF Group 17 October 2012Slide 32