Embed Size (px)
Citation preview

Company Overview SKF India is a part of the AB SKF Group of Sweden, a global supplier of bearings and seals. The offerings of SKF India range from products, solutions and services in the areas comprising bearings, seals, mechatronics and lubrication systems. The company has a strong presence in the Rs.60 billion Indian bearing industry with a market share of nearly 30 per cent. The company supplies bearings for automotive and industrial applications. With more than 200 distributors across the country, the company has a wide reach, enabling access to its key user segments. Its manufacturing facilities are spread across various locations which are major automotive and industrial hubs. The company manufacturers around 60 per cent of its total bearings’ requirement indigenously, while the rest are imported.
Key Business Highlights Leader in ball bearings industry in India Ball bearings are the largest segment of India’s bearings industry which accounts for nearly 60 per cent of the total industry output. SKF India commands a 41 per cent market share in the ball bearings market.
New facilities in key locations
SKF India has set up two new factories one in Haridwar, Uttrakhand, which is a major automotive hub in India and another in Ahmedabad, with a total investment of Rs. 450 crores. While the Haridwar plant will extensively supply to the automotive sector, especially the two wheeler industry, the Ahmedabad factory will provide inroads into the large size bearings market, which are used for industrial applications. On becoming fully operational, these facilities will result in nearly a 40-50 per cent capacity enhancement for the company.
Long-term supply contracts with Hero Honda and Suzlon
SKF has a five year contract with the largest two wheeler manufacturer - Hero Honda for supply of bearings from its Uttrakhand plant. The company also has a five and a half year contract with Suzlon Energy, worth Euro 303 million for supplying bearings for Suzlon’s wind turbines. SKF India will also provide services such as grease, customized housing, generator bearing and reliability services to Suzlon.
Strong balance sheet
With negligible debt and cash & cash equivalents amounting to Rs. 289.3 crores as on December 31, 2009, SKF India’s balance sheet strength is attractive relative to its peer group.
Key Risks Rising commodity prices may put downward pressure on margins Increasing presence of imported spurious products may pose threat
to market share Better product quality, improved road infrastructure, prohibition on
vehicle overloading will gradually impact aftermarket sales Valuations The stock is currently trading at a P/E multiple of 20.5x on its LTM EPS of Rs. 23.4 and 11x EV/EBITDA multiple based on LTM EBITDA of Rs.203 crores.
June 18, 2010
BSE Code 500472BSE ID SKFHigh/Low 1Y (Rs.) 504 / 218Avg. vol (3m) 38,688Market Cap (Rs Cr) 2,526 Net IB Debt (Rs Cr) (289) Enterprise value(Rs Cr) 2,237
Shareholding % Dec-09 Mar-10Promoters 53.58 53.58MFs/ Fis/ Banks 10.08 10.42FIIs 11.87 12.05Public & Others 24.47 23.95
Stock Chart ( Relative to Sensex)
Stock Perfm.(%) 1M 6M 1YrAbsolute 2.4 37.9 126.3 Rel. to Sensex (1.7) 32.9 103.1
Financials (Rs.Cr) 12/07 12/08 12/09Revenue 1,579 1,630 1,584 y-o-y 17.6% 3.3% -2.8%EBITDA 265 208 160 y-o-y 59.4% -21.6% -23.2%
PAT 161 128 94EPS (Dil.) 30.5 24.2 17.9y-o-y 58.0% -20.7% -26.1%EBITDA Margin 16.8% 12.8% 10.1%PAT Margin 10.2% 7.8% 5.9%D/E(x) 0.00 0.00 0.00 P/E(x) 15.7x 19.8x 26.8xEV/EBITDA(x) 8.4x 10.8x 14.0xROCE 43.0% 27.7% 18.3%ROE 29.5% 19.8% 13.2%
50.0
100.0
150.0
200.0
250.0
18-Jun-09 18-Dec-09 18-Jun-10SKF India Sensex
Financial Year ends at December 31 Qtry Fin 06/09 09/09 12/09 03/10Revenue 504 469 418 380PAT 44 31 31 18EPS 8.3 5.9 5.9 3.4 All figures in Rs. crores except for per share data
CMP Rs. 479 SKF India Limited
Industrial Goods

-2-
SKF India Limited
Business Description SKF India is a 53.6 per cent subsidiary of AB SKF, Sweden, a global supplier of rolling bearings and seals. SKF in India provides products, solutions and services in the areas of rolling bearing, seals, mechatronics, lubrication systems and related businesses. Its products find wide application in automotive, electrical and industrial applications. The company domestically manufactures around 60 sizes of deep groove ball bearings and 70 sizes of taper roller bearings. It also produces machinery components for the textile industry.
SKF’s product platforms
Source: Company Annual Report With a presence spanning nearly 85 years, the company is an established player among the key bearing manufacturers in India. As of FY09, the company operated from its two plants located in Pune and Bangalore with a total annual capacity of nearly 132 million bearings and employed over 1900 people. The company has recently opened two plants; one in Haridwar and another in Ahmedabad at a total investment of Rs. 450 crores. The Haridwar plant has an annual capacity of 60 million units of bearings (small Deep Groove Ball Bearing) built at an investment of Rs. 100 crores. The company will target the automotive industry, as Hardwar is fast becoimng an automitive hub. The Ahmedabad plant will cater to the industrial segment. In addition to this SKF India’ associate company, SKF Technologies (India) Pvt Ltd provides sealing solutions. Revenue Composition The company organizes its sales into one segment i.e. Bearings and related component. Sales from Roller and Ball bearings account for 95 per cent of the total revenue. Bearings manufactured domestically account for nearly 50 per cent of the total revenue while traded bearings form nearly 44 per cent of the total revenue pie.
The company divides its units strategically into four categories viz. Automotive Business Unit (ABU), the Electrical & Two-wheeler Business Unit (EBU), the Industrial Business Unit (IBU) and the Service Business Unit (SBU). In FY09, the company recorded a revenue of Rs.1, 584 crores, marginally lower than Rs. 1,630 crores posted in FY08.
Revenue derived from four lines of businesses aligned as SBUs
SKF’s offers five platforms of product offerings
Deep rooted presence with strong global parentage
Increasing presence in automotive and industrial segment through setting up of new plants

-3-
SKF India Limited
Break up FY09 Revenue (Rs. 1,584 Crores) SBU-wise Revenue distribution
Ball and roller bearings
95%
Textiles machinery
components1%
Others4%
Automotive 28%
Electrical and two wheeler
22%
Industrial24%
Service26%
Source: Company Annual Report, Company Website, ICRA Online Research Products and services offered by SKF covers a wide range of Automotive and Industrial applications
Source: Company Website, ICRA Online Research
Business unit Industry Served Product services offered Automotive Automobile Industry Wheel hub bearing units
Taper roller bearings Small deep groove ball bearings Seals Special automotive products and complete repair kits
for the vehicle service Electrical & Two-wheeler
Electric equipment and household appliances industry Two-wheeler industry
Deep groove ball bearings Manufactures all deep groove ball bearings and
bearing seals within SKF
Industrial
Industrial OEMs Railways, Aerospace Lubrication systems Actuation and Motion control
Spherical and cylindrical roller bearings Angular contact ball bearings, medium deep groove
ball bearings and high precision bearing
Service Industrial aftermarkets
Sales via a network of distributor locations Support industrial customers with knowledge-based
service solutions to optimize plant asset efficiency Provide mechanical services, predictive and
preventive maintenance, condition monitoring, decision-support systems and performance-based contracts
Textile Machinery Component
OEMs and textile millls Precision textile machinery components Help textile mills modernize existing machines.
Clients spread across diversified sectors

-4-
SKF India Limited
Growth Drivers
Growth in user segments holds the key to SKF’s growth: Demand for various types of bearings is derived from its key user segments viz. auto & auto ancillaries and other industrial applications. Auto and auto ancillary sector contributes nearly 45 per cent of the total bearings demand while the industrial application segment accounts for the remaining 55 per cent. Nearly 40 per cent of SKF’s sales have been contributed by the automobile sector.
o Auto sector is on the path of revival: Indian auto sector has shown signs of revival since early 2009-10 after showing negative growth in 2008-09. Reflecting signs of recovery in the economy, the commercial vehicles segment is also reviving with demand arising from the infrastructure sector.
o India targeted as major outsourcing hub by many automobile companies
o Growth of IIP shows demand from the industrial sector is up: The IIP index has shown consistent double-digit growth since November 2009. Government investment in the infrastructure sector coupled with private sector participation can generate growth opportunities for the bearing industry domestically.
Robust reputation among OEMs provides revenue visibility in the aftermarket segment as well: SKF is an established player among the OEMs. The company has a strong presence in the aftermarket segment as well. A balanced mix between OEM and aftermarket business is a positive for the company, because, during periods of economic downturn when OEMs tend to curb their production, the aftermarket segment continues to grow, thereby effectively mitigating risk to the overall growth in revenue. Also, this helps in maximizing return on investments as the entire product cycle - through new product launch to replacement is put to full use.
Capacity expansion; tie up with key industry players: SKF’s production capacity of Ball bearings will grow by nearly 40 per cent (as compared to FY08 capacity) after opening of its Haridwar plant. The enhanced capacity is expected to contribute to its top line growth from 1Q’FY10. Moreover, the company has a strategic tie up with Hero Honda to fulfill its requirement.
Long-term supply contract with Suzlon: SKF has an agreement with Suzlon Energy for supplying bearings for its wind turbines, over a tenure of more than five years. It will also provide other services such as grease, customized housing generator bearings and reliability services. The agreement worth Euro 303 million will ensure long term revenue visibility for SKF.
New Business Initiatives
Establishing first ‘SKF Solution factory’ in Pune: In order to offer customized solutions and easy availability near the customers, SKF opened its first solution factory in Pune. It will provide bearing remanufacturing and spindle services and going forward will add customized product services, remote diagnostics, customized sealing solutions, lubrication oil station assembly etc. The ultimate objective is to make offerings from its five technology platforms more available for customers.
Automotive and Industrial applications drive revenue of bearing manufacturers
Established name among OEMs gives exposure to aftermarket segment
Initiative to provide customized solution near the customer
Capacity to increase by 40 per cent after new plants start running at full capacity

-5-
SKF India Limited
Ahmedabad plant to increase penetration in the Industrial segment: SKF’s plant in Ahmedabad is it's first factory in India for large sized bearings. The new factory will manufacture various types of medium to large sized bearings and serve customers segments such as railways, wind, power generation, mining and construction, material handling equipment, power transmission and industrial electrical.
Global testing center to reduce lead-time: SKF recently opened a global testing center at Bangalore to reduce the developmental lead-time. The objective is to conduct testing at close proximity to the customer and enable product development process in a more cost effective way.
Key Risks
Cheap import from China: Low-cost imported bearings hurt domestic bearings manufacturers. Continuous reduction in customs duty over the years has encouraged demand growth for the imported bearings in the aftermarket segment. However, companies like SKF have figured out a way to differentiate themselves through offering a value proposition which is superior to a low-cost source.
Shrinking aftermarket business: Recent Government regulations have prohibited overloading of vehicles. The new generation of trucks has undergone vast changes with new design wheels and axles. Improved vehicle systems and road infrastructure are slowly making bearings a non-replacement part. Bearings are being designed to last for a lifetime. So, the aftermarket business over the years is expected to shrink in years to come.
Higher commodity prices may put margin pressure: Steel and Alloy Steel forms the basic raw material for bearings. SKF is indirectly exposed to fluctuation of steel prices as it sources significant part of cost of goods sold (cost of bought-out parts and cost of traded goods sold combined forms nearly 93 per cent of cost of goods sold) from outside. As the commodity cycle is on an upward trend, this may put some pressure on the margins.
Import of spurious bearings due to price advantage pose a threat to market share
Better product quality, improved road infrastructure, prohibition on vehicle overloading will gradually affect aftermarket sales

-6-
SKF India Limited
Profitability SKF’s revenue growth closely linked to growth of user industries
SKF’s revenue grew significantly in FY06 supported by strong growth in manufacturing sector, which grew more than 10 per cent during 2006-08. Growth slowed down in FY09 as the manufacturing and industrial sector witnessed significant downturn owing to global recession. The exports sales declined around 25 per cent. The share of the export in the total sales was lower at 7.1 per cent as compared to 9.0 per cent in the previous year.
SKF’s Revenue growth and IIP growth
1,351
1,579 1,630
1,584
65.5%
16.9%
3.3% -2.8%
8.2% 11.6%
8.5%2.8%
-10.0%
10.0%
30.0%
50.0%
70.0%
1,000
1,200
1,400
1,600
1,800
FY06 FY07 FY08 FY09
Gro
wth
(%)
Sale
s (R
s.in
Cor
ores
)
Revenue YoY Growth (%) IIP Index growth
Source: Company Annual Reports, Ministry of Statistics and Program Implementation, ICRA Online Research The company introduced Direct Customer Delivery in FY05-FY06, a new initiative that acts as a single window between the company and its customers. Through the system, the company can directly handle transactions and delivery of goods to its customers worldwide. The benefit of the system was realized from FY06 onwards. Indigenously produced bearings are resilient Bearings produced and sold in India, proved resilient during the turbulent period of FY09 as compared to traded goods, which includes imported Ball and Roller bearings. Similarly, Textiles Machinery components segment also witnessed a downturn in FY09 as compared to FY08.
Revenue break-up
712 785 791 801
580 670 734 703
43 48 23 14 16 76 82 66
-
400
800
1,200
1,600
2,000
FY06 FY07 FY08 FY09
Rs.
in c
ores
Others Textile machineries Traded Bearings Bearings (Manufactured and sold)
Source: Company Annual Reports, ICRA Online Research
Indigenously produced and domestically supplied bearings provide hedge from slowdown

-7-
SKF India Limited
Sales growth in the indigenously produced bearings in FY09 were driven more by volume as realisation per unit fell during the period. However, volume growth and pricing balanced out to maintain overall growth of the segment. In case of traded bearings, volume grew by 46.7 per cent in FY09, while realisation declined by 40 per cent as compared to FY08.
Volume growth and realization per unit Particulars FY06 FY07 FY08 FY09 Volume of manufactured bearings sold ('000) 94,834 97,872 96,516 103,246 YoY growth (%) 3.2% -1.4% 7.0% Volume of traded bearings (‘000) 14,206 11,947 8,484 12,446 YoY growth (%) -15.9% -29.0% 46.7% Realization per unit of manufactured bearings (Rs.) 75.1 80.24 81.96 77.62 YoY growth (%) 6.8% 2.1% -5.3% Realization per unit of traded bearings (Rs.) 18.75 95.17 111.27 66.73 YoY growth (%) 407.5% 16.9% -40.0%
Source: Company Annual Report, ICRA Online Research
Margins declined on lower growth of revenue SKF’ EBIT margins have declined since FY07 on lower sales growth as compared to operating costs. Operating cost as a percentage of sales has increased from 85.2 per cent in FY07 to 91.7 per cent in FY09 causing the EBIT margin to decline from 14.8 per cent in FY07 to 8.3 per cent in FY09. Increase in raw material cost both in absolute terms as well as a percentage of sales, higher fixed cost such as employee cost on a low base of sales were more, and could not offset a decline in sales, distribution and general (SG&A) expenditure. Cost of goods sold as a percentage of sales increased from 60.6 per cent in FY07 to 65.9 per cent in FY09, driven by higher cost of raw materials. Although, cost of raw materials forms a relatively smaller part of the total cost of goods sold (nearly 3 per cent), these have increased from Rs.22.5 crores in FY07 to Rs. 37.2 per cent in FY09, a CAGR of 28.7 per cent. Among the fixed costs, employee cost during FY07-FY09 period increased at a CAGR of 9.8 per cent while sales growth (CAGR) was marginal during the period. As a percentage of sales, employee cost increased from 7.7 per cent in FY07 to 9.2 per cent in FY09. SG&A expenditure during the period declined marginally in both absolute and as a percentage of sales during the period. The company incurred a one time restructuring cost of Rs. 16.7 crores, arising out of a Voluntary Retirement Scheme for its employees
Increase in raw material cost, higher fixed cost such as employee cost on a low base of sales caused a decline in EBIT margins
Volume growth offsets decline in realisations

-8-
SKF India Limited
Margin trends
146
234
179
131
175
265
208
160
10.8%
14.8%
11.0%8.3%
12.9%
16.8%
12.8%10.1%
8%
10%
12%
14%
16%
18%
-
50
100
150
200
250
300
FY06 FY07 FY08 FY09
Mar
gin(
%)
Rs.
in c
rore
s
EBIT (LHS) EBITDA (LHS)EBIT Margin (RHS) EBITDA Margin (RHS)
Source: Company Annual Reports, ICRA Online Research Input Cost Almost all parts of all ball bearings are made of steel. Since the bearing undergoes significant stress, use of high quality steel is important.
Input costs Particulars FY06 FY07 FY08 FY09 Cost of Raw material 32.3 22.5 25.4 37.2
% to sales 2.40% 1.40% 1.60% 2.30% Cost of bought-out parts 293.8 386.4 398.3 378.9
% to sales 21.80% 24.50% 24.40% 23.90% Cost of traded goods sold 550.9 559.2 630 596.2
% to sales 40.80% 35.40% 38.60% 37.60% Others -2.3 -10.9 -16.6 31.2 Total Cost of Goods Sold 874.6 957.2 1,037.10 1,043.40
% to sales 64.70% 60.60% 63.60% 65.90% Source: Company Annual Reports, ICRA Online Research
Cost of steel as a raw material for SKF forms a smaller part (3.6 per cent) of the overall cost of goods sold, and it is exposed to fluctuation of raw material prices as it sources a huge part of its requirements in the form of bought out components and imports.
Break – up of Cost of goods sold
RM Cost4%
Bought-out parts36%
Cost of traded goods
57%
Others3%
Source: ICRA Online Research
Exposure to fluctuation in raw material prices

-9-
SKF India Limited
Return Ratios A slow down in the user industries and lower realizations following heavy decline in export sales dragged down the profitability SKF India. A decline in profitability caused the key ratios such as ROE and ROCE to fall in the recent years.
Trends of Return Ratios
24.1%
29.5%
19.8% 13.2%
34.2%
42.6%
27.6%
18.3%
10.0%
15.0%
20.0%
25.0%
30.0%
35.0%
40.0%
45.0%
FY06 FY07 FY08 FY09
Rat
ios
ROE ROCE
Source: ICRA Online Research ROE Break up
Net margin trend Turnover ratios
Source: ICRA Online Research Competitor Analysis We have compared SKF with its closest peer group. There are 12 companies in the organized sector of Indian bearing Industry. We have chosen the peer group considering SKF’s product segments and their user segments.
Particulars Year End CMP M Cap
Revenue (TTM)
EBIT Margin (TTM)
EPS (TTM) P/E EV/EBITDA
SKF India Dec-09 479 2,526 1,771 9.8% 23.4 20.5x 11.0x
ABC Bearings Mar-10 121 139 188 16.9% 17.8 6.8x 4.7x
Bimetal Bearings Mar-10 267 102 115 11.6% 22.3 12.0x 4.0x
Fag Bearings Dec-09 580 964 866 15.4% 44.6 13.0x 7.0x
NRB Bearings Mar-10 91 438 387 14.0% 6.4 14.1x 7.9x
Timken India Dec-09 137 872 329 15.4% 5.7 24.2x 11.3x
Source: Company Reports, BSE, Capitaline, ICRA Online Research Market cap and Revenue in Rs. crores
Return ratios declined due to fall in profitability
1.9 1.81.7
1.51.71.6
1.5 1.51.3
1.5
1.8
2.0
FY06 FY07 FY08 FY09
Rat
ios
Asset Turnover Total Assets / Total Equity
7.3%
10.2%
7.8%
5.9%
5.0%
6.0%
7.0%
8.0%
9.0%
10.0%
11.0%
FY06 FY07 FY08 FY09
Rat
ios
Net Margin

-10-
SKF India Limited
OEMs60%
Replacement Market40%
Bearings Industry Overview The size of the bearings industry in India is around Rs. 60 billion. The organized sector which primarily caters to the OEM customers accounts for nearly 60 per cent of the total industry revenues while the unorganised sector (15 per cent) and imports (25 per cent) contribute for the rest.
Supply of Bearings Demand generators
Source: Company Annual Report, Company Website
Distribution of Industry revenue sources Distribution of Automobile OEM sales
Source: Bearingstrade.com, ICRA Online Research The key customers for the organized sector are automobile companies, railways and other industrial users. The unorganized sector caters to the replacement market and forms the core of the cheap imports most of which are shipped into the market through illegal routes. In terms of user industries, automotive segment accounts for 45 per cent of the revenue, and the remaining 55 per cent of revenue is contributed by the industrial demand. In the automotive segment, the organized sector contributes nearly 50 per cent of the industry’s demand. About 15 per cent of the total automotive demand is met by the unorganized sector and the remaining 35 per cent is fulfilled through imports. Out of the total revenues of the industry, 60 per cent of the revenues are contributed by the OEMs and the remaining 40 per cent is generated by the demand from the aftermarket.
Organised 60%
Unorganised15%
Imports25%
OEMs are the largest revenue generators
Demand from automotive and industrial segments is well balanced
Automotive45%
General Engineering
28%
Heavy Industries &
Railways21%
Electrical Equipments
& others6%
Imports50%
Organised sector35%
Unorganised sector15%

-11-
SKF India Limited
In the aftermarket segment, 6 per cent of the demand comes from the engineering applications segment, 5 per cent from LCV segment, 4 per cent from MUV segment, 8 per cent from car segment, 11 per cent from tractor segment, and the remaining 15 per cent from automotive ancillary segment. Rest of the 50 per cent demand is from the Railways. Demand drivers for the bearing industry The bearings market derives its demand from the following sectors:
Automobile General engineering and heavy industries Railways Electrical equipments
Demand for bearings arises from the OEMs and replacement market. A few key factors, which lead to demand generation of the bearing industry in India, are as follows:
Rapid Growth in automobile Industry Requirement of high quality bearings from the replacement market driven by
quality and reliability factors Greater infrastructure development activities driving commercial vehicle
segment Requirement from renewable energy sector such as wind turbines Utilization of tractors in the agricultural sector
Industry Growth The bearing industry has witnessed a CAGR of 9 per cent during 2003-2008. The growth dropped, and the sector grew nearly 1.5 per cent during 2008-09, mainly due to a slow down in its two key drivers viz. automobile and industrial production. Key players There are twelve leading players in the organized space of Indian bearing industry, whereas there are about 450 to 500 number of spurious bearing assembly units situated in various parts of the country. Among the organized players, SKF is market leader in ball bearing segment (41 per cent market share) which is the largest segment of the bearings market, while FAG has a strong presence in the cylindrical roller bearing (CRB) and spherical bearing (CRB) segments. NBC has a market share of nearly 23 per cent in the taper roller bearing segment and NRB is the market leader in needle roller ball bearing segment (almost 100 per cent market share). As the industry is technology intensive, most of the domestic players have tied up with established global players to gain technical know how. Most such tie-ups have so far have been joint venture partnerships.
Key players and their turnover FY08: Total sales Rs. 50 billion
Key segments Share to overall Bearings industry
Company Market share in the segment
Ball Bearings 60% SKF 41% Tapper Roller Bearing 25% NBC 23% Cylindrical Roller Bearing 7% Spherical Roller Bearing 3% FAG 60% Needle Roller Bearing 5% NRB 100%
Source: ICRA Online Research
Railways make up for a large 50 per cent of aftermarket sales
Slowdown in bearing industry growth in FY 09
Each player dominates in different segments of the bearing industry

-12-
SKF India Limited
Summary Financials Profit & Loss Statement
Particulars (Rs crores) FY06 FY07 FY08 FY09 Net Sales 1342.49 1568.3 1620.2 1570.9 Other op. Revenue - 10.7 10.2 13.1 Total Revenue 1,342.5 1,579.0 1630.4 1584.1 Growth (%) 17.6% 3.3% -2.8% Cost of Good Sold (874.6) (957.2) (1,037.1) (1,043.4) Gross Profit 467.9 621.8 593.3 540.6 Growth (%) 32.9% -4.6% -8.9% Employee Costs (100.6) (121.4) (127.6) (146.3) Other Expenditure (200.9) (235.1) (257.8) (234.6) EBITDA 166.5 265.2 207.9 159.7 Growth (%) 59.4% -21.6% -23.2% Depreciation (28.8) (30.8) (28.9) (29.0) EBIT Profit 137.6 234.4 179.0 130.7 Growth (%) 70.3% -23.6% -27.0% Net Interest expense 4.5 13.0 15.4 12.4 Other Income(expense) 11.0 - - - Profit before Tax 153.1 247.4 194.4 143.1 Growth (%) 61.5% -21.4% -26.4% Income Tax (51.2) (86.7) (66.7) (48.9) Profit after Tax 102.0 160.7 127.7 94.2 Growth (%) 57.6% -20.6% -26.2% Extra Ordinary Items - - - - Net Profit 102.0 160.7 127.7 94.2 Basic EPS 19.30 30.50 24.20 17.87 Diluted EPS 19.30 30.50 24.20 17.87 DPS 4.5 6.0 4.5 4.0 Equity Capital 52.73 52.73 52.73 52.73 Face value 10 10 10 10
Ratio Analysis Particulars (Rs crores) FY06 FY07 FY08 FY09 Margins Gross Margin (%) 34.9% 39.4% 36.4% 34.1% EBITDA Margin (%) 12.4% 16.8% 12.8% 10.1% EBIT Margin (%) 10.3% 14.8% 11.0% 8.3% Net Profit Margin (%) 7.6% 10.2% 7.8% 5.9% Valuation EPS 19.3 30.5 24.2 17.9 BVPS 80.1 103.4 122.3 135.5 P/E (x) 24.8 15.7 19.8 26.8 P/BV (x) 6.0 4.6 3.9 3.5 EV/ EBITDA (x) 13.4 8.4 10.8 14.0 EV/ Sales (x) 1.7 1.4 1.4 1.4 Profitability ROCE (%) 32.6% 43.0% 27.7% 18.3% RONW (%) 24.1% 29.5% 19.8% 13.2% Solvency Ratio Deb/ Equity Ratio (x) 0.0 0.0 0.0 0.0 Turnover Ratio Inventory T/o Days 62 59 68 70 Debtors T/o Days 44 43 47 49 Creditors T/o Days 59 52 61 88 Other Ratios Dividend Payout (%) 45% 60% 45% 40% Dividend Yield (%) 0.94% 1.25% 0.94% 0.83%
-13-
SKF India Limited
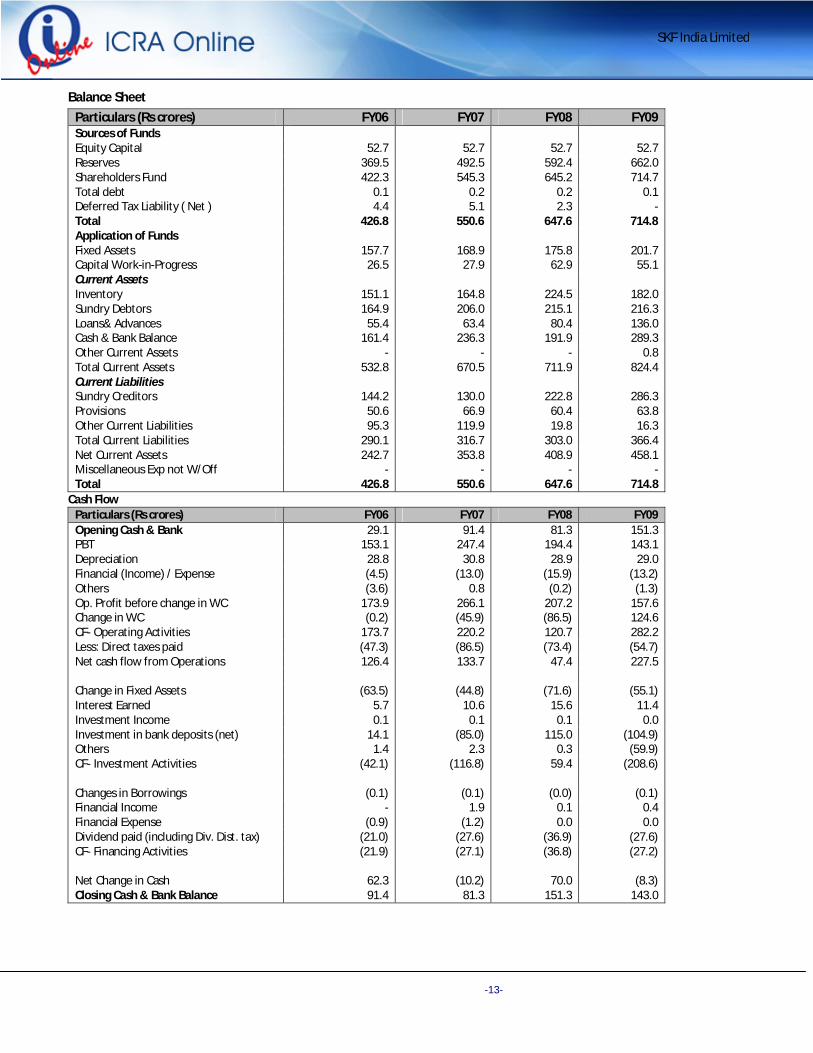
Balance Sheet Particulars (Rs crores) FY06 FY07 FY08 FY09 Sources of Funds Equity Capital 52.7 52.7 52.7 52.7 Reserves 369.5 492.5 592.4 662.0 Shareholders Fund 422.3 545.3 645.2 714.7 Total debt 0.1 0.2 0.2 0.1 Deferred Tax Liability ( Net ) 4.4 5.1 2.3 - Total 426.8 550.6 647.6 714.8 Application of Funds Fixed Assets 157.7 168.9 175.8 201.7 Capital Work-in-Progress 26.5 27.9 62.9 55.1 Current Assets Inventory 151.1 164.8 224.5 182.0 Sundry Debtors 164.9 206.0 215.1 216.3 Loans& Advances 55.4 63.4 80.4 136.0 Cash & Bank Balance 161.4 236.3 191.9 289.3 Other Current Assets - - - 0.8 Total Current Assets 532.8 670.5 711.9 824.4 Current Liabilities Sundry Creditors 144.2 130.0 222.8 286.3 Provisions 50.6 66.9 60.4 63.8 Other Current Liabilities 95.3 119.9 19.8 16.3 Total Current Liabilities 290.1 316.7 303.0 366.4 Net Current Assets 242.7 353.8 408.9 458.1 Miscellaneous Exp not W/Off - - - - Total 426.8 550.6 647.6 714.8
Cash Flow Particulars (Rs crores) FY06 FY07 FY08 FY09 Opening Cash & Bank 29.1 91.4 81.3 151.3 PBT 153.1 247.4 194.4 143.1 Depreciation 28.8 30.8 28.9 29.0 Financial (Income) / Expense (4.5) (13.0) (15.9) (13.2) Others (3.6) 0.8 (0.2) (1.3) Op. Profit before change in WC 173.9 266.1 207.2 157.6 Change in WC (0.2) (45.9) (86.5) 124.6 CF- Operating Activities 173.7 220.2 120.7 282.2 Less: Direct taxes paid (47.3) (86.5) (73.4) (54.7) Net cash flow from Operations 126.4 133.7 47.4 227.5
Change in Fixed Assets (63.5) (44.8) (71.6) (55.1) Interest Earned 5.7 10.6 15.6 11.4 Investment Income 0.1 0.1 0.1 0.0 Investment in bank deposits (net) 14.1 (85.0) 115.0 (104.9) Others 1.4 2.3 0.3 (59.9) CF- Investment Activities (42.1) (116.8) 59.4 (208.6)
Changes in Borrowings (0.1) (0.1) (0.0) (0.1) Financial Income - 1.9 0.1 0.4 Financial Expense (0.9) (1.2) 0.0 0.0 Dividend paid (including Div. Dist. tax) (21.0) (27.6) (36.9) (27.6) CF- Financing Activities (21.9) (27.1) (36.8) (27.2)
Net Change in Cash 62.3 (10.2) 70.0 (8.3) Closing Cash & Bank Balance 91.4 81.3 151.3 143.0

-14-
SKF India Limited
Contact Details:
Manish Kedia ICRA Online Limited, Phone: +91-22-67816163, Email: [email protected]
Disclaimer The report is without management meet. All information contained in this document has been obtained by ICRA Online Limited from sources believed by it to be accurate and reliable. Although reasonable care has been taken to ensure that the information herein is true, such information is provided 'as is' without any warranty of any kind, and ICRA Online Limited in particular, makes no representation or warranty, express or implied, as to the accuracy, timeliness or completeness of any such information. All information contained herein must be construed solely as statements of opinion, and ICRA Online Limited shall not be liable for any losses incurred by users from any use of this document or its contents in any manner. Opinions expressed in this document are not the opinions of our holding company and of the subsidiary companies and should not be construed as any indication of credit rating or grading of ICRA for any instruments that have been issued or are to be issued by any entity.
Published on behalf of The Stock Exchange Investors' Protection Fund Bombay Stock Exchange Ltd. P J Towers, Dalal Street, Mumbai. Tel: 22721233/34 www.bseindia.com