Embed Size (px)
Citation preview

Sketch-Based Crowd Modelling
Li Guan Burkhard C. Wunsche
Graphics Group, Department of Computer ScienceUniversity of Auckland, New Zealand,
Email: [email protected], [email protected]
Abstract
The creation of complex virtual worlds has expanded fromthe domain of designers and animators to that of generalusers with no background in computer graphics. Exam-ple applications are military simulations, urban planning,landscape design, search and rescue simulations, and so-cial media technologies such as “Second Life”. In manycases the user wants to create content containing hundredsor thousands of similar objects. Modelling and placingeach individual object is infeasible and new ways must befound to allow users to easily specify the distribution of alarge number of objects.
In this paper we introduce a sketch-based approach forcrowd modelling, which is intuitive and suitable for dif-ferent input devices such as mice, sketch pads, and touchscreens (Windows 7). We derive design requirements byanalysing real environments and by testing users’ abili-ties to characterise crowds and collections/accumulationsof objects. Based on these requirements we formulate amodel-by-example approach in which users sketch a sam-ple distribution of objects and our tool computes the com-plete “population” of objects over a domain specified witha sketched contour. In order to deal with different distri-bution patterns we first characterise the input and then useclustering and texture synthesis to replicate the character-istics over the domain. Initial results demonstrate that thetool gives plausible results for random, regular and clus-tered input and that it can be used in a wide variety ofmodelling applications.
1 Introduction
The use of virtual worlds and simulations is expandingrapidly and is now including such diverse applications asentertainment (games, movies), civil engineering, urbanplanning, visual impact studies, landscape design, socialmedia, education and training, and military and civil de-fense simulations. In many of these applications largecollections of objects are required such as crowds of peo-ple, forests of trees, or cities with thousands of houses andskyscrapers. Modelling and placing these objects by handis time consuming and cumbersome and new tools for thisprocess must be found.
Sketch-based interfaces for modelling are particu-larly attractive since they are intuitive (pen-and-papermetaphor), encourage creativity (Gross & Do 1996) andenable users to concentrate on the overall problems ratherthan details (Wong 1992). The past decade has seen atremendous increase in the design and use of sketch-basedinterfaces, e.g., for 3D modelling (Igarashia et al. 1999,
Copyright c©2011, Australian Computer Society, Inc. This paper ap-peared at the 12th Australasian User Interface Conference (AUIC 2011),Perth, Australia, January 2011. Conferences in Research and Practicein Information Technology (CRPIT), Vol. 117, Christof Lutteroth andHaifeng Shen, Ed. Reproduction for academic, not-for profit purposespermitted provided this text is included.
Joshi et al. 2010, Olsen et al. 2009), animation (Thorneet al. 2004, Li et al. 2006, Takahashi et al. 2005, Daviset al. 2003), gaming (Kloonigames Ltd. 2008), diagram-ming and interface design (Coyette et al. 2007, Schmiederet al. 2010, Plimmer et al. 2010), medical imaging (Ropin-ski et al. 2008), and robotics (Skubic et al. 2005, Sakamotoet al. 2009, Barber et al. 2010).
In this paper we investigate the use of sketch-basedinterfaces for crowd modelling. The term “crowd” isused here in a wider sense and refers to any large col-lection/accumulation/aggregation of objects. We investi-gate users’ mental model of “crowds” and determine waysto characterise them. We then use these characteristicsto model crowds by sketching example distributions overa user defined domain and then replicating the sketchedcharacteristics using cluster analysis and texture synthesistechniques.
Section 2 reviews relevant previous work in sketch-based modelling, crowd modelling and texture synthesis.Section 3 derives the requirements for our application.Section 4 presents the design of the system. We evaluateour application in section 5 and conclude the paper withsection 6, which also gives an overview of future work.
2 Literature Review
2.1 Crowd Modelling
A large variety of publications exists on crowd modellingand simulation. In general the authors are interested inthe behaviour of a crowd given an initial configuration.The arguably most natural way to achieve this is to use anagent-based method where each character is given its ownpersonal characteristics and goals. The concept has beeninitially used to simulate groups of animals (Reynolds1987), but also proved effective for simulating humancrowds (Funge et al. 1999, Sung et al. 2005). Agent-based methods are the key concept of the popular “MAS-SIVE” crowd simulator (Massive Software 2009), whichis used among others in movie production, traffic simula-tions, and advertisements. In some situations more controlof global behaviour is necessary and mathematical, physi-cally and statistically based methods have been employed.Examples include Bayesian decision processes (Metoyer& Hodgins 2004) and the use of partial differential equa-tions from continuum mechanics for describing local andglobal behaviour patterns of crowds (Treuille et al. 2006).
Very few resources are available on how to create theinitial configuration of crowds and object collections. Pro-fessional crowd simulation tools usually offer interfacesfor randomly generating crowds over a user defined do-main by specifying the size and/or density of charac-ters (WorldOfPolygons.com 2006). A spray interface fordistributing grass, trees and other objects over a terrainhas been presented by van der Linden (2001). Manyapplications define the positions of large groups of ob-jects using application specific physically or statisticallymotivated techniques. For example, “Terragen” uses en-
vironmental parameters and directional controls to mod-ify a fractal noise texture specifying the location of veg-etation (Planetside Software, 2006). Procedural meth-ods have been used for city simulations (Greuter et al.2003). Diffusion-advection equations are useful for time-dependent processes with distance constraints such as traf-fic patterns (Garcia 2000).
2.2 Sketch-Based Modelling
Over the past decade a large variety of sketch-basedmodelling applications has been devised. We are usingthe crowd modelling software presented in this paper in“LifeSketch”, a sketch-based framework for rapid proto-typing of complex animated 3D environments (Yang &Wunsche 2010, Wunsche et al. 2010).
The principal problem in sketch-based modelling of3D objects is that the user specified sketch is two-dimensional, whereas the modelled object is three-dimensional. This necessitates the introduction of geomet-ric constraints limiting the number of possible 3D shapescorresponding to the 2D input sketch.
For the modelling of “blobby” shapes silhouettes, con-tours, cross-sections and skeletons have been used as ge-ometric constraints. For example, for the popular “Teddyalgorithm” users draw the outline of a 3D shape, whichis subsequently generated by sampling and triangulatingthe contour, computing a skeleton, and rotating the sam-ple points around the skeleton (Igarashia et al. 1999).Karpenko et al. use implicit surfaces to “inflate” contoursto 3D bodies. As a result different sketched componentscan be easily blended together (Karpenko et al. 2002).Similar ideas are employed in ShapeShop (Schmidt et al.2006) and MIBlob which uses implicit surfaces to inflatecontours traced in medical images (de Araujo et al. 2004).
Two interesting application of silhouette-based algo-rithms are garment and tree modelling. For tree mod-elling the user sketches the outline of the crown of thetree and the algorithm computes a fitting branching struc-ture based on existing templates and a probabilistic dis-tribution (Chen et al. 2008). Garments can be modelledby sketching their outline and the algorithm automaticallyfits them to the body shape (Turquin et al. 2007). Gainet al. (2009) enable users to model 3D terrains by drawingthe silhouette, spine and bounding curves of both extrud-ing (hills and mountains) and embedding landforms (rivercourses and canyons). McCord et al. (2008) model orchidsby sketching the cross sections, outlines and deformationsof a flowers components.
The reviewed work demonstrates that sketch-basedmodelling is a powerful and popular approach for proto-typing 3D scenes. We are not aware of any sketch-basedinterface for modelling crowds.
2.3 Texture Synthesis
The user study in the next section will demonstrate thata “model-by-example” technique is a promising approachfor enabling users to design large and diverse crowds us-ing just a few sketches. The underlying concept is simi-lar to exemplar-based texture synthesis where a large im-age is generated from a smaller example image (“exem-plar”). We will employ such texture synthesis techniquesand hence present here a short overview of the most im-portant methods.
A large variety of texture synthesis techniques exists,but none is suitable to generate all types of textures. Proce-dural techniques (Perlin 1985, Turk 1991, Witkin & Kass1991, Worley 1996) are hard to control and, comparedto exemplar-based methods, limited in the variety of ma-terials that can be modeled. They often work well forstochastic textures and their applicability can be increasedby combining them with statistical sampling e.g., (Guoet al. 2000).
Parametric exemplar-based methods, as proposed in(Heeger & Bergen 1995, De Bonet 1997, Dischler et al.1998, Portilla & Simoncelli 2000, Bar-Joseph et al. 2001),rely on models of global statistical properties which serveas constraint function while matching statistics of the in-put and target texture. They are usually only successful insynthesizing homogeneous and stochastic exemplars.
Pixel-based methods (Efros & Leung 1999, Wei &Levoy 2000, Ashikhmin 2001) generate one pixel of theoutput texture at a time and hence offer a high level ofcontrol. The algorithm proposed in (Lefebvre & Hoppe2005, 2006) performs an iterative optimization to mini-mize the difference of the synthesis result to the origi-nal exemplar, where the distance is measured using thesum of squared differences (SSD) of local neighborhoods.Most pixel-based methods consider only a local neigh-bourhood for generating new pixels in the output textureand hence are unable to capture global structures and se-mantics (e.g., a tomato having only one stem) (Manke &Wunsche 2010). Optimization-based approaches use lo-cal similarity measures of pixel neighborhoods to definea global texture energy function that is minimized (Kwa-tra et al. 2005). One example is histogram equalisation toensure that input and output texture have the same colourdistribution (Kopf et al. 2007). The algorithm generatesvery high quality results, but is considerable slower thancomparable pixel-based techniques (Kopf et al. 2007).
Patch-based methods paste random patches of the ex-emplar into the output texture and optimize the transitionsbetween overlapping patches (Praun et al. 2000, Efros &Freeman 2001, Kwatra et al. 2003). They can hence beconsidered an extension of pixel-based methods. Since ineach step a patch is added to the texture they can oftencapture local semantics better, but they offer less controlover the results (Wei et al. 2009). A special case of patch-based methods are tiling-based techniques, such as “Wangtiles” which uses carefully constructed square tiles withmatching boundaries which can then be used to generatenew textures (Cohen et al. 2003).
3 Requirement Analysis
3.1 Analysis of Real Environments
In order to find a suitable interface for specifying a largevariety of crowds and collections of objects we eval-uated hundreds of images obtained with Google usingthe keywords “crowd”, “herd”, “flock of birds”, “forest”,“park”, “river boulders”, “containers”, “city” and “vil-lage”. We found that in all cases the overall look of thecrowd/collection could be characterised by the shape of itsdomain (the occupied region) and the pattern how com-ponents are distributed over it. The principal distribu-tion patterns of objects are regular, random and clustered.Each pattern has numerous subpatterns, e.g., “regular” canmean a regular grid (soldiers standing in line) or objectslined up along a curve (houses along a street in a sub-urb). We also found more complex patters, which couldbe regarded as regular, and combinations of any of thosepatterns. An example are flocks of geese where the mainshape formed by the geese is boomerang like, but somegeese are distributed seemingly randomly among them.
Based on this analysis a tool offering predefined crowdpatterns is too limited for out purposes and a “model-by-example” approach is most promising, where the usersspecifies an example distribution and the program repli-cates this distribution in a natural manner.
3.2 Pre-Design Study
In order to determine how users characterise large crowdsand collections of objects with just a few strokes we per-formed a user study.

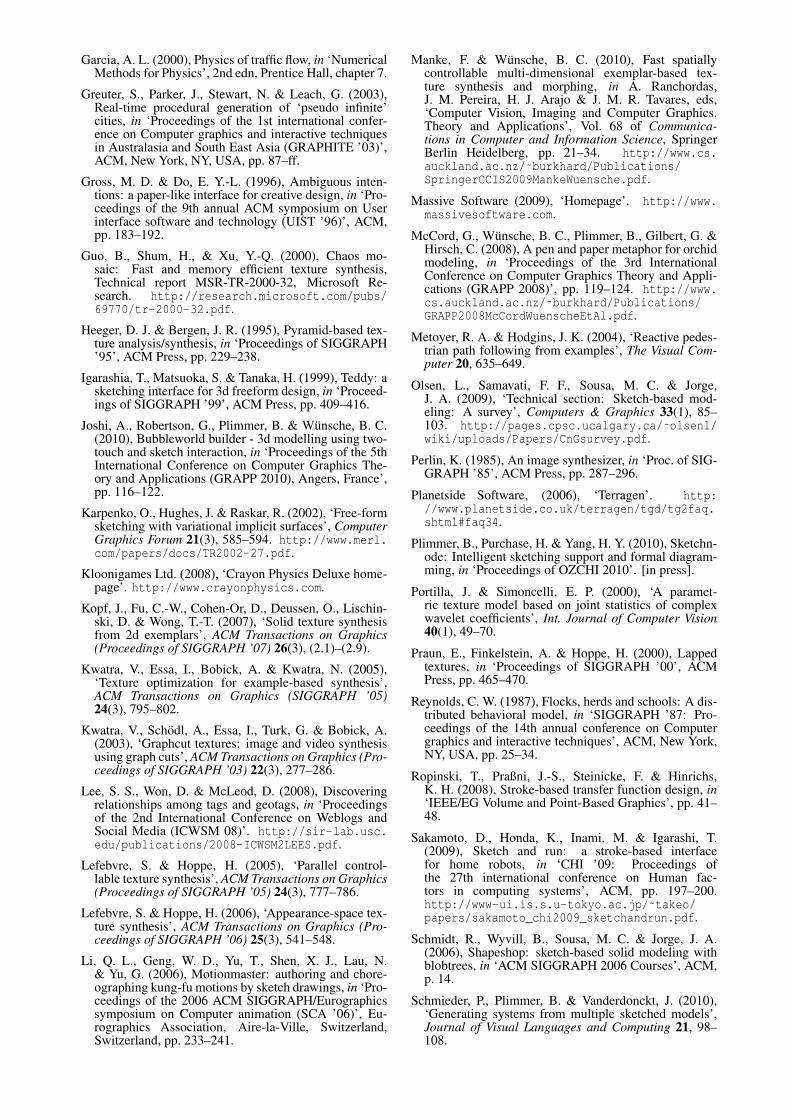
Contour Type Stroke Distribution Pattern Undesired Inputs Resulting Number of ObjectsC1 C2 C3 C4 C5 D1 D2 D3 D4 S G3 G4 Mean Median Standard Deviation
Task 1 17.65 41.18 0 0 35.29 82.35 17.65 5.88 0 17.65 11.76 29.41 100 219.82 269.54Task 2 58.82 29.41 5.88 11.76 5.88 94.12 5.88 41.18 0 17.65 47.06 5.88 48 67.24 71.41Task 3 82.35 11.76 5.88 0 0 5.88 94.12 5.88 17.65 5.88 0 17.65 110 170.88 184.56Task 4 11.76 29.41 5.88 5.88 52.94 100 0 5.88 0 11.76 29.41 17.65 70 283.18 468.63Task 5 47.06 29.41 11.76 5.88 11.76 17.65 82.35 0 0 5.88 17.65 17.65 120 198.12 202.95Task 6 5.88 35.29 17.65 47.06 29.41 88.24 5.88 58.85 5.88 0 47.06 11.76 47.5 66.00 42.65Task 7 35.29 29.41 11.76 0 23.53 70.59 29.41 11.76 0 52.94 35.29 11.76 19 48.65 78.16Task 8 23.53 41.18 11.76 0 23.53 52.94 47.06 23.53 0 47.06 47.06 11.76 45 70.12 97.32Task 9 41.18 35.29 17.65 5.88 5.88 47.06 52.94 29.41 0 23.53 41.18 5.88 42 180.00 472.41Task 10 29.41 29.41 5.88 5.88 35.29 41.18 58.82 23.53 0 35.29 29.41 17.65 60 100.88 151.65Task 11 17.65 41.18 5.88 5.88 35.29 100 0 17.65 0 23.53 29.41 0 75 146.47 197.30Task 12 5.88 29.41 29.41 11.76 35.29 70.59 29.41 23.53 0 23.53 23.53 11.76 70 120.00 140.9Task 13 5.88 47.06 17.65 0 29.41 88.24 11.76 17.65 0 35.29 52.94 17.65 12 24.18 30.08Task 14 47.06 29.41 5.88 0 17.64 94.12 5.88 17.65 0 17.65 41.18 11.76 36 68.71 60.98Task 15 52.94 17.65 17.65 5.88 11.76 11.76 88.24 11.76 0 29.41 35.29 11.76 73 119 114.49Task 16 11.76 23.53 5.88 0 47.06 94.12 5.88 17.65 0 35.29 17.65 29.41 47 115.44 196.03Task 17 23.53 11.76 5.88 0 52.94 88.24 5.88 17.65 0 52.94 29.41 11.76 32 61.31 69.34Task 18 5.88 35.29 35.29 23.53 17.65 82.35 5.88 64.71 5.88 29.41 41.18 17.65 42.5 66.29 72.95
Table 1: Results of the pre-design user study. The rows represent the tasks 1–18 and the first twelve columns thepercentage of participants using the type of contour, symbol and stroke distribution specified in subsection 3.2.2. Thelast three columns specify the mean, median and standard deviation of the estimated number of strokes which would fillthe domain if continuing the user’s example distribution.
3.2.1 User Study Design
The users were given eighteen tasks and were asked foreach task to:
1. Indicate the area covered by the objects using a singlesketch.
2. Indicate the distribution of objects using a small re-gion filled with around 5-20 short strokes indicatinghow the whole area would be covered by the objects.
The users were told to do the sketching as fast as possible(less than 20 seconds per task) and they were told to imag-ine that somebody else would complete the placement ofall objects for them based on their sketch. The eighteentasks were:
1. Sketch a crowd of 1000s of people at a festival.
2. Sketch a group of 100s of student in the school yardduring a break between classes.
3. Sketch an army of 1000s of soldiers marching in aparade.
4. Sketch a large natural forest with 10000s of trees.
5. Sketch a (human-planted) plantation forest with10000s of trees.
6. Sketch a botanical garden with dozens of small areasof trees, where each area contains at most 10 trees.
7. Sketch 100s of farms distributed over a wide area,e.g., central Otago.
8. Sketch a small village with about 100 houses.
9. Sketch a large city area with 100s of Skyscrapers(e.g., Manhattan).
10. Sketch a modern suburb with hundreds of houses.
11. Sketch a flock of 100s of sheep.
12. Sketch dozens of flocks of geese migrating to warmerareas.
13. Sketch 100 tigers in a large jungle. Assume thattigers are territorial, i.e., they like to keep a large areafor themselves.
14. Sketch 100s of toys lying in a child’s room.
15. Sketch hundreds of containers stored in a port.
16. Sketch 1000s of sea shells on a beach.
17. Sketch 100s or large boulders in a river bed.
18. Sketch dozens of small island groups in the SouthPacific Ocean. Each island group should have at most8 islands.
3.2.2 Results
The study had 17 participants, 8 male, 8 female and forone participant the gender was not specified. Two of theparticipants were in the 15-20 age bracket, 13 between 20-30 years old, and two 30-40 years old. All but one of theparticipants were either university students or had com-pleted a university degree. The fields of study/occupationwere Computer Science (10), Chemistry (2), Mathematics(2), Commerce (1), Science (1) and Education (1).
For each question we recorded the type of contourspecifying the domain and the distribution of strokes. Themain types of contours we discovered were:
C1 Rectangular contour
C2 Circular/ellipsoidal contour
C3 No contour
C4 Contours for cluster
C5 Irregular contour
Note that these characterisations are neither complete normutually exclusive. For example, triangular contours,which were use once by one participant, are not coveredby any of the above cases. Contours for clusters can becombined with any of the other contour types.
The main stroke distribution patterns were
D1 Random strokes/symbols
D2 Regular strokes/symbols
D3 Clustered strokes/symbols (regular/irregularrecorded as above)
D4 Clusters, but no strokes indicating positions withinclusters (regular/irregular recorded as above)
In addition we found that many participants used symbols(S) instead of strokes, especially when indicating large ob-jects such as houses and farms. We also recorded whenparticipants filled most (G4) or all of the domain (G3)with strokes/symbols. The results of the study are sum-marised in table 1.

It can be seen that most users prefer to sketch a rectan-gular or circular/ellipsoidal domain. The main exceptionswere task 4, 16 and 17, which all refer to natural objects(natural forest, beach and river). In contrast human madeobjects, such as a crowd of people or a village were usu-ally sketched with a rectangular or circular shape, eventhough in reality they inhibit highly irregular domains.
A potential problem is that many users also use con-tours to indicate clusters. The use of contours for this pur-pose varies widely between scenarios. For example, forthe botanical garden almost 80% of partcipants sketchingclusters surrounded them with extra contours. In othercases such as task 18 (island groups) less than 30% ofparticipants sketching clusters surrounded them with extracontours. The main difference is that real garden beds areusually clearly differentiated from the surrounding area,whereas island groups have no boundary to the surround-ing ocean.
In five instances users did not use closed contours. Allof these cases occurred for task 17 (river). For task 16(beach) one user only drew a single curve to outline thebeach/water boundary as illustrated in figure 2 (i). Bothcases are problematic since the domain of the intendedcollection of objects is not clearly defined and hence itwould be difficult to complete for another user or com-puter algorithm. In two cases (task 1 and task 2) usersdrew a contour within another contour, e.g., to indicate astage which is free of the audience.
In summary users do not seem to have a good mentalmodel of the shape of the domain occupied by a collec-tion of objects. Users created the most realistic contoursfor domains with clearly defined boundaries and scenesthey are likley to have seen numerous times, e.g., an armyof marching soldiers. In general users showed a reluc-tance to sketch irregular domains. Even for a natural for-est more than 40% of users chose a rectangular or circu-lar domain. In order to enable users to come up with thebest crowd model an application should allow changes ofcrowd contours and recognise any erroneously drawn con-tours. At the very least clear visual feedback needs to begiven on the recognised domain contour and the resultingobject distribution.
In terms of sketched stroke distribution patterns table 1suggests that in most cases users make appropriate choicesbetween regular and irregular distributions. For example,100% of users use an irregular pattern for the natural forstand 82% a regular pattern for the plantation forest. In con-trast, the use of clusters seems to be less intuitive. Evenin cases where clusters were explicitly specified, such astasks 6 and 18, less than 65% os participants sketch clus-ters of strokes. However, for task 4 where no word in-dicates the use of clusters more than 41% intuitively usethem. In 16 instances users drew only two clusters whichis not sufficient to determine the 2D arrangement of clus-ters. There were also 16 instances of users drawing someclusters of size one, so any synthesis method devised byus must allow such clusters.
In summary most users are able to intuitively choosebetween regular and irregular distributions. The use ofclusters seems to be less intuitive and hence, like before,it is important to give clear visual hints how a synthesizeddistribution is related to the sketched example distribution.
Observing the three rightmost columns of table 1 wecan see that most participants do not have a good feelingfor the size and density of an example distribution requiredto achieve a certain number of objects over a domain. Thenumber of objects specified in the eighteen tasks variedbetween 100s and 10000s whereas the estimated numberof objects resulting from user input usually varied between50 and 300.
However, there is a strong correlation between the den-sity of objects in reality and in the sketched distribution.Humans in a crowd and trees in a forests stand close to-gether and consequently participants drew strikes close to-gether resulting in a large estimated number of objects.
In contrast tigers in a jungle or farms in New Zealandhave large distances between individual objects, and con-sequently participants left large spaces between strokes re-sulting in much less objects than required. Note that froma logical perspective the sketch density should only de-pend on the required number of objects since a sketch onlyindicates a position in space and not the size of an object.We suspect that this problem can be partially alleviated bydrawing points instead of strokes. The main reason forusing strokes in the user study was that it is intuitive forpen-and-paper input and it is easier to recognise than smalldots.
Many users filled most or all of the domain with theexample distribution especially for task 6 (botanical gar-den), task 13 (tigers) and task 18 (small islands). Again itseems that a large size of objects or large distances inbe-tween objects encourages users to keep large gaps betweenstrokes.
Another unexpected result was that many users usedshapes and symbols to indicate objects, especially wherethe object had a large spatial extend such as in task 7(farms), task 8 (houses), and task 17 (large boulders).
Figure 1 demonstrates examples of expected sketch in-put and figure 2 illustrates unexpected results.
3.3 Summary
The analysis of real environments and the pre-design studysuggest that a feasible way to define a large variety ofcrowds and collections of objects is by defining its do-main and an example distribution. The program must beable to differentiate between different types of distribu-tions, such as regular, irregular and clustered, and mustbe able to replicate the characteristics of any such patternwithout merely repeating it. Replicating the characteris-tics means that the relative positions, directions, inherentpatterns, cluster sizes, and distribution densities should besimilar, but not necessarily completely identical. For ex-ample, when modelling groups of students it would lookunnatural if all groups have only, say, two different sizes.
The original input pattern must be part of the final dis-tribution since the user defined point locations might havean important meaning and removing them might be con-fusing.
The example distribution is best defined by simplemouse clicks rather than strokes, since our pre-user studyindicates that users associate stroke size with object size,which can influence the user’s perception of scale (i.e.,the distance between strokes). Clicking on points is alsoslightly more efficient and less cumbersome than drawingstrokes. The program must be stable, i.e., not crash withunexpected input, and the visual feedback should indicateto the user how the input should be modified if the resultis not the desired one.
4 Design
The problem of generating a distribution of objects overa domain based on an example distribution is similar tothe exemplar-based texture synthesis problem, i.e., to al-gorithmically construct a large image from a given smallerimage such that image characteristics are preserved. Thecurrent state of the art in that field is summarised in (Weiet al. 2009).
We can consider the example point distribution inputby the user as a black-and-white input texture where blackdots represent object locations. The problem then reducesto synthesising a new texture over the rest of the domain.Several difficulties arise:
• Most texture synthesis techniques are only good forcertain types of textures, e.g., regular textures orstochastic textures.

Figure 1: Examples of expected user input: (a) Task 3 - marching soldiers form a regular pattern within a rectangularshape. (b) Task 2 - students aggregate in small groups in a school yard with some individual students. (c) Task 4 - anatural forest has an irregular shape and trees are distributed densely and randomly within it.
Figure 2: Examples of unexpected user input: (a) Task 6 - Extra contours for each cluster of trees. (b) Task 8 - A circularcontour for a village and rectangular symbols for houses. (c) Task 15 - Connected symbols to indicate containers in aport (d) Task 1 - The sketched example distribution fills most of the region and its shape has an intended meaning (i.e.,people aggregating around a stage). Objects are indicated by crosses instead of strokes. (e) Task 13 - Sparsely distributedstrokes filling the whole region indicate tigers in a jungle [strokes have been redrawn digitally to enhance visibility]. (f)Task 1 - Shape of a crowd is described using a contour with a hole. (g) Task 12 - Regular stroke distribution along a curveand clusters overlapping in multiple coordinate directions [strokes have been redrawn digitally to enhance visibility]. (h)Task 5 - Intended regular pattern, but stroke number varies and rows are horizontally offset. (i) Task 16 - Beach regionnot clearly specified and the area to be occupied by seashells is undefined [strokes have been redrawn digitally to enhancevisibility].

• It is difficult to reproduce the characteristics of aninput texture with clusters since this would requirea very large neighbourhood for any similarity mea-sure used in the synthesis. This would dramaticallyslow down the synthesis process. Global optimiza-tion techniques might alleviate this problem, but aretoo slow (Kopf et al. 2007). In order to enable in-teractive modelling the texture synthesis techniquesmust be performed in near real-time.
• If we use an exemplar-based method, what is a suit-able input texture?
• The texture synthesis must leave the original user in-put unchanged
• Most leading texture synthesis techniques are ex-tremely complex and non-trivial to implement, soideally we would like to employ an open sourcemethod.
In order to resolve these problems our algorithm usesthe following steps:
1. Perform a cluster analysis and determine the numberof clusters in the user’s input
2. If the user input contains only one cluster then de-termine whether it is regular or stochastic, extract asuitable exemplar, and call a suitable exemplar-basedtexture synthesis method.
3. If the user input contains multiple clusters, then de-termine the properties of each cluster and the distri-bution of clusters and synthesise additional clusterswith similar characteristics.
We now explain the varies steps of this algorithm inmore detail.
4.1 Cluster analysis
In order to determine the number of clusters in the user in-put we employ a cluster analysis algorithms and calculatethe size and distribution of clusters. A complication oc-curs due to the fact that the user input can contain clustersof size one (see figure 1 (b)).
4.1.1 K-means and K-means++ Algorithm
The arguably most popular algorithm used in scien-tific and industrial applications is the k-means algorithm(Arthur & Vassilvitskii 2007), which aims to partition nobservations into k clusters in which each observation be-longs to the cluster with the nearest centre. We use theLloyd-algorithm which initially chooses k points as theinitial centres (means) of the clusters. In each iterationthe remaining points are assigned to the closest centresand for each thus created cluster a new mean is calculated,usually as arithmetic mean of the clustered points. The it-eration continues until the centres (means) do not changeanymore. The resulting algorithm minimises the squarederror function
J =k
∑j=1
∑X j∈Si
||X j−µi||2
of the distances between cluster points and cluster centers.Here Si, i = 1, . . . ,k are the k-clusters and ||X j−µi|| is thedistance measure between a data point X j and the clustercentre µi. For each cluster the new centre is computed
The results of the k-means algorithm are influenced bythree key parameters: The number of clusters k, the dis-tance metric employed (usually Euclidean distance) andthe initial choice of cluster centres. When the amount
of data is small, as in our case, the initial positions sig-nificantly effect outcomes. Another potential problem isthat each point has the same weight factor and as a resultthe arithmetic mean is not robust when clusters are mixedwith single points as illustrated in figure 1 (b). Possibleimprovements are discussed in (Xu & Wunsch II 2005).
The speed and accuracy of the k-means algorithm canbe improved by carefully choosing centres in the initialisa-tion using a probability function which takes into accountthe shortest distance of a potential centre point to the clos-est center already chosen (Arthur & Vassilvitskii 2007).This gives points far away from existing centres a higherprobability to be chosen. The thus resulting K-Means++algorithm has been proven to be superior both in theoryand practice (Shindler 2008) and has been successfully ap-plied in geography applications (Lee et al. 2008).
4.1.2 Determining the Correct Number of Clusters
Based on surveys of existing clustering algorithms (Xu &Wunsch II 2005, Shindler 2008) we decided that the k-means++ algorithm using the Lloyds k-means algorithm isthe best solution to deal with differently sized and shapedclusters and isolated points.
An important question in our application is the numberof clusters in the initial user input. This is not known a pri-ori and, in fact, there might be no definite answer as indi-cated in some of the images of figure 2. Some referencesin the literature recommend to estimate cluster numbersusing k-Fold Cross-Validation (Statsoft Ltd. 2010).
In our case we believe that this technique is not suit-able based on the limited input size and, in most cases,low number of clusters. In particular, in many cases theinput will consist of a single cluster and identifying suchcases correctly is critical. We choose instead an infor-mation theoretical approach which is similar to Sugar &James (2003). In the original article the authors aim tobe able to differentiate overlapping clusters with differentdensity distributions. In our case we assume that usersalways sketch clusters such that their boundaries do notoverlap. We hence compute the optimal number of clus-ters by computing the k-means++ algorithm for any num-ber for 1 ≤ k ≤ n where n is the number of input points.For each clusterisation we define a minimum spanningtree. The optimal value of k is found if the tree edgesbetween clusters are longer than the edges within clusters(see figure 3). While the resulting clustering might not beoptimal in a mathematical sense, we found that it best re-flects the way users draw clusters (see section 3). If thetree edges are all roughly similarly long for small valuesof k, then we consider the input to represent a single clus-ter.
4.2 Replicating an Input Point Distribution
After the correct number of clusters has been determined,it must be decided whether the user input is regular orstochastic. We do this by analysing the orientation ofthe edges of the minimum spanning tree. If the edgesarea aligned similarly, e.g., roughly horizontal and verti-cal, than the distribution is considered regular. If the treeedges have no predominant pattern than the distribution isconsidered irregular.
For a regular input distribution we choose the small-est enclosing square and use the thus created texture im-age as exemplar for a Wang tiling texture synthesis algo-rithm (Cohen et al. 2003). The algorithm finds the small-est repetitive texture, and simply tiles them together. Wefound that this algorithm preserves structures in the inputtexture well. A drawback reported in the literature is thatrepetitive patterns can be recognised for more stochasticinput textures (Zhang & Kim 2007). Since we only em-ploy the algorithm for near regular inputs this does notseem to represent a problem.

Figure 3: Illustration of the algorithm determining the optimal number of clusters. The k-means++ algorithm will becalled with 1≤ k≤ n, where n is the number of input points. For each clusterisation we define a minimum spanning tree.The optimal value of k is found if the tree edges between clusters are longer than the edges within clusters. In the abovefigure the optimal value would be k = 5.
Figure 4: Left: Sketch of a tree and of a clustered point distribution. Right: The synthesised point distribution and theresulting scene of a landscape with small “patches” of trees.
Figure 5: Left: Sketch of a tree and of a regular point distribution. Right: The synthesised point distribution and theresulting scene of a landscape with a forest plantation.
Figure 6: Left: Sketch of a tree and of an irregular point distribution and a domain for the synthesized points. Right: Thesynthesised point distribution and the resulting scene of a landscape with a natural forest.

For irregular distributions we choose the exemplar tex-ture analogously, but then apply a Chaos Mosaic algo-rithm (Guo et al. 2000).
For a clustered input we compute the mean and stan-dard deviation of the size of all clusters and of the dis-tances of the points in them to the respective centers. Wethen generate new clusters based on these probability dis-tributions. The clusters are then randomly placed subjectto a minimum distance criterion. Currently we are unableto replicate regular clusters, but might be able to do thatby utilising the previous described texture synthesis algo-rithms and then extracting appropriately sized patches.
5 Results
We have implemented the above described algorithms us-ing Microsoft Visual C++ and OpenGL. So far we haveonly integrated the generation of sketched tree objectswith our crowd generation software. Work is underwayon the full integration of “LifeSketch” in order to allowgeneration of large collections of arbitrary objects suchas buildings and characters. Figures 4–6 demonstrate thatour application gives realistic results for regular, irregularand clustered input. All textures are synthesised in real-time.
More work is necessary to generalise the synthesis al-gorithms, i.e., to allow clusters with regular point distri-butions, and to deal with structured input which is not in-herently regular as illustrated in image 2 (g). Also thestructure of clusters should be considered, i.e., to allowregularly arranged clusters. This could be achieved byconsidering cluster centres as input texture and then firstsynthesising locations of new clusters and then their actualshape.
6 Conclusion and Future Work
We have presented a user study evaluating the representa-tion of different types of crowds and collections of objectsusing sketch input. The results demonstrate that a dif-ferentiation into regular, irregular and clustered patternsis intuitive and effective. Problems exist with abstractingsize of objects and their spatial distribution: when dealingwith small objects which are widely spaced users tend todraw widely spaced sketches even though a sketch repre-sents just a location in space. Our tool uses point input andfurther studies need to explore whether the same problemwill exist when using our “LifeSketch” software.
Based on the results of the users study we designed anovel algorithm for synthesising large point distributionsfrom sketched user input. The algorithm uses a combina-tion of a minimum spanning tree algorithm, k-means++ al-gorithm, and probabilistic approach for characterising ex-ample point distributions. New point distributions are gen-erated using different texture synthesis algorithms whichtake into account the inherent structure of the input tex-tures. Preliminary results suggests that a wide variety ofcomplex environments containing large collections of ob-jects can be modelled that way.
More work needs to be done to increase the range ofreproducible input distribution patterns. Also we want tofully integrate our crowd modelling software into “LifeS-ketch” and perform user testing to determine its effective-ness, intuitiveness and ease-of-use. We are keen to usethe same tasks as in section 3 and to investigate whetherusers produce the same sketch input as on paper and howan interactive approach assists with generating the desiredresults.
References
Arthur, D. & Vassilvitskii, S. (2007), k-means++: the ad-vantages of careful seeding, in ‘Proceedings of the eigh-
teenth annual ACM-SIAM symposium on Discrete al-gorithms (SODA ’07)’, Society for Industrial and Ap-plied Mathematics, Philadelphia, PA, USA, pp. 1027–1035. http://ilpubs.stanford.edu:8090/778.
Ashikhmin, M. (2001), Synthesizing natural textures, in‘Proceedings of I3D ’01’, ACM Press, pp. 217–226.
Bar-Joseph, Z., El-Yaniv, R., Lischinski, D. & Werman,M. (2001), ‘Texture mixing and texture movie synthesisusing statistical learning’, IEEE Transactions on Visu-alization and Computer Graphics 7(2), 120–135.
Barber, C. M., Shucksmith, R. J., MacDonald, B. &Wunsche, B. C. (2010), Sketch-based robot program-ming, in ‘Proceedings of IVCNZ 2010’. [in press].
Chen, X., Neubert, B., Xu, Y.-Q., Deussen, O. &Kang, S. B. (2008), Sketch-based tree modelingusing markov random field, in ‘ACM SIGGRAPHAsia 2008 papers’, ACM, New York, NY, USA,pp. 1–9. http://graphics.cs.yale.edu/xuejin/SketchBasedTreeModeling_chenSiggraphAsia.pdf.
Cohen, M. F., Shade, J., Hiller, S. & Deussen, O. (2003),‘Wang tiles for image and texture generation’, ACMTrans. Graph. 22(3), 287–294.
Coyette, A., Kieffer, S. & Vanderdonckt, J. (2007),Multi-fidelity prototyping of user interfaces, inC. Baranauskas, P. Palanque, J. Abascal & S. Bar-bosa, eds, ‘Human-Computer Interaction INTERACT2007’, Vol. 4662 of Lecture Notes in Computer Science,Springer Berlin / Heidelberg, pp. 150–164.
Davis, J., Agrawala, M., Chuang, E., Popovic, Z. &Salesin, D. (2003), A sketching interface for ar-ticulated figure animation, in ‘Proceedings of the2003 ACM SIGGRAPH/Eurographics symposiumon Computer animation (SCA ’03)’, EurographicsAssociation, pp. 320–328. http://graphics.stanford.edu/papers/sketch_interface/Davis_149_SketchingAnimation_SCA2003.pdf.
de Araujo, B., Jorge, J., Sousa, M. C., Samavati, F. &Wyvill, B. (2004), MIBlob: a tool for medical visual-ization and modelling using sketches, in ‘SIGGRAPH’04: Posters’, ACM Press, p. 107.
De Bonet, J. S. (1997), Multiresolution sampling pro-cedure for analysis and synthesis of texture images,in ‘Proceedings of SIGGRAPH ’97’, ACM Press,pp. 361–368.
Dischler, J.-M., Ghazanfarpour, D. & Freydier, R. (1998),‘Anisotropic solid texture synthesis using orthogonal 2dviews’, Computer Graphics Forum 17(3), 87–95.
Efros, A. A. & Freeman, W. T. (2001), Image quilting fortexture synthesis and transfer, in ‘Proceedings of SIG-GRAPH ’01’, ACM Press, pp. 341–346.
Efros, A. A. & Leung, T. K. (1999), Texture synthesisby non-parametric sampling, in ‘Proceedings of ICCV’99’, IEEE Computer Society, pp. 1033–1038.
Funge, J., Tu, X. & Terzopoulos, D. (1999), Cognitivemodeling: knowledge, reasoning and planning for in-telligent characters, in ‘Proc. of the 26th annual confer-ence on Computer graphics and interactive techniques(SIGGRAPH ’99)’, ACM Press/Addison-Wesley Pub-lishing Co., New York, NY, USA, pp. 29–38.
Gain, J., Marais, P. & Strasser, W. (2009), Terrain sketch-ing, in ‘Proceedings of the 2009 symposium on In-teractive 3D graphics and games I3D ’09’, ACM,pp. 31–38. http://people.cs.uct.ac.za/˜jgain/publications/terrsketch.pdf.
Garcia, A. L. (2000), Physics of traffic flow, in ‘NumericalMethods for Physics’, 2nd edn, Prentice Hall, chapter 7.
Greuter, S., Parker, J., Stewart, N. & Leach, G. (2003),Real-time procedural generation of ‘pseudo infinite’cities, in ‘Proceedings of the 1st international confer-ence on Computer graphics and interactive techniquesin Australasia and South East Asia (GRAPHITE ’03)’,ACM, New York, NY, USA, pp. 87–ff.
Gross, M. D. & Do, E. Y.-L. (1996), Ambiguous inten-tions: a paper-like interface for creative design, in ‘Pro-ceedings of the 9th annual ACM symposium on Userinterface software and technology (UIST ’96)’, ACM,pp. 183–192.
Guo, B., Shum, H., & Xu, Y.-Q. (2000), Chaos mo-saic: Fast and memory efficient texture synthesis,Technical report MSR-TR-2000-32, Microsoft Re-search. http://research.microsoft.com/pubs/69770/tr-2000-32.pdf.
Heeger, D. J. & Bergen, J. R. (1995), Pyramid-based tex-ture analysis/synthesis, in ‘Proceedings of SIGGRAPH’95’, ACM Press, pp. 229–238.
Igarashia, T., Matsuoka, S. & Tanaka, H. (1999), Teddy: asketching interface for 3d freeform design, in ‘Proceed-ings of SIGGRAPH ’99’, ACM Press, pp. 409–416.
Joshi, A., Robertson, G., Plimmer, B. & Wunsche, B. C.(2010), Bubbleworld builder - 3d modelling using two-touch and sketch interaction, in ‘Proceedings of the 5thInternational Conference on Computer Graphics The-ory and Applications (GRAPP 2010), Angers, France’,pp. 116–122.
Karpenko, O., Hughes, J. & Raskar, R. (2002), ‘Free-formsketching with variational implicit surfaces’, ComputerGraphics Forum 21(3), 585–594. http://www.merl.com/papers/docs/TR2002-27.pdf.
Kloonigames Ltd. (2008), ‘Crayon Physics Deluxe home-page’. http://www.crayonphysics.com.
Kopf, J., Fu, C.-W., Cohen-Or, D., Deussen, O., Lischin-ski, D. & Wong, T.-T. (2007), ‘Solid texture synthesisfrom 2d exemplars’, ACM Transactions on Graphics(Proceedings of SIGGRAPH ’07) 26(3), (2.1)–(2.9).
Kwatra, V., Essa, I., Bobick, A. & Kwatra, N. (2005),‘Texture optimization for example-based synthesis’,ACM Transactions on Graphics (SIGGRAPH ’05)24(3), 795–802.
Kwatra, V., Schodl, A., Essa, I., Turk, G. & Bobick, A.(2003), ‘Graphcut textures: image and video synthesisusing graph cuts’, ACM Transactions on Graphics (Pro-ceedings of SIGGRAPH ’03) 22(3), 277–286.
Lee, S. S., Won, D. & McLeod, D. (2008), Discoveringrelationships among tags and geotags, in ‘Proceedingsof the 2nd International Conference on Weblogs andSocial Media (ICWSM 08)’. http://sir-lab.usc.edu/publications/2008-ICWSM2LEES.pdf.
Lefebvre, S. & Hoppe, H. (2005), ‘Parallel control-lable texture synthesis’, ACM Transactions on Graphics(Proceedings of SIGGRAPH ’05) 24(3), 777–786.
Lefebvre, S. & Hoppe, H. (2006), ‘Appearance-space tex-ture synthesis’, ACM Transactions on Graphics (Pro-ceedings of SIGGRAPH ’06) 25(3), 541–548.
Li, Q. L., Geng, W. D., Yu, T., Shen, X. J., Lau, N.& Yu, G. (2006), Motionmaster: authoring and chore-ographing kung-fu motions by sketch drawings, in ‘Pro-ceedings of the 2006 ACM SIGGRAPH/Eurographicssymposium on Computer animation (SCA ’06)’, Eu-rographics Association, Aire-la-Ville, Switzerland,Switzerland, pp. 233–241.
Manke, F. & Wunsche, B. C. (2010), Fast spatiallycontrollable multi-dimensional exemplar-based tex-ture synthesis and morphing, in A. Ranchordas,J. M. Pereira, H. J. Arajo & J. M. R. Tavares, eds,‘Computer Vision, Imaging and Computer Graphics.Theory and Applications’, Vol. 68 of Communica-tions in Computer and Information Science, SpringerBerlin Heidelberg, pp. 21–34. http://www.cs.auckland.ac.nz/˜burkhard/Publications/SpringerCCIS2009MankeWuensche.pdf.
Massive Software (2009), ‘Homepage’. http://www.massivesoftware.com.
McCord, G., Wunsche, B. C., Plimmer, B., Gilbert, G. &Hirsch, C. (2008), A pen and paper metaphor for orchidmodeling, in ‘Proceedings of the 3rd InternationalConference on Computer Graphics Theory and Appli-cations (GRAPP 2008)’, pp. 119–124. http://www.cs.auckland.ac.nz/˜burkhard/Publications/GRAPP2008McCordWuenscheEtAl.pdf.
Metoyer, R. A. & Hodgins, J. K. (2004), ‘Reactive pedes-trian path following from examples’, The Visual Com-puter 20, 635–649.
Olsen, L., Samavati, F. F., Sousa, M. C. & Jorge,J. A. (2009), ‘Technical section: Sketch-based mod-eling: A survey’, Computers & Graphics 33(1), 85–103. http://pages.cpsc.ucalgary.ca/˜olsenl/wiki/uploads/Papers/CnGsurvey.pdf.
Perlin, K. (1985), An image synthesizer, in ‘Proc. of SIG-GRAPH ’85’, ACM Press, pp. 287–296.
Planetside Software, (2006), ‘Terragen’. http://www.planetside.co.uk/terragen/tgd/tg2faq.shtml#faq34.
Plimmer, B., Purchase, H. & Yang, H. Y. (2010), Sketchn-ode: Intelligent sketching support and formal diagram-ming, in ‘Proceedings of OZCHI 2010’. [in press].
Portilla, J. & Simoncelli, E. P. (2000), ‘A paramet-ric texture model based on joint statistics of complexwavelet coefficients’, Int. Journal of Computer Vision40(1), 49–70.
Praun, E., Finkelstein, A. & Hoppe, H. (2000), Lappedtextures, in ‘Proceedings of SIGGRAPH ’00’, ACMPress, pp. 465–470.
Reynolds, C. W. (1987), Flocks, herds and schools: A dis-tributed behavioral model, in ‘SIGGRAPH ’87: Pro-ceedings of the 14th annual conference on Computergraphics and interactive techniques’, ACM, New York,NY, USA, pp. 25–34.
Ropinski, T., Praßni, J.-S., Steinicke, F. & Hinrichs,K. H. (2008), Stroke-based transfer function design, in‘IEEE/EG Volume and Point-Based Graphics’, pp. 41–48.
Sakamoto, D., Honda, K., Inami, M. & Igarashi, T.(2009), Sketch and run: a stroke-based interfacefor home robots, in ‘CHI ’09: Proceedings ofthe 27th international conference on Human fac-tors in computing systems’, ACM, pp. 197–200.http://www-ui.is.s.u-tokyo.ac.jp/˜takeo/papers/sakamoto_chi2009_sketchandrun.pdf.
Schmidt, R., Wyvill, B., Sousa, M. C. & Jorge, J. A.(2006), Shapeshop: sketch-based solid modeling withblobtrees, in ‘ACM SIGGRAPH 2006 Courses’, ACM,p. 14.
Schmieder, P., Plimmer, B. & Vanderdonckt, J. (2010),‘Generating systems from multiple sketched models’,Journal of Visual Languages and Computing 21, 98–108.

Shindler, M. (2008), Approximation algorithms for themetric k-median problem, Technical report, UCLA,Los Angeles, CA. http://cs.ucla.edu/˜shindler/shindler-kMedian-survey.pdf.
Skubic, M., Anderson, D., Blisard, S., Perzanowski, D.,Adams, W., Trafton, J. G. & Schultz, A. C. (2005),Using a sketch pad interface for interacting with arobot team, in ‘AAAI’05: Proceedings of the 20thnational conference on Artificial intelligence’, AAAIPress, pp. 1739–1740.
Statsoft Ltd. (2010), ‘Electronic Statistics Hand-book’. http://www.statsoft.com/textbook/cluster-analysis/.
Sugar, C. A. & James, G. M. (2003), ‘Finding the num-ber of clusters in a dataset: An information theoreticapproach’, Journal of the American Statistical Associa-tion 98(463), 750–763. http://citeseerx.ist.psu.edu/viewdoc/summary?doi=10.1.1.107.9895.
Sung, M., Kovar, L. & Gleicher, M. (2005), Fast and accu-rate goal-directed motion synthesis for crowds, in ‘Pro-ceedings of the 2005 ACM SIGGRAPH/Eurographicssymposium on Computer animation (SCA ’05)’, ACM,New York, NY, USA, pp. 291–300.
Takahashi, S., Kato, Y. & Shibayama, E. (2005), A newstatic depiction and input technique for 2d animation,in ‘2005 IEEE Symposium on Visual Languages andHuman-Centric Computing’, pp. 296–298.
Thorne, M., Burke, D. & van de Panne, M. (2004),‘Motion doodles: an interface for sketching charac-ter motion’, ACM Transactions on Graphics (TOG)23(3), 424–431.
Treuille, A., Cooper, S. & Popovic, Z. (2006), ‘Continuumcrowds’, ACM Trans. Graph. 25(3), 1160–1168.
Turk, G. (1991), Generating textures on arbitrary sur-faces using reaction-diffusion, in ‘Proceedings of SIG-GRAPH ’91’, ACM Press, pp. 289–298.
Turquin, E., Wither, J., Boissieux, L., Cani, M.-P. &Hughes, J. F. (2007), ‘A sketch-based interface forclothing virtual characters’, IEEE Comput. Graph.Appl. 27(1), 72–81.
van der Linden, J. (2001), Interactive view-dependentpoint cloud rendering, in ‘Proceedings of IVCNZ2001’, pp. 1–6. http://www.cs.auckland.ac.nz/˜jvan006/papers/pointcloudrendering_final.ps.gz.
Wei, L.-Y., Lefebvre, S., Kwatra, V. & Turk, G. (2009),State of the art in example-based texture synthesis,in ‘Eurographics 2009, State of the Art Report, EG-STAR’, Eurographics Association. http://www-sop.inria.fr/reves/Basilic/2009/WLKT09.
Wei, L.-Y. & Levoy, M. (2000), Fast texture synthesis us-ing tree-structured vector quantization, in ‘Proceedingsof SIGGRAPH ’00’, ACM Press, pp. 479–488.
Witkin, A. & Kass, M. (1991), ‘Reaction-diffusion tex-tures’, SIGGRAPH Computer Graphics 25(4), 299–308.
Wong, Y. Y. (1992), Rough and ready prototypes: lessonsfrom graphic design, in ‘Posters and short talks of the1992 SIGCHI conference on Human factors in comput-ing systems (CHI ’92)’, ACM, pp. 83–84.
WorldOfPolygons.com (2006), ‘CrowdIT’. http://www.crowdit.worldofpolygons.com/.
Worley, S. (1996), A cellular texture basis function,in ‘Proceedings of SIGGRAPH ’96’, ACM Press,pp. 291–294.
Wunsche, B. C., Keymer, D. & Amor, R. (2010), Sketch,Click, Plug and Play: Accelerated Design of Virtual En-vironments by Integrating Multimedia and Sketch Con-tent into Game Engines, in ‘Proceedings of the 11thAnnual ACM SIGCHI NZ Conference on Computer-Human Interaction (CHINZ 2010)’.
Xu, R. & Wunsch II, D. (2005), ‘Survey of clusteringalgorithms’, IEEE Transactions on Neural Networks16(3), 645–678.
Yang, R. & Wunsche, B. C. (2010), LifeSketch - AFramework for Sketch-Based Modelling and Anima-tion of 3D Objects, in ‘Proceedings of the AustralasianUser Interface Conference (AUIC 2010)’, pp. 1–10. http://www.cs.auckland.ac.nz/˜burkhard/Publications/AUIC2010_YangWuensche.pdf.
Zhang, X. & Kim, Y. J. (2007), ‘Efficient texture synthesisusing strict wang tiles’, Graph. Models 70(3), 43–56.