Embed Size (px)
Citation preview

Skagit County Washington
Comprehensive
Annual Financial Report
Fiscal Year Ending December 31, 2015

SKAGIT COUNTY WASHINGTON
COMPREHENSIVE ANNUAL
FINANCIAL REPORT
FISCAL YEAR ENDED DECEMBER 31, 2015
Jeanne Youngquist, Skagit County Auditor
Barbara Leander, Chief Deputy Auditor
Jana Robbins Chief Accountant
Anna Fohn Senior Accountant
Crystal Burress Debra Gatti Calina Armstrong Sunrise Zimmermann Lori Love
Skagit County 700 South Second St. Room 201
Mount Vernon, WA 98273
Cover Photo Courtesy of: LaConner Chamber of Commerce / Pamela Headridge Photography

i
SKAGIT COUNTY WASHINGTON COMPREHENSIVE ANNUAL FINANCIAL REPORT
Year Ended December 31, 2015
TABLE OF CONTENTS
INTRODUCTORY SECTION
Table of Contents .............................................................................................................................. i Letter of Transmittal ......................................................................................................................... iv List of Elected Officials ..................................................................................................................... x Organizational Chart ........................................................................................................................ xi
FINANCIAL SECTION
Independent Auditor’s Opinion ......................................................................................................... 1 Management’s Discussion and Analysis .......................................................................................... 4
BASIC FINANCIAL STATEMENTS
Description of Basic Financial Statements ..................................................................................... 16 Statement of Net Position ............................................................................................................... 17 Statements of Activities .................................................................................................................. 18 Balance Sheet- Governmental Funds ............................................................................................ 19 Reconciliation of the Balance Sheet of Governmental Funds to the Statement of Net Position ................................................................................................................... 20 Statement of Revenues, Expenditures, and Changes in Fund Balance- Governmental Funds ......................................................................................................... 21 Reconciliation of the Statement of Revenue, Expenditures and Changes in Fund Balances Governmental Funds to the Statement of Activities .......................................... 22 Statement of Net Position- Proprietary Funds ................................................................................ 23 Statement or Revenues, Expenses, and Changes in Fund Net Position- Proprietary Funds .............................................................................................................. 24 Statement of Cash Flows- Proprietary Funds ................................................................................ 25 Statement of Fiduciary Net Position- Fiduciary Funds ................................................................... 27 Notes to Financial Statements ........................................................................................................ 28

ii
REQUIRED SUPPLEMENTARY INFORMATION
Schedule of Revenues, Expenditures, and Changes in Fund Balances- Budget to Actual General Fund ......................................................................................... 67
Schedule of Revenues Budget (GAAP Basis) and Actual – General Fund ................................... 68 Schedule of Expenditures Budget (GAAP Basis) and Actual – General Fund .............................. 69 Schedule of Revenues, Expenditures, and Changes in Fund Balances-
Budget to Actual Mental Health Fund ................................................................................ 74 Schedule of Revenues, Expenditures, and Changes in Fund Balances-
Budget to Actual Road Fund ............................................................................................. 75 Notes to Required Supplementary Information .............................................................................. 76 Schedule of Proportionate Share of the Net Pension Liability ....................................................... 77 Schedule of Employer Contributions .............................................................................................. 80 Schedule of Funding Progress – LEOFF 1 Retiree Medical Benefits ............................................ 82
INDIVIDUAL AND COMBINING STATEMENTS AND SCHEDULES
Combining Balance Sheet Nonmajor Governmental Funds .......................................................... 85 Combining Statement of Revenues, Expenditures, and Changes in Fund Balance- Nonmajor Governmental Funds ........................................................................................ 86 Description of Nonmajor Special Revenue Funds .......................................................................... 87 Combining Balance Sheet- Nonmajor Special Revenue Funds ..................................................... 89 Combining Statement of Revenues, Expenditures, and Changes in Fund Balance- Nonmajor Special Revenue Funds .................................................................................... 98 Schedule of Revenues, Expenditures, and Changes in Fund Balance- Budget and Actual- Nonmajor Special Revenue Funds .................................................. 107 Description of Nonmajor Debt Service Funds .............................................................................. 139 Combining Balance Sheet- Nonmajor Debt Service Funds ......................................................... 140 Combining Statement of Revenues, Expenditures, and Changes in Fund Balance- Nonmajor Debt Service Funds ........................................................................................ 141 Schedule of Revenues, Expenditures, and Changes in Fund Balance- Budget to Actual Debt Service Funds ............................................................................. 142 Description of Nonmajor Capital Project Funds ........................................................................... 143 Combining Balance Sheet- Nonmajor Capital Project Funds ...................................................... 144 Combining Statement of Revenues, Expenditures, and Changes in Fund Balance- Nonmajor Capital Project Funds...................................................................................... 145 Schedules of Revenues, Expenditures, and Changes in Fund Balance- Budget and Actual- Nonmajor Capital Project Funds ...................................................... 146
NONMAJOR ENTERPRISE FUNDS
Description of Nonmajor Enterprise Funds .................................................................................. 152
INTERNAL SERVICE FUNDS
Description of Internal Service Funds........................................................................................... 154 Combining Statement of Net Position- Internal Service Funds .................................................... 155

iii
Combining Statement of Revenues, Expenses and Changes in Funds Net Position- Internal Service Funds ............................................................................... 156 Combining Statement of Cash Flows- Internal Service Funds ..................................................... 157
AGENCY FUNDS
Description of Agency Funds ........................................................................................................ 160 Combining Balance Sheet- Agency Funds ................................................................................... 161 Combining Statement of Changes in Assets and Liabilities- Agency Funds ............................... 165
STATISTICAL SECTION
Statistical Descriptions ................................................................................................................. 176 Net Position by Component .......................................................................................................... 177 Changes in Net Position by Function ........................................................................................... 178 Change in Net Position ................................................................................................................. 180 Fund Balances of Government Funds .......................................................................................... 182 Changes in Fund Balances of Government Funds ...................................................................... 184 Assessed and Estimated Value of Taxable Property ................................................................... 187 Property Tax Rates- Direct and Overlapping ............................................................................... 188 Property Tax Levies and Collections ............................................................................................ 189 Special Assessment Collections ................................................................................................... 190 Ratio of Net General Bonded Debt to Assessed Value ................................................................ 191 Limitations of Indebtedness .......................................................................................................... 192 Ratio of Outstanding Debt by Type .............................................................................................. 193 Computation of Direct and Overlapping Debt ............................................................................... 194 Ratio of Annual Debt Service Expenditures for General Bonded Debt ........................................ 195 Demographic Statistics ................................................................................................................. 196 Top Ten Taxpayers ...................................................................................................................... 197 Principal Employers ...................................................................................................................... 198 Full-Time Equivalent County Government Employee by Function ............................................... 199 Miscellaneous Statistical Report ................................................................................................... 200
COMPLIANCE SECTION
Schedule of Expenditures of Federal Awards .............................................................................. 203 Notes to Schedule of Expenditures of Federal Awards ................................................................ 217 Schedule of State and Local Financial Assistance....................................................................... 218 Notes to Schedule of State and Local Financial Assistance ........................................................ 224

THIS PAGE INTENTIONALLY LEFT BLANK

About Skagit County
(pronounced "skäjet")
Skagit County is located in the northwest portion of Washington State, USA. between Seattle,
Washington and Vancouver, B.C. Canada. The majestic Cascade Mountains stand to the east, overlooking a fertile valley boasting a variety of agricultural crops. Running through the valley is the powerful Skagit River flowing westward toward the beautiful San Juan Islands. World famous tulip fields blanket the valley in the spring. Flocks of Canadian geese, snow geese and trumpeter swans can be seen here in the winter. Bald eagles soar overhead year round and great blue herons stand
along the shorelines.


x
SKAGIT COUNTY, WASHINGTON
ELECTED OFFICIALS
TERM EXPIRES COUNTY COMMISSIONERS
DISTRICT NUMBER 1 RON WESEN ................................................................. DECEMBER 2016 DISTRICT NUMBER 2 KENNETH DAHLSTEDT ............................................... DECEMBER 2016 DISTRICT NUMBER 3 LISA JANICKI ................................................................. DECEMBER 2018
SUPERIOR COURT JUDGES SUSAN COOK ............................................................... DECEMBER 2016
MICHAEL RICKERT ...................................................... DECEMBER 2016 JOHN MEYER ................................................................ DECEMBER 2016 DAVE NEEDY ................................................................ DECEMBER 2016
DISTRICT COURT JUDGES WARREN GILBERT ....................................................... DECEMBER 2018 DAVID SVAREN ............................................................ DECEMBER 2018
ASSESSOR DAVE THOMAS ............................................................. DECEMBER 2018 AUDITOR JEANNE YOUNGQUIST .............................................. DECEMBER 2018 CLERK MAVIS BETZ .................................................................. DECEMBER 2018 CORONER DANIEL DEMPSEY ........................................................ DECEMBER 2018 PROSECUTING ATTORNEY RICHARD WEYRICH……..……………………………….DECEMBER 2018 SHERIFF WILL REICHARDT ......................................................... DECEMBER 2018 TREASURER KATIE JUNGQUIST ....................................................... DECEMBER 2018

Boa
rd o
f Cou
nty
CO
MM
ISS
ION
ER
S
Cou
nty
Adm
inis
trato
r
Pub
lic W
orks
Par
ks, R
ecre
atio
n &
Fai
r
Em
erge
ncy
Man
agem
ent
WS
U C
oope
rativ
eE
xten
sion
Com
mun
ityS
ervi
ces
Pub
lic H
ealth
Pla
nnin
g &
Dev
elop
men
tS
ervi
ces
Nox
ious
Wee
d C
ontro
l
Bou
ndar
y R
evie
w B
oard
Boa
rd o
f Equ
aliz
atio
nC
ivil
Ser
vice
Com
mis
sion
Hea
ring
Exa
min
erLa
w &
Jus
tice
Cou
ncil
Pla
nnin
g C
omm
issi
on
Adv
isor
y B
oard
s an
d C
omm
ittee
sM
ost a
ppoi
ntm
ents
to th
e 50
+ bo
ards
and
co
mm
ittee
s ar
e ap
prov
ed b
y th
e C
omm
issi
oner
s.
Cur
rent
info
on
purp
ose,
sch
edul
es, a
nd
mem
bers
hips
can
be
foun
d at
:
ww
w.s
kagi
tcou
nty.
net/C
ount
yCom
mis
sion
ers/
Doc
umen
ts/B
oard
s%20
and%
20C
omm
ittee
s.pd
f
CO
NS
TIT
UTIO
NA
L
OFFIC
ER
S
Cle
rk o
f th
e C
ou
rt
Pro
secu
tor
Sh
eri
ff
Dis
tric
t C
ou
rt
-D
istr
ict
Cou
rt P
robati
on
Su
peri
or
Cou
rt -
Offic
e o
f Ju
ven
ile C
ou
rt
-L
aw
Lib
rary
STA
TU
TO
RY O
FFIC
ER
S
Assessor
Au
dit
or
Tre
asu
rer
Coro
ner
Bud
get a
nd F
inan
ce
Hum
an R
esou
rces
/ R
isk
Man
agem
ent
Com
mun
icat
ions
Faci
litie
s M
aint
enan
ce &
C
apita
l Pro
ject
s
Sus
tain
abili
ty
SK
AG
IT C
OU
NTY
CIT
IZE
NS
Adm
inis
trativ
e S
ervi
ces
Upr
iver
Ser
vice
s
Info
rmat
ion
Ser
vice
s
Geo
grap
hic
Info
Svc
s
Rec
ords
Man
agem
ent
Cen
tral S
ervi
ces
Pub
lic D
efen
der
Ass
igne
d C
ouns
el
Con
serv
atio
n Fu
ture
s
Com
pone
nt U
nit o
f Cou
nty
Gov
ernm
ent
Cen
tral V
alle
y A
mbu
lanc
e A
utho
rity
Em
erge
ncy
Med
ical
Ser
vice
s
xi

THIS PAGE INTENTIONALLY LEFT BLANK

Financial Section

INDEPENDENT AUDITOR’S REPORT ON FINANCIAL STATEMENTS
June 29, 2016
Board of Commissioners
Skagit County
Mount Vernon, Washington
REPORT ON THE FINANCIAL STATEMENTS
We have audited the accompanying financial statements of the governmental activities, the business-type
activities, the aggregate discretely presented component unit, each major fund and the aggregate remaining
fund information of Skagit County, Washington, as of and for the year ended December 31, 2015, and the
related notes to the financial statements, which collectively comprise the County’s basic financial
statements as listed in the table of contents.
Management’s Responsibility for the Financial Statements
Management is responsible for the preparation and fair presentation of these financial statements in
accordance with accounting principles generally accepted in the United States of America; this includes the
design, implementation, and maintenance of internal control relevant to the preparation and fair presentation
of financial statements that are free from material misstatement, whether due to fraud or error.
Auditor’s Responsibility
Our responsibility is to express opinions on these financial statements based on our audit. We conducted
our audit in accordance with auditing standards generally accepted in the United States of America and the
standards applicable to financial audits contained in Government Auditing Standards, issued by the
Comptroller General of the United States. Those standards require that we plan and perform the audit to
obtain reasonable assurance about whether the financial statements are free from material misstatement.
An audit involves performing procedures to obtain audit evidence about the amounts and disclosures in the
financial statements. The procedures selected depend on the auditor’s judgment, including the assessment
of the risks of material misstatement of the financial statements, whether due to fraud or error. In making
those risk assessments, the auditor considers internal control relevant to the County’s preparation and fair
presentation of the financial statements in order to design audit procedures that are appropriate in the
circumstances, but not for the purpose of expressing an opinion on the effectiveness of the County’s internal
control. Accordingly, we express no such opinion. An audit also includes evaluating the appropriateness
of accounting policies used and the reasonableness of significant accounting estimates made by
management, as well as evaluating the overall presentation of the financial statements.
Washington State Auditor’s Office
1

We believe that the audit evidence we have obtained is sufficient and appropriate to provide a basis for our
audit opinions.
Opinion
In our opinion, the financial statements referred to above present fairly, in all material respects, the
respective financial position of the governmental activities, the business-type activities, the aggregate
discretely presented component unit, each major fund and the aggregate remaining fund information of
Skagit County, Washington, as of December 31, 2015, and the respective changes in financial position
and, where applicable, cash flows thereof for the year then ended in accordance with accounting principles
generally accepted in the United States of America.
Matters of Emphasis
As described in Note X, during the year ended December 31, 2015, the County has implemented the
Governmental Accounting Standards Board Statement No. 68, Accounting and Financial Reporting for
Pensions – an amendment of GASB Statement No. 27. Our opinion is not modified with respect to this
matter.
Other Matters
Required Supplementary Information
Accounting principles generally accepted in the United States of America require that the management’s
discussion and analysis on pages 4 through 15, budgetary comparison information on pages 68 through 77,
pension plan information on pages 78 through 82, and information on postemployment benefits other than
pensions on page 83 are presented to supplement the basic financial statements. Such information, although
not a part of the basic financial statements, is required by the Governmental Accounting Standards Board
who considers it to be an essential part of financial reporting for placing the basic financial statements in
an appropriate operational, economic or historical context. We have applied certain limited procedures to
the required supplementary information in accordance with auditing standards generally accepted in the
United States of America, which consisted of inquiries of management about the methods of preparing the
information and comparing the information for consistency with management’s responses to our inquiries,
the basic financial statements, and other knowledge we obtained during our audit of the basic financial
statements. We do not express an opinion or provide any assurance on the information because the limited
procedures do not provide us with sufficient evidence to express an opinion or provide any assurance.
Supplementary and Other Information
Our audit was conducted for the purpose of forming opinions on the financial statements that collectively
comprise the County’s basic financial statements. The accompanying information listed as individual and
combining statements and schedules on pages 86 through 166 is presented for purposes of additional
analysis and is not a required part of the basic financial statements. Such information is the responsibility
of management and was derived from and relates directly to the underlying accounting and other records
used to prepare the financial statements. This information has been subjected to auditing procedures applied
in the audit of the basic financial statements and certain additional procedures, including comparing and
reconciling such information directly to the underlying accounting and other records used to prepare the
financial statements or to the financial statements themselves, and other additional procedures in
2

accordance with auditing standards generally accepted in the United States of America. In our opinion, the
information is fairly stated, in all material respects, in relation to the basic financial statements taken as a
whole.
The information identified in the table of contents as the Introductory Section, Statistical Section, and
Compliance Section is presented for purposes of additional analysis and is not a required part of the basic
financial statements of the County. Such information has not been subjected to the auditing procedures
applied in the audit of the basic financial statements and, accordingly, we do not express an opinion or
provide any assurance on it.
OTHER REPORTING REQUIRED BY GOVERNMENT AUDITING STANDARDS
In accordance with Government Auditing Standards, we will also issue our report dated June 29, 2016, on
our consideration of the County’s internal control over financial reporting and on our tests of its compliance
with certain provisions of laws, regulations, contracts and grant agreements and other matters. That report
will be issued under separate cover in the County’s Single Audit Report. The purpose of that report is to
describe the scope of our testing of internal control over financial reporting and compliance and the results
of that testing, and not to provide an opinion on internal control over financial reporting or on compliance.
That report is an integral part of an audit performed in accordance with Government Auditing Standards in
considering the County’s internal control over financial reporting and compliance.
Sincerely,
TROY KELLEY
STATE AUDITOR
OLYMPIA, WA
3
Skagit County, Washington Management’s Discussion and Analysis December 31, 2015
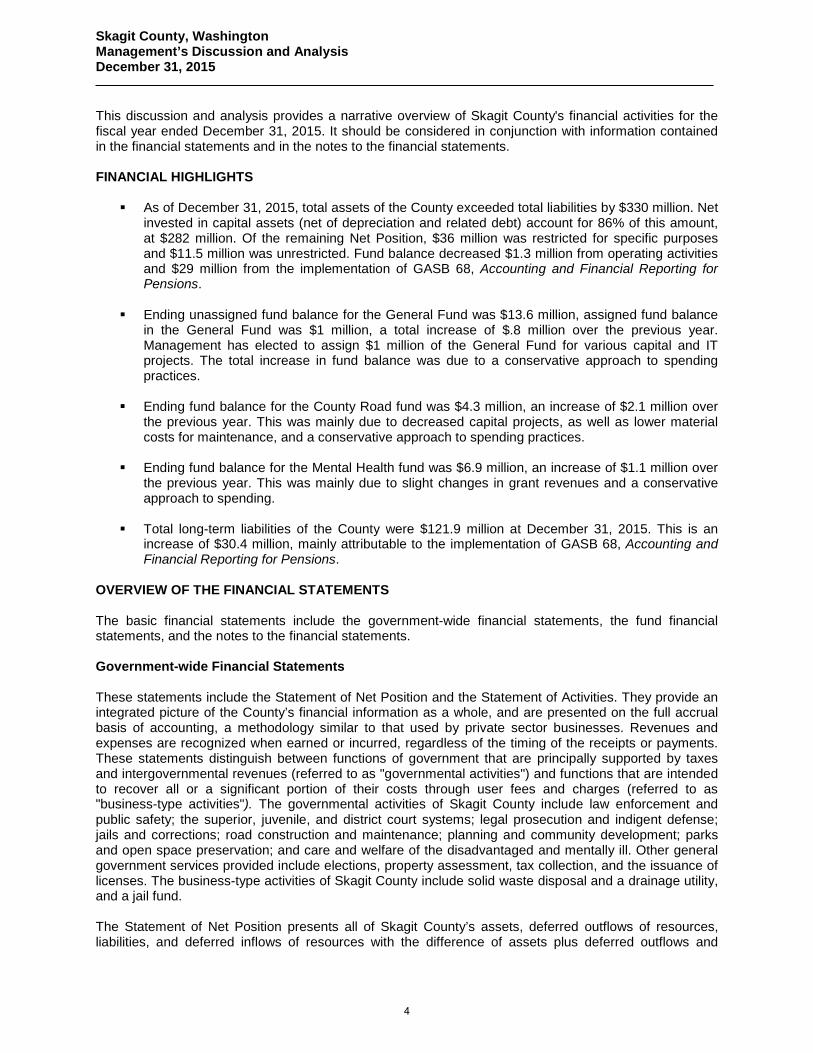
This discussion and analysis provides a narrative overview of Skagit County's financial activities for the fiscal year ended December 31, 2015. It should be considered in conjunction with information contained in the financial statements and in the notes to the financial statements.
FINANCIAL HIGHLIGHTS
As of December 31, 2015, total assets of the County exceeded total liabilities by $330 million. Netinvested in capital assets (net of depreciation and related debt) account for 86% of this amount,at $282 million. Of the remaining Net Position, $36 million was restricted for specific purposesand $11.5 million was unrestricted. Fund balance decreased $1.3 million from operating activitiesand $29 million from the implementation of GASB 68, Accounting and Financial Reporting forPensions.
Ending unassigned fund balance for the General Fund was $13.6 million, assigned fund balancein the General Fund was $1 million, a total increase of $.8 million over the previous year.Management has elected to assign $1 million of the General Fund for various capital and ITprojects. The total increase in fund balance was due to a conservative approach to spendingpractices.
Ending fund balance for the County Road fund was $4.3 million, an increase of $2.1 million overthe previous year. This was mainly due to decreased capital projects, as well as lower materialcosts for maintenance, and a conservative approach to spending practices.
Ending fund balance for the Mental Health fund was $6.9 million, an increase of $1.1 million overthe previous year. This was mainly due to slight changes in grant revenues and a conservativeapproach to spending.
Total long-term liabilities of the County were $121.9 million at December 31, 2015. This is anincrease of $30.4 million, mainly attributable to the implementation of GASB 68, Accounting andFinancial Reporting for Pensions.
OVERVIEW OF THE FINANCIAL STATEMENTS
The basic financial statements include the government-wide financial statements, the fund financial statements, and the notes to the financial statements.
Government-wide Financial Statements
These statements include the Statement of Net Position and the Statement of Activities. They provide an integrated picture of the County’s financial information as a whole, and are presented on the full accrual basis of accounting, a methodology similar to that used by private sector businesses. Revenues and expenses are recognized when earned or incurred, regardless of the timing of the receipts or payments. These statements distinguish between functions of government that are principally supported by taxes and intergovernmental revenues (referred to as "governmental activities") and functions that are intended to recover all or a significant portion of their costs through user fees and charges (referred to as "business-type activities"). The governmental activities of Skagit County include law enforcement and public safety; the superior, juvenile, and district court systems; legal prosecution and indigent defense; jails and corrections; road construction and maintenance; planning and community development; parks and open space preservation; and care and welfare of the disadvantaged and mentally ill. Other general government services provided include elections, property assessment, tax collection, and the issuance of licenses. The business-type activities of Skagit County include solid waste disposal and a drainage utility, and a jail fund.
The Statement of Net Position presents all of Skagit County’s assets, deferred outflows of resources, liabilities, and deferred inflows of resources with the difference of assets plus deferred outflows and
4

Skagit County, Washington Management’s Discussion and Analysis December 31, 2015
liabilities plus deferred inflows reported as net position. Over time, changes in net position may serve as an indicator of whether the financial position of the County is improving or deteriorating. Non-financial indicators, such as the condition of infrastructure systems or changes in tax base, should also be considered in evaluating financial stability. The statement of activities presents information showing how the government's net position changed during the year. It separates program revenue (generated by specific programs through charges for services, grants, and contributions) from general revenue (from taxes and other sources not generated by a particular program), showing to what extent each program relies on general revenues for funding. The financial statements also include information for The Central Valley Ambulance Authority, a component unit of Skagit County. The component unit is not covered in this discussion. Additional information concerning this entity may be found in Note I of the notes to the financial statements. Fund Financial Statements Skagit County uses fund accounting to control and manage monies for specific purposes. Some funds may be mandated by state law or by other legal requirements. Governmental Funds Most general government services are accounted for in the governmental funds, using the modified accrual basis of accounting. This method focuses on near-term inflows and outflows of spendable resources and on balances of spendable resources available at the end of the fiscal year. This perspective is narrower than that reflected in the government-wide financial statements, which focuses on a more long-term view. Reconciliation statements are provided which detail the differences between governmental activities in the government-wide statements and the information presented in the fund financial statements for the governmental funds. Skagit County’s major funds, the General Fund, the County Road Fund, and the Mental Health Funds are presented separately in the fund statements. Data for the remaining governmental funds are combined into a single, aggregated column. Proprietary Funds Proprietary funds, which include enterprise and internal service funds, use the full accrual method of accounting and are used to account for functions which are intended to be self-supporting by their rates and fees. Skagit County has three enterprise funds - solid waste, a drainage utility and a jail fund. Internal service funds are used to account for the County’s vehicle fleet, medical and unemployment insurance, computer systems, and other administrative services. Fiduciary Funds Fiduciary funds are used to account for resources held for the benefit of parties outside the government. They are not reflected in the government-wide financial statements because those funds are not available for use by Skagit County. Notes to the Financial Statements The notes provide additional information that is essential to a full understanding of the data provided in the government-wide and fund financial statements. The Comprehensive Annual Financial Report (CAFR) also includes a Supplemental Schedules section that provides more detailed information about the County.
5

Skagit County, Washington Management’s Discussion and Analysis December 31, 2015
GOVERNMENT-WIDE FINANCIAL ANALYSIS Statement of Net Position Summarized information from the statement of Net Position, as compared to the prior year, is as follows:
2015 2014 2015 2014 2015 2014
ASSETS
Current and Other Assets 100,314,876$ 92,466,381$ 57,015,291$ 61,974,928$ 157,330,167$ 154,441,309$
Capital Assets and
Construction in Progress (Net of Depreciation) 273,798,884 288,981,407 34,869,175 23,640,989 308,668,059 312,622,396
Net Pension Asset 1,733,674 70,909 1,804,583
Total Assets 375,847,434 381,447,788 91,955,375 85,615,917 467,802,809 467,063,705
DEFERRED OUTFLOW OF RESOURCES 3,055,283 494,683 3,549,966 $0
LIABILITIES
Long-Term Liabilities 47,207,457 20,059,935 74,778,475 71,456,924 121,985,932 91,516,859
Other Liabilities 10,296,564 11,042,473 2,974,493 2,716,452 13,271,057 13,758,925
Total Liabilities 57,504,021 31,102,408 77,752,968 74,173,376 135,256,989 105,275,784
DEFERRED INFLOW OF RESOURCES 4,580,582 42,547 539,458 - 5,120,040 -
NET POSITION
Net Investments in Capital Assets 273,798,884 291,628,047 9,066,636 14,405,733 282,865,520 306,033,780
Restricted 36,559,030 30,418,711 - - 36,559,030 30,418,711
Unrestricted 6,460,201 28,256,073 5,090,996 (2,963,191) 11,551,197 25,292,882
Total Net Position 316,818,114$ 350,302,831$ 14,157,632$ 11,442,542$ 330,975,746$ 361,745,373$
Governmental
Activities
Business-Type
Activities Total
Of the $157.3 million in current and other assets at December 31, 2015, $135.1 million is cash, cash equivalents and investments. A very small portion of this amount, $1.4 million, is restricted for specific purposes. Accounts receivable, Notes receivable and amounts due from other governments total $17.2 million. Inventories/prepayments total $4.9 million. Cash, cash equivalents and investments represented 86% (compared to 83% in 2014), while accounts receivable, notes receivable and amounts due from other governments accounted for 11% (compared to 13.3% from 2014). At December 31, 2015, the County had outstanding long-term liabilities of $121.9 million, as compared to $91 million in 2014. This is the result of the implementation of GASB 68 and the resulting net pension liability. Of this total, $4.5 million was due within one year. See Note V of the notes to the financial statements for more information regarding long term debt. Other liabilities amounted to $13 million. These represent primarily accounts payable and accrued liabilities due as a result of ordinary operations. The largest portion of the County’s Net Position (85%) reflects its investment in capital assets, less any outstanding related debt used to acquire those assets. The County's capital assets are used to provide services to citizens and are therefore not available to finance future spending. Although the County’s investment in capital assets is reported net of related debt, it should be noted that the resources needed to repay this debt must be provided from other sources, since the capital assets themselves cannot be used to liquidate these liabilities. In addition, 11% of the County's net position is subject to legal restrictions for specific purposes. The remaining balance of Net Position is a $11 million.
6
Skagit County, Washington Management’s Discussion and Analysis December 31, 2015
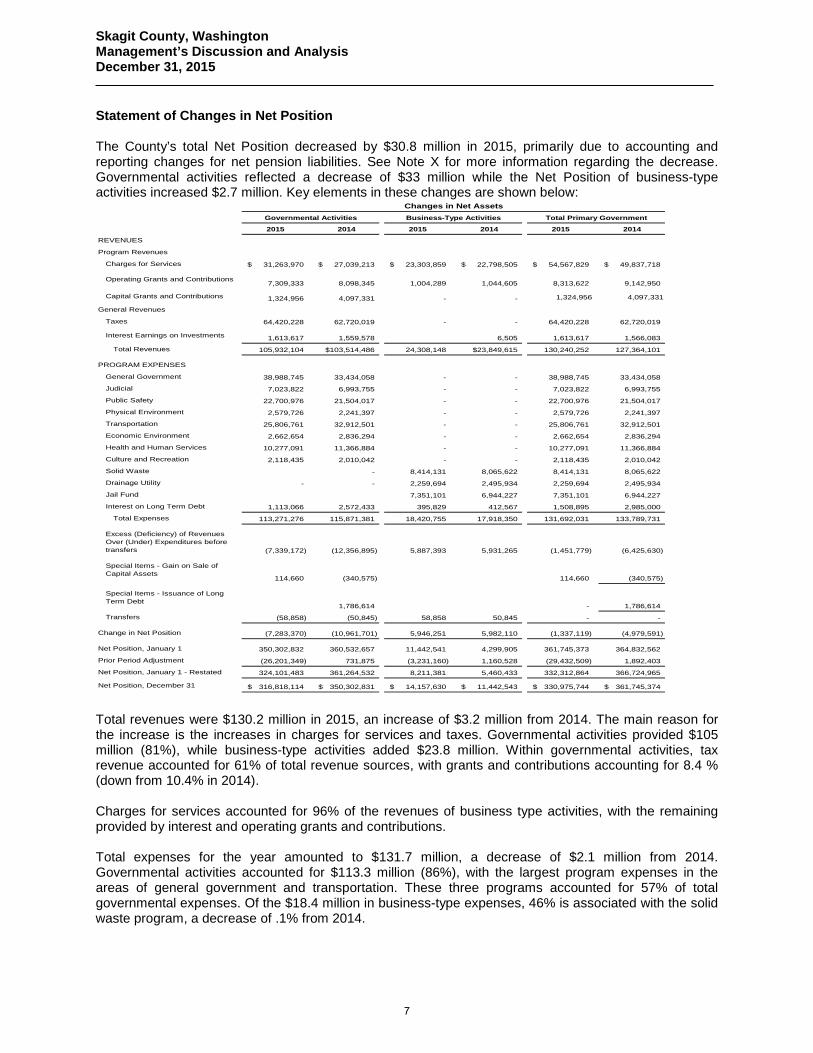
Statement of Changes in Net Position The County’s total Net Position decreased by $30.8 million in 2015, primarily due to accounting and reporting changes for net pension liabilities. See Note X for more information regarding the decrease. Governmental activities reflected a decrease of $33 million while the Net Position of business-type activities increased $2.7 million. Key elements in these changes are shown below:
2015 2014 2015 2014 2015 2014
REVENUES
Program Revenues
Charges for Services 31,263,970$ 27,039,213$ 23,303,859$ 22,798,505$ 54,567,829$ 49,837,718$
Operating Grants and Contributions7,309,333 8,098,345 1,004,289 1,044,605 8,313,622 9,142,950
Capital Grants and Contributions 1,324,956 4,097,331 - - 1,324,956 4,097,331
General Revenues
Taxes 64,420,228 62,720,019 - - 64,420,228 62,720,019
Interest Earnings on Investments 1,613,617 1,559,578 6,505 1,613,617 1,566,083
Total Revenues 105,932,104 $103,514,486 24,308,148 $23,849,615 130,240,252 127,364,101
PROGRAM EXPENSES
General Government 38,988,745 33,434,058 - - 38,988,745 33,434,058
Judicial 7,023,822 6,993,755 - - 7,023,822 6,993,755
Public Safety 22,700,976 21,504,017 - - 22,700,976 21,504,017
Physical Environment 2,579,726 2,241,397 - - 2,579,726 2,241,397
Transportation 25,806,761 32,912,501 - - 25,806,761 32,912,501
Economic Environment 2,662,654 2,836,294 - - 2,662,654 2,836,294
Health and Human Services 10,277,091 11,366,884 - - 10,277,091 11,366,884
Culture and Recreation 2,118,435 2,010,042 - - 2,118,435 2,010,042
Solid Waste - 8,414,131 8,065,622 8,414,131 8,065,622
Drainage Utility - - 2,259,694 2,495,934 2,259,694 2,495,934
Jail Fund 7,351,101 6,944,227 7,351,101 6,944,227
Interest on Long Term Debt 1,113,066 2,572,433 395,829 412,567 1,508,895 2,985,000
Total Expenses 113,271,276 115,871,381 18,420,755 17,918,350 131,692,031 133,789,731
Excess (Deficiency) of Revenues Over (Under) Expenditures before transfers (7,339,172) (12,356,895) 5,887,393 5,931,265 (1,451,779) (6,425,630)
Special Items - Gain on Sale of Capital Assets
114,660 (340,575) 114,660 (340,575)
Special Items - Issuance of Long Term Debt
1,786,614 - 1,786,614
Transfers (58,858) (50,845) 58,858 50,845 - -
Change in Net Position (7,283,370) (10,961,701) 5,946,251 5,982,110 (1,337,119) (4,979,591)
Net Position, January 1 350,302,832 360,532,657 11,442,541 4,299,905 361,745,373 364,832,562
Prior Period Adjustment (26,201,349) 731,875 (3,231,160) 1,160,528 (29,432,509) 1,892,403
Net Position, January 1 - Restated 324,101,483 361,264,532 8,211,381 5,460,433 332,312,864 366,724,965
Net Position, December 31 316,818,114$ 350,302,831$ 14,157,630$ 11,442,543$ 330,975,744$ 361,745,374$
Total Primary Government
Changes in Net AssetsGovernmental Activities Business-Type Activities
Total revenues were $130.2 million in 2015, an increase of $3.2 million from 2014. The main reason for the increase is the increases in charges for services and taxes. Governmental activities provided $105 million (81%), while business-type activities added $23.8 million. Within governmental activities, tax revenue accounted for 61% of total revenue sources, with grants and contributions accounting for 8.4 % (down from 10.4% in 2014). Charges for services accounted for 96% of the revenues of business type activities, with the remaining provided by interest and operating grants and contributions. Total expenses for the year amounted to $131.7 million, a decrease of $2.1 million from 2014. Governmental activities accounted for $113.3 million (86%), with the largest program expenses in the areas of general government and transportation. These three programs accounted for 57% of total governmental expenses. Of the $18.4 million in business-type expenses, 46% is associated with the solid waste program, a decrease of .1% from 2014.
7
Skagit County, Washington Management’s Discussion and Analysis December 31, 2015
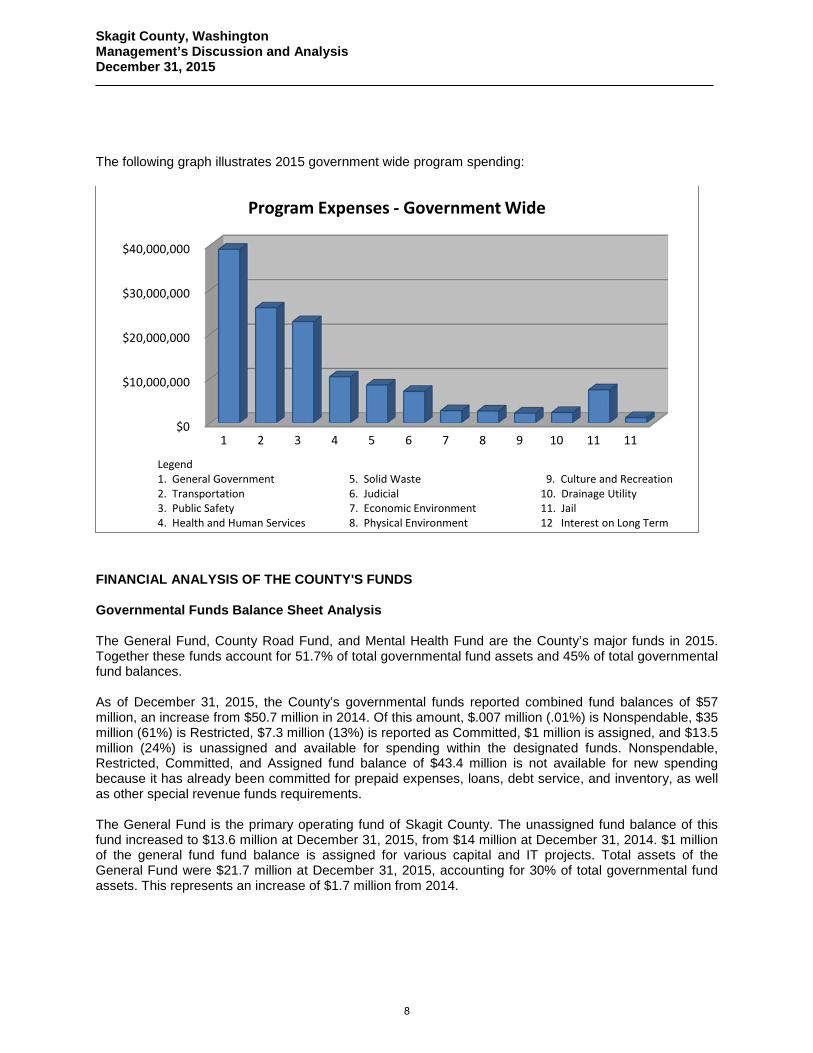
The following graph illustrates 2015 government wide program spending:
FINANCIAL ANALYSIS OF THE COUNTY'S FUNDS Governmental Funds Balance Sheet Analysis The General Fund, County Road Fund, and Mental Health Fund are the County’s major funds in 2015. Together these funds account for 51.7% of total governmental fund assets and 45% of total governmental fund balances. As of December 31, 2015, the County’s governmental funds reported combined fund balances of $57 million, an increase from $50.7 million in 2014. Of this amount, $.007 million (.01%) is Nonspendable, $35 million (61%) is Restricted, $7.3 million (13%) is reported as Committed, $1 million is assigned, and $13.5 million (24%) is unassigned and available for spending within the designated funds. Nonspendable, Restricted, Committed, and Assigned fund balance of $43.4 million is not available for new spending because it has already been committed for prepaid expenses, loans, debt service, and inventory, as well as other special revenue funds requirements. The General Fund is the primary operating fund of Skagit County. The unassigned fund balance of this fund increased to $13.6 million at December 31, 2015, from $14 million at December 31, 2014. $1 million of the general fund fund balance is assigned for various capital and IT projects. Total assets of the General Fund were $21.7 million at December 31, 2015, accounting for 30% of total governmental fund assets. This represents an increase of $1.7 million from 2014.
$0
$10,000,000
$20,000,000
$30,000,000
$40,000,000
1 2 3 4 5 6 7 8 9 10 11 11
Program Expenses - Government Wide
Legend 1. General Government 5. Solid Waste 9. Culture and Recreation 2. Transportation 6. Judicial 10. Drainage Utility 3. Public Safety 7. Economic Environment 11. Jail 4. Health and Human Services 8. Physical Environment 12 Interest on Long Term
8

Skagit County, Washington Management’s Discussion and Analysis December 31, 2015
Governmental Funds Revenue/Expenditure Analysis Total revenues for governmental funds were $102.4 million in 2015, This represents a decrease of $1.1 million from 2014. During the same period, total expenditures decreased to $97 million, down from $103.3 million in 2014. The General Fund, Mental Health Fund, and County Road fund account for 72.9% of all governmental fund revenue (consistent with 72.9% in 2014) and 68% of all expenditures remaining steady from 2015. The net change in fund balance for the General Fund in 2015 was a positive $.8 million. The increase in fund balance for the County Road fund was $2.1 million. The net change in the Mental Health Fund was $1.1 million. The non-major governmental funds had an overall positive change in fund balances of $6 million for 2015. Enterprise Funds Net Position Analysis All enterprise funds of Skagit County are considered major funds for 2015. Comparative information from the proprietary funds’ statement of Net Position is as follows:
2015 2014 2015 2014 2015 2014 2015 2014
ASSETS
Current Assets
Cash and Cash Equivalents $2,680,334 $2,551,060 $326,805 $1,166,616 $52,182,269 $56,343,088 $55,189,408 $60,060,764
Other Current Assets 1,016,539 710,509 292,636 482,582 1,044,332 1,431,264 2,353,507 2,624,355
Total Current Assets 3,696,873 $3,261,569 619,441 $1,649,198 53,226,601 $57,774,352 57,542,915 62,685,119
Non-Current Assets
Construction in Progress - - 161,934 2,274,508 17,071,990 5,799,566 17,233,924 8,074,074
Capital Assets 13,719,305 13,627,814 9,750,454 7,201,329 - 23,469,759 20,829,143
Less Accumulated Depreciation (3,577,336) (3,241,068) (2,257,172) (2,021,160) - (5,834,508) (5,262,228)
Unamortized Debt Issue Costs - - - - - - - -
Net Pension Asset 70,909 70,909
Total Non-Current Assets 10,141,969 10,386,746 7,655,216 7,454,677 17,142,899 5,799,566 34,940,084 23,640,989
Total Assets 13,838,842 $13,648,315 8,274,657 $9,103,875 70,369,500 $63,573,918 92,482,999 86,326,108
Deferred Outflows of Resources 106,348 47,155 341,180 494,683 -
LIABILITIES
Current LiabilitiesAccounts/Vouchers Payable 502,919 434,300 189,881 84,478 1,962,860 468,220 2,655,660 986,998 Other Current Liabilities 772,130 904,115 79,692 118,867 555,134 526,857 1,406,956 1,549,839
Total Current Liabilities 1,275,049 1,338,415 269,573 203,345 2,517,994 995,077 4,062,616 2,536,837
Non-Current Liabilities
Bonds Payable 8,230,550 8,728,228 - - 55,682,195 55,827,358 63,912,745 64,555,586
Other Non-Current Liabilities 7,824,856 6,958,072 465,070 42,888 2,015,306 130,311 10,305,232 7,131,271
Total Non-Current Liabilities 16,055,406 15,686,300 465,070 42,888 57,697,501 55,957,669 74,217,977 71,686,857
Total Liabilities 17,330,455 17,024,715 734,643 246,233 60,215,495 56,952,746 78,280,593 74,223,694
Deferred Inflows of Resources 147,639 65,464 326,355 539,458
NET POSITIONNet Investment in Capital Assets 1,411,419 1,163,518 7,655,217 7,454,677 - 5,787,538 9,066,636 14,405,733
Unrestricted (4,944,322) (4,539,918) (133,512) 743,092 10,168,829 833,634 5,090,995 (2,963,192)
Total Net Position ($3,532,903) (3,376,400) $7,521,705 8,197,769 $10,168,829 6,621,172 $14,157,631 $11,442,541
Business-Type Activities - Enterprise FundsNet Assets
Solid Waste Drainage Utility TotalJail Fund
As of December 31, 2015, the enterprise funds reported combined Net Position of $14.1 million (compared to $11.4 million in 2014). This is the total of a $3.5 million deficit in the Solid Waste Fund (up $.1 million in 2014) and a positive $7.5 million in the Drainage Utility Fund (down from $8.1 million from 2014). The Jail fund net position is $10.2 million, up from $6.6 million in 2014.
9
Skagit County, Washington Management’s Discussion and Analysis December 31, 2015
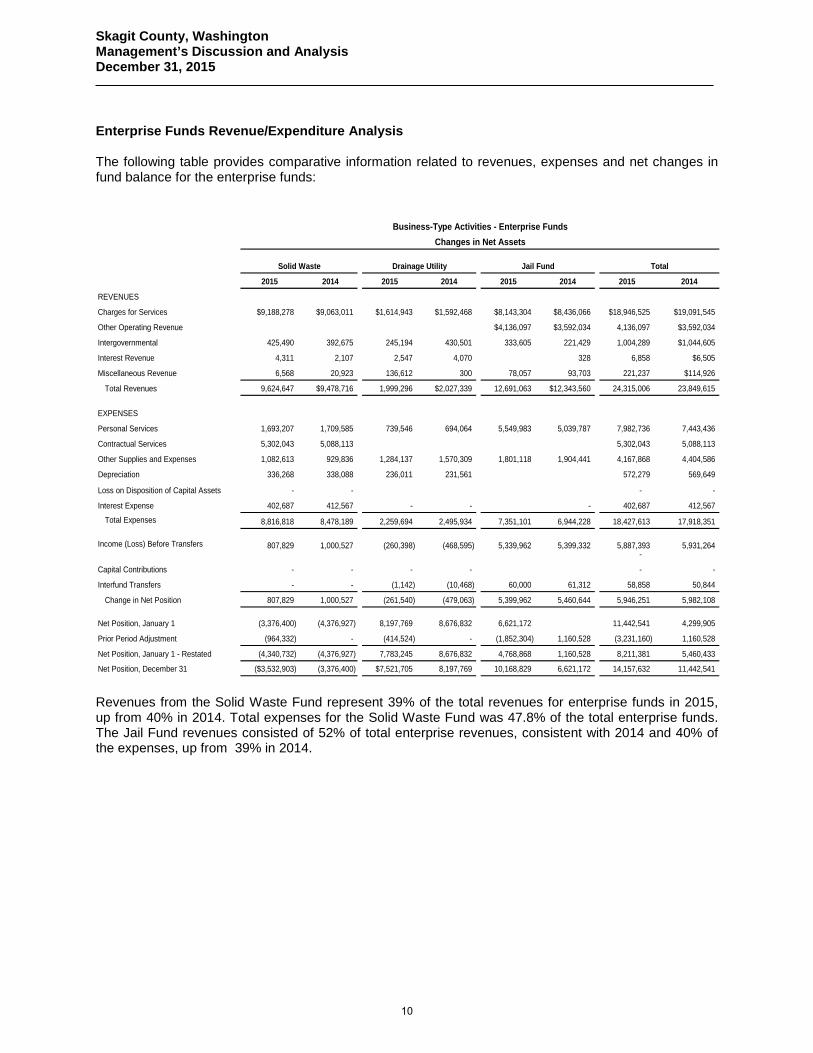
Enterprise Funds Revenue/Expenditure Analysis The following table provides comparative information related to revenues, expenses and net changes in fund balance for the enterprise funds:
2015 2014 2015 2014 2015 2014 2015 2014
REVENUES
Charges for Services $9,188,278 $9,063,011 $1,614,943 $1,592,468 $8,143,304 $8,436,066 $18,946,525 $19,091,545
Other Operating Revenue $4,136,097 $3,592,034 4,136,097 $3,592,034
Intergovernmental 425,490 392,675 245,194 430,501 333,605 221,429 1,004,289 $1,044,605
Interest Revenue 4,311 2,107 2,547 4,070 328 6,858 $6,505
Miscellaneous Revenue 6,568 20,923 136,612 300 78,057 93,703 221,237 $114,926
Total Revenues 9,624,647 $9,478,716 1,999,296 $2,027,339 12,691,063 $12,343,560 24,315,006 23,849,615
EXPENSES
Personal Services 1,693,207 1,709,585 739,546 694,064 5,549,983 5,039,787 7,982,736 7,443,436
Contractual Services 5,302,043 5,088,113 5,302,043 5,088,113
Other Supplies and Expenses 1,082,613 929,836 1,284,137 1,570,309 1,801,118 1,904,441 4,167,868 4,404,586
Depreciation 336,268 338,088 236,011 231,561 572,279 569,649
Loss on Disposition of Capital Assets - - - -
Interest Expense 402,687 412,567 - - - 402,687 412,567
Total Expenses 8,816,818 8,478,189 2,259,694 2,495,934 7,351,101 6,944,228 18,427,613 17,918,351
Income (Loss) Before Transfers 807,829 1,000,527 (260,398) (468,595) 5,339,962 5,399,332 5,887,393 5,931,264 -
Capital Contributions - - - - - -
Interfund Transfers - - (1,142) (10,468) 60,000 61,312 58,858 50,844
Change in Net Position 807,829 1,000,527 (261,540) (479,063) 5,399,962 5,460,644 5,946,251 5,982,108
Net Position, January 1 (3,376,400) (4,376,927) 8,197,769 8,676,832 6,621,172 11,442,541 4,299,905
Prior Period Adjustment (964,332) - (414,524) - (1,852,304) 1,160,528 (3,231,160) 1,160,528
Net Position, January 1 - Restated (4,340,732) (4,376,927) 7,783,245 8,676,832 4,768,868 1,160,528 8,211,381 5,460,433
Net Position, December 31 ($3,532,903) (3,376,400) $7,521,705 8,197,769 10,168,829 6,621,172 14,157,632 11,442,541
Business-Type Activities - Enterprise FundsChanges in Net Assets
Solid Waste Drainage Utility TotalJail Fund
Revenues from the Solid Waste Fund represent 39% of the total revenues for enterprise funds in 2015, up from 40% in 2014. Total expenses for the Solid Waste Fund was 47.8% of the total enterprise funds. The Jail Fund revenues consisted of 52% of total enterprise revenues, consistent with 2014 and 40% of the expenses, up from 39% in 2014.
10

Skagit County, Washington Management’s Discussion and Analysis December 31, 2015
GENERAL FUND BUDGETARY HIGHLIGHTS The following schedule provides a comparative analysis of the original and final amended General Fund budget:
Variance
Original Final Favorable
Budget Budget (Unfavorable)
BUDGETED FUND BALANCE, JANUARY 1 4,377,173$ 4,610,875$ $233,702
RESOURCES (IN-FLOWS)
Taxes 33,052,527 33,052,527 -
Licenses & Permits 332,000 332,000 -
Intergovernmental Revenue 5,569,353 5,854,167 284,814
Charges for Goods and Services 3,823,630 3,881,618 57,988
Fines and Forfeits 1,712,000 1,712,000 -
Interest Revenue 1,792,500 1,792,500 -
Miscellaneous Revenues 98,470 98,470 -
Transfers In 130,783 215,839 85,056
Total Resources (in-flows) 46,511,263 46,939,121 427,858
Amounts Available for Appropriation 50,888,436 51,549,996 661,560
CHARGES TO APPROPRIATIONS (OUT-FLOWS)
General Government Services 19,345,154 19,542,614 (197,460)
Judicial 8,661,022 8,935,300 (274,278)
Public Safety 17,177,763 17,303,776 (126,013)
Physical Environment 40,768 40,768 -
Economic Environment 354,866 364,609 (9,743)
Health and Human Services 296,172 296,172 -
Culture and Recreation 446,000 446,000 -
Capital Expenditures 20,000 20,000 -
Transfers Out 4,546,691 4,600,757 (54,066)
Amount Charged to Appropriations (out-flows) 50,888,436 51,549,996 (661,560)
BUDGETED FUND BALANCE, DECEMBER 31 $0 $0 $0
For the Year Ended December 31, 2015
The net increase in revenues in the final amended budget represented a favorable variance of less than 1.0%. The net increase in expenditures represented an unfavorable increase of 1.3%. Total budgeted expenditures increased more than revenue increased by approximately $233,000. The majority of the changes to the final budget appropriation for both Intergovernmental revenues and General Government Services was due to a pass-through grant. The final budget appropriation for Judicial and Public Safety reflected an increase that was due to reorganization as well as a 2% wage increase for employees. The final budget appropriation for the Transfers Out was increased due to a change in accounting for central services expenses for Public Health.
11

Skagit County, Washington Management’s Discussion and Analysis December 31, 2015
The following schedule provides an analysis of the final amended budget as compared to actual General Fund revenues and expenditures:
Changes
Final Favorable
Budget Actual (Unfavorable)
FUND BALANCE, JANUARY 1 4,610,875$ 13,822,646$ $9,211,771
RESOURCES (IN-FLOWS)
Taxes 33,052,527 33,424,312 371,785
Licenses & Permits 332,000 285,856 (46,144)
Intergovernmental Revenue 5,854,167 7,776,034 1,921,867
Charges for Goods and Services 3,881,618 4,135,939 254,321
Fines and Forfeits 1,712,000 2,083,276 371,276
Interest Revenue 1,792,500 1,484,320 (308,180)
Miscellaneous Revenues 98,470 139,591 41,122
Transfers In 215,839 212,901 (2,938)
Total Resources (in-flows) 46,939,121 49,542,229 2,603,109
Amounts Available for Appropriation 51,549,996 63,364,875 11,814,880
CHARGES TO APPROPRIATIONS (OUT-FLOWS)
General Government Services 19,542,614 17,360,413 2,182,201
Judicial 8,935,300 8,713,544 221,756
Public Safety 17,303,776 17,039,605 264,171
Physical Environment 40,768 19,817 20,951
Economic Environment 364,609 362,798 1,811
Health and Human Services 296,172 295,928 244
Culture and Recreation 446,000 446,000 0
Capitalized Expenditures 20,000 0 20,000
Transfers Out 4,600,757 4,550,757 50,000
Amount Charged to Appropriations (out-flows) 51,549,996 48,788,862 2,761,134
FUND BALANCE, DECEMBER 31 $0 $14,576,013 $14,576,013
General Fund Budget vs. ActualFor the Year Ended December 31, 2015
The largest dollar variances for revenues are reflected in intergovernmental revenue, taxes, and fines and forfeits. The increase in intergovernmental revenue is the result of receiving Payment in Lieu of Taxes revenue that was still uncertain at the time of budget adoption as well as the receipt of timber revenues by 89%. The increase in taxes is due to retail sales and use tax exceeding the budgeted amount by 8% and the increase in fines and forfeits is attributable to a change in the reporting of certain revenues as fines and forfeits instead of miscellaneous revenues. It is important to note that while the budget was not adjusted for these changes, the projections through the year included them. Actual expenditures were 5.4% less than budgeted. This is represented primarily by decreases in General Government Services, Public Safety, and Judicial followed by overall decreases in all areas except Culture and Recreation. The most significant variance is in General Government Services. This variance mainly reflects lower than budgeted expenses for Information Technology, Records Management, and Insurance services.
12

Skagit County, Washington Management’s Discussion and Analysis December 31, 2015
CAPITAL ASSETS AND LONG TERM DEBT Capital Assets The County’s net capital assets were $308 million at December 31, 2015. Construction in progress was an additional $18.7 million. Capital assets include land, development rights, buildings, improvements, furniture and equipment, and infrastructure. Details of 2015 capital asset transactions are presented in Note IV.D of the notes to the financial statements. During 2015 the County continued construction and remodeling of real property for County use. Ongoing projects include several road construction projects, construction of a new jail facility, and miscellaneous small parks projects. Long-Term Debt At December 31, 2015, general obligation bonds payable as reported by governmental activities was $16.2 million, a decrease of $1.4 million. Business type activities reported general obligation bonds payable of $60.7 million, a decrease of $.5 million from 2014. The County's remaining legal capacity for non-voted debt at December 31, 2015 was approximately $174 million. Additional information relating to long-term debt can be found in Note V of the notes to the financial statements. ECONOMIC FACTORS The County’s overall financial position remains steady. The County is not facing any foreseeable restrictions or other limitations that would significantly impact funding resources for future uses. There have been a series of voter initiatives over the last several years, as well as State of Washington, Local and Federal legal changes that continue to have an impact on future finances of the County. A listing of conditions and decisions that may significantly affect the future financial condition of the County follows: In April of 2003, the voters approved a 1/10th of 1% increase in sales tax to fund emergency
communication systems and facilities. In December 2005, the Board of County Commissioners signed an Ordinance implementing a 1/10th
of 1% increase in sales and use tax for the purpose of providing funds for new and expanded chemical dependency or mental health treatment services and for the operation of new or expanded therapeutic court programs.
In December 2005, the Board of County Commissioners signed a resolution creating the Skagit County Clean Water (Shellfish Protection) District. While assessments were authorized at this time, collection didn’t begin until the 2007 tax year. The assessment was authorized for 3 years. In September 2009, the Board of County Commissioners reauthorized the assessment for 5 years. In June of 2014, the Board reauthorized the assessment for 5 years.
In November 2010, the County issued Limited Tax General Obligation Bonds in the amount of
$9,740,000 for improvements to the County’s solid waste transfer station and other capital improvements to County facilities.
In April of 2013, the County signed a resolution concerning a proposition that would authorize an
additional sales and use tax at a rate of .3% to be used for the construction, maintenance and
13

Skagit County, Washington Management’s Discussion and Analysis December 31, 2015
operation of jail facilities and police and fire protection. This proposition was approved by the voters in the August 6, 2013 primary election.
In January of 2014, based on the Interlocal agreement to address the Jail facilities, the County
created an enterprise fund called the Jail fund. Activities for the jail historically have been reported in the General Fund.
In September 2014, the Board of County Commissioners passed several ordinances dissolving the
EMS Commission and transferring the Commission’s authority, responsibility, and assets to the Skagit County Department of Emergency Medical Services. The County’s EMS Component Unit has been eliminated, and those activities now reside within the County.
In November 2014, the County issued debt in the amount of $51,920,000 to fund the design and
construction of a regional jail facility. This was a result of an Interlocal agreement the Board entered into with partner agencies in April of 2013 to address the overcrowding issues with the jail.
On July 6, 2015 Governor Inslee signed House Bill 1061 increasing the number of District Court
Judges in Skagit County to three. The position was officially added to the County January 1, 2016. This was a welcome change to the County due to increased caseloads over the years.
Requests for Information Questions concerning any of the information provided in this report or requests for additional financial information should be addressed to either of the following:
Tim Holloran, County Administrator Accounting Department County Commissioner’s Office Skagit County Auditor’s Office 1800 Continental Place, Suite 100 PO Box 1306 Mount Vernon, WA 98273 Mount Vernon, WA 98273 360-416-1300 360-336-9420
14

Basic Financial Statements
15

Basic Financial Statements
The basic financial statements and note disclosures comprise the minimum acceptable fair presentation in conformity with Generally Accepted Accounting Principles (GAAP). Basic financial statements are designed to be “liftable” from the Financial Section of the Comprehensive Annual Financial Report (CAFR) for widespread distribution to users requiring less detailed information than is contained in the full CAFR. Basic Financial Statements include: Government-wide Financial Statements
(1) Government-wide Statement of Net Position – presents information on all County governmental and business-type assets and liabilities, with the difference reported as Net Position. (2) Government-wide Statement of Activities – presents information on all County governmental and business-type revenues and expenses, with the difference reported as change in Net Position.
Fund Financial Statements
(3) Balance Sheet – Governmental Funds – presents the balance sheets for major funds and aggregated amounts for all other governmental funds.
(4) Reconciliation of the Balance Sheet to the Government-wide Statement of Net
Position.
(5) Statement of Revenues, Expenditures and Changes in Fund Balances – Governmental Funds - presents information for each major fund and aggregated information for all other governmental funds.
(6) Reconciliation of the Statement of Revenues, Expenditures and Changes in Fund
Balances to the Government-wide Statement of Activities.
(7) Statement of Net Position – Proprietary Funds – presents information on all assets and liabilities, with the difference reported as change in Net Position for the major enterprise fund and aggregated amounts for all other enterprise funds as well as a separate column of information for internal service funds.
(8) Statement of Revenues, Expenses and Changes in Net Position – Proprietary
Funds – presents information for each major fund and aggregated information for all other governmental funds. Major and non-major enterprise funds and internal service funds.
(9) Statement of Cash Flows – presents information on the sources and uses of cash for
the major fund and aggregated information for all other enterprise funds and internal service funds.
(10) Statement of Fiduciary Net Position - presents information on agency fund assets and
liabilities, with the difference reported as Net Position.
(11) Notes to Financial Statements – presents disclosure and further detail information to assist the reader in a better understanding of the financial statements and the data presented with them.
(12) Required Supplementary Information – Statement of Revenues, Expenditures and Changes in Fund Balance – Budget (GAAP Basis) and Actual – presents budget information, along with actual results, on separate statements for each major fund which has a legally adopted budget. Departmental information is included for the General fund, in accordance with the County’s legally adopted budget.
16

SKAGIT COUNTY, WASHINGTONStatement of Net Position
December 31, 2015
See accompanying notes to the financial statements
Governmental Business-Type Component UnitActivities Activities Total CVA
ASSETSCash and Cash Equivalents 65,671,912$ 55,189,408$ 120,861,320$ 561,288$ Investments 12,932,884 - 12,932,884 Accounts Receivables, Net 3,210,702 945,425 4,156,127 511,123Due from Other Governments 5,196,427 1,302,100 6,498,527 305,285 Internal Balances 422,017 (422,017) - Inventories and Prepayments 4,929,989 375 4,930,364 Notes Receivable 6,565,000 6,565,000 Restricted Assets: -
Restricted for Debt Service: - Cash/Cash Equivalents 302,762 - 302,762 Investments 1,083,184 - 1,083,184
Net Pension Asset 1,733,674 70,909 1,804,583 Non Depreciated Capital Assets 172,747,543 816,556 173,564,099 Capital Assets, Net 99,544,968 16,818,695 116,363,663 885,063Construction in Progress 1,506,373 17,233,924 18,740,297
Total Assets 375,847,434 91,955,375 467,802,810 2,262,759
DEFERRED OUTFLOWS of RESOURCES 3,055,283 494,683 3,549,966
LIABILITIESLiabilitiesAccounts Payable 6,245,236 2,655,660 8,900,897 110,072 Other Liabilities 3,434,020 318,832 3,752,852 185,682 Due to Other Governments 617,308 - 617,308 2,352 Long Term Liabilities: -
Due within One Year 3,915,413 560,500 4,475,913 Due in More Than One Year 18,444,221 70,947,730 89,391,951 365,158
Net Pension Liability 24,847,823 3,270,246 28,118,069 Total Liabilities 57,504,021 77,752,968 135,256,990 663,264
DEFERRED INFLOWS OF RESOURCES
Total Deferred Inflows of Resources 4,580,582 539,458 5,120,040
Net PositionNet Investment in Capital Assets 273,798,884 9,066,636 282,865,520 885,063 Restricted for: -
General Government 6,906,782 - 6,906,782 Public Safety 1,154,380 - 1,154,380 Physical Environment 4,289,736 - 4,289,736 Transportation 4,697,340 - 4,697,340 Economic Environment 9,394,893 - 9,394,893 Health & Human Services 8,167,295 - 8,167,295 Culture and Recreation 563,659 - 563,659 Debt Service 1,384,945 - 1,384,945
Unrestricted 6,460,200 5,090,996 11,551,196 714,431 Total Net Position 316,818,114$ 14,157,632$ 330,975,746$ 1,599,495$
Primary Government
17

SKAG
IT C
OU
NTY
, WAS
HIN
GTO
NSt
atem
ent o
f Act
iviti
esFo
r the
Yea
r End
ed D
ecem
ber 3
1, 2
015
See
acco
mpa
nyin
g no
tes t
o th
e fin
anci
al st
atem
ents
Net
(Exp
ense
s) R
even
ues
and
Cha
nges
in N
et P
ositi
on
Ope
ratin
gC
apita
lC
ompo
nent
Cha
rges
for
Gra
nts
and
Gra
nts
and
Gov
ernm
enta
lB
usin
ess-
Type
Uni
tFu
nctio
ns/P
rogr
ams
Expe
nses
Serv
ices
Con
trib
utio
nsC
ontr
ibut
ions
Act
iviti
esA
ctiv
ities
Tota
lC
VAPr
imar
y G
over
nmen
t:G
over
nmen
tal A
ctiv
ities
:G
ener
al G
over
nmen
t38
,988
,745
$
11,2
25,7
27$
44,1
99$
147,
577
$
(27,
571,
242)
$
-
$
(27,
571,
242)
$
-
$
Ju
dici
al7,
023,
822
4,24
6,98
9
1,66
6,12
6
-
(1
,110
,707
)-
(1,1
10,7
07)
-
Publ
ic S
afet
y22
,700
,976
2,07
2,80
152
2,13
0-
(20,
106,
045)
-
(2
0,10
6,04
5)-
Ph
ysic
al E
nviro
nmen
t2,
579,
726
289,
242
298,
257
21,0
90
(1,9
71,1
37)
-
(1
,971
,137
)-
Tr
ansp
orta
tion
25,8
06,7
616,
685,
090
271,
063
1,15
6,28
9(1
7,69
4,31
9)-
(17,
694,
319)
-
Econ
omic
Env
ironm
ent
2,66
2,65
41,
380,
435
1,34
7,84
2-
65,6
23-
65,6
23-
H
ealth
and
Hum
an S
ervi
ces
10,2
77,0
914,
461,
088
3,11
3,40
4-
(2,7
02,5
99)
-
(2
,702
,599
)-
C
ultu
re a
nd R
ecre
atio
n2,
118,
435
902,
599
46,3
12-
(1,1
69,5
24)
-
(1
,169
,524
)-
In
tere
st a
nd R
edem
ptio
n on
Lon
g Te
rm D
ebt
1,11
3,06
6-
(1,1
13,0
66)
-
(1
,113
,066
)-
To
tal G
over
nmen
tal A
ctiv
ities
113,
271,
275
31,2
63,9
70
7,30
9,33
3
1,32
4,95
6
(73,
373,
017)
-
(73,
373,
017)
-
B usi
ness
-Typ
e Ac
tiviti
esSo
lid W
aste
8,41
4,13
1
9,19
4,84
6
425,
490
-
-
1,
206,
205
1,
206,
205
-
Dra
inag
e U
tility
2,25
9,69
41,
751,
555
245,
194
-
(262
,945
)
(2
62,9
45)
-
Jail
Fund
7,35
1,10
112
,357
,458
333,
605
5,33
9,96
2
5,33
9,96
2
To
tal B
usin
ess-
Type
Act
iviti
es18
,024
, 926
23,3
03,8
59
1,00
4,28
9
-
-
6,
283,
222
6,
283,
222
-
Tota
l Prim
ary
Gov
ernm
ent
131,
296,
201
54,5
67,8
29
8,31
3,62
2
1,32
4,95
6
(73,
373,
017)
6,
283,
222
(6
7,08
9,79
4)
-
Com
pone
nt U
nit
Cen
tral V
alle
y Am
bula
nce
Auth
ority
5,18
4,28
72,
796,
141
2,38
1,47
1
182,
157
-
-
-
17
5,48
2To
tal C
ompo
nent
Uni
t5,
184,
287
2,
796,
141
2,
381,
471
18
2,15
7
-
-
-
175,
482
Gen
eral
Rev
enue
sPr
oper
ty T
axes
45,1
64,7
35
-
45
,164
,735
-
Sa
les/
Use
Tax
es18
,421
,647
-
18
,421
,647
-
O
ther
Tax
es83
3,84
6-
833,
846
-
In
tere
st a
nd In
vest
men
t Ear
ning
s1,
613,
617
(395
,829
)1,
217,
788
-
Tot
al G
ener
al R
even
ues
66,0
33,8
45(3
95,8
29)
65,6
38,0
16-
Sp
ecia
l Ite
m -
Gai
n on
Sal
e of
Cap
ital A
sset
s11
4,66
011
4,66
0Tr
ansf
ers
(58,
858)
58,8
58-
-
To
tal G
ener
al R
even
ues
and
Tran
sfer
s66
,089
,647
(3
36,9
71)
65,7
52,6
76
-
Cha
nge
in N
et P
ositi
on(7
,283
,369
)5,
946,
251
(1,3
37,1
17)
175,
482
Net
Pos
ition
, Jan
uary
135
0,30
2,83
111
,442
,542
361,
745,
373
1,42
4,01
3Pr
ior P
erio
d Ad
just
men
ts(2
6,20
1,34
9)(3
,231
,160
)(2
9,43
2,50
9)N
et P
ositi
on, J
anua
ry 1
, as
Res
tate
d32
4,10
1,48
28,
211,
382
332,
312,
864
1,42
4,01
3N
et P
ositi
on, D
ecem
ber 3
131
6,81
8,11
4$
14,1
57,6
32$
330,
975,
746
$
1,
599,
495
$
Prim
ary
Gov
ernm
ent
Prog
ram
Rev
enue
s
18

SKAGIT COUNTY, WASHINGTONBalance Sheet Government Funds
December 31, 2015
See accompanying notes to the financial statements
Mental County Other
General Health Road GovernmentalASSETS and OUTFLOWS of RESOURCES Fund Fund Fund Funds TotalCash and Cash Equivalents 15,770,723$ 4,612,546$ 7,137,261$ 20,029,503$ 47,550,033$ Investments - 2,094,849 11,921,219 14,016,068Taxes Receivable 616,450 8,205 327,809 228,725 1,181,189Accounts Receivable, Net - - 14,592 15,519 30,111Accounts Receivable Other 1,934,461 1,934,461Interest Receivable 63,362 - - 63,362Due from Other Funds 1,467,895 - - # 1,467,895Due from Other Governments 1,861,522 798,524 201,999 2,314,683 5,176,728Interfund Loans Receivable - - - 1,000 1,000Inventories and Prepayments 3,415 - - 6,232 9,647 Total Assets 21,717,827 7,514,124 7,681,661 34,516,880 71,430,494
Deferred Outflows of Resources
Total Assets and Deferred Outflows of Resources 21,717,827 7,514,124 7,681,661 34,516,880 71,430,494
LIABILITIES, DEFERRED INFLOWS of RESOURCES and FUND BALANCESLiabilitiesAccounts and Vouchers Payable 340,407 331,250 900,182 1,623,845 3,195,685Due to Other Funds 1,625,815 63,818 1,914,883 386,724 3,991,240Due to Other Governmental Units 7,628 164,309 - 445,371 617,308Accrued Wages Payable 838,129 20,005 220,675 285,127 1,363,936Accrued Employee Benefits 170,074 4,122 49,084 65,432 288,711Custodial Accounts 1,306,898 - 32,746 1,339,644Unearned Revenue - - - 208,823 208,823Interfund Loans Payable - - - 1,000 1,000 Total Liabilities 4,288,951 583,505 3,084,824 3,049,069 11,006,347
Deferred Inflows of Resources 2,852,863 8,205 327,809 236,725 3,425,602
Fund BalanceNonspendable 7,232 7,232Restricted - 6,922,415 4,269,029 23,976,302 35,167,746Committed - - - 7,247,553 7,247,553Assigned 1,000,000 - - - 1,000,000 Unassigned 13,576,013 - - - 13,576,013 Total Fund Balances 14,576,013 6,922,415 4,269,029 31,231,087 56,998,544
Total Liabilities, Deferred Inflows of Resources and Fund Balances 21,717,827$ 7,514,124$ 7,681,662$ 34,516,880$ 71,430,493$
Major Funds
19

SKAGIT COUNTY, WASHINGTONReconciliation of the Government Funds Balance Sheet
To the Statement of Net PositionDecember 31, 2015
See accompanying notes to the financial statements
Total fund balances as shown on the Governmental Fund Balance Sheet 56,998,542$
Net capital assets of governmental funds as of December 31, 2015 264,320,443 Capital assets used in the activities of governmental funds are not financial resources and therefore are not reported in the funds.
Deferred Inflow of Resources in the governmental funds and recognized as revenue 3,111,856 of the current period on the statement of activities.
Net Position of the internal service funds 29,276,721 Internal service funds are included in governmental activities on the statement of net assets.
Balance of long-term liabilities of the governmental funds as of December 31, 2015 (36,889,448) Liabilities not due and payable in the current period are not reported in the governmental funds.
Total Net Position as reported on the Statement of Net Position 316,818,114$
20
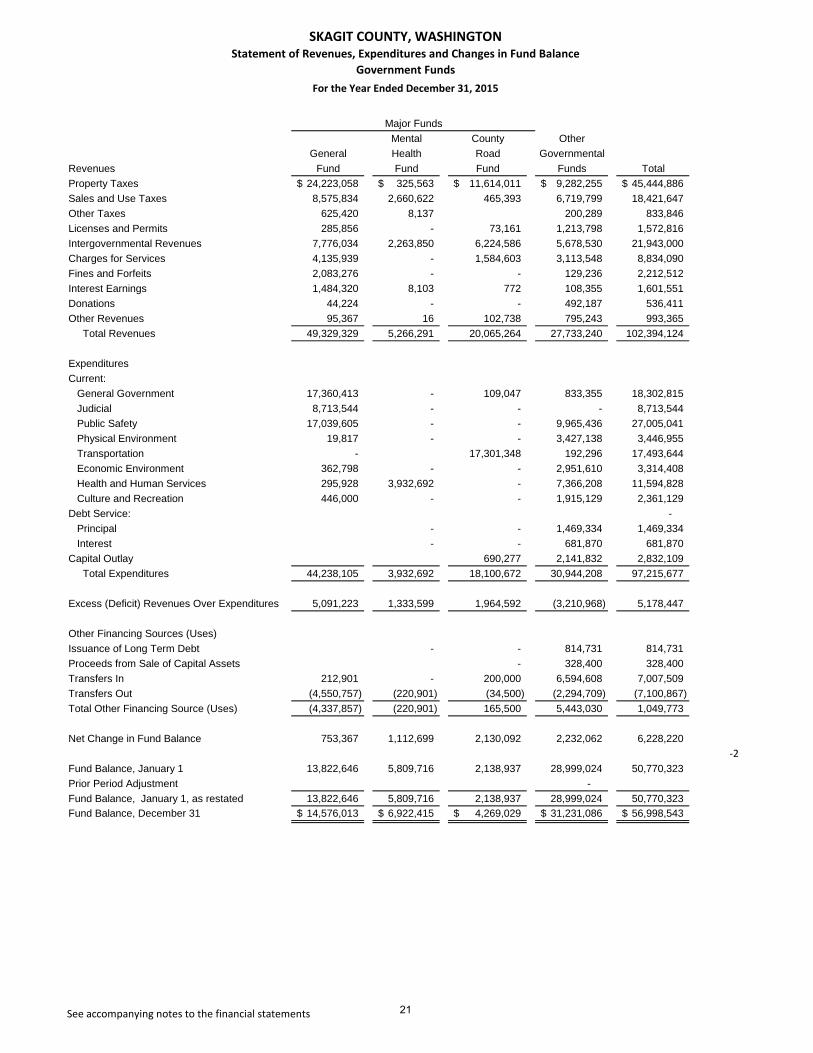
SKAGIT COUNTY, WASHINGTONStatement of Revenues, Expenditures and Changes in Fund Balance
Government FundsFor the Year Ended December 31, 2015
See accompanying notes to the financial statements
Mental County OtherGeneral Health Road Governmental
Revenues Fund Fund Fund Funds TotalProperty Taxes 24,223,058$ 325,563$ 11,614,011$ 9,282,255$ 45,444,886$ Sales and Use Taxes 8,575,834 2,660,622 465,393 6,719,799 18,421,647Other Taxes 625,420 8,137 200,289 833,846Licenses and Permits 285,856 - 73,161 1,213,798 1,572,816Intergovernmental Revenues 7,776,034 2,263,850 6,224,586 5,678,530 21,943,000Charges for Services 4,135,939 - 1,584,603 3,113,548 8,834,090Fines and Forfeits 2,083,276 - - 129,236 2,212,512Interest Earnings 1,484,320 8,103 772 108,355 1,601,551Donations 44,224 - - 492,187 536,411Other Revenues 95,367 16 102,738 795,243 993,365 Total Revenues 49,329,329 5,266,291 20,065,264 27,733,240 102,394,124
ExpendituresCurrent: General Government 17,360,413 - 109,047 833,355 18,302,815 Judicial 8,713,544 - - - 8,713,544 Public Safety 17,039,605 - - 9,965,436 27,005,041 Physical Environment 19,817 - - 3,427,138 3,446,955 Transportation - 17,301,348 192,296 17,493,644 Economic Environment 362,798 - - 2,951,610 3,314,408 Health and Human Services 295,928 3,932,692 - 7,366,208 11,594,828 Culture and Recreation 446,000 - - 1,915,129 2,361,129Debt Service: - Principal - - 1,469,334 1,469,334 Interest - - 681,870 681,870Capital Outlay 690,277 2,141,832 2,832,109 Total Expenditures 44,238,105 3,932,692 18,100,672 30,944,208 97,215,677
Excess (Deficit) Revenues Over Expenditures 5,091,223 1,333,599 1,964,592 (3,210,968) 5,178,447
Other Financing Sources (Uses)Issuance of Long Term Debt - - 814,731 814,731Proceeds from Sale of Capital Assets - 328,400 328,400Transfers In 212,901 - 200,000 6,594,608 7,007,509Transfers Out (4,550,757) (220,901) (34,500) (2,294,709) (7,100,867)Total Other Financing Source (Uses) (4,337,857) (220,901) 165,500 5,443,030 1,049,773
Net Change in Fund Balance 753,367 1,112,699 2,130,092 2,232,062 6,228,220 -2
Fund Balance, January 1 13,822,646 5,809,716 2,138,937 28,999,024 50,770,323Prior Period Adjustment - Fund Balance, January 1, as restated 13,822,646 5,809,716 2,138,937 28,999,024 50,770,323Fund Balance, December 31 14,576,013$ 6,922,415$ 4,269,029$ 31,231,086$ 56,998,543$
Major Funds
21
SKAGIT COUNTY, WASHINGTONReconciliation of the Statement of Revenues, Expenditures
and Changes in Fund Balance of Government FundsTo the Statement of Activities
For the Year Ended December 31, 2015
See accompanying notes to the financial statements
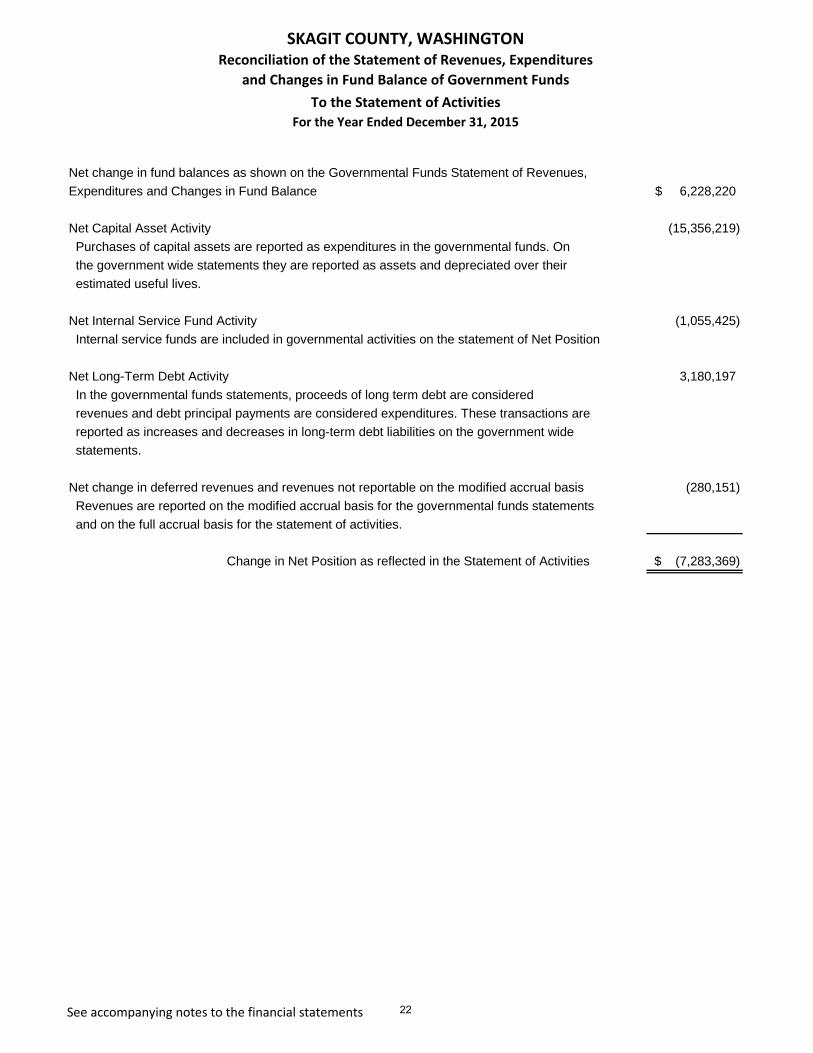
Net change in fund balances as shown on the Governmental Funds Statement of Revenues,Expenditures and Changes in Fund Balance 6,228,220$
Net Capital Asset Activity (15,356,219) Purchases of capital assets are reported as expenditures in the governmental funds. On the government wide statements they are reported as assets and depreciated over their estimated useful lives.
Net Internal Service Fund Activity (1,055,425) Internal service funds are included in governmental activities on the statement of Net Position
Net Long-Term Debt Activity 3,180,197 In the governmental funds statements, proceeds of long term debt are considered revenues and debt principal payments are considered expenditures. These transactions are reported as increases and decreases in long-term debt liabilities on the government wide statements.
Net change in deferred revenues and revenues not reportable on the modified accrual basis (280,151) Revenues are reported on the modified accrual basis for the governmental funds statements and on the full accrual basis for the statement of activities.
Change in Net Position as reflected in the Statement of Activities (7,283,369)$
22

SKAGIT COUNTY, WASHINGTONStatement of Net Position
Proprietary FundsDecember 31, 2015
See accompanying notes to the financial statements*See Internal Service Funds section
GovernmentalActivities*Internal
Solid Drainage County ServiceASSETS Waste Utility Jail Total FundsCurrent Assets
Cash/Cash Equivalents 2,680,334$ 326,805$ 52,182,269$ 55,189,408$ 18,424,641$ Accounts Receivable 865,939 70,986 8,500 945,425 1,579 Due From Other Funds - 105,607 - 105,607 4,573,608 Due from Other Governments 150,600 116,043 1,035,457 1,302,100 19,699 Inventories/Prepayments - - 375 375 4,920,342 Total Current Assets 3,696,874 619,441 53,226,601 57,542,915 27,939,870
Non-Current AssetsCapital Assets Land 618,875 197,681 - 816,556 - Buildings 9,899,874 - - 9,899,874 180,888 Improvements 1,387,854 9,523,204 - 10,911,058 - Machinery and Equipment 1,812,702 29,569 - 1,842,271 19,159,714 Less Accumulated Depreciation (3,577,336) (2,257,172) - (5,834,508) (9,862,162) Construction In Progress - 161,934 17,071,990 17,233,924 - Net Pension Asset 70,909 70,909 Total Non-Current Assets 10,141,969 7,655,216 17,142,900 34,940,085 9,478,440
Total Assets 13,838,843 8,274,657 70,369,501 92,483,000 37,418,311
Deferred Outflows of Resources 106,348 47,155 341,180 494,683 302,929
LIABILITIES AND FUND EQUITYCurrent Liabilities
Accounts/Vouchers Payable 502,919 189,881 1,962,860 2,655,660 3,022,528 Due to Other Funds 122,406 58,127 347,091 527,624 1,628,246 Interest Payable 33,427 - - 33,427 - Interfund Loans Payable - - - - Accrued Wages Payable 44,639 18,225 166,781 229,645 167,506 Accrued Employee Benefits 11,158 3,340 41,262 55,760 28,525 Accrued Taxes Payable - - - - - Other Accrued Liabilities 60,500 - - 60,500 27,024 Bonds Payable 500,000 - - 500,000 - Total Current Liabilities 1,275,049 269,573 2,517,996 4,062,617 4,873,829
Non-Current Liabilities - Compensated Absences 56,360 30,570 159,472 246,401 245,355 Post Closure Landfill Costs 2,861,425 - - 2,861,425 - Environmental Liability 3,927,159 - - 3,927,159 113,533 Bonds Payable 8,230,550 - 55,682,195 63,912,745 - Net Pension Liability 979,912 434,500 1,855,834 3,270,246 2,791,255 Total Non-Current Liabilities 16,055,406 465,070 57,697,501 74,217,976 3,150,143
Total Liabilities 17,330,455 734,643 60,215,497 78,280,593 8,023,972
Deferred Inflows of Resources 147,639 65,464 326,355 539,458 420,547
Net PositionNet Investment in Capital Assets 1,411,419 7,655,217 9,066,636 9,478,440 Unrestricted (4,944,322) (133,512) 10,168,829 5,090,995 19,798,281 Total Net Position (3,532,903)$ 7,521,705$ 10,168,829$ 14,157,632$ 29,276,721$
Enterprise FundsBusiness-Type Activities
23

SKAGIT COUNTY, WASHINGTONStatement of Revenues, Expenses, and Changes in Fund Net Position
Proprietary FundsFor the Year Ended December 31, 2015
See the accompanying notes to the financial statements*See Internal Service Funds section
GovernmentalActivities*Internal
Solid Drainage County ServiceWaste Utility Jail Total Funds
Operating RevenuesCharges for Services 9,188,278$ 1,614,943$ 8,143,304$ 18,946,525$ 14,455,440$ Other Operating Revenue - - 4,136,097 4,136,097 13,181,369 Total Operating Revenues 9,188,278 1,614,943 12,279,401 23,082,622 27,636,809
Operating ExpensesPersonnel Services 1,693,207 739,546 5,549,983 7,982,736 5,038,374 Contractual Services 5,302,043 - - 5,302,043 2,162,574Supplies and Expenses 1,082,613 1,284,137 1,801,118 4,167,868 7,076,928Depreciation 336,268 236,011 - 572,279 1,192,977Payment to Claimants - - - - 13,162,176 Total Operating Expenses 8,414,131 2,259,694 7,351,101 18,024,926 28,633,029
Operating Income (Loss) 774,147 (644,751) 4,928,300 5,057,696 (996,220)
Non-Operating Revenue (Expenses) - Intergovernmental Revenue 425,490 245,194 333,605 1,004,289 Interest Revenue 4,311 2,547 6,858 12,066Miscellaneous Revenue 6,568 136,612 78,057 221,237 3,586Gain (Loss) on Disposition of Capital Assets - - - (114,175)Interest Expense (402,687) - (402,687) - Miscellaneous Expense - - - 4,818 Total Non-Operating Revenue (Expenses) 33,682 384,353 411,662 829,697 (93,705)
Income (Loss) before Transfers 807,829 (260,398) 5,339,962 5,887,393 (1,089,925)
Transfers In - - 60,000 60,000 34,500Transfers Out - (1,142) - (1,142) -
Change in Net Position 807,829 (261,540) 5,399,962 5,946,251 (1,055,425)
Net Position, January 1 (3,376,400) 8,197,769 6,621,172 11,442,541 33,042,207 Prior Period Adjustment (964,332) (414,524) (1,852,304) (3,231,160) (2,710,061) Net Position, January 1, as Restated (4,340,732) 7,783,245 4,768,868 8,211,381 30,332,146Net Position, December 31 (3,532,903)$ 7,521,705$ 10,168,829$ 14,157,632$ 29,276,721$
Enterprise FundsBusiness - Type Activities
24

SKAGIT COUNTY, GOVERNMENTStatement of Cash Flows
Proprietary FundsFor the Year Ended December 31, 2015
See accompanying notes to the financial statements*See Internal Service Funds section
GovernmentalActivities*Internal
Solid Drainage Jail ServiceWaste Utility Fund Total Funds
Cash Flows from Operating Activities:Receipts from Customers 8,983,646$ 1,620,249$ 12,286,183$ 22,890,078$ 3,244,445$ Receipts from Interfund Services Provided - 130,607 713,931 844,538 24,253,986Payments to Employees (1,638,651) (718,446) (7,443,258) (9,800,355) (4,922,617)Payments to Suppliers (5,683,944) (1,212,213) 124,620 (6,771,537) (6,540,078)Payments to Claimants - - - - - - (13,186,093)Payments for Interfund Services Used (879,132) (660,701) (418,597) (1,958,430) (1,732,812)Miscellaneous Receipts - - - 78,057 78,057 (60,999)Miscellaneous Payments 6,568 - - - 6,568 - Net Cash Provided (Used) 788,487 (840,504) 5,340,935$ 5,288,916 1,055,832
Cash Flows From Non-Capital Financing Activities:Operating Grants Received 324,092 541,446 - 865,538 - Transfers to Other Funds - (1,142) 60,000 58,858 Transfers from Other Funds - - (105,607) - - - (105,607) - 34,500 Net Cash Provided (Used) 324,092 434,697 60,000 818,789 34,500
Cash Flows from Capital and Related Financing Activities:Proceeds from Capital Grant - - $1,710,671 1,710,671 - Purchases of Capital Assets (91,492) (436,551) (11,272,424) (11,800,467) (1,792,742)Proceeds from Sale of Capital Assets - - - - 316,713Principal Paid on Capital Debt (495,000) - - (495,000) - Interest Paid on Capital Debt (401,125) - - (401,125) - Other Receipts (Payments) - - - - Net Cash Provided (Used) (987,617) (436,551) (9,561,753) (10,985,921) (1,476,029)
Cash Flows from Investing Activities:Sale of Investments - - - - Interest Earnings 4,311 2,547 0 6,858 12,066 Net Cash Provided 4,311 2,547 - 6,858 12,066
Net Change in Cash and Cash Equivalents 129,273 (839,811) (4,160,818) (4,871,358) (373,788)
Balance, January 1 2,551,061 1,166,616 56,343,088 60,060,765 18,798,272Balance, December 31 2,680,334$ 326,805$ 52,182,269$ 55,189,407$ 18,424,484$
Business - Type ActivitiesEnterprise Funds
25

SKAGIT COUNTY, WASHINGTONStatement of Cash Flows
Proprietary FundsFor the Year Ended December 31, 2015
See accompanying notes to the financial statements*See Internal Service Fund section
GovernmentalActivities*Internal
Solid Drainage Jail ServiceWaste Utility Fund Total Funds
Reconciliation of Operating Income (Loss) to Net Cash Provided (Used) by Operating Activities
Operating Income (Loss) 774,147$ (644,751)$ $4,928,300 5,057,696$ (996,220)$
Adjustments to Reconcile Operating Income toNet Cash Provided (Used) by Operating Activities:
Depreciation Expense 336,268 236,011 572,279 1,192,978 Miscellaneous Receipts 6,568 130,607 78,057 215,232 28,779Changes in Assets and Liabilities: - - - 0 - Receivables, Net (204,632) 5,306 387,107 187,781 4,665 Prepayments - - (175) (175) 0 Inventories - - - 0 89,952 Accounts and Other Payables (123,865) (567,678) (52,354) (743,897) 735,520
Net Cash Provided (Used) by Operating Activities 788,487$ (840,504)$ 5,340,935$ 5,288,915$ 1,055,674$
Business - Type ActivitiesEnterprise Funds
26

SKAGIT COUNTY, WASHINGTONStatement of Fiduciary Net Position
Fiduciary FundsDecember 31, 2015
See accompanying notes to the financial statements
AgencyFunds
ASSETSCash 44,631,620$ Investments 407,567,846Taxes Receivable 3,659,456Deposits - Total Assets 455,858,922$
LIABILITIESWarrants Payable 24,562,989$ Custodial Accounts 431,295,933 Total Liabilities 455,858,922$
27
Skagit County, Washington Notes to the Financial Statements December 31, 2015 I. Summary of Significant Accounting Policies
The financial statements of Skagit County have been prepared in conformity with generally accepted accounting principles (GAAP), as applied to government entities. The Governmental Accounting Standards Board (GASB) is the standard setting body for establishing governmental accounting and financial reporting principles. The chart of accounts used by Skagit County conforms to the Budgeting, Accounting, and Reporting System (BARS) prescribed by the Washington State Office of the State Auditor.
Reporting Entity
Skagit County, a first-class county, was incorporated on November 28, 1883, under the Revised Code of Washington 36.04.390. The County operates under a commissioner form of government and provides such services as law enforcement, road construction and maintenance, solid waste management, permits and planning, parks and recreation, judicial administration, public health, social services and general administrative services. As required by GAAP, the financial statements present Skagit County, the primary government, and its discretely presented component unit, the Central Valley Ambulance Authority (CVAA).
In determining the financial reporting entity, the County complies with the provisions of GASB Statement No. 14, “The Financial Reporting Entity,” GASB Statement No. 39, “Determining Whether Certain Organizations are Component Units,” and GASB Statement No. 61, “The Financial Reporting Entity: Omnibus.” Accordingly, the County reports as component units those entities for which the County appoints a voting majority of the board of directors, upon which the County is able to impose its will, or where a financial benefit or burden exists.
The Central Valley Ambulance Authority was established in April 2009 by Ordinance #O20090004 pursuant to the RCW 35.21.730 and Resolution #R20090255 established a separate fund June 2009. The Board of County Commissioners appoints the members of the CVAA board and has final approval on the CVAA operating budget. The Central Valley Ambulance Authority is a governmental agency providing emergency medical care and transportation services to the citizens of Skagit County, mainly in their response coverage area. CVAA began its operations July 1, 2009.
CVAA is presented discretely in the Government-Wide financial statements, as required by GASB Statement No. 39, “Determining Whether Certain Organizations are Component Units,” and GASB Statement No. 61, “The Financial Reporting Entity: Omnibus.”
More information for the CVAA, including complete financial statements can be obtained at their office located at 2015-A Hospital Drive, Sedro-Woolley, WA 98284.
The County is also responsible for appointing the members to the boards of the following organizations, but the accountability for these organizations does not extend beyond making the appointments:
Housing Authority Board of Skagit CountyLaConner Regional Library BoardPublic Facilities District BoardSedro-Woolley SD Rural Library BoardUpper Skagit Library District
28

Skagit County, Washington Notes to the Financial Statements December 31, 2015 Government-Wide and Fund Financial Statements
Government-wide financial statements consist of the statement of net position and the statement of activities. These statements report information on all of the non-fiduciary activities of the primary government and its component units. For the most part, the effect of interfund activity has been removed from these statements. Governmental activities, which normally are supported by taxes and intergovernmental revenues, are reported separately from business-type activities, which rely to a significant extent on fees and charges for support. The component unit is reported separately from the county.
The statement of activities reflects the degree to which the direct expenses of a given function or segment are offset by program revenues. Direct expenses are those that are clearly identifiable with a specific function or segment. Additionally, the County allocates a portion of its indirect costs to individual functions. These indirect costs have been included as part of the program expenses reported for the various functional activities.
The County reports the following functions/programs:
General Government – Legislative and administrative services, including expenses for recording and elections, personnel administration, financial services, administration and facility management.
Judicial – Court system for civil, criminal, and juvenile cases, including jury and witness fees and other judicial and legal costs.
Public Safety – Protection and safety of the citizenry at large, includes expenses for law enforcement, fire protection services, inspections and regulatory enforcements, detention and corrections, emergency services and juvenile services.
Physical Environment – Conservation and preservation of the environment, and animal control services.
Transportation – Programs to ensure safe and adequate flow of vehicles and pedestrians in the County, including costs for road and street preservation, construction, and maintenance.
Economic Environment – Community planning and development services, housing programs, and promotion of tourism.
Health and Human Services – Programs that provide prevention, intervention, and rehabilitative human services for County citizens with an emphasis on serving those most in need. They include costs associated with programs such as veterans’ services, mental health, substance abuse prevention and treatment, public health, and children’s services.
Culture and Recreation – Costs associated with the maintenance and general operations of County parks, trails, natural land and recreational facilities, and the fairgrounds.
Program revenues include charges for goods and services and grants or contributions that are restricted to the program’s purpose. Taxes and other items not properly included among program revenues are reported as general revenues.
Fund financial statements are used to report additional and more detailed information about the primary government. Separate financial statements are provided for governmental funds, proprietary funds, and
29

Skagit County, Washington Notes to the Financial Statements December 31, 2015 fiduciary funds. The latter are excluded from the government wide financial statements. Major individual governmental funds and major individual enterprise funds are reported as separate columns in the fund financial statements.
Measurement Focus, Basis of Accounting and Financial Statement Presentation
The government-wide financial statements are reported using the economic resource measurement focus and the accrual basis of accounting, as are the proprietary fund financial statements. Accordingly, revenues are recorded when earned and expenses are recorded at the time liabilities are incurred, regardless of the timing of related cash flows. Property taxes are recognized as revenues in the year for which they are levied. Grants and similar items are recognized as revenue as soon as all eligibility requirements imposed by the provider have been met.
All governmental funds are presented using the flow of current financial resources measurement focus and the modified accrual basis of accounting. Revenues are recognized when they become measurable and available. Revenues are considered to be available when they are collectible within the current period or soon enough thereafter to pay liabilities of the current period. For this purpose, the County considers revenues to be available if they are collected within 60 days of the end of the fiscal period. Revenues susceptible to accrual are earned interest, certain charges for services, and intergovernmental revenues such as grants where program expenditures are the prime factor for determining reimbursement. Other revenues, such as licenses, fines and fees are not considered susceptible for accrual since they are not generally measureable until received. However, debt service expenditures, as well as expenditures related to compensated absences and claims and judgments, are recorded only when payment is due.
Property taxes, licenses, and interest associated within the current period are all considered to be susceptible to accrual and so have been recognized as revenues of the current fiscal period. Only the portion of special assessment receivable due within the current fiscal period is considered to be susceptible to accrual as revenue of the current period. All other revenue items are considered to be measurable and available only when cash is received by the county.
Expenditures are generally recorded when the related fund liability is incurred, as under accrual accounting. Skagit County reports the following major government funds:
• The General Fund is the County’s primary operating fund. It is used to account for all activities of the general government not accounted for in another fund. The majority of revenues consist of property, sales, and other taxes and fees, and grant revenue.
• The County Road Fund accounts for the design, construction, and maintenance of County Roads. The majority of revenues consist of property tax and grant revenue.
• The Mental Health Fund accounts for expenditures relating to support services provided to citizens with mental and developmental disabilities. The majority of revenues consist of sales tax and grant revenues.
Skagit County reports three major proprietary funds:
• The Solid Waste Fund accounts for collection of fees and the cost of providing solid waste services to the residents of the County.
• The Drainage Utility Fund accounts for the collection of fees, charges and related revenues and the payment of costs related to drainage facilities.
30

Skagit County, Washington Notes to the Financial Statements December 31, 2015
• The County Jail Fund accounts for all revenues and expenditures related to the design, construction, operation and maintenance of the county jail. See note X.
Additionally, the County reports the following fund types:
• Internal Service Funds account for equipment rental, insurance, unemployment, records management, and technology services provided to County departments and to other governments on a cost reimbursement basis.
• Agency Funds are custodial in nature and do not present results of operations or have a measurement focus. These funds account for assets (such as property taxes collected on behalf of other governments) that the County holds for others in an agency capacity. Agency funds include fire, school, port, cemetery, air pollution, city and town, library, dike and drain districts and miscellaneous clearing fund activity.
As a general rule, the effect of interfund activity has been eliminated from the government-wide financial statements. Exceptions to this general rule are payments-in-lieu of taxes and other charges between the various other functions of government. Elimination of these charges would distort the direct costs and program revenues reported for the various functions concerned.
Proprietary funds distinguish operating revenues and expenses form non-operating items. Operating revenues and expenses generally result from providing services and producing and delivering goods in connection with a proprietary fund’s principal ongoing operations. The principal operating revenues of the Solid Waste Fund, the Drainage Utility Fund, and the County Jail Fund are charges to customers for sales and services.
Operating expenses for enterprise funds and internal service funds include the cost of personal services, contractual services, other supplies and expenses and depreciation on capital assets. Revenues and expenses not meeting this definition are reported as non-operating revenues and expenses.
When both restricted and unrestricted resources are available for use, it is the government’s policy to use restricted resources first, and then unrestricted resources as they are needed.
Assets, Liabilities, and Equity
Cash and Cash Equivalents
Cash held in checking accounts and petty cash are reported as cash on the financial statements of the government funds. Cash and cash equivalents reported on the government wide and proprietary funds’ Statement of Net Position includes all demand deposits and investments with an initial maturity of three months or less.
Investments – See Note IV
Receivables and Payables
Amounts due for the exchange of goods and services between County funds are reported as due to or from other funds. Loans between funds are reported as interfund loans receivable or payable. Any residual balances outstanding between the governmental activities and business-type activities are reported in the government-wide financial statements as internal balances. Interfund balances between
31

Skagit County, Washington Notes to the Financial Statements December 31, 2015 governmental funds and internal service funds have been eliminated and were not included in the government-wide statement of net position.
Taxes Receivable consists of property taxes levied and not yet paid, along with the related interest and penalties.
Accounts Receivable consists of amounts owed from private individuals for goods or services. All receivables have been recorded net of any estimated uncollectible amounts. All receivables, with the exception of the PFD portion of $6,565,000 are expected to be paid within one year. See Note VIII for further information on the PFD receivable.
Interest Receivable consists of amounts earned but not yet received on investments held at the end of the year.
Prepayments made for services that will benefit future periods are recorded as prepaid items in both the government-wide and fund financial statements.
Inventories
Inventory in the governmental funds consists of expendable supplies held for consumption. The cost is recorded as an expenditure when consumed rather than when items are purchased. All inventories are valued by the first-in first-out method.
Restricted Assets and Liabilities
These accounts contain resources for construction and debt service, including current and delinquent special assessments receivable, in enterprise funds. The current portion of related liabilities is shown as Payables from Current Restricted Assets. Specific debt service reserve requirements are described in Note V – Long Term Liabilities.
The 2015 restricted assets of the enterprise funds and related debt service funds are composed of the following:
Special Assessments – Current $1,507,674 Special Assessments – Delinquent 62,447
Cash and Investments – Debt Service 3,333,898
Cash and Investments – Construction 3,333,898
Capital Assets – See Note IV
Capital assets include land, improvements, easements, buildings, vehicles, machinery, equipment, infrastructure, and all other tangible or intangible assets that are used in operations. The County defines capital assets as assets with an initial individual cost of more than $5,000 and an estimated useful life in excess of one year.
Infrastructure assets are long-lived assets that are stationary in nature and normally can be preserved for a significantly greater number of years than most capital assets. Examples of infrastructure include roads, bridges, drainage systems and the ferry system.
32

Skagit County, Washington Notes to the Financial Statements December 31, 2015 When capital assets are purchased, they are capitalized and depreciated in the government-wide financial statements and in the proprietary fund statements. Capital assets are recorded as expenditures of the current period in the governmental fund financial statements.
Capital assets are valued at cost where historical records are available and at an estimated historical cost where no records exist. Donated capital assets are valued at their estimated fair value on the date received.
Improvements to capital assets that materially add to the value or extend the life of the asset are capitalized. Other repairs and normal maintenance are not capitalized. Interest incurred during the construction phase of capital assets of business-type activities is included as part of the capitalized value of the assets constructed.
Major outlays for capital assets and improvements are capitalized as projects are constructed. The total interest expense incurred by the County during the current fiscal year is $3,333,898. This entire amount was included as part of the cost of capital assets under construction in connection with facilities projects.
Infrastructure, buildings, improvements, equipment and vehicles are depreciated using the straight-line method. Estimated useful lives are as follows:
• Buildings – 5 to 40 years • Improvements – 15 to 40 years • Furniture and Equipment – 3 to 25 years • Information Technology Equipment – 5 years • Vehicles – 5 to 25 years • Infrastructure – 15 to 65 years
Compensated Absences
It is the County’s policy to permit employees to accumulate earned but unused vacation and sick leave benefits. All vacation pay is accrued when earned in the government-wide and proprietary fund financial statements. A liability for these amounts is reported in the governmental funds only if they have matured, for example as a result of employee resignations or retirements. The non-current portion for governmental funds is not reported in the governmental fund statements and represents a reconciling item between the fund and government-wide presentations.
County employees receive vacation and sick leave monthly at rates established by County resolution or union contract. At termination of employment, employees with a required length of service may receive cash payment for all accumulated vacation leave up to a maximum of 30 days. The payment is based upon current wages at termination. Accumulated sick leave is not paid at termination of employment unless an employee has at least five years of service and 480 hours of accrued sick leave banked. Generally, retirees may receive cash payment for up to 240 hours, and non-retiree payment for up to 60 hours of accumulated sick leave if requested.
Unearned Revenue
This account includes amounts recognized as receivables but not revenues in governmental funds because the revenue recognition criteria have not been met.
33

Skagit County, Washington Notes to the Financial Statements December 31, 2015 Long-Term Obligations – See Note V
Pensions
For purposes of measuring the net pension liability, deferred outflows of resources and deferred inflows of resources related to pensions, and pension expense, information about the fiduciary net position of all state sponsored pension plans and additions to/deductions from those plans’ fiduciary net position have been determined on the same basis as they are reported by Washington State Department of Retirement Systems. For this purpose, benefit payments (including refunds of employee contributions) are recognized when due and payable in accordance with the benefit terms. Investments are reported at fair value.
Deferred Outflow/Inflow of Resources
This line item represents GASB Statement No. 65, Items Previously Reported as Assets and Liabilities, consisting of specific items previously reported as assets and liabilities that are now recognized as deferred outflow or deferred inflow of resources.
The following shows the details on Deferred Inflow of resources, and on what statement they reside:
Description AmountBalance Sheet
Government FundsStatement of Net Position
Deferred Property Tax 1,181,189 XCourt Receivables 1,930,668 XGrants Received in Advance 313,746 X XDeferred Gain on Refunding 4,889 XDeferred Net Pension 4,261,948 X
The following shows the details on Deferred Outflow of resources, and on what statement they reside:
Description AmountBalance Sheet
Government FundsStatement of Net Position
Deferred Net Pension 3,055,283 X
* The County implemented GASB 65 in 2013. Property tax and court receivables were previously reported as deferred revenue on the fund financial statements. The deferred gain on refunding was the result of the 2013 refunding bond issue, which resulted in an economic gain of $19,555. The County chose not to restate prior periods for practical reasons.
* The County implemented GASB 68 in 2015, which resulted in additional deferred inflows and outflows related to Net Pension Liability. See Note VI and Note X.
Fund Equity
Fund equity is recognized as fund balance in government fund types, and as net position in proprietary fund types. Net position may be subject to legal restriction for a particular purpose. Fund balance has been reclassified in accordance with GASB Statement No. 54 as Nonspendable, Restricted, Committed, Assigned, and Unassigned. Further information regarding Fund balance categories is as follows:
34

Skagit County, Washington Notes to the Financial Statements December 31, 2015 Nonspendable Fund Balance – That portion of net resources that cannot be spent because of their form or because they must be maintained intact pursuant to legal or contractual requirements. Some examples of Nonspendable fund balances are inventory, prepaid amounts, long-term portion of loans/notes receivable, or property that is held for resale.
Restricted Fund Balance – That portion of net resources that contains limitations imposed by creditors, grantors, contributors, or laws and regulations of other governments.
Committed Fund Balance – That portion of net resources that contains limitations imposed at the highest level of decision making within the County, which is at the Board of County Commissioner level by adoption of a resolution.
Assigned Fund Balance – That portion of net resources that contains limitations resulting from intended use. The County Commissioners signed R20120135 in April of 2012 designating the Budget and Finance Director or the County Administrator with the authority to assign fund balance.
Unassigned Fund Balance – The residual net resources in excess of Nonspendable, Restricted, Committed, and Assigned.
Each government fund has to be analyzed to classify the fund balance in accordance with GASB Statement No. 54. Funds are created by the Board of County Commissioners and money is authorized to be transferred to the fund for a particular purpose. At this point, balances in these funds are at least committed, and may be further restricted depending on whether there is an external party, constitutional provision, or enabling legislation constraint involved.
The spending policy of government fund balance consists of Restricted resources used first, followed by Committed resources, then Assigned, and finally Unassigned Fund Balance. As per Resolution No. 20120135, the Budget and Finance Director elected to assign $1,000,000 of the General Fund fund balance for various capital and IT projects.
The following shows the composition of the fund balance of the government funds for the fiscal year ended December 31, 2015:
Fund Balances: General FundCounty Road
FundMental Health
Fund
Capital Projects Funds
Debt Service Funds
Other Government
funds TotalNonspendable:
Inventory 6,232 6,232 Loan Receivable 1,000 1,000
Restricted For:General Govt Services 4,255,474 1,384,945 1,266,354 6,906,775 Public Safety 1,154,380 1,154,380 Utilities 4,289,736 4,289,736 Transportation 4,269,029 428,311 4,697,340 Natural & Economic Env 7,731,614 1,474,032 9,205,646 Social Services 6,922,415 1,427,798 8,350,213 Cultural & Recreation 236,681 326,978 563,659
Committed to:General Govt Services 598,346 598,346 Judicial Activities 41,874 41,874 Public Safety 4,584,481 4,584,481 Utilities 492,923 492,923 Social Services 376,880 376,880 Cultural & Recreation 1,153,048 1,153,048
Assigned to: 1,000,000 1,000,000 Unassigned 13,576,013 13,576,013
Total Fund Balances 14,576,013 4,269,029 6,922,415 12,223,769 1,384,945 17,622,373 56,998,543
II. RECONCILIATION OF GOVERNMENT-WIDE AND FUND FINANCIAL STATEMENTS
35

Skagit County, Washington Notes to the Financial Statements December 31, 2015 Total governmental fund balances as reported on the governmental funds balance sheet differs from net position of governmental activities as reported on the statement of net position due to the different accounting methods applied in the preparation of these statements. The governmental fund statements are presented on the modified accrual basis and the statement of net position is presented on a full accrual basis. Also, net internal service fund activity is included in governmental activities.
Explanation of certain reconciling items reported on the reconciliation of the governmental funds balance sheet to the government wide statement of net position:
Net Capital AssetsTotal Capital Assets 582,801,846$ Less Accumulated Depreciation (319,987,776) Construction in Progress 1,506,373
Net Capital Assets 264,320,443$
Long-Term LiabilitiesBonds Payable 16,205,000$ Notes Receivable (6,565,000) Unamortized Bond Discounts/Premiums 588,870 Loans Payable 2,802,125 Compensated Absences Liability 2,112,178 Deferred Gain on Refunding 4,889 OPEB Liability 416,907 Net Pension Liability 21,287,607 Accrued Interest Payable on Long-Term Liabilities 36,872
Long Term Liabilities 36,889,448$
Explanation of certain reconciling items reported on the reconciliation of the statement of revenues, expenditures, and changes in fund balances to the government wide statement of activities:
Net Capital Assets ActivityNet Capital Expenditures Subject to Capitalization 1,114,360$ Depreciation Expense (16,371,014) Gain/Loss on Sale of Asset (99,565)
Net Capital Assets (15,356,219)$
Net Long-Term Debt ActivityPrincipal Payments 975,000 Amortization of Bond Discounts/Premiums 68,027 Net Pension Revenue 136,312 Change in NPL 2,067,370 Change in Compensated Absenses Liability (62,710) Change in OPEB Liability (3,803)
Net Long-Term Debt Activity 3,180,197$
III. STEWARDSHIP, COMPLIANCE AND ACCOUNTABILITY
Scope of Budget
The annual budget for Skagit County is adopted in accordance with the provisions of the Revised Code of Washington (RCW), as interpreted by the Budgeting, Accounting, and Reporting System (BARS) of the State of Washington, and on a basis consistent with generally accepted accounting principles. All government funds with the exception of the Treasurer’s O&M fund, as per RCW 84.56.020(9), have legally adopted budgets.
36

Skagit County, Washington Notes to the Financial Statements December 31, 2015 The annual appropriated budget is adopted at the department level within the general fund. Other budgets are adopted at the level of the fund. For management purposes, expenditures are further segregated by object class of expenditure. Object class refers to a segmentation of expenditures into five categories. These categories are salaries and wages, personnel benefits, supplies, other services and charges, and capital expenditures. Expenditures may not exceed appropriations at the department level and the budgets constitute the legal authority for expenditures at that level. All appropriations lapse thirty days after the close of each fiscal year.
Budget status reports are used to compare the budgeted amounts with actual revenues and expenditures. Revenues and expenditures can be monitored at fund, department, division, activity, project, or object class level.
Procedures for Adopting the Original Budget
Skagit County adheres to the statutory provisions established by Revised Code of Washington (RCW) 36.40. Significant procedures in the budget process include the following:
• On or before the second Monday in July, County officials are requested to prepare estimates of revenues and expenditures for the next fiscal year.
• On or before the first Tuesday in September, the preliminary annual budget is submitted to the Board of County Commissioners.
• The Commissioners conduct public meetings on the proposed budget from September through October.
• The preliminary budget is made available to the public at least 2 weeks prior to the public hearing. • The Commissioners hold a public hearing on or before the first Monday in December to receive
testimony on the budget. • The Commissioners make adjustments to the proposed budget and adopt, by resolution, a final
balanced budget no later than December 31. • Upon adoption, the final budget is made available to the public.
Amending the Budget
Budget revisions in the form of supplemental appropriation resolutions are approved by the Board of County Commissioners in the legally prescribed manner during public meetings throughout the year. Any proposed revisions which alter the total appropriation of any fund are published in the County’s legal newspaper once per week for two consecutive weeks before the public hearing to enable taxpayer input.
The Financial statements contain the original and final budget information. The original budget is the first complete appropriated budget. The final budget is the original budget adjusted by all legally authorized changes applicable for the fiscal year.
Deficit Fund Equity
The following fund had deficit fund balances/net position as of December 31, 2015;
• The Solid Waste fund deficit was $3,532,903. This results primarily from the recording of liabilities for landfill post closure care costs and environmental remediation costs as well as Net Pension Liability.
37

Skagit County, Washington Notes to the Financial Statements December 31, 2015 IV. DETAIL INFORMATION BY TRANSACTION TYPE
A. Deposits and Investments
Deposits
The Skagit County Treasurer is empowered by the State to act as the treasurer not only for the County but also for special purpose districts located in the County. It is the County’s policy to deposit and invest all temporary cash surpluses. At the end of the year, the total amount held in certificates of deposit and money market accounts was $39,717,587 and the treasurer’s bank balance was $10,620,081, all of which was covered by federal depository insurance or collateralized with securities which are either held by the County or by the County’s agent in the County’s name. The FDIC (Federal Depository Insurance Corporation) insures all deposits of the County up to $250,000 and the Washington Public Deposit Protection Commission insures amounts over $100,000.
Investments
As required by Washington State law, all investments of Skagit County and applicable agency funds are obligations of the United States Government, the State Treasurer’s Investment Pool, commercial paper, or deposits with Washington State banks and savings and loan institutions. US Government securities and commercial paper are stated at fair value. All other investments are stated at amortized cost which approximates fair value. The fair value of the County’s position in the State Treasurer’s Local Government Investment Pool (LGIP) is the same as the value of the pool shares. Authority to manage the Skagit County Investment Program derives from RCW 36.29.020. Regulatory oversight is provided by the County Finance Committee, comprised of the Treasurer as Chair, the Auditor as Secretary, and the Chair of the Board of County Commissioners. The State LGIP was created by the Washington State Legislature in 1986 and is overseen by the State Treasurer. The State Finance Committee administers the pool and is advised by the LGIP Committee, comprised of twelve members selected from the active pool participants. The pool is operated in a manner consistent with the SEC Rule 2a7. Net investment income is allocated monthly to participants and is based on their average proportionate share of Net Position in relation to the total net investment income for the LGIP for that month. Allocations are reinvested in the LGIP.
Management intends to hold time deposits and securities until maturity. Gains or losses on investments sold or exchanged are recognized at the time the transactions are completed.
As of December 31, 2015, the County held the following investments:
Less Than 1Investment Type Fair Value Year Maturity 1 Year 2 Years 3 yearsCertificates of Deposit 17,616,057$ 11,000,000$ 5,565,000$ -$ 1,051,057$ Money Market 22,101,530 22,101,530 Registered Warrants 341,104 341,104 Commercial PaperBankers AcceptancesTreasury Bills 1,241,288 1,241,288 Treasury Notes 41,063,953 16,418,294 24,645,659 - - Municipal Bonds 68,256,580 14,792,431 42,618,730 7,558,910 3,286,509 U.S. Agencies 199,021,663 57,556,692 125,878,341 15,586,630 - State Treasurer Pool 225,347,657 225,347,657
574,989,832$ 347,557,708$ 199,949,018$ 23,145,540$ 4,337,566$
38

Skagit County, Washington Notes to the Financial Statements December 31, 2015 Total fair value of investments represents $167,880,034 for Skagit County and $407,109,797 for the Junior Taxing districts.
Interest Rate Risk
Interest rate risk is the risk that changes in interest rates will adversely affect the fair value of an investment. Through its investment policy, the County manages its exposure to fair value losses arising from increasing interest rates by setting maturity and effective duration limits not to exceed 36 months unless matched to a specific cash flow requirement. Funds specifically designated for capital improvements or for bond redemption purposes may in certain circumstances be invested out to five years.
Custodial Credit Risk
Custodial credit risk is the risk that in event of a failure of the counterparty to an investment transaction the county would not be able to recover the value of the investment or collateral securities. The County had no custodial credit risk as of December 31, 2015.
Concentration of Credit Risk
Concentration of credit risk is the risk of loss attributed to the magnitude of a government’s investment in a single issuer. The County’s policy is to limit to 15 percent of the total portfolio the amount that may be invested in any one financial institution. In addition, no more than 3 percent of the total portfolio may be invested in any one issuer of commercial paper and no more than 10 percent may be invested in any one Treasury obligation. As of December 31, 2008 the investment in the Washington State LGIP was limited to 65 percent, this was modified by resolution on March 16, 2009 to allow investment in excess of 65 percent when there are no other viable alternatives. At year end, the County had no investment in a single issuer that was greater than 5 percent of total investments.
Federal Arbitrage
Federal Arbitrage is the ability to obtain tax-exempt bond proceeds and invest the funds into higher yielding taxable securities, resulting in a profit. The County had no federal arbitrage in 2015.
Credit Risk
Credit risk is the risk that an issuer or other counterparty to an investment will not fulfill its obligations. The County’s investment policy is to apply the prudent-person rule: Investments shall be made with the exercise of judgment and care which persons of prudence, discretion and intelligence exercise in the management of their affairs, not for speculation, but for investment, considering the probable safety of their capital as well as the probable income to be derived. The County’s policy limits investments in commercial paper to ratings of A1 or P1 only.
As of December 31, 2015, the County’s investments in U.S. Agencies in the amount of $199,021,664 (fair value) was rated AAA by Standard & Poor’s, an additional amount of $6,066,521 (fair value) was rated AAA by Moody’s. Details of ratings on investments in municipal bonds and banker’s acceptances are as follows:
39

Skagit County, Washington Notes to the Financial Statements December 31, 2015
The County also carried investments in registered warrants and the Washington State LGIP, which are unrated.
Property Taxes
The County Treasurer acts as an agent to collect property taxes levied in the County for all taxing authorities. Taxes are levied and become an enforceable lien on January 1st of each year. Collection of taxes is authorized on February 15th, with installments due on April 30th and October 31st. On May 31st the assessed value of property is established for the following year’s levy. Assessed value is considered to be 100 percent of market value.
Property taxes are recorded as a receivable when levied. Property tax collected in advance of the fiscal year to which it applies is recorded as a deferred inflow. Revenue is recognized when the taxes are collected. Refunds of taxes are recorded as reductions of revenue when they are measureable and due to be issued. No allowance for uncollectible taxes is established because delinquent taxes are considered fully collectible. Prior year tax levies were recorded using the same principal, and delinquent taxes are evaluated annually.
The County may levy up to $1.80 per $1,000 of assessed valuation for general governmental services, subject to the following limitations:
ADAMS COUNTY JT SD OTHELLO AA1/A1 182,045 WHIDBEY ISL PHD A2 489,977 SNOHOMISH CO WA PUD Aa3/AA- 129,307ALBUQUERQUE NM Aa1/AAA/AA+ 127,226 WYANDOTTE COUNTY KS SCHOO AA- 476,292 SNOHOMISH CO WA SCH #16 Aa1 249,099ANACORTES UTILITY SYS A1/AA- 50,733 ZERO COUPON OR SCHOOL BD Aa2/AA 996,760 SOUTH LYON MI SCHOOLS Aa2 300,414ANOKA HENNEPIN SCHOOLS MN AA+ 1,007,724 GROTON CITY CT Aa3/AA- 375,825 STAMFORD CT Aa1/AAA 176,936ARLINGTON TX SD Aa2/AA 100,322 HALLSVILLE TX SCHOOLS AAA/Aaa 309,633 STATE OF GEORGIA Aaa/AAA/AAA 506,790BECKER MN SD #726 AA+ / A 249,735 KENNEWICK WA AA 516,487 STATE OF MICHIGAN Aa2/AA- 103,055BELMONT MA AAA 3,101,829 KENT COUNTY MI A1+ 2,985,630 STATE OF MINNESOTA Aa1/AA+/AA+ 456,080BOISE CITY INDEP SD AA1/AA 20,177 KING CO WA LTD SER D Aa1/AAA/AA+ 60,000 STATE OF MISSISSIPPI Aa2/AA/AA+ 305,427BONNEVILLE POWER Aa1/AA-/AA- 314,946 LAKE COUNTY IL AA+ 204,380 STATE OF OHIO Aa1/AAA/AA+ 225,375BONNEVILLE POWER ADMINISTRA Aa1/AA-/AA 2,161,928 LANE CO OR SD Aa1/AA+ 241,711 STATE OF OREGON Aa1/AA+/AA+ 291,163BROWNSVILLE TX IND SCHOOLS AAA/AAA/AAA 125,688 LAS VEGAS VALLEY WATER Aa1/AA+ 729,477 STATE OF OREGON Aa1/AA+/AA+ 251,455BURLINGTON CO NJ Aa2/AA 107,632 MADISON SCHOOL WI Aa1 1,065,629 STATE OF RHODE ISLAND Aa2/AA/AA 1,007,760CEDAR RAPIDS IA Aa1 96,006 MADISON WI Aaa 272,311 STATE OF TEXAS 117,359CENTRAL PUGET SOUND REG TR Aa1 50,107 MAPLEWOOD MN AA+ 903,271 STATE OF WASHINGTON Aa1/AA+/AA+ 122,698CHARLETTE N.C. SERIES A Aaa/AAA/AAA 2,156,042 MARIETTA GA AA+ 250,000 STATE OF WASHINGTON Aa1/AA+/AA+ 253,593CHELAN COUNTY PUD #1 Aa3/AA/AA+ 984,450 MARION CO TN AA 100,596 STATE OF WASHINGTON Aa1/AA+/AA+ 507,185CITY OF COLUMBUS OH SCHOOLS Aa2 498,445 MARYLAND STATE Aaa/AAA/AAA 100,236 STATE OF WASHINGTON 500,425CITY OF OAK CREEK WI Aa2 757,118 MICHIGAN STATE Aa2/AA-/AA 65,467 STRATFORD CT A1/AA 503,930CITY OF RACINE WI AA- 125,600 MILWAUKEE WI Aa2/AA 200,862 SW WA SUBURBAN SWR DIS Aa2 306,476CITY OF RENTON WA AA+ 74,987 MILWAUKEE WI Aa3/AA 264,603 UNIVERSITY OF SOUTH CAROAaa/AA+/AAA 25,080CITY OF SEATTLE WA Aa1/AAA/AA+ 497,770 MITCHELL SD SCHOOLS AA 315,087 VILLAGE OF DEFOREST WI Aa2 500,505CLARK CO NV PUBLIC FACILITIES Aa1/AA 60,765 MONROE WA AA- 274,357 VILLAGE OF MENOMONEE FA Aa2 250,113CLARK COUNTY NV Aa1/AA 508,130 MOSCOW ID SD #281 AAA/A1 160,533 WAREFORD WI SCHOOLS AA 201,418CLINTON IA A2 354,316 MULTNOMAH CO. SCHOOLS Aa1/AA+ 1,800,792 WA HOUSING FINANCE COMM Aaa 658,640COAST CA COMMUNITY COLLEGE Aa1/AA 150,158 MUSKEGO-NORWAY SCHOOLS W Aa2 249,815 WA ST HEALTH CARE Aa3/AA- 154,941CONNECTICUT STATE SERIES B 796,606 NASHUA NH Aa2/AAA 1,015,100 WA STATE TAXABLE Aa1/AA+/AA+ 1,738,216COUNTY OF MUSKEGON MI AA 558,025 NEW YORK NY Aa2/AA/AA 205,370 WALNUT VLY CA SCH DIST Aa2 250,000DANE COUNTY WI Aa1/AA+ 25,171 NEW YORK NY AA 213,436 WASHINGTON & CLACKAMAS Aa1 409,180DANE COUNTY WI Aa1/AA+ 25,786 NEW YORK NY Aa2/AA/AA 1,002,500 WASHINGTON STATE REVEN Aa2 1,020,830DENTON CO TX WATER DIST A2/AA- 145,123 OAKLAND CA AA 600,348 WASH STATE TAXABLE SER TAa1/AA+/AA+ 1,202,508DENTON TX A2 375,232 OAKLAND CA A1 750,435 WASHINGTON STATE UNIVER Aa2/AA- 247,439DOUGLAS CO PUD #1 Aa3/AA 50,000 OKLAHOMA CITY SCHOOLS Aa2/AA 7,904,480 WASHINGTON STATE UNIVER Aa2/AA- 473,796DOWNERS GROVE IL Aa2 179,981 OREGON Aa1/AA+/AA+ 337,032 WASHINGTON CO SCHOOLS Aa2/AA+ 102,160EL SEGUNDO CA SCHOOLS Aa2/AA- 1,001,460 PASADENA CA SCHOOLS Aa2/A+ 224,552 WASHINGTON CO UT SD Aaa/AAA/AAA 50,176ENERGY NW Aa1/AA-/AA 20,107 PHOENIX AZ Aa1/AA+ 557,981 WASHINGTON COUNTY WI Aaa 250,045ENERGY NW WA ELEC Aa1/AA-/AA 2,246,957 PIMA COUNTY AZ SCHOOLS AA- 253,863 WASHINGTON ST Aa1/AA+/AA+ 49,875ENERGY NW WA Aa1/AA-/AA 2,031,220 PIMA COUNTY AZ SCHOOLS AA- 156,350 WAUKESHA COUNTY WI Aaa/AAA 503,125FAIRBORN OH SCHOOLS Aa2 693,999 PINAL COUNTY SCHOOLS AZ A1 50,887 WHATCOM COUNTY SCHOOL Aa1 471,670FAIRFAX COUNTY VA Aaa/AAA 765,143 PORT OF BELLINGHAM WA A2 292,703 WHATCOM COUNTY SCHOOL AA+ 260,775GARLAND TX SCH ZERO Aaa/AAA 199,948 PORT OF SEATTLE SERIES C 302,238 WORCESTER MA AA3/AA-/AA- 1,004,720GLEN ELLYN IL Aa1 100,000 PORT TOWNSEND WA A1 65,723GOOSE CREEK TX SD Aaa/AAA 60,093 RANDOLPH COUNTY IL AA 100,521 Total 68,256,580GRANT CO WA PUD #2 Aa3/AA/AA 150,000 RANDOLPH MA AA 1,102,426GREEN BAY WI Aa2 180,767 SEDGEWICK COUNTY KS AAA/Aaa 101,678
40

Skagit County, Washington Notes to the Financial Statements December 31, 2015
• Washington State law in RCW 84.55.010 limits growth of regular property taxes to 1 percent per year, after adjustments for new construction. If the assessed valuation increases by more than 1 percent due to re-valuation, the levy rate will be decreased.
• The Washington State Constitution limits the total regular property taxes to 1 percent of the assessed valuation or $10 per $1,000 of value. If the taxes of all districts exceed this amount, each is proportionately reduced until the total is at or below the 1 percent limit.
• The County may voluntarily levy taxes below the legal limit. Special levies approved by the voters are not subject to the above limitations.
2015 Tax levy information is as follows:
Levy in DollarsAssessed Per
Thousand Total Value Levy2015
County 1.5574 14,670,422,177$ 22,848,407$ Medic 1 Services 0.3750 14,655,421,701 5,495,783 Roads 1.7804 7,266,814,303 12,938,111 Conservation Futures 0.0563 14,670,422,177 826,528
The County tax rate includes a levy for general governmental services and special revenue assessments. The County is authorized to levy taxes in unincorporated areas for road construction and maintenance, subject to the same limitations as the levy for general government services. The Conservation Futures tax rate is a non-voter approved excess levy for the purpose of acquiring land development rights for preservation purposes.
B. Receivables
Governmental funds report some revenues as deferred inflow of resources if they are not available to liquidate liabilities of the current period or are not yet earned. Also see Note I. Detail of deferred inflow of resources balances in the government fund financial statements as of December 31, 2015 is as follows:
Unavailable Unearned TotalProperty Taxes Receivable (General Fund) 616,450$ 616,450$ Property Taxes Receivable (Road Fund) 327,809 327,809$ Property Taxes Receivable (Mental Health Fund) 8,205 8,205$ Property Taxes Receivable (Other Government Funds) 228,725 228,725$ Revenue Earned but Not yet Available 1,930,668 1,930,668$ Revenue Received Prior to Meeting Elgibility Requirements 313,746 313,746$
Total Deferred Inflow of Resources - Government Funds 3,111,857$ 313,746$ 3,425,602$
C. Interfund Receivables, Payables and Transfers
Details of interfund payable/receivable balances of December 31, 2015 are as follows:
Internal General Drainage County Service
Due to Other funds Fund Utility Road Fund Funds TotalGeneral Fund 60,445 1,565,370$ 1,625,815$ Non-Major Governmental Funds 296,733 12,577 77,414 386,724 Mental Health 63,818 63,818 County Road Fund 751,893 31,442 1,131,548 1,914,883 Internal Service Funds 119,087 1,509,159 1,628,246 Solid Waste 83,991 1,143 37,272 122,406 Drainage Utility 39,667 18,460 58,127 Jail Fund 112,706 234,385 347,091
Total 1,467,895$ 105,607$ -$ 4,573,608$ 6,147,110$
41

Skagit County, Washington Notes to the Financial Statements December 31, 2015 These balances are the result of transactions involving the exchange of goods and services in the ordinary operations of the respective funds.
Interfund loans have been made to provide cash flows for the operations of the receiving funds. Because most of these funds are within the Debt Service Fund, they are eliminated in the financial statements. Details of the interfund loans are as follows:
Balance BalanceBorrowing Fund Lending Fund 1/1/2015 New Loans Repayment 12/31/2015
Water Improvement 210 Water Improvement 215 3,000 3,000 Water Improvement 215 Water Improvement 218 229,072 65,000 164,072 Water Improvement 216 Edison Clean Water 1,500 500 1,000 Water Improvement 215 Water Improvement 224 147,361 40,000 107,361
380,933$ -$ 105,500$ 275,433$ Total
Interfund transfers represent subsidies and contributions provided to the receiving fund. Most transfers from the general fund are for the purposes of ordinary operations and debt service. Transfers out of non-major governmental funds are generally for debt service and capital project funding. Details of 2015 transfers are as follows:
General Jail County Non-Major BalanceTransfering Fund Fund Fund Roads Governmental 12/31/2015General Fund 4,550,757$ 4,550,757$ Jail FundDrainage Utility 1,142 1,142 Mental Health 160,901 60,000 220,901 County Roads 34,500 34,500 Non-Major 52,000 200,000 2,042,709 2,294,709 Total 212,901$ 60,000$ 234,500$ 6,594,608$ 7,102,009$
Transfers In
D. Capital Assets
Summarized capital asset transactions for governmental activities are as follows:
Governmental ActivitiesBeginning Balance Increases Decreases Ending Balance
Capital Assets, Non-depreciableLand 157,213,966$ 25,320$ 49,349$ 157,189,937$ Development Rights 15,557,605 15,557,604 Capital asset held for resale - - Construction in Progress 792,459 810,811 96,896 1,506,374
173,564,029 836,131 146,245 174,253,915 Depreciable Capital Assets
Buildings 64,702,990 1,652,784 206,826 66,148,948 Improvements 4,987,816 373,213 5,361,029 Machinery and Equipment 24,248,305 1,719,297 1,183,153 24,784,449 Infrastructure 333,713,412 612,932 333,100,480
427,652,523 3,745,294 2,002,911 429,394,906 Less Accumulated Depreciation
Buildings (28,154,885) (1,085,706) 308,376 (28,932,216) Improvements (3,030,497) (142,554) (3,173,051) Machinery and Equipment (14,003,298) (1,457,492) 176,849 (15,283,941) Infrastructure (267,046,468) (15,414,264) (282,460,732)
(312,235,148) (18,100,016) 485,225 (329,849,939)
Total Net Depreciable Capital Assets 115,417,375 (14,354,722) (1,517,686) 99,544,966 Total Net Capital Assets 288,981,407$ (13,518,591)$ (1,663,932)$ 273,798,884$
42

Skagit County, Washington Notes to the Financial Statements December 31, 2015 Depreciation expense by function for governmental activities is as follows:
General Governmental Services 1,717,733$ Judicial 6,171 Public Safety 375,737 Utilities - Transportation 15,730,679 Natural & Economic Environment 14,344 Social Services 80,468 Culture and Recreation 174,884 Total governmental activities depreciation expense 18,100,016$
Summarized capital asset transactions for business type activities are as follows:
Beginning EndingBusiness - Type Activities Balance Increases Decreases BalanceCapital Assets, Non-depreciable
Land 816,556$ -$ -$ 816,556$ Construction in Progress 8,074,074 11,467,196 2,307,346 17,233,924
8,890,630 11,467,196 2,307,346 18,050,480
Depreciable Capital AssetsBuildings 9,899,875 9,899,875 Improvements 8,275,860 2,635,198 10,911,058 Machinery and Equipment 1,836,854 5,417 1,842,271
20,012,589 2,640,615 22,653,203
Less Accumulated Depreciation - Buildings (1,283,370) (241,076) (1,524,446) Improvements (3,297,131) (235,539) (3,532,670) Machinery and Equipment (681,728) (95,664) (777,392)
(5,262,229) (572,279) (5,834,508)
Total Net Depreciable Capital Assets 14,750,359 2,068,336 16,818,694 Total Net Capital Assets 23,640,989 13,535,532 2,307,346 34,869,174
Depreciation expense by function for business type activities is as follows:
Solid Waste 336,268$ Drainage Utility 236,011 Total business type activities depreciation expense 572,279$
V. LONG TERM LIABILITIES
Skagit County’s long-term liabilities include general obligation bonds and loans from the State of Washington. General obligation bonds have been issued for both general government and business-type activities and are being repaid from the applicable resources. For the proprietary funds and on the government-wide financial statements, bond premiums and discounts, as well as issuance costs, are deferred and amortized over the life of the bonds. Bonds payable are reported net of the applicable bond premium or discount. Government funds recognize bond premiums, discounts, and issuance costs in the period that they are incurred. Proceeds of debt are reported as other financing sources. Premiums
43

Skagit County, Washington Notes to the Financial Statements December 31, 2015 received on debt issuance are reported as other financing sources while discounts are reported as other financing uses. Issuance costs, including those withheld from proceeds, are reported as debt service expenditures.
Details of general obligation bonds outstanding as of December 31, 2015 are as follows:
Description BalanceIn 2006 bonds in the amount of $7,610,000 were issued to acquire land, construct county facilities and for other capital purposes. Principle payments are due annually on December 1, interest payments are due on June 1 and December 1. The interest rates range from 3.75% on 2007 maturities to 4.0% for maturities in 2026. Principle payments of $350,000 and interest payments of $203,635 were made in 2015. 4,895,000
In 2007 bonds were issued in the amount of $6,115,000 to refund a portion of the 2000 Bond issue. Principal payments are due annually on December 1, interest payments are due on June 1 and December 1. The interest rates range from 3.875% on 2007 maturities to 4.00% for maturities in 2022. Principal payments of $435,000 and interest payments of $156,646 were made in 2015. 3,565,000
In 2013, the outstanding balance ($990,000) of the 2003 bond issue in the amount of $965,000 was refunded in order to take advantage of better rates. The original was issued at $5,340,000 to finance the acquisition and renovation of a building to house County offices, and to refund the 1993 bonds. Interest ranges from 2.00% to 3.00%. Principal payments are due annually on December 1. Interest payments are due June 1 and December 1. Principal payments of $190,000 and interest payments of $17,700 were made in 2015. 400,000
In 2013, the County entered into an interlocal agreement with Skagit Regional Public Facilities District to refund their 2003 bond issue, in order to take advantage of better rates. This was completed per C20130043. The County booked a receivable for the balance and will systematically reduce the debt over time from their dedicated sales tax revenue. See Note VIII. Principal payments are due annually on December 1. Interest payments are due June 1 and December 1. Principal payments of $370,000 and interest payments of $204,719 were made in 2015. 6,565,000
In 2014, bonds in the amount of 780,000 were issued to aquire a building for County use. Interest rates range from 3.625% to 5.00 % for maturities in 2041. Principle payments are due annually on December 1. Interest payments are due June 1 and January 1. Interest of $35,762.71 and no principle payments were made in 2015. 780,000
Total bonds payable at December 31, 2015 for government activities: 16,205,000
Proceeds in the amount of $9,740,000 from the 2010 bond issue are for the purpose of improving the County's Solid Waste transfer station and other Capital improvements to County facilities. Principle payments are due annually on December 1. Interest payments are due June 1 and January 1. Interest rates range from 1.90% in 2014 to 5.35% for maturities in 2030. Principal payment of $495,000 and interest payment of $401,125 were made in 2015. 8,765,000
Proceeds in the amount of $51,920,000 from the 2014 bond issue are for the purpose of planning, aquiring land, and constructing a 400 bed regional jail facility. Principle payments are due annually on December 1, beginning in 2015. Interest rates range from 3.625% in 2011 to 5.00% for maturities in 2030. Interest of $2,249,340 and no principle payments were made in 2015. 51,920,000
Total bonds payable at December 31, 2015 for business-type activities: 60,685,000
44

Skagit County, Washington Notes to the Financial Statements December 31, 2015 Annual debt service requirements to maturity for the general obligations bonds are as follows:
Year Ending December 31 Principal Interest Principal Interest2016 1,405,000$ 571,881$ 500,000$ 2,650,656$ 2017 1,490,000 523,056 1,660,000 2,637,156 2018 1,385,000 471,394 1,715,000 2,576,621 2019 1,050,000 422,096 1,770,000 2,511,661 2020-2025 7,705,000 1,305,219 9,975,000 11,290,366 2025-2029 2,875,000 231,950 12,325,000 8,626,150 2030-2034 295,000 35,963 12,255,000 5,544,276 2035-2039 - 14,050,000 3,405,400 2040-2041 6,435,000 388,600 Totals 16,205,000 3,561,559 60,685,000 39,630,888
Business-Type Activities Government Activities
Refunded Bonds
In 2007 the County refunded a portion of the 2000 bond issue using proceeds from the 2007 bond issue. These proceeds were placed in an irrevocable trust to fund all future payments on the 2000 bonds. Accordingly, those 2000 bonds are considered to be defeased and the liability for them is not included in the 2015 financial statements. As of December 31, 2015 the balance of the defeased bonds outstanding is $2,820,000.
Loans Payable
Details of loans payable as of December 31, 2015 is as follows:
Description BalancePayable to the State of Washington Department of Ecology Water Pollution Control Revolving Fund pursuant to a 1997 loan agreement. The term is 20 years and no interest is due. Principal payments of $17,768 were made in 2015. 62,188$ Payable to the State of Washington Department of Ecology Water Pollution Control Revolving Fund pursuant to a 2000 loan agreement. The term is 20 years and no interest is due. Principal payments of $2,948 were made in 2015. 23,581 Payable to the State of Washington Department of Ecology pursuant to a 2007 loan agreement. The interest rate is 2.6% and the term is 20 years. Principal payments of $92,147 and interest payments of $443,301 were made in 2015. 1,724,304 Payable to the State of Washington Department of Ecology pursuant to a 2014 loan agreement. The interest rate is 2.7% and the term is 20 years. Principal payments of $9,235 and interest payments of $20,206 were made in 2015. 867,717
Total loans payable at December 31, 2015 for governmental activities 2,677,791$
Annual debt service requirements to maturity for loans payable are as follows:
Year Ending December 31 Principal Interest2016 152,880$ 64,202$ 2017 156,191 60,891 2018 159,585 57,497 2019 154,179 54,018 2020-2024 778,851 214,771 2025-2029 868,122 113,710 2030-2034 407,983 23,110 Totals 2,677,791 588,199
45

Skagit County, Washington Notes to the Financial Statements December 31, 2015 Debt Limitation
State law places certain restrictions on the County’s ability to issue general obligation bonds. Without an authorizing vote, limited tax general obligation bonds may be issued in an amount up to 1.5% of the assessed valuation of real property within the county. Unlimited tax general obligation bonds may be issued up to 2.5% of the assessed valuation with voter approval. No combination of limited and unlimited tax bonds may exceed 2.5% of the assessed valuation.
At December 31, 2015, the County’s remaining capacity for non-voted debt was $174,134,793. Additional debt capacity with an authorizing vote is $154,461,137.
Changes in Long-Term Liabilities
Details of changes in long term liabilities for the year ended December 31, 2015 is as follows:
Beginning Ending Due WithinBalance New Issue Retirements Balance One year
Governmental Activities:Bonds Payable
General Obligation Bonds 17,550,000$ 574,719$ 1,919,719$ 16,205,000$ 1,405,000$ Add: Net Unamortized Discounts/Premiums 647,643 58,773 588,870 Total Bonds Payable 18,197,643 574,719 1,978,492 16,793,870 1,405,000
Loans Payable 2,802,126 240,012 364,346 2,677,792 152,880 Note Payable - - Compensated Absences 2,278,427 245,355 166,249 2,357,533 2,357,533 OPEB Liability 413,104 416,907 413,104 416,907 Net Pension Liability 24,847,823 24,847,823 Environmental Liabilities 119,424 5,891 113,533 Total Long-Term Liabilities 23,810,724$ 26,324,816$ 2,928,082$ 47,207,457$ 3,915,413$
Beginning Ending Due WithinBalance New Issue Retirements Balance One year
Business-Type ActivitiesBonds Payable
General Obligation Bonds 61,180,000$ 495,000$ 60,685,000$ 500,000$ Discounts/Premiums 3,870,585 22,185 165,025 3,727,745$ Less: Unamortized Refunding - - -$ Total Bonds Payable 65,050,585 22,185 660,025 64,412,745 500,000
Compensated Absences 229,932 29,159 12,690 246,401 Post Closure Landfill Costs 3,043,592 50,000 182,166 2,911,426 50,000 Environmental Liabilities 3,945,248 10,500 18,089 3,937,659 10,500 Net Pension Liabilities 3,270,246 3,270,246 Total Long-Term Liabilities 72,269,357$ 3,382,089$ 872,969$ 74,778,475$ 560,500$
For governmental activities, the Unemployment Fund liquidates compensated absences as well as the OPEB obligation.
VI. PENSION AND OTHER BENEFIT PLANS
The following table represents the aggregate pension amounts for all plans subject to the requirements of GASB Statement No. 68, Accounting and Financial Reporting for Pensions for the year 2015:
46
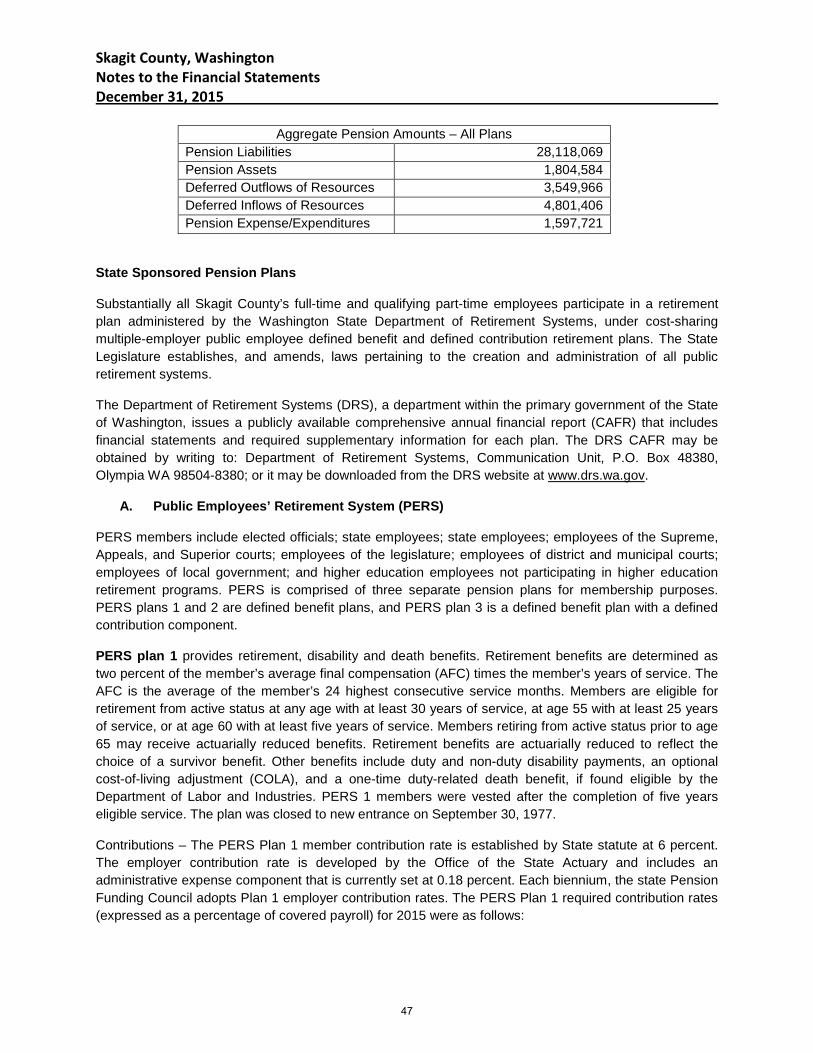
Skagit County, Washington Notes to the Financial Statements December 31, 2015
Aggregate Pension Amounts – All Plans Pension Liabilities 28,118,069 Pension Assets 1,804,584 Deferred Outflows of Resources 3,549,966 Deferred Inflows of Resources 4,801,406 Pension Expense/Expenditures 1,597,721
State Sponsored Pension Plans
Substantially all Skagit County’s full-time and qualifying part-time employees participate in a retirement plan administered by the Washington State Department of Retirement Systems, under cost-sharing multiple-employer public employee defined benefit and defined contribution retirement plans. The State Legislature establishes, and amends, laws pertaining to the creation and administration of all public retirement systems.
The Department of Retirement Systems (DRS), a department within the primary government of the State of Washington, issues a publicly available comprehensive annual financial report (CAFR) that includes financial statements and required supplementary information for each plan. The DRS CAFR may be obtained by writing to: Department of Retirement Systems, Communication Unit, P.O. Box 48380, Olympia WA 98504-8380; or it may be downloaded from the DRS website at www.drs.wa.gov.
A. Public Employees’ Retirement System (PERS)
PERS members include elected officials; state employees; state employees; employees of the Supreme, Appeals, and Superior courts; employees of the legislature; employees of district and municipal courts; employees of local government; and higher education employees not participating in higher education retirement programs. PERS is comprised of three separate pension plans for membership purposes. PERS plans 1 and 2 are defined benefit plans, and PERS plan 3 is a defined benefit plan with a defined contribution component.
PERS plan 1 provides retirement, disability and death benefits. Retirement benefits are determined as two percent of the member’s average final compensation (AFC) times the member’s years of service. The AFC is the average of the member’s 24 highest consecutive service months. Members are eligible for retirement from active status at any age with at least 30 years of service, at age 55 with at least 25 years of service, or at age 60 with at least five years of service. Members retiring from active status prior to age 65 may receive actuarially reduced benefits. Retirement benefits are actuarially reduced to reflect the choice of a survivor benefit. Other benefits include duty and non-duty disability payments, an optional cost-of-living adjustment (COLA), and a one-time duty-related death benefit, if found eligible by the Department of Labor and Industries. PERS 1 members were vested after the completion of five years eligible service. The plan was closed to new entrance on September 30, 1977.
Contributions – The PERS Plan 1 member contribution rate is established by State statute at 6 percent. The employer contribution rate is developed by the Office of the State Actuary and includes an administrative expense component that is currently set at 0.18 percent. Each biennium, the state Pension Funding Council adopts Plan 1 employer contribution rates. The PERS Plan 1 required contribution rates (expressed as a percentage of covered payroll) for 2015 were as follows:
47

Skagit County, Washington Notes to the Financial Statements December 31, 2015
PERS Plan 1 Actual Contribution Rates: Employer Employee* January through June 2015 9.21% 6.00%
July through December 2015 11.18% 6.00% *For employees participating in JBM, the contribution rate was 12.26%
Skagit County’s actual contributions to the plan were $60,981 for the year ended December 31, 2015.
PERS Plan 2/3 provides retirement, disability and death benefits. Retirement benefits are determined as two percent of the member’s average final compensation (AFC) times the member’s years of service for Plan 2 and 1 percent of the AFC for Plan 3. The AFC is the average of the member’s 60 highest-paid consecutive service months. There is no cap on years of service credit. Members are eligible for retirement with a full benefit at 65 with at least five years of service credit. Retirement before age 65 is considered an early retirement. PERS Plan 2/3 members who have at least 20 years of service credit and are 55 years of age or older, are eligible for early retirement with a benefit that is reduced by a factor that varies according to age for each year before age 65. PERS Plan 2/3 members who have 30 or more years of service credit and are at least 55 years old can retire under one of two provisions:
• With a benefit that is reduced by three percent for each year before age 65; or • With a benefit that has a smaller (or no) reduction (depending on age) that imposes stricter
return-to-work rules.
PERS Plan 2/3 members hired on or after May 1, 2013 have the option to retire early by accepting a reduction of five percent for each year of retirement before age 65. This option is available only to those who are age 55 or older and have at least 30 years of service credit. PERS Plan 2/3 retirement benefits are also actuarially reduced to reflect the choice of a survivor benefit. Other PERS Plan 2/3 benefits include duty and non-duty disability payments, a cost-of-living allowance (based on the CPI), capped at three percent annually and a one-time duty related death benefit, if found eligible by the Department of Labor and Industries. PERS Plan 2 members are vested after completing five years of eligible service. Plan 3 members are vested in the defined benefit portion of their plan after ten years of service; or after five years of service if 12 months of that service are earned after age 44.
PERS Plan 3 defined contribution benefits are totally dependent on employee contributions and investment earnings on those contributions. PERS Plan 3 members choose their contribution rate upon joining membership and have a chance to change rates upon changing employers. As established by statute, Plan 3 required defined contribution rates are set at a minimum of 5 percent and escalate to 15 percent with a choice of six options. Employers do not contribute to the defined contribution benefits. PERS Plan 3 members are immediately vested in the defined contribution portion of their plan.
Contributions – The PERS Plan 2/3 employer and employee contribution rates are developed by the Office of State Actuary to fully fund Plan 2 and the defined benefit portion of Plan 3. The Plan 2/3 employer rates include a component to address the PERS Plan 1 UAAL and an administrative expense that is currently set at 0.18 percent. Each biennium, the state Pension Funding Council adopts Plan 2 employer and employee contribution rates and Plan 3 contribution rates. The PERS Plan 2/3 required contribution rates (expressed as a percentage of covered payroll) for 2015 were as follows:
48

Skagit County, Washington Notes to the Financial Statements December 31, 2015
PERS Plan 2/3 Actual Contribution Rates: Employer Employee* January through June 2015 9.21% 4.92%
July through December 2015 11.18% 6.12% *For employees participating in JBM, the contribution rate was 15.30%
Skagit County’s actual contributions to the plan were $1,727,962 for the year ended December 31, 2015.
Public Safety Employees’ Retirement System (PSERS)
PSERS Plan 2 was created by the 2014 Legislature and became effective July 1, 2006. To be eligible for membership, an employee must work on a full time basis and:
• Have completed a certified criminal justice training course with authority to arrest, conduct criminal investigations, enforce the criminal laws of Washington, and carry a firearm as part of the job; or
• Have primary responsibility to ensure the custody and security of incarcerated or probationary individuals; or
• Function as a limited authority Washington peace officer, as defined in RCW 10.93.020; or • Have primary responsibility to supervise eligible members who meet the above criteria.
PSERS membership includes:
• PERS 2 or 2 employees hired by a covered employer before July 1, 2006, who met at least one of the PSERS eligibility criteria and elected membership during the period of July 1, 2006 to September 30, 2006; and
• Employees hired on or after July 1, 2006 by a covered employer, that meet at least one of the PSERS eligibility criteria.
PSERS covered employees include:
• Certain State of Washington agencies (Department of Corrections, Department of Natural Resources, Gambling Commission, Liquor Control Board, Parks and Recreation Commission, and Washington State Patrol)
• Washington State Counties • Washington State Cities (except for Seattle, Spokane, and Tacoma) • Correctional entities formed by PSERS employers under the Interlocal Cooperation Act.
PSERS Plan 2 provides retirement, disability and death benefits. Retirement benefits are determined as two percent of the average final compensation (AFC) for each year of service. The AFC is based on the member’s 60 consecutive highest creditable months of service. Benefits are actuarially reduced for each year that the member’s age is less than 60 (with ten or more service credit years in PSERS), or less than 65 (with fewer than ten service credit years). There is no cap on years of service credit. Members are eligible for retirement at the age of 65 with five years of service; or at the age of 60 with at least ten years of PSERS service credit; or at age 53 with 20 years of service. Retirement before the age of 60 is considered an early retirement. PSERS members who retire prior to the age of 60 receive reduced benefits. If retirement is at age 53 or older with at least 20 years of service, a three percent per year reduction for each year between the age at retirement and age 60 applies. PSERS Plan 2 retirement benefits are actuarially reduced to reflect the choice of a survivor benefit. Other benefits include duty and
49

Skagit County, Washington Notes to the Financial Statements December 31, 2015 non-duty disability payments, an optional cost-of-living adjustment (COLA), and a one-time duty-related death benefit, if found eligible by the Department of Labor and Industries. PSERS Plan 2 members are vested after completing five years of eligible service.
Contributions – The PSERS Plan 2 employer and employee contribution rates are developed by the Office of State Actuary to fully fund Plan 2. The Plan 2 employer rates include components to address eh PERS Plan 1 unfunded actuarial accrued liability and administrative expense currently set at 0.18 percent. Each biennium, the state Pension Funding Council adopts Plan 2 employer and employee contribution rates. The PSERS Plan 2 required contribution rates (expressed as a percentage of current-year covered payroll) for 2015 were as follows:
PSERS Plan 2 Actual Contribution Rates: Employer Employee* January through June 2015 10.54% 6.36%
July through December 2015 11.54% 6.59%
Skagit County’s actual contributions to the plan were $158,013 for the year ended December 31, 2015.
Law Enforcement Officers’ and Fire Fighters’ Retirement System (LEOFF)
LEOFF membership includes all full-time, fully compensated, local law enforcement commissioned officers, firefighters, and as of July 24, 2005, emergency medical technicians. LEOFF is comprised of two separate benefit plans.
LEOFF Plan 1 provides retirement, disability and death benefits. Retirement benefits are determined per year of service calculated as a percent of final average salary (FAS) as follows:
• 20+ years of service – 2.0% of FAS • 10-19 years of service – 1.5% of FAS • 5-9 years of service – 1% of FAS
The FAS is the basic monthly salary received at the time of retirement, provided a member has held the same position or rank for 12 months preceding the date of retirement. Otherwise, it is the average of the highest consecutive 24 months’ salary within the last ten years of service. Members are eligible for retirement with five years of service at the age of 50. Other benefits include duty and non-duty disability payments, a cost-of-living adjustment (COLA), and a one-time duty-related death benefit, if found eligible by the Department of Labor and Industries. LEOFF 1 members were vested after the completion of five years of eligible service. The plan was closed to new entrants on September 30, 1977.
Contributions – Starting on July 1, 2000, LEOFF Plan 1 employers and employees contribute zero percent, as long as the plan remains fully funded. The LEOFF Plan 1 had no required employer or employee contributions for fiscal year 2015. Employers paid only the administrative expenses of 0.18 percent of covered payroll.
LEOFF Plan 2 provides retirement, disability and death benefits. Retirement benefits are determined as two percent of the final average salary (FAS) per year of service (the FAS is based on the highest consecutive 60 months). Members are eligible for retirement with a full benefit at 53 with at least five years of service credit. Members who retire prior to the age of 53 receive reduced benefits. If the member
50

Skagit County, Washington Notes to the Financial Statements December 31, 2015 has at least 20 years of service and is age 50, the reduction is three percent for each year prior to age 53. Otherwise, the benefits are actuarially reduced for each year prior to age 53. LEOFF 2 retirement benefits are also actuarially reduced to reflect the choice of a survivor benefit. Other benefits include duty and non-duty disability payments, a cost-of-living allowance (based on the CPI), capped at three percent annually and a one-time duty-related death benefit, if found eligible by the Department of Labor and Industries. LEOFF 2 members are vested after the completion of five years of eligible service.
Contributions – The LEOFF 2 employer and employee contribution rates are developed by the Office of the State Actuary to fully fund Plan 2. The employer rate included an administrative expense component set at 0.18 percent. Plan 2 employers and employees are required to pay at the level adopted by the LEOFF Plan 2 Retirement Board. The LEOFF Plan 2 required contributions rates (expressed as a percentage of covered payroll) for 2015 were as follows:
LEOFF Plan 2 Actual Contribution Rates: Employer Employee* January through June 2015 5.23% 8.41%
July through December 2015 8.59% 8.41%
Skagit County’s actual contributions to the plan were $227,513 for the year ended December 31, 2015.
The Legislature, by means of a special funding arrangement, appropriates money from the state General Fund to supplement the current service liability and fund the prior service cost of Plan 2 in accordance with the recommendations of the Pension Funding Council and the LEOFF Plan 2 Retirement Board. This special funding situation is not mandated by the state constitution and could be changed by statue. For the state fiscal year ending June 30, 2015, the state contributed $58,339,032 to the LEOFF Plan 2.
Actuarial Assumption
The total pension liability (TPL) for each of the DRS plans was determined using the most recent actuarial valuation completed in 2015 with a valuation date of June 30, 2014. The actuarial assumptions used in the valuation were based on the results of the Office of State Actuary’s (OSA) 2007-2012 Experience Study.
Additional assumptions for subsequent events and law changes are current as of the 2014 actuarial valuation report. The TPL was calculated as of the valuation date and rolled forward to the measurement date of June 30, 2015. Plan liabilities were rolled forward from the June 30, 2014 to June 30, 2015 reflecting each plan’s normal cost (using the entry-age cost method), assumed interest and actual benefit payments.
• Inflation: 3% total economic inflation; 3.75% salary inflation • Salary increases: In addition to the base 3.75% salary inflation assumption, salaries are also
expected to grow by promotions and longevity. • Investment rate of return: 7.5%
Mortality rates were based on the RP-2000 report’s Combined Healthy Table and Combined Disabled Table, published by the Society of Actuaries. OSA applied offsets to the base table and recognized future improvements in mortality by projecting the mortality rates using 100% Scale BB. Mortality rates are
51
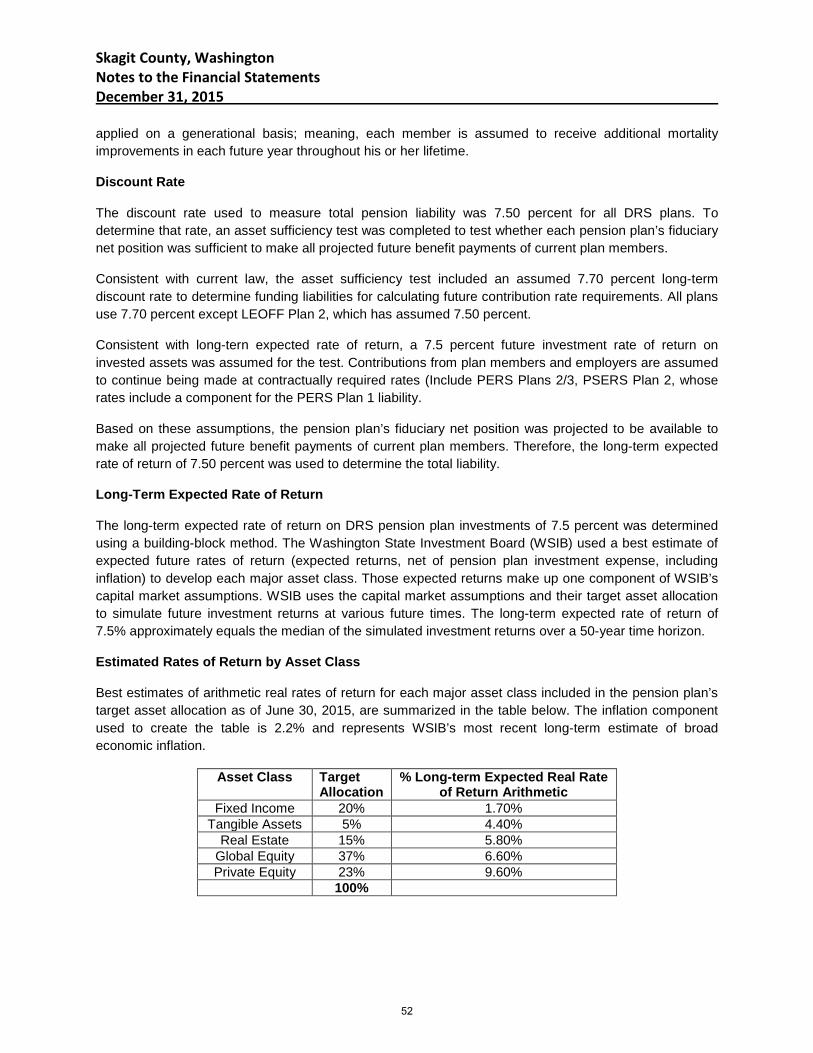
Skagit County, Washington Notes to the Financial Statements December 31, 2015 applied on a generational basis; meaning, each member is assumed to receive additional mortality improvements in each future year throughout his or her lifetime.
Discount Rate
The discount rate used to measure total pension liability was 7.50 percent for all DRS plans. To determine that rate, an asset sufficiency test was completed to test whether each pension plan’s fiduciary net position was sufficient to make all projected future benefit payments of current plan members.
Consistent with current law, the asset sufficiency test included an assumed 7.70 percent long-term discount rate to determine funding liabilities for calculating future contribution rate requirements. All plans use 7.70 percent except LEOFF Plan 2, which has assumed 7.50 percent.
Consistent with long-tern expected rate of return, a 7.5 percent future investment rate of return on invested assets was assumed for the test. Contributions from plan members and employers are assumed to continue being made at contractually required rates (Include PERS Plans 2/3, PSERS Plan 2, whose rates include a component for the PERS Plan 1 liability.
Based on these assumptions, the pension plan’s fiduciary net position was projected to be available to make all projected future benefit payments of current plan members. Therefore, the long-term expected rate of return of 7.50 percent was used to determine the total liability.
Long-Term Expected Rate of Return
The long-term expected rate of return on DRS pension plan investments of 7.5 percent was determined using a building-block method. The Washington State Investment Board (WSIB) used a best estimate of expected future rates of return (expected returns, net of pension plan investment expense, including inflation) to develop each major asset class. Those expected returns make up one component of WSIB’s capital market assumptions. WSIB uses the capital market assumptions and their target asset allocation to simulate future investment returns at various future times. The long-term expected rate of return of 7.5% approximately equals the median of the simulated investment returns over a 50-year time horizon.
Estimated Rates of Return by Asset Class
Best estimates of arithmetic real rates of return for each major asset class included in the pension plan’s target asset allocation as of June 30, 2015, are summarized in the table below. The inflation component used to create the table is 2.2% and represents WSIB’s most recent long-term estimate of broad economic inflation.
Asset Class Target Allocation
% Long-term Expected Real Rate of Return Arithmetic
Fixed Income 20% 1.70% Tangible Assets 5% 4.40%
Real Estate 15% 5.80% Global Equity 37% 6.60% Private Equity 23% 9.60%
100%
52

Skagit County, Washington Notes to the Financial Statements December 31, 2015 Sensitivity of NPL
The table below presents Skagit County’s proportionate share of the net pension liability calculated using the discount rate of 7.5%, as well as Skagit County’s proportionate share of the net pension liability would be if it were calculated using a discount rate that is 1 – percentage point lower (6.5%) or 1-percentage point higher (8.5%) than the current rate.
1% Decrease (6.5%)
Current Discount Rate (7.5%) 1% Increase (8.5%)
PERS 1 $ 19,152,695 $ 15,731,133 $ 12,788,902 PERS 2/3 35,807,236 12,245,760 (5,794,380) PSERS 2 1,072,746 141,176 (421,491) LEOFF 1 (191,813) (299,823) (391,881) LEOFF 2 1,506,920 (1,504,761) (3,771,165)
Pension Plan Fiduciary Net Position
Detailed information about the State’s pension plans’ fiduciary net position is available in the separately issued DRS financial report.
Pension Liabilities (Assets), Pension Expense, and Deferred Outflows of Resources and Deferred Inflows of Resources Related to Pensions
At June 30, 2015, Skagit County reported a total pension liability of $28,118,069 and a total net pension asset of (1,804,583) for its proportionate share of the net pension liabilities as follows:
Liability (or Asset)
PERS 1 15,731,133 PERS 2/3 12,245,760 PSERS 2 141,176 LEOFF 1 (299,823) LEOFF 2 (1,504,761)
The amount of the asset reported above for LEOFF Plan 2 reflects a reduction for the State pension support provided to Skagit County. The amount recognized by the County is its proportionate share of the net pension asset, the related State support, and the total portion of the net pension asset that was associated with the County are as follows:
Liability (or Asset) LEOFF 2 - employer's proportionate share (1,504,761) LEOFF 2 - State's proportionate share (409,090,914)
53

Skagit County, Washington Notes to the Financial Statements December 31, 2015 At June 30, the County’s proportionate share of the collective net pension liabilities were as follows:
Proportionate Share 6/30/14
Proportionate Share 6/30/15
Change in Proportion
PERS 1 0.3075950% 0.3007330% -0.0068620% PERS 2/3 0.3453810% 0.3427250% -0.0026560% PSERS 2 0.7955280% 0.7734850% -0.0220430% LEOFF 1 0.0246710% 0.0248770% 0.0002060% LEOFF 2 0.1448180% 0.1464060% 0.0015880%
Employer contribution transmittals received and processed by DRS for the fiscal year ended June 30 are used as the basis for determining each employer’s proportionate share of the collective pension amounts reported by DRS in the Schedules of Employer and Nonemployer Allocations for all plans except LEOFF Plan 1.
LEOFF Plan 1 allocation percentages are based on the total historical employer contributions to LEOFF 1 from 1971 through 2000 and the retirement benefit payments in fiscal year 2015. Historical data was obtained from a 2011 study by the Office of the State Actuary (OSA). In fiscal year 2015, the state of Washington contributed 87.12% of LEOFF 1 employer contributions and all other employers contributions have been required since June 2000. If the plan becomes underfunded, funding of the remaining liability will require new legislation. The allocation method the plan chose reflects the projected long-term contribution effort based on historical data.
In fiscal year 2015, the state of Washington contributed 39.8 percent of LEOFF 2 employer contributions pursuant to RCW 41.27.726 and all other employers contributed the remaining 60.20 percent of employer contributions.
The collective net pension asset was measured as of June 30, 2015, and the actuarial valuation data on which the total pension asset is based was as of June 30, 2014, with update procedures used to roll forward the total pension liability to the measurement date.
Pension Expense
For the year ended December 31, 2015, the County recognized pension expense as follows:
Pension Expense
PERS 1 (830,801) PERS 2/3 (429,169) PSERS 2 3,952 LEOFF 1 (60,864) LEOFF 2 (280,840)
Deferred Outflows of Resources and Deferred Inflows of Resources At December 31, 2015, the County reported deferred outflows of resources and deferred inflows of resources related to pensions from the following sources:
54

Skagit County, Washington Notes to the Financial Statements December 31, 2015
PERS 1 Deferred Outflows of
Resources Deferred Inflows of
Resources Differenced between expected and actual experience Net difference between projected and actual investment earnings on pension plan investments 860,665 Changes in assumptions Changes in proportion and differences between contributions and proportionate share of contributions Contributions subsequent to the measurement date 34,246 Total $ 34,246 $ 860,665
PERS 2/3 Deferred Outflows of
Resources Deferred Inflows of
Resources Differenced between expected and actual experience 1,301,727 $ - Net difference between projected and actual investment earnings on pension plan investments 3,269,038 Changes in assumptions 19,731 Changes in proportion and differences between contributions and proportionate share of contributions 85,461 Contributions subsequent to the measurement date 1,680,563 Total $ 3,002,021 $ 3,354,499
PSERS 2 Deferred Outflows of
Resources Deferred Inflows of
Resources Differenced between expected and actual experience 132,266 Net difference between projected and actual investment earnings on pension plan investments
70,024
Changes in assumptions 874 Changes in proportion and differences between contributions and proportionate share of contributions 1346 Contributions subsequent to the measurement date 127,509 Total $ 260,649 $ 71,369
LEOFF 1 Deferred Outflows of
Resources Deferred Inflows of
Resources Differenced between expected and actual experience $ - Net difference between projected and actual investment earnings on pension plan investments 50,616 Changes in assumptions Changes in proportion and differences between contributions and proportionate share of contributions Contributions subsequent to the measurement date
Total $ 50,616
LEOFF 2 Deferred Outflows of
Resources Deferred Inflows of
Resources Differenced between expected and actual experience 131,767 $ - Net difference between projected and actual investment earnings on pension plan investments 455,935 Changes in assumptions 3,969 Changes in proportion and differences between contributions and proportionate share of contributions 8,323 Contributions subsequent to the measurement date 117,313 Total $ 253,049 $ 464,258
55

Skagit County, Washington Notes to the Financial Statements December 31, 2015 Deferred outflows of resources related to pensions resulting from the County’s contributions subsequent to the measurement date will be recognized as a reduction of the net pension liability in the year ended December 31, 2016. Other amounts reported as deferred inflows and deferred outflows of resources related to pensions will be recognized in pension expense as follows:
Year ended December 31: PERS Plan 2/3 2016 388,663.86 2017 388,663.86 2018 388,663.86 2019 155,466.91 2020 -
Thereafter -
Year ended December 31: PSERS 2 2016 21,082.85 2017 21,082.85 2018 21,082.85 2019 21,082.85 2020 21,082.85
Thereafter 21,075.50
Year ended December 31: LEOFF 2 2016 26,102.73 2017 26,102.73 2018 26,102.73 2019 26,102.73 2020 26,104.19
Thereafter 5,220.84
D. Other Post Employment Benefit Plans (OPEB)
Plan Description
As required by the Revised Code of Washington (RCW) Chapter 41.26, the County provides direct cost funding for benefits (other than pensions) promised to the Law Enforcement Officers Fire Fighters Plan 1 (LEOFF1). This is a single employer benefit plan. The benefit provides medical and long term care expenses not payable by worker’s compensation, social security, insurance provided by another employer or other pension plan. As of December 31, 2014, there were no active members and 13 inactive members. Authority for changes in benefits for the LEOFF Plan 1 resides with the Washington state law and the Employee Retirement Benefits Board (ERBB). Members of the ERBB are appointed by the Governor.
56

Skagit County, Washington Notes to the Financial Statements December 31, 2015 Funding Policy The funding policy is based upon the pay-as-you-go financing requirements. Annual OPEB Cost and Net OPEB Obligation Effective beginning the County’s 2008 reporting year, GASB Statement No. 45 Accounting and Financial Reporting by Employers for Post Employment Benefits Other Than Pensions requires other post employment benefits (OPEB) expenses to be accrued based on a computed annual required contribution (ARC). ARC represents the current period’s service cost and the amount necessary to amortize the unfunded actuarial liability.
We have used the alternative measurement method permitted under GASB Statement No. 45. A single retirement age of 56.24 was assumed for all active members for the purpose of determining the actuarial accrued liability. Retirement, disablement, termination and mortality rates were assumed to follow the LEOFF Plan 1 termination and mortality rates used in the June 30, 2007 actuarial valuation report issued by the Office of the Washington State Actuary (OSA). Healthcare costs and trends were determined by Milliman, Inc., actuarial consultants, and used by OSA in a statewide LEOFF Plan 1 medical study performed in 2007. The expected medical inflation trend starts at 9.0% in 2007 and decreases to 5.0% in 2015; it remains at 5.0% after 2015. The expected long-term care inflation trend is 4.5% for all years. The results were based on grouped data with 4 active groupings and 4 inactive groupings. The actuarial cost method used to determine the actuarial accrued liability was Projected Unit Credit. The AAL and NOO are amortized on an open basis as a level dollar over 15 years. These assumptions are individually and collectively reasonable for the purpose of this valuation. The medical inflation trend is the percentage that medical costs are expected to increase in future years. The actuarial valuations involve estimates of the value of reported amounts and assumptions of the probability of events far into the future and actuarially determined amounts are subject to continual revision as results are compared to past expectations and new estimates are made about the future.
The following table illustrates the components of the January 6, 2015 calculation:
PVFB AALInactive:
Medical Expenses 3,784,738 3,784,738 Long-Term Care 1,743,577 1,743,577 Total Inactive 5,528,315 5,528,315
ARCNormal Cost - UAAL Amortization 497,223
ARC 497,223$
Annual OPEB CostARC 497,223 NOO Interest 9,626 NOO Amortization (21,645)
Annual OPEB Cost 485,204
NOOStarting NOO 240,652 Annual OPEB Cost 485,204 Contributions* 72,100
NOO 653,756
Annual OPEB costs of $485,204 less expenses of $68,297 resulted in a net 2015 OPEB obligation of $416,907. As of December 31, 2015 there were no active members in the LEOFF 1 plan.
57
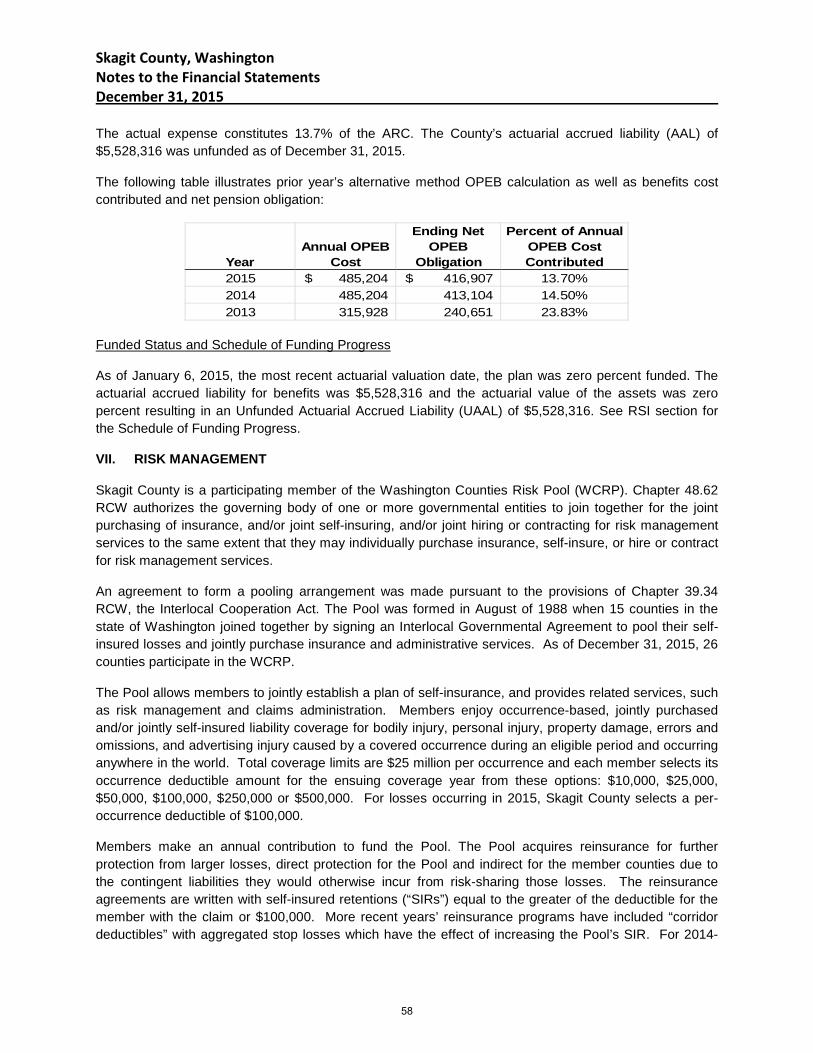
Skagit County, Washington Notes to the Financial Statements December 31, 2015 The actual expense constitutes 13.7% of the ARC. The County’s actuarial accrued liability (AAL) of $5,528,316 was unfunded as of December 31, 2015.
The following table illustrates prior year’s alternative method OPEB calculation as well as benefits cost contributed and net pension obligation:
YearAnnual OPEB
Cost
Ending Net OPEB
Obligation
Percent of Annual OPEB Cost Contributed
2015 485,204$ 416,907$ 13.70%2014 485,204 413,104 14.50%2013 315,928 240,651 23.83%
Funded Status and Schedule of Funding Progress
As of January 6, 2015, the most recent actuarial valuation date, the plan was zero percent funded. The actuarial accrued liability for benefits was $5,528,316 and the actuarial value of the assets was zero percent resulting in an Unfunded Actuarial Accrued Liability (UAAL) of $5,528,316. See RSI section for the Schedule of Funding Progress.
VII. RISK MANAGEMENT
Skagit County is a participating member of the Washington Counties Risk Pool (WCRP). Chapter 48.62 RCW authorizes the governing body of one or more governmental entities to join together for the joint purchasing of insurance, and/or joint self-insuring, and/or joint hiring or contracting for risk management services to the same extent that they may individually purchase insurance, self-insure, or hire or contract for risk management services.
An agreement to form a pooling arrangement was made pursuant to the provisions of Chapter 39.34 RCW, the Interlocal Cooperation Act. The Pool was formed in August of 1988 when 15 counties in the state of Washington joined together by signing an Interlocal Governmental Agreement to pool their self-insured losses and jointly purchase insurance and administrative services. As of December 31, 2015, 26 counties participate in the WCRP.
The Pool allows members to jointly establish a plan of self-insurance, and provides related services, such as risk management and claims administration. Members enjoy occurrence-based, jointly purchased and/or jointly self-insured liability coverage for bodily injury, personal injury, property damage, errors and omissions, and advertising injury caused by a covered occurrence during an eligible period and occurring anywhere in the world. Total coverage limits are $25 million per occurrence and each member selects its occurrence deductible amount for the ensuing coverage year from these options: $10,000, $25,000, $50,000, $100,000, $250,000 or $500,000. For losses occurring in 2015, Skagit County selects a per-occurrence deductible of $100,000.
Members make an annual contribution to fund the Pool. The Pool acquires reinsurance for further protection from larger losses, direct protection for the Pool and indirect for the member counties due to the contingent liabilities they would otherwise incur from risk-sharing those losses. The reinsurance agreements are written with self-insured retentions (“SIRs”) equal to the greater of the deductible for the member with the claim or $100,000. More recent years’ reinsurance programs have included “corridor deductibles” with aggregated stop losses which have the effect of increasing the Pool’s SIR. For 2014-
58

Skagit County, Washington Notes to the Financial Statements December 31, 2015 15, this “corridor” increased the SIR to $2 million, but with an aggregated stop loss of $3.35 million. Other reinsurance agreements respond up to the applicable policy limits. Those reinsurance agreements contain aggregate limits for the maximum annual reimbursements to the Pool of $40 million (lowest reinsured layer), $20 million, (second layer), $30 million (third layer) and $50 million (final reinsured layer). Since the Pool is a cooperative program, there is a joint liability among the participating members.
New members may be asked to pay modest fees to cover the costs to analyze their loss data and risk profiles, and for their proportional shares of the entry year’s assessments. New members contract under the Interlocal Agreement to remain in the Pool for at least five years. Following its initial 60-month term, any member may terminate its membership at the conclusion of any Pool fiscal year, provided the county timely files the required advance written notice. Otherwise, the Interlocal Agreement and membership automatically renews for another year. Even after termination, former members remain responsible for reassessments by the Pool for the members’ proportional shares of any unresolved, unreported, and in-process claims for the periods that the former members were signatories to the Interlocal Agreement.
The Pool is fully funded by its member participants. Claims are filed directly with the Pool by members and adjusted by one of the six staff members responsible for evaluating each claim for coverage, establishing reserves, and investigating for any risk-shared liability. The Pool does not contract with any third party administrators for claims adjustment or loss prevention services.
During 2014-15, Skagit County was also one of twenty-six (26) counties which participated in the Washington Counties Property Program (WCPP). Property losses are covered under the WCPP to the participating counties’ buildings and contents, vehicles, mobile/contractor equipment, EDP and communication equipment, etc. that have been scheduled. The WCPP includes ‘All Other Perils (“AOP”)’ coverage limits of $500 million per occurrence as well as Flood and Earthquake (catastrophe) coverages with separate occurrence limits, each being $200 million. There are no AOP annual aggregate limits, but the flood and earthquake coverages include annual aggregate limits of $200 million each. Each participating county is solely responsible for paying their selected deductible, ranging between $5,000 and $50,000. Higher deductibles apply to losses resulting from catastrophe-type losses.
Skagit County also participates in the jointly purchased cyber risk and security coverage from a highly-rated commercial insurer.
The Pool is governed by a board of directors which is comprised of one designated representative from each participating member. The Board of Directors generally meets three-times each year with the Annual Meeting of the Pool being held in summer. The Board approves the extent of risk-sharing, approves the Pool’s self-insuring coverage documents, approves the selection of reinsurance and excess agreements, and approves the Pool’s annual operating budget.
An 11-member executive committee is elected by and from the WCRP Board for staggered, 3-year terms. Authority has been delegated to the Committee by the Board of Directors to, a) approve all disbursements and reviews the Pool’s financial health, b) approve case settlements exceeding the applicable member’s deductible by at least $50,000, c) review all claims with incurred loss estimates exceeding $100,000, and d) evaluate the Pool’s operations, program deliverables, and the Executive Director’s performance. Committee members are expected to participate in the Board’s standing committees (finance, personnel, risk management, and underwriting) which develop or review/revise proposals for and/or recommendations to the association’s policies and its coverages for the Board to consider and act upon
59

Skagit County, Washington Notes to the Financial Statements December 31, 2015 During 2014-15, the WCRP’s assets grew 3% to $48.8 million while its liabilities increased slightly to $29.8 million. The Pool’s net position decreased slightly from $19.4 million to $18.9 million. The Pool more than satisfies the State Risk Manager’s solvency requirements (WAC 200.100.03001). The Pool is a cooperative program with joint liability amongst its participating members.
Deficits of the Pool resulting from any fiscal year are financed by reassessments of the deficient year’s membership in proportion with the initially levied and collected deposit assessments. The Pool’s reassessments receivable balance as of December 31, 2015 was zero ($0). As such, there were no known contingent liabilities at that time for disclosure by the member counties.
The following schedule details the current year’s and the prior two year’s claims liability activity:
Current YearFiscal Beginning Claims & Changes Claim Year EndYear Balance in Estimate Payments Balance2015 609,600$ 187,385$ 12,041$ 784,945$ 2014 876,500 84,021 350,921 609,600 2013 2,770,881 (1,240,114) 654,267 876,500
Other Insurance
Employee on-the-job injuries are covered by industrial insurance through the State of Washington Department of Labor & Industries (L&I). All employees and some volunteers, except LEOFF-1 members and ferry crewmembers, are covered to statutory limits. Industrial insurance (L&I) rates are occupation and experienced based, with base premiums adjusted for individual entity claims experience. The experience modification multiplier was, .9945 in 2013, 1.1994 in 2014, and 1.1572 in 2015.
Skagit County is self-insured for unemployment claims. These claims are processed by the Washington State Department of Employment Security and the county is billed for them on a quarterly basis. The County has established an Unemployment Compensation Fund which charges other County funds based on estimates of future claims, and pays the claims when they are billed. The Unemployment Compensation Fund had Net Position of $505,650 at December 31, 2015.
The County is self-insured for dental insurance claims. Washington Dental Services serves as the third party administrator and bills the County for claims paid. Administrative fees and charges paid to Washington Dental Service totaled $77,941 for 2015. Dental claims activity for 2015 and the preceding two years are as follows:
Current YearFiscal Beginning Claims & Changes Claim Year EndYear Balance in Estimate Payments Balance2015 105,367$ 705,048$ 702,359$ 108,055$ 2014 101,567 688,682 684,882 105,367 2013 99,119 662,634 660,186 101,567
The County is self-insured for medical insurance coverage for eligible employees. The claims processing is administered by Trusteed Plans. The County’s health benefits broker, Wells Fargo, recommends the premiums charged to County funds. These amounts are transferred to the Insurance Services Fund, which pays the amount billed by the claims processor. An insurance policy is in place to cover claims in
60

Skagit County, Washington Notes to the Financial Statements December 31, 2015 excess of $175,000 per claimant. Administrative fees and charges paid to Trusteed Plans totaled $382,343 for 2015. Medical claims activity for 2015 and the preceding two years are as follows:
Current YearFiscal Beginning Claims & Changes Claim Year EndYear Balance in Estimate Payments Balance2015 1,415,833$ 11,943,160$ 11,577,794$ 1,781,199$ 2014 1,308,446 9,310,303 9,202,916 1,415,833 2013 1,123,379 8,689,969 8,504,902 1,308,446
VIII. COMMITMENTS, CONTINGENCIES AND LITIGATION
Amounts received or receivable from grantor agencies are subject to audit and adjustment. Any disallowed claims, including amounts already collected, may constitute a liability of the applicable fund. The amount, if any, of expenditures which may be disallowed by a grantor is expected to be immaterial. As discussed in Note V, the County is contingently liable for repayment of refunded debt.
Skagit County is named as the defendant in various lawsuits. Although the outcome of these legal actions is not presently determinable, the County is of the opinion that present reserves are available to adequately cover potential settlements without adversely affecting the financial condition of the County.
In January of 2013, the County entered into an Interlocal agreement contract number C20130043 with the Skagit Regional Public Facilities District whereby the County agreed to issue bonds to refund the PFD 2003 bond issue in order to take advantage of better rates. In February of 2013, the County issued $8.6 million GO Refunding bonds to refund both the County’s 2003 bond issue as well as the Public Facilities District’s 2003 bond issue. The PFD’s portion of the refunding bonds was $7,985,000. The balance of the PFD portion of the bond on December 31, 2015 was $6,565,000. The average interest rate received on the refinancing bonds, which pay principal and interest in 2013 through 2026, is 1.89%. The County will reduce the PFD’s dedicated sales and use tax to cover the debt service of the PFD’s portion of the refunded bonds. In the event that the PFD cannot cover the debt service for any given year, the County remains responsible for that debt, however; the debt is legally owed to the County by the PFD and secured by the Interlocal agreement. The County used the balance sheet method to account for the PFD debt service. Accordingly, the County reports a receivable in the debt service fund that will be systematically reduced as the funds are received and the bonds are paid.
Leasing Commitments
Future minimum rental payments required under operating leases that have initial or remaining non-cancelable lease terms in excess of one year as of December 31, 2015 are as follows:
Rental PaymentsYear Due2016 162,766 2017 42,486 Total 205,252
2015 rent expense for all operating leases, except those with terms of a month or less were all renewed.
61

Skagit County, Washington Notes to the Financial Statements December 31, 2015 Construction
At December 31, 2015, the County had pending construction project contracts in progress. The commitments related to the remaining contract balances are summarized as follows:
Total Expended to BalanceContracts 12/31/2015 Unexpended
Governmental ActivitiesClean Water Fund 2,301,130$ 889,454$ 1,411,676$ Non-Major Government Funds 2,171,216 965,340 1,205,876 Road Fund 18,835,901 7,825,371 11,010,530
Landfill Post Closure Costs
State and federal laws and regulations require Skagit County to perform landfill maintenance and monitoring activities for a minimum of twenty to thirty years after closure. Accordingly, a long-term liability for post closure costs in the amount of $2,911,425, of which $50,000 is the current portion, is reported in the Solid Waste Fund at December 31, 2015.
Post closure care cost estimates are based on the minimum number of years of maintenance and monitoring required by law multiplied by the current annual expense incurred. The actual future cost may be higher due to inflation, changes in technology, or changes in landfill laws and regulations.
Liabilities for Pollution Remediation Obligations
In accordance with Governmental Accounting Standards Board Statement No. 49, “Accounting and Financial Reporting for Pollution Remediation Obligations”, which became effective for the 2008 reporting year, liabilities for environmental cleanup obligations were recorded in the Solid Waste fund and the Equipment Rental and Revolving Fund.
Whitmarsh Landfill
The Solid Waste Fund recognized a liability of $3,415,962, of which $10,000 is the current portion, for the closed Whitmarsh Landfill site. In 2007, Skagit County received notice from the Department of Ecology that it was being named a Potentially Liable Party (PLP) under Washington’s Model Toxics Control Act (MTCA), as a former operator of the landfill, for releases of leachate from the landfill to the environment. Skagit County implemented a preliminary investigation of the site in 2008 and entered into an Agreed Order with the Department of Ecology along with 3 other named parties. As of December 31, 2015, the County is in Phase II Remedial Investigation stage. Work remaining is Phase II Remedial Investigation, Feasibility Study, and a Cleanup Action Plan.
Sinnes Road Landfill
The Solid Waste Fund recognized a liability of $521,696, of which $500 is the current portion for the closed Sinnes Road Landfill site. The Skagit County Health Department facilitated an Agreed Order between the County and two other parties to address the releases of leachate from the landfill to the environment. As of December 31, 2015, the County is in the remedial action stage, with long-term monitoring and maintenance to be determined.
62

Skagit County, Washington Notes to the Financial Statements December 31, 2015 Burlington Road Shop
The Equipment Rental and Revolving Fund recognized a liability of $113,533, of which $0 is the current portion for costs relating to the monitoring and potential cleanup of soil and water contamination at the site of underground fuel storage tanks. Petroleum-impacted soil and groundwater were initially discovered in 1992 during the removal of three underground fuel storage tanks. Subsequent soil and groundwater investigations were conducted in 1993 by the County. Subsequently, four underground fuel storage tanks were removed. Annual groundwater monitoring using the existing well network was voluntarily implemented in 2003 and has continued to the present. Long-term groundwater monitoring is planned to continue until groundwater conditions improve.
Alger Landfill
The Department of Ecology has ranked the closed Alger Landfill under the Model Toxics Control Act State Hazard Assessment program. It scored a “3” on a scale of 1 to 5, with 1 being the highest relative priority. As of December 31, 2015, no further action has been taken either by the Department of Ecology or the County.
Panorama Landfill
The Department of Ecology has ranked the closed Panorama Landfill under the Model Toxics Control Act State Hazard Assessment program. It scored a “5” on a scale of 1 to 5, with 1 being the highest relative priority. As of December 31, 2015, no further action has been taken either by the Department of Ecology or the County.
These liabilities were computed using the expected cash flow technique, with probabilities assigned to a range of potential costs. They are recorded net of possible insurance recoveries. The actual future costs may be higher due to inflation, changes in technology, changes in remedial plans, or changes in environmental laws and regulations.
IX. PRIOR PERIOD ADJUSTMENTS
Jail Fund – A prior period adjustment of $269,861 was the result of an accrual error made in 2014.
X. ACCOUNTING AND REPORTING CHANGES
The Government Accounting Standards Board (GASB), Statement No. 68, “Accounting and Financial Reporting for Pensions” became effective for financial statements for fiscal years beginning after June 15, 2014. This statement replaces the requirements of Statement No. 27, “Accounting for Pensions by State and Local Governmental Employers”, as well as Statement No. 50, “Pension Disclosures” as they relate to pensions that are provided through pension plans administered as trusts or equivalent arrangements. This statement establishes standards for measuring and recognizing liabilities, deferred outflows of resources, deferred inflows of resources, and expense/expenditures. As a result of implementing this new statement for the 2015 financial statements, the beginning net position for the Statement of Activities, as well as the Statement of Revenues, Expenses, and Changes in Fund Net Position Proprietary Funds have been adjusted as to the following:
63

Skagit County, Washington Notes to the Financial Statements December 31, 2015
Accounting Change Adjustment
Statement of Activities Fund 401 Fund 402 Fund 403
Beginning Net Position $ 350,302,998 $ (3,376,400) $ 8,197,769 $ 6,621,172 Adjustment for Accounting Change (26,201,349) (964,332) (414,524) (1,582,442) Restate Beginning Net Position $ 324,101,649 $ (4,340,732) $ 7,783,245 $ 5,038,730
For practical reasons, the County chose not to restate prior years’ financial statements.
64

THIS PAGE INTENTIONALLY LEFT BLANK
65

Required Supplementary Information
66

SKAGIT COUNTY, WASHINGTONSchedule of Revenues, Expenditures and Changes in Fund Balances - Budget to Actual
General FundFor the Year Ended December 31, 2015
Original Final Actual VarianceBudgeted Fund Balance, January 1 4,377,173$ 4,610,875$ 13,822,646$
Resources (in-flows)Taxes 33,052,527 33,052,527 33,424,312 371,785 Licenses and Permits 332,000 332,000 285,856 (46,144) Intergovernmental Revenue 5,569,353 5,854,167 7,776,034 1,921,867 Charges for Services 3,823,630 3,881,618 4,135,939 254,321 Fines and Forfeits 1,712,000 1,712,000 2,083,276 371,276 Interest Revenue 1,792,500 1,792,500 1,484,320 (308,180) Miscellaneous Revenues 98,470 98,470 139,591 41,121 Transfers In 130,783 215,839 212,901 (2,938) Total Resources (in-flows) 46,511,263 46,939,121 49,542,229 2,603,108
Amounts Available for Appropriation 50,888,436 51,549,996 63,364,875
Charges to Appropriations (out-flows)General Government 19,345,154 19,542,614 17,360,413 (2,182,201) Judicial 8,661,022 8,935,300 8,713,544 (221,756) Public Safety 17,177,763 17,303,776 17,039,605 (264,171) Physical Environment 40,768 40,768 19,817 (20,951) Economic Environment 354,866 364,609 362,798 (1,811) Health and Human Services 296,172 296,172 295,928 (244) Culture and Recreation 446,000 446,000 446,000 - Capital Expenditures 20,000 20,000 - (20,000) Transfers Out 4,546,691 4,600,757 4,550,757 (50,000) Amount Charged to Appropriations (out-flows) 50,888,436 51,549,996 48,788,862 (2,761,134)
Budgeted Fund Balance, December 31 -$ -$ 14,576,013$
Budgeted Amounts
67

Original Budget
Final Budget Actual
Variance with Final Budget
General Property Taxes 24,563,527 24,563,527 24,223,058 (340,469) Timber Harvest Taxes - - - Retail Sales and Use Taxes 7,939,000 7,939,000 8,575,834 636,834 Business Taxes - - Excise Taxes 550,000 550,000 625,420 75,420 Penalties and Interest on Delinquent Taxes - - - - Total Taxes 33,052,527 33,052,527 33,424,312 371,785
Non-Business Licenses and Permits 332,000 332,000 285,856 (46,144) Total Licenses and Permits 332,000 332,000 285,856 (46,144)
Federal Shared Revenue 10,779 10,779 11,714 935 Indirect Federal Grants 818,305 818,305 1,774,826 956,521 State Grants 1,185,278 1,413,984 1,399,349 (14,635) State Shared Revenue 731,900 731,900 1,383,074 651,174 In Lieu and State Entitlement Revenue 1,489,728 1,509,887 1,793,370 283,483 Intergovernmental Revenue 1,333,363 1,369,312 1,413,700 44,388 Total Intergovernmental Revenue 5,569,353 5,854,167 7,776,033 1,921,866
General Government 2,037,130 2,037,130 2,245,019 207,889 Public Safety 264,500 322,488 304,161 (18,327) Health and Human Services 47,500 47,500 53,488 5,988 Economic Environment 13,000 13,000 13,710 710 Culture and Recreation - - - - Interfund Charges for Services 1,461,500 1,461,500 1,519,562 58,062 Total Charges for Goods and Services 3,823,630 3,881,618 4,135,940 254,322
Superior Court Felony/Misdemeanor Penalties 82,000 82,000 75,549 (6,451) Civil Penalties 12,000 12,000 8,737 (3,263) Civil Infraction Penalties 1,314,500 1,314,500 1,278,552 (35,948) Civil Parking Infraction 6,000 6,000 1,742 (4,258) Criminal Traffic Misdemeanor 207,000 207,000 182,771 (24,229) Criminal Non-Traffic Fines 38,200 38,200 34,061 (4,139) Criminal Costs 12,300 12,300 5,262 (7,038) Non-Court Fines, Forfeitures 40,000 40,000 496,603 456,603 Total Fines and Forfeits 1,712,000 1,712,000 2,083,277 371,277
Interest Earnings 1,792,500 1,792,500 1,484,320 (308,180) Rents, Leases, Concessions 19,004 19,004 23,255 4,251 Interfund/Interdepartment Miscellaneous - - - - Contributions/Donations 44,266 44,266 44,224 (42) Other Miscellaneous Revenue 32,700 32,700 70,037 37,337 Total Miscellaneous Revenues 1,888,470 1,888,470 1,621,836 (266,634)
Agency Type Deposits 2,500 2,500 2,075 (425) Total Non-Revenues 2,500 2,500 2,075 (425)
Total Revenues 46,380,480 46,723,282 49,329,328 2,606,047
Budgeted Amounts
SKAGIT COUNTY, WASHINGTONGeneral Fund
Schedule of RevenuesBudget (GAAP Basis) and Actual
For the Year Ended December 31, 2015
68

SKAGIT COUNTY, WASHINGTONSchedule of Expenditures Budget (GAAP Basis) and Actual
For the Year Ending December 31, 2015
Original Budget Final Budget Actual
Variance with Final Budget
General GovernmentAssessor
Salaries and Wages 1,113,080 1,113,080 1,046,400 (66,680) Personnel Benefits 596,575 596,575 563,475 (33,100) Supplies 9,000 9,000 6,851 (2,149) Other Services and Charges 31,500 31,500 30,827 (673) Interfund Payments for Services 17,556 17,556 13,380 (4,176)
Total Assessor 1,767,711 1,767,711 1,660,933 (106,778)
Auditor - Salaries and Wages 795,532 806,077 807,204 1,127 Personnel Benefits 396,847 401,347 395,925 (5,422) Supplies 14,200 13,200 8,806 (4,394) Other Services and Charges 15,450 18,348 13,809 (4,539)
Total Auditor 1,222,029 1,238,972 1,225,744 (13,228)
Board of Equalization - Salaries and Wages 48,884 49,192 33,819 (15,373) Personnel Benefits 17,387 17,602 14,862 (2,740) Supplies 100 100 79 (21) Other Services and Charges 800 1,580 1,532 (48)
Total Board of Equalization 67,171 68,474 50,292 (18,182)
Commissioners - Salaries and Wages 399,041 409,541 404,584 (4,957) Personnel Benefits 156,177 157,477 158,934 1,457 Supplies 1,750 1,750 2,156 406 Other Services and Charges 33,990 28,990 29,312 322
Total Commissioners 590,958 597,758 594,986 (2,772)
Administrative Services - Salaries and Wages 540,808 545,808 542,111 (3,697) Personnel Benefits 228,487 228,487 221,927 (6,560) Supplies 7,000 7,000 4,353 (2,647) Other Services and Charges 213,175 208,175 185,878 (22,297)
Total Administrative Services 989,470 989,470 954,269 (35,201)
General Maintenance - Salaries and Wages 596,328 596,328 557,822 (38,506) Personnel Benefits 337,703 337,703 338,981 1,278 Supplies 144,000 144,000 136,235 (7,765) Other Services and Charges 793,928 793,928 698,861 (95,067) Interfund Payments for Services 49,358 49,358 27,561 (21,797)
Total General Maintenance 1,921,317 1,921,317 1,759,460 (161,857)
Budgeted Amounts
69

SKAGIT COUNTY, WASHINGTONSchedule of Expenditures Budget (GAAP Basis) and Actual
For the Year Ending December 31, 2015
Prosecuting Attorney - Salaries and Wages 2,548,250 2,565,070 2,538,348 (26,722) Personnel Benefits 1,162,131 1,171,533 1,145,998 (25,535) Supplies 37,750 37,750 21,460 (16,290) Other Services and Charges 365,525 339,303 135,889 (203,414)
Total Prosecuting Attorney 4,113,656 4,113,656 3,841,695 (271,961)
Treasurer - Salaries and Wages 593,756 593,756 558,414 (35,342) Personnel Benefits 292,736 292,736 282,351 (10,385) Supplies 17,000 17,000 6,106 (10,894) Other Services and Charges 118,000 118,000 110,788 (7,212)
Total Treasurer 1,021,492 1,021,492 957,659 (63,833)
Non Departmental Expenditures - Salaries and Wages - - - - Personnel Benefits 149,314 149,314 149,144 (170) Supplies 165 165 Other Services and Charges 854,659 1,067,159 734,210 (332,949) Interfund Payments for Services 6,647,377 6,607,291 5,431,856 (1,175,435)
Total Non Departmental Expenditures 7,651,350 7,823,764 6,315,375 (1,508,389)
Total General Government 19,345,154$ 19,542,614$ 17,360,413$ (2,182,201)$
JudicialCounty Clerk -
Salaries and Wages 939,418 939,418 927,997 (11,421) Personnel Benefits 523,140 523,140 509,836 (13,304) Supplies 24,000 27,000 26,153 (847) Other Services and Charges 12,200 26,100 24,351 (1,749)
Total County Clerk 1,498,758 1,515,658 1,488,337 (27,321)
District Court - Salaries and Wages 1,349,762 1,356,120 1,361,394 5,274 Personnel Benefits 643,190 647,616 635,848 (11,768) Supplies 18,000 18,000 15,976 (2,024) Other Services and Charges 56,175 56,175 59,299 3,124 Interfund Payments for Services - - - -
Total District Court 2,067,127 2,077,911 2,072,517 (5,394)
Public Defender - Salaries and Wages 1,591,662 1,641,806 1,642,786 980 Personnel Benefits 727,683 740,813 735,727 (5,086) Supplies 11,610 11,610 11,662 52 Other Services and Charges 316,757 339,335 288,108 (51,227)
Total Public Defender 2,647,712 2,733,564 2,678,283 (55,281)
Superior Courts - Salaries and Wages 1,028,264 1,073,442 1,061,837 (11,605) Personnel Benefits 338,452 357,216 341,546 (15,670) Supplies 21,870 21,870 16,210 (5,660) Other Services and Charges 334,215 431,015 422,137 (8,878)
Total Superior Courts 1,722,801 1,883,543 1,841,730 (41,813)
70

SKAGIT COUNTY, WASHINGTONSchedule of Expenditures Budget (GAAP Basis) and Actual
For the Year Ending December 31, 2015
Assigned Counsel - Salaries and Wages 136,937 136,937 138,697 1,760 Personnel Benefits 79,587 79,587 76,937 (2,650) Supplies 1,100 1,100 869 (231) Other Services and Charges 430,000 430,000 342,074 (87,926)
Total Assigned Counsel 647,624 647,624 558,577 (89,047)
Mediation Services - Other Services and Charges 77,000 77,000 74,100 (2,900)
Total Mediation Services 77,000 77,000 74,100 (2,900)
Total Judicial 8,661,022$ 8,935,300$ 8,713,544$ (221,756)$
Public SafetyDistrict Court Probation -
Salaries and Wages 340,208 345,208 344,337 (871) Personnel Benefits 166,158 166,158 164,511 (1,647) Supplies 3,000 3,000 2,146 (854) Other Services and Charges 4,250 4,250 2,476 (1,774)
Total District Court Probation 513,616 518,616 513,470 (5,146)
Non-Departmental - County Jail CostsInterfund Payments for Services 5,500,000 5,500,000 5,500,000 -
Total Non-Departmental - County Jail Costs 5,500,000 5,500,000 5,500,000 -
Office of Juvenile Court - Salaries and Wages 1,823,774 1,840,485 1,802,611 (37,874) Personnel Benefits 937,192 950,495 926,026 (24,469) Supplies 24,850 24,850 19,008 (5,842) Other Services and Charges 76,284 81,284 51,107 (30,177) Interfund Payments for Services 1,272 1,272 1,190 (82)
Total Office of Juvenile Court 2,863,372 2,898,386 2,799,942 (98,444)
Civil Service Commission - Salaries and Wages 25,910 25,910 14,058 (11,852) Personnel Benefits 5,153 5,153 3,945 (1,208) Supplies 200 200 - (200) Other Services and Charges 1,180 1,180 797 (383)
Total Civil Service Commission 32,443 32,443 18,800 (13,643)
Sheriff - Salaries and Wages 4,831,066 4,881,365 4,826,929 (54,436) Personnel Benefits 2,176,867 2,184,556 2,008,607 (175,949) Supplies 93,175 93,175 97,306 4,131 Other Services and Charges 209,200 237,211 446,794 209,583 Interfund Payments for Services 958,024 958,024 827,757 (130,267)
Total Sheriff 8,268,332 8,354,331 8,207,393 (146,938)
Total Public Safety 17,177,763$ 17,303,776$ 17,039,605$ (264,171)$
71

SKAGIT COUNTY, WASHINGTONSchedule of Expenditures Budget (GAAP Basis) and Actual
For the Year Ending December 31, 2015
Physical EnvironmentSustainability -
Salaries and Wages 22,747 22,747 12,566 (10,181) Personnel Benefits 12,351 12,351 5,625 (6,726) Supplies 500 500 - (500) Other Services and Charges 3,700 3,700 1,110 (2,590) Interfund Payments for Services 1,470 1,470 516 (954)
Total Sustainability 40,768 40,768 19,817 (20,951)
Total Physical Environment 40,768$ 40,768$ 19,817$ (20,951)$
Economic EnvironmentBoundary Review Board -
Salaries and Wages 2,688 2,796 2,797 1 Personnel Benefits 1,410 1,431 1,425 (6) Supplies - - - - Other Services and Charges 10,000 10,000 9,867 (133)
Total Boundary Review Board 14,098 14,227 14,089 (138)
Hearing Examiner - Salaries and Wages 24,196 25,176 25,172 (4) Personnel Benefits 12,679 12,873 12,826 (47) Supplies 100 100 81 (19) Other Services and Charges 65,000 65,000 61,838 (3,162)
Total Hearing Examiner 101,975 103,149 99,917 (3,232)
Animal Control - Salaries and Wages 51,210 51,210 51,380 170 Personnel Benefits 29,073 29,073 30,395 1,322 Supplies 3,000 3,000 987 (2,013) Other Services and Charges 26,500 26,500 34,068 7,568 Interfund Payments for Service 6,528 6,528 5,220 (1,308)
Total Animal Control 116,311 116,311 122,050 5,739
Noxious Weed Control - Salaries and Wages 68,460 74,460 70,400 (4,060) Personnel Benefits 35,404 35,404 34,335 (1,069) Supplies 5,300 5,300 4,022 (1,278) Other Services and Charges 2,775 2,775 3,466 691 Interfund Payments for Service 7,944 7,944 10,793 2,849
Total Noxious Weed Control 119,883 125,883 123,016 (2,867)
AG Advisory Board - Salaries and Wages 1,689 3,689 2,455 (1,234) Personnel Benefits 860 1,250 1,217 (33) Other Services and Charges 50 100 54 (46)
Total AG Advisory Board 2,599 5,039 3,726 (1,313)
Total Economic Environment 354,866$ 364,609$ 362,798$ (1,811)$
72

Original Budget Final Budget Actual
Variance with Final Budget
Health and Human ServicesCoroner -
Salaries and Wages 106,226 106,226 106,746 520 Personnel Benefits 46,740 46,740 41,792 (4,948) Supplies 4,000 4,000 5,659 1,659 Other Services and Charges 125,262 125,262 130,571 5,309 Interfund Payment for Services 13,944 13,944 11,160 (2,784)
Total Coroner Extension 296,172 296,172 295,928 (244)
Total Health and Human Services 296,172$ 296,172$ 295,928$ (244)$
Culture and RecreationCooperative Extension -
Salaries and Wages - - - Personnel Benefits - - - Supplies - - - Other Services and Charges 296,000 296,000 296,000 -
Total Cooperative Extension 296,000 296,000 296,000 -
Historical Museum - Salaries and Wages - - - - Personnel Benefits - - - - Supplies - - - - Other Services and Charges 150,000 150,000 150,000 -
Total Historical Museum 150,000 150,000 150,000 -
Total Culture and Recreation 446,000$ 446,000$ 446,000$ -$
Capital Outlay
Capital Outlay - Capital Outlay 35,000 35,000 - (35,000)
TotalCapital Outlay 35,000 35,000 - (35,000)
TOTAL EXPENDITURES 46,356,745$ 46,964,239$ 44,238,105$ (2,726,134)$
SKAGIT COUNTY, WASHINGTONSchedule of Expenditures Budget (GAAP Basis) and Actual
General FundFor the Year Ended December 31, 2015
Budgeted Amounts
73

SKAGIT COUNTY, WASHINGTONSchedule of Revenues, Expenditures and Changes in Fund Balances - Budget to Actual
Mental Health FundFor the Year Ended December 31, 2015
Original Final Actual VarianceBudgeted Fund Balance, January 1 534,877$ 664,164$ 5,809,716$
Resources (in-flows)General Property Taxes 319,756 319,756 325,563 5,807 Timber Harvest Taxes 6,176 6,176 8,137 1,961 Excise Taxes 2,463,988 2,463,988 2,660,622 196,634 Licenses and Permits - Intergovernmental Revenues 305,091 290,091 2,263,850 1,973,759 Charges for Services 1,669,513 1,669,513 - (1,669,513) Interest Earnings 5,542 5,542 8,103 2,561 Other Revenue 74 74 16 (58) Total Resources (in-flows) 4,770,140 4,755,140 5,266,291 511,151
Amounts Available for Appropriation 5,305,017 5,419,304 11,076,007
Charges to Appropriations (out-flows)Health and Human Services 5,145,067 5,143,354 3,932,692 (1,210,662) Transfers Out 159,950 275,950 220,901 (55,049) Amount Charged to Appropriations (out-flows) 5,305,017 5,419,304 4,153,593 (1,265,711)
Budgeted Fund Balance, December 31 -$ -$ 6,922,415$
Budgeted Amounts
74

SKAGIT COUNTY, WASHINGTONSchedule of Revenues, Expenditures and Changes in Fund Balances - Budget to Actual
County Road FundFor the Year Ended December 31, 2015
Original Final Actual VarianceBudgeted Fund Balance, January 1 (1,196,504)$ (1,162,004)$ 2,138,937$
Resources (in-flows)General Property Taxes 12,286,460 12,286,460 11,614,011 (672,449) Timber Harvest Taxes 300,000 300,000 - (300,000) Excise Taxes 50,000 50,000 465,393 415,393 Licenses and Permits 79,000 79,000 73,161 (5,839) Intergovernmental Revenues 9,721,161 9,721,161 6,224,586 (3,496,575) Charges for Services 2,549,248 2,549,248 1,584,603 (964,645) Interest Earnings 3,100 3,100 772 (2,328) Other Revenue 286,500 286,500 302,738 16,238 Total Resources (in-flows) 25,275,469 25,275,469 20,265,264 (5,010,205)
Amounts Available for Appropriation 24,078,965 24,113,465 22,404,201
Charges to Appropriations (out-flows)General Government 91,675 91,675 109,047 17,372 Transportation 19,955,676 19,955,676 17,301,348 (2,654,328) Capital Expenditures 4,031,614 4,031,614 690,277 (3,341,337) Transfers Out - 34,500 34,500 - Amount Charged to Appropriations (out-flows) 24,078,965 24,113,465 18,135,172 (5,978,293)
Budgeted Fund Balance, December 31 -$ -$ 4,269,029$
Budgeted Amounts
75

The annual budget for Skagit County is adopted in accordance with the provisions of the Revised Code ofWashington (RCW), as interpreted by the Budget, Accounting, and Reporting System (BARS) of the State of Washington, and on a basis consistent with generally accepted accounting principles. Allgovernment funds with the exception of the Treasurer's O&M fund, as per RCW 84.56.020(9), have legally adopted budgets.
The annual appropriated budget is adopted at the department level withinthe General Fund, and For managementThe annual appropriated budget is adopted at the department level within the General Fund, and at the fund level for government funds. appropriations at the department level and the budgets constitute the legal authority for expenditures atpurposes, expenditures are further segregated by object class of expenditure. Object class refers to asegmentation of expenditures into five categories. These categories are salaries and wages, personnelbenefits, supplies, other services and charges, and capital expenditures. Expenditures may not exceedappropriations at the department level and the budgets constitute the legal authority for expenditures atthat level. All appropriateions lapse thirty days after the close of each year.
Budget status reports are used to compare the budgeted amounts with actual revenues and expenditures. Revenues and expenditures can be monitored at fund, department, division, activity, orobject class level.
Skagit County adheres to the statutory provisions established by the Revised Code of Washington (RCW)36.40. Significant procedures in the budget process include the following:
On or before the second Monday in July, County officials are requested to prepare estimates ofrevenues and expenditures for the next fiscal year.
On or before the third Friday in August, each County official submits detailed estimates ofprobable revenues and expenditures for the ensuing year.
On or before the first Tuesday in September, the preliminary annual budget is submitted to the Board of County Commissioners.
The Commissioners conduct public meetings on the proposed budget from September throughOctober.
The Commissioners hold a public hearing on or before the first Monday in December to receivetestimony on the budget.
The Commissioners make adjustments to the proposed budget and adopt, by resolution, a finalbalanced budget no later than December 31.
Upon Adoption, the final budget is made available to the public.
Budget revisions in the form of supplemental appropriation resolutions are approved by the Board of CountyCommissioners in the legally prescribed manner during public meetings throughout the year. Any proposedrevisions which alter the total appropriation of any fund are published in the County's legal newspaperonce per week for two consecutive weeks before the public hearing to enable taxpayer input.
Changes to the appropriation for object classes that do not alter the total budget for any fund may be made by resolution approved by a simple majority during any public meeting.
Notes to Required Supplementary InformationSKAGIT COUNTY, WASHINGTON
76

2015 2016 2017 2018 2019 2020 2021 2022 2023 2024Employer's proportion of the net pension liabiltiy (asset) 0.300733%
Employer's proportionate share of the net pension liability 15,731,133$
Total 15,731,133 - - - - - - - - -
Employer's covered employee payroll 797,955$
Employer's porportionate share of the net pension liability as a percentage of covered employee payroll 1971.4307%
Plan fiduciary net position as a percentage of the total pension liability 59.10%
2015 2016 2017 2018 2019 2020 2021 2022 2023 2024Employer's proportion of the net pension liabiltiy (asset) 0.342725%
Employer's proportionate share of the net pension liability 12,245,760$
Total 12,245,760 - - - - - - - - -
Employer's covered employee payroll 30,413,995$
Employer's porportionate share of the net pension liability as a percentage of covered employee payroll 40.263568%
Plan fiduciary net position as a percentage of the total pension liability 89.20%
As of June 30, 2015
Required Supplementary InformationSchedule of Proportionate Share of the Net Pension Liability
PERS Plan 1As of June 30, 2015
PERS Plan 2/3
77

2015 2016 2017 2018 2019 2020 2021 2022 2023 2024Employer's proportion of the net pension liabiltiy (asset) 0.773485%
Employer's proportionate share of the net pension liability 141,176$
Total 141,176 - - - - - - - - -
Employer's covered employee payroll 2,264,702$
Employer's porportionate share of the net pension liability as a percentage of covered employee payroll 6.2337762%
Plan fiduciary net position as a percentage of the total pension liability 95.08%
2015 2016 2017 2018 2019 2020 2021 2022 2023 2024Employer's proportion of the net pension liabiltiy 0.024877%
Employer's proportionate share of the net pension liability (asset) (299,823)$
Total (299,823) - - - - - - - - -
Employer's covered employee payroll -$
Employer's porportionate share of the net pension liability as a percentage of covered employee payroll -
Plan fiduciary net position as a percentage of the total pension liability 127.36%
LEOFF 1As of June 30, 2015
Required Supplementary InformationSchedule of Proportionate Share of the Net Pension Liability
PSERS 2As of June 30, 2015
78

2015 2016 2017 2018 2019 2020 2021 2022 2023 2024Employer's proportion of the net pension liabiltiy (asset) 0.1464060%
State's proportionate share of the net pension liability (asset) associated with the employer 39.80258%
Employer's proportionate share of the net pension liability (1,504,761)$
Total (1,504,760) - - - - - - - - -
Employer's covered employee payroll 4,249,285$
Employer's porportionate share of the net pension liability as a percentage of covered employee payroll -35.412099%
Plan fiduciary net position as a percentage of the total pension liability 111.67%
Required Supplementary InformationSchedule of Proportionate Share of the Net Pension Liability
LEOFF 2As of June 30, 2015
79

2015 2016 2017 2018 2019 2020 2021 2022 2023 2024
Contractually required contributions 1,382,161 Contributions in relation to the contractually required contributions 1,382,161
Contribution deficiency (excess) -
Covered Employer Payroll 797,955$ Contributions as a percentage of covered employee payroll 173.2129%
* Until a full 10-year trend is compiled, only those years for which the information is available is presented.
2015 2016 2017 2018 2019 2020 2021 2022 2023 2024
Contractually required contributions 1,526,676 Contributions in relation to the contractually required contributions 1,526,676
Contribution deficiency (excess) 0
Covered Employer Payroll 30,413,995$ Contributions as a percentage of covered employee payroll 5.0196497%
* Until a full 10-year trend is compiled, only those years for which the information is available is presented.
PERS Plan 2/3As of June 30, 2015
Last 10 Fiscal Years*
Required Supplementary InformationSchedule of Employer Contributions
PERS Plan 1As of June 30, 2015
Last 10 Fiscal Years*
80
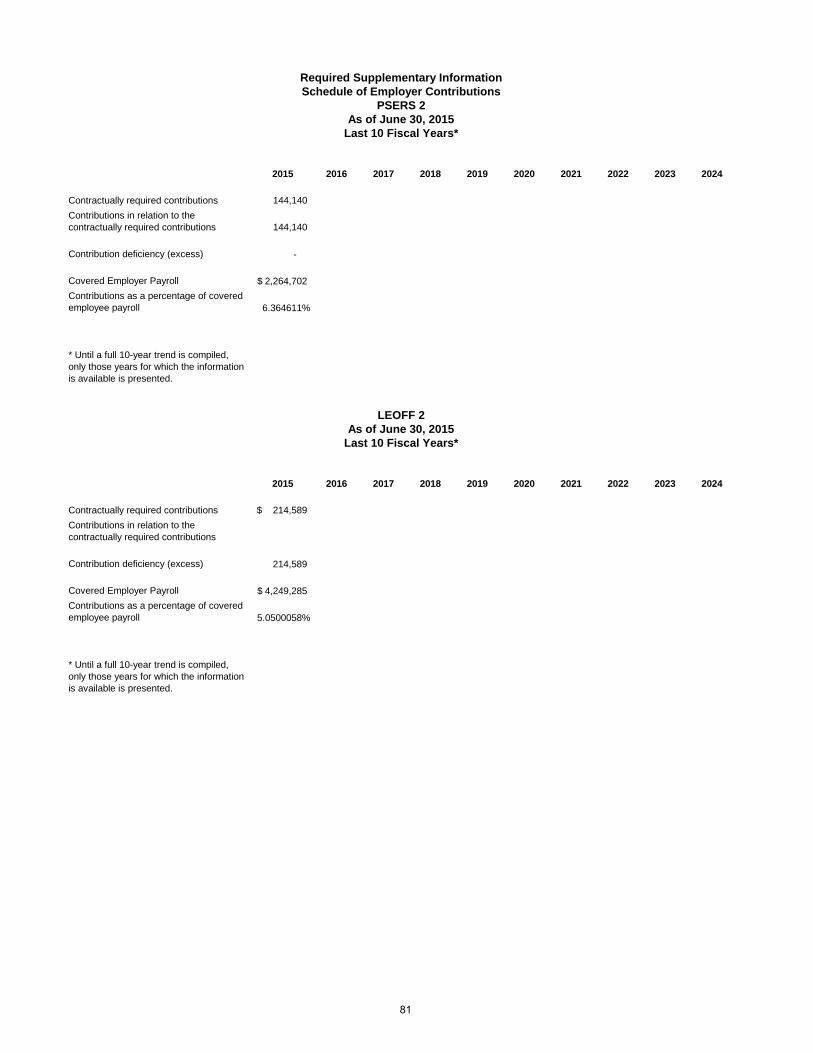
2015 2016 2017 2018 2019 2020 2021 2022 2023 2024
Contractually required contributions 144,140 Contributions in relation to the contractually required contributions 144,140
Contribution deficiency (excess) -
Covered Employer Payroll 2,264,702$ Contributions as a percentage of covered employee payroll 6.364611%
* Until a full 10-year trend is compiled, only those years for which the information is available is presented.
2015 2016 2017 2018 2019 2020 2021 2022 2023 2024
Contractually required contributions $ 214,589 Contributions in relation to the contractually required contributions
Contribution deficiency (excess) 214,589
Covered Employer Payroll 4,249,285$ Contributions as a percentage of covered employee payroll 5.0500058%
* Until a full 10-year trend is compiled, only those years for which the information is available is presented.
LEOFF 2As of June 30, 2015
Last 10 Fiscal Years*
Required Supplementary InformationSchedule of Employer Contributions
PSERS 2As of June 30, 2015
Last 10 Fiscal Years*
81
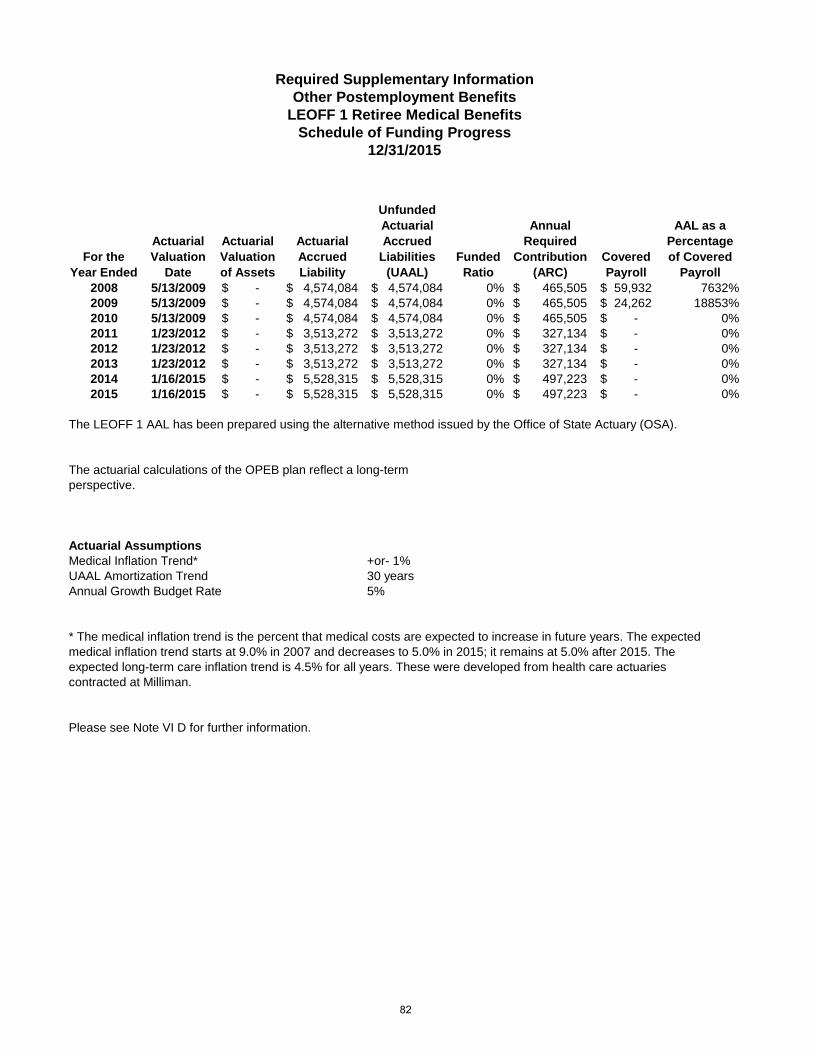
For the Year Ended
Actuarial Valuation
Date
Actuarial Valuation of Assets
Actuarial Accrued Liability
Unfunded Actuarial Accrued
Liabilities (UAAL)
Funded Ratio
Annual Required
Contribution (ARC)
Covered Payroll
AAL as a Percentage of Covered
Payroll2008 5/13/2009 -$ 4,574,084$ 4,574,084$ 0% 465,505$ 59,932$ 7632%2009 5/13/2009 -$ 4,574,084$ 4,574,084$ 0% 465,505$ 24,262$ 18853%2010 5/13/2009 -$ 4,574,084$ 4,574,084$ 0% 465,505$ -$ 0%2011 1/23/2012 -$ 3,513,272$ 3,513,272$ 0% 327,134$ -$ 0%2012 1/23/2012 -$ 3,513,272$ 3,513,272$ 0% 327,134$ -$ 0%2013 1/23/2012 -$ 3,513,272$ 3,513,272$ 0% 327,134$ -$ 0%2014 1/16/2015 -$ 5,528,315$ 5,528,315$ 0% 497,223$ -$ 0%2015 1/16/2015 -$ 5,528,315$ 5,528,315$ 0% 497,223$ -$ 0%
The LEOFF 1 AAL has been prepared using the alternative method issued by the Office of State Actuary (OSA).
The actuarial calculations of the OPEB plan reflect a long-termperspective.
Actuarial AssumptionsMedical Inflation Trend* +or- 1%UAAL Amortization Trend 30 yearsAnnual Growth Budget Rate 5%
* The medical inflation trend is the percent that medical costs are expected to increase in future years. The expected medical inflation trend starts at 9.0% in 2007 and decreases to 5.0% in 2015; it remains at 5.0% after 2015. The expected long-term care inflation trend is 4.5% for all years. These were developed from health care actuaries contracted at Milliman.
Please see Note VI D for further information.
Required Supplementary InformationOther Postemployment Benefits
LEOFF 1 Retiree Medical BenefitsSchedule of Funding Progress
12/31/2015
82

THIS PAGE INTENTIONALLY LEFT BLANK
83

Individual and Combining Statements and Schedules
84

SKAGIT COUNTY, WASHINGTONCOMBINING BALANCE SHEET
NONMAJOR GOVERNMENTAL FUNDSAS OF DECEMBER 31, 2015
Special Debt CapitalASSETS and OUTFLOWS of RESOURCES Revenue Service Project TotalCash/Cash Equivalents 12,796,398$ 302,762$ 6,930,343$ 20,029,503$ Investments 5,469,912 1,083,184 5,368,123 11,921,219 Taxes Receivable 228,705 20 - 228,725 Accounts Receivable 15,519 - - 15,519 Due From Other Funds - - - Due From Other Governmental Units 1,894,857 - 419,828 2,314,683 Interfund Loan Receivable 1,000 - - 1,000 Inventory/Prepayments 6,232 - - 6,232 Total Assets 20,412,622 1,385,965 12,718,294 34,516,880
Deferred Outflows of Resources
Total Assets and Deferred Outflows of Resources 20,412,622 1,385,965 12,718,294 34,516,880
LIABILITIES, DEFERRED INFLOWS of RESOURCES and FUND BALANCESLiabilitiesAccounts/Vouchers Payable 1,129,320 - 494,527$ 1,623,845 Due To Other Funds 386,724 - - 386,724 Due To Other Governmental Units 445,371 - - 445,371 Accrued Wages Payable 285,127 - - 285,127 Accrued Employee Benefits 65,432 - - 65,432 Custodial Accounts 32,746 - - 32,746 Deferred Revenue 208,823 - - 208,823 Long-Term Interfund Loans Payable - 1,000 - 1,000 Total Liabilities 2,553,543 1,000 494,527 3,049,069
Deferred Inflows of Resources 236,705 20 236,725
Fund BalanceNonspendable 7,232 - 7,232 Restricted 10,367,588 1,384,945 12,223,767 23,976,302 Committed 7,247,553 - 7,247,553 Assigned - - - Unassigned - - - - Total Fund Balances 17,622,374 1,384,945 12,223,767 31,231,086
Total Liabilities, Deferred Inflows of Resources and Fund Balances 20,412,622$ 1,385,965$ 12,718,294$ 34,516,880$
Non Major Funds
85
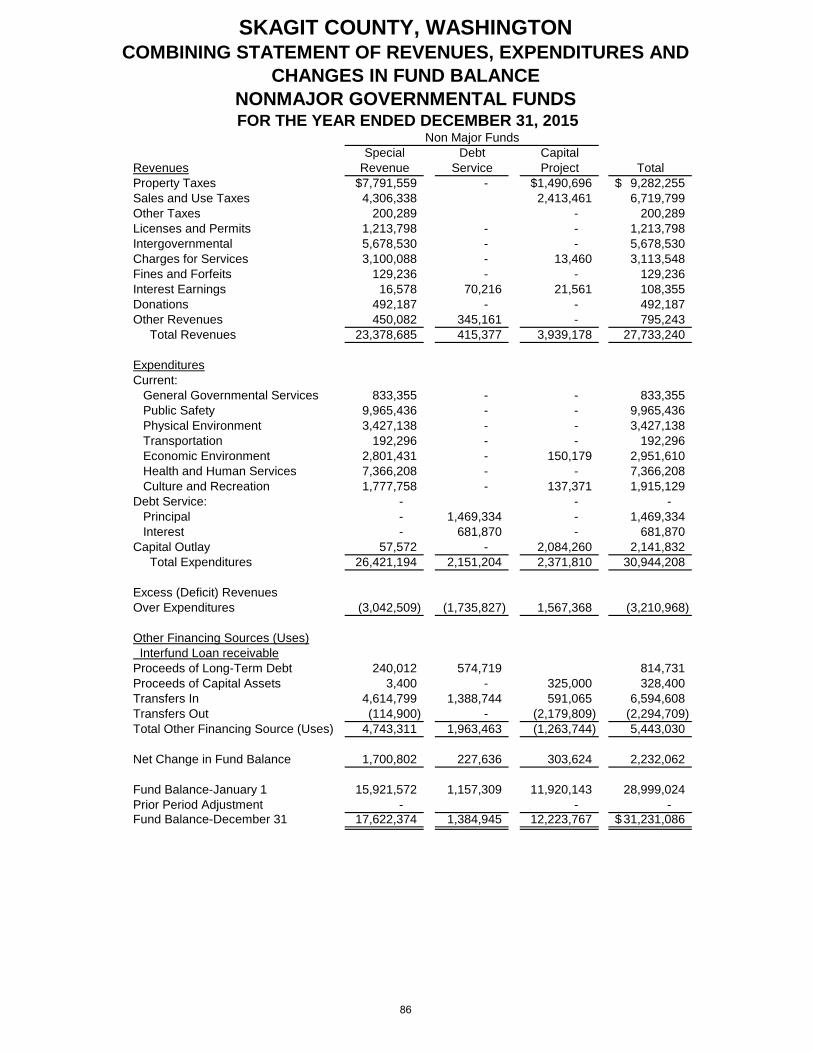
SKAGIT COUNTY, WASHINGTONCOMBINING STATEMENT OF REVENUES, EXPENDITURES AND
CHANGES IN FUND BALANCENONMAJOR GOVERNMENTAL FUNDS FOR THE YEAR ENDED DECEMBER 31, 2015
Special Debt CapitalRevenues Revenue Service Project TotalProperty Taxes $7,791,559 - $1,490,696 9,282,255$ Sales and Use Taxes 4,306,338 2,413,461 6,719,799 Other Taxes 200,289 - 200,289 Licenses and Permits 1,213,798 - - 1,213,798 Intergovernmental 5,678,530 - - 5,678,530 Charges for Services 3,100,088 - 13,460 3,113,548 Fines and Forfeits 129,236 - - 129,236 Interest Earnings 16,578 70,216 21,561 108,355 Donations 492,187 - - 492,187 Other Revenues 450,082 345,161 - 795,243 Total Revenues 23,378,685 415,377 3,939,178 27,733,240
ExpendituresCurrent: General Governmental Services 833,355 - - 833,355 Public Safety 9,965,436 - - 9,965,436 Physical Environment 3,427,138 - - 3,427,138 Transportation 192,296 - - 192,296 Economic Environment 2,801,431 - 150,179 2,951,610 Health and Human Services 7,366,208 - - 7,366,208 Culture and Recreation 1,777,758 - 137,371 1,915,129 Debt Service: - - - Principal - 1,469,334 - 1,469,334 Interest - 681,870 - 681,870 Capital Outlay 57,572 - 2,084,260 2,141,832 Total Expenditures 26,421,194 2,151,204 2,371,810 30,944,208
Excess (Deficit) RevenuesOver Expenditures (3,042,509) (1,735,827) 1,567,368 (3,210,968)
Other Financing Sources (Uses) Interfund Loan receivableProceeds of Long-Term Debt 240,012 574,719 814,731 Proceeds of Capital Assets 3,400 - 325,000 328,400 Transfers In 4,614,799 1,388,744 591,065 6,594,608 Transfers Out (114,900) - (2,179,809) (2,294,709) Total Other Financing Source (Uses) 4,743,311 1,963,463 (1,263,744) 5,443,030
Net Change in Fund Balance 1,700,802 227,636 303,624 2,232,062
Fund Balance-January 1 15,921,572 1,157,309 11,920,143 28,999,024 Prior Period Adjustment - - - Fund Balance-December 31 17,622,374 1,384,945 12,223,767 31,231,086$
Non Major Funds
86

SKAGIT COUNTY, WASHINGTONNONMAJOR SPECIAL REVENUE FUNDS
AS OF DECEMBER 31, 2015
Special Revenue Funds are utilized to account for the proceeds from specific revenue sources other than expendable trusts ormajor capital project that are legally restricted for the purposes so designated. Both revenues and expenditures are budgeted incompliance with the Revised Code of Washington 36.40. The modified accrual basis of accounting is applied. A description ofeach fund follows:
Public Health Fund - A fund to account for the financial operations of County health programs.
Special Paths Fund - A fund established in accordance with RCW 46.68.100. The specific purpose of the fund is to set asidemonies for establishing and maintaining paths and trails within the right-of-way of County roads for pedestrians, equestrians orbicyclist.
Emergency Management Fund - A fund established to account for emergency services within the County.
County Fair Fund - A fund to finance the promotion of the Skagit County Fair as established by Skagit County Code. Partialfunding for the Fair is derived from the State Department of Agriculture, so the Fair must conform to RCW 15.76.
Veterans Relief Fund - This is a fund to finance emergency financial assistance to veterans and their surviving spouses.
Law Library Fund - A fund to finance the purchase of legal publications and maintenance of a law library used by judges,attorneys, and the general public.
River Improvement Fund - A fund established to account for river improvements.
Treasurer's Operation & Maintenance Fund - A fund to account for extraordinary costs incurred collecting delinquent realand personal taxes.
Document Preservation Fund - A fund to finance the acquisition, installation, operation and maintenance of equipment tocopy, preserve, and index documents recorded in the county.
Election Reserves Fund - A fund to finance election services and equipment.
Parks & Recreation Fund - A fund to finance the maintenance of parks and the needs of the County through recreationalfacilities and programs.
Substance Abuse Fund - A fund established to coordinate alcohol/substance abuse rehabilitation within the County.
Community Services Fund - A fund established to assist senior citizens.
Convention Center Fund - A fund to account for the programs funded through the accommodations excise tax.
Clean Water Fund – A fund established to account for salmon recovery projects
Conservation Futures Fund - A fund created for the purpose of preserving farmland and critical areas in the County.
Medic 1 Services Fund - A fund to finance the overall coordination of basic and advanced life support services within theCounty.
Crime/Victim Fund - A fund established for the administration of the Victim/Witness Program.
87

SKAGIT COUNTY, WASHINGTONNONMAJOR SPECIAL REVENUE FUNDS
AS OF DECEMBER 31, 2015
Communication System Fund - A fund established to administer the emergency services communication system.
Water Quality - A fund established to account for the county's revolving loan fund program for The Clean Water District.
Planning & Development Services Fund - A Fund established for the administration of Planning and Development Services.
Lake Management District No. 1 – A fund established to collect assessments and to pay for costs related to lakeimprovements and maintenance activities on Big Lake.
Lake Management District No. 2 – A fund established to collect assessments and to pay for costs related to lakeimprovements and maintenance activities on Lake McMurray.
Lake Management District No. 3 – A fund established to collect assessments and to pay for costs related to lakeimprovements and maintenance activities on Lakes Erie and Campbell.
Lake Management District No. 4 – A fund established to collect assessments and to pay for costs related to lakeimprovements and maintenance activities on Clear and Beaver Lakes.
Edison Clean Water District Subarea – A fund established to collect operating assessments and to pay for the operations andmaintenance of the Edison wastewater collection and treatment system.
Drug Enforcement - A fund established for drug enforcement activities.
Boating Safety – A fund established to receive state funding to be used exclusively for safety costs related to boating safetyprograms within the County.
Low Income Housing - A fund established to collect recording fees and to spend those fees on low-income housing projects.
Title III Projects – A fund established to collect revenues and to expend on projects in accordance with Public Law 106-393.
Treasurer's REET - A fund established to collect certain excise Tax fees and expend for the develop-ment and maintenance of an electronic reporting system for real estate excise tax affidavits.
Housing & Assistance - A fund established to collect and expend certain recorded document fees for very low-income housing projects and administration.
Interlocal Investigations - A fund established for use by participating law enforcement agencies for investigative activities.
88

SKAGIT COUNTY, WASHINGTONCOMBINING BALANCE SHEET
NONMAJOR SPECIAL REVENUE FUNDSAS OF DECEMBER 31, 2015
Public Special Emergency CountyASSETS and OUTFLOWS of RESOURCES Health Paths Mgmt FairCash and Cash Equivalents $426,953 $378,534 $289,313 $667,600Investments - 58,104 Taxes ReceivableAccounts Receivable 15,239 - Due from Other Funds - - - Due from Other Governments 263,064 2,230 Interfund Loans ReceivableInventories 6,232 Prepaid Items
Total Assets 711,488 436,638 291,543 667,600
Deferred Outflows of Resources
Total Assets and Deferred Outflows of Resources 711,488 436,638 291,543 667,600
LIABILITIES, DEFERRED INFLOWS of RECOURCES and FUND BALANCESLiabilitiesAccounts and Vouchers Payable 6,222 4,484 1,617 169 Due to Other Funds 216,927 - 25,087 10,680 Due to Other Governments 9,137 - - Accrued Wages Payable 85,569 3,125 8,924 2,755 Accrued Employee Benefits 18,359 718 1,516 686 Custodial Accounts 297 - Unearned Revenue - 88,895 Interfund Loans Payable
Total Liabilities 336,511 8,327 37,144 103,185
Deferred Inflows of Resources -
Fund BalanceNonspendable 6,232 Restricted 259,746 428,311 Committed 108,998 254,400 564,415
AssignedUnassigned
Total Fund Balances 374,976 428,311 254,400 564,415
Total Liabilities, Deferred Inflows of Resources and Fund Balances 711,488 436,638 291,543 667,600
89

SKAGIT COUNTY, WASHINGTONCOMBINING BALANCE SHEET
NONMAJOR SPECIAL REVENUE FUNDSAS OF DECEMBER 31, 2015
ASSETS and OUTFLOWS of RESOURCESCash and Cash EquivalentsInvestmentsTaxes ReceivableAccounts ReceivableDue from Other FundsDue from Other GovernmentsInterfund Loans ReceivableInventoriesPrepaid Items
Total Assets
Deferred Outflows of Resources
Total Assets and Deferred Outflows of Resources
LIABILITIES, DEFERRED INFLOWS of RECOURCES and FUND BALANCESLiabilitiesAccounts and Vouchers PayableDue to Other FundsDue to Other GovernmentsAccrued Wages PayableAccrued Employee BenefitsCustodial AccountsUnearned RevenueInterfund Loans Payable
Total Liabilities
Deferred Inflows of Resources
Fund BalanceNonspendableRestrictedCommitted
AssignedUnassigned
Total Fund Balances
Total Liabilities, Deferred Inflows of Resources and Fund Balances
Veterans' Law River TreasurerRelief Library Imp O&M$527,717 $48,359 $11,564 $38,502
169,397 221,379 4,140
- -
45,043
531,856 48,359 226,004 259,881
531,856 48,359 226,004 259,881
33,409 4,626 5,194 - 2,585 6,434
- 1,577 3,407 -
282 1,259
35,994 6,485 16,294 -
4,140
491,723 259,880 41,874 209,710
491,723 41,874 209,710 259,880
531,856 48,359 226,004 259,880
90

SKAGIT COUNTY, WASHINGTONCOMBINING BALANCE SHEET
NONMAJOR SPECIAL REVENUE FUNDSAS OF DECEMBER 31, 2015
ASSETS and OUTFLOWS of RESOURCESCash and Cash EquivalentsInvestmentsTaxes ReceivableAccounts ReceivableDue from Other FundsDue from Other GovernmentsInterfund Loans ReceivableInventoriesPrepaid Items
Total Assets
Deferred Outflows of Resources
Total Assets and Deferred Outflows of Resources
LIABILITIES, DEFERRED INFLOWS of RECOURCES and FUND BALANCESLiabilitiesAccounts and Vouchers PayableDue to Other FundsDue to Other GovernmentsAccrued Wages PayableAccrued Employee BenefitsCustodial AccountsUnearned RevenueInterfund Loans Payable
Total Liabilities
Deferred Inflows of Resources
Fund BalanceNonspendableRestrictedCommitted
AssignedUnassigned
Total Fund Balances
Total Liabilities, Deferred Inflows of Resources and Fund Balances
Document SubstancePreserv Election Parks & Rec Abuse$327,192 $629,886 $325,092 $462,247
326,560 420,966
- - - - - 170,873
653,752 629,886 746,058 633,120
653,752 629,886 746,058 633,120
1,328 18,693 17,138 91,687 3,674 11,314
- - 125,651 2,156 7,600 19,813 4,648
444 1,573 4,506 1,045 2,284
113,684 -
3,927 31,540 157,424 234,345
649,825 398,775 598,346 588,634
649,825 598,346 588,634 398,775
653,752 629,886 746,058 633,120
91
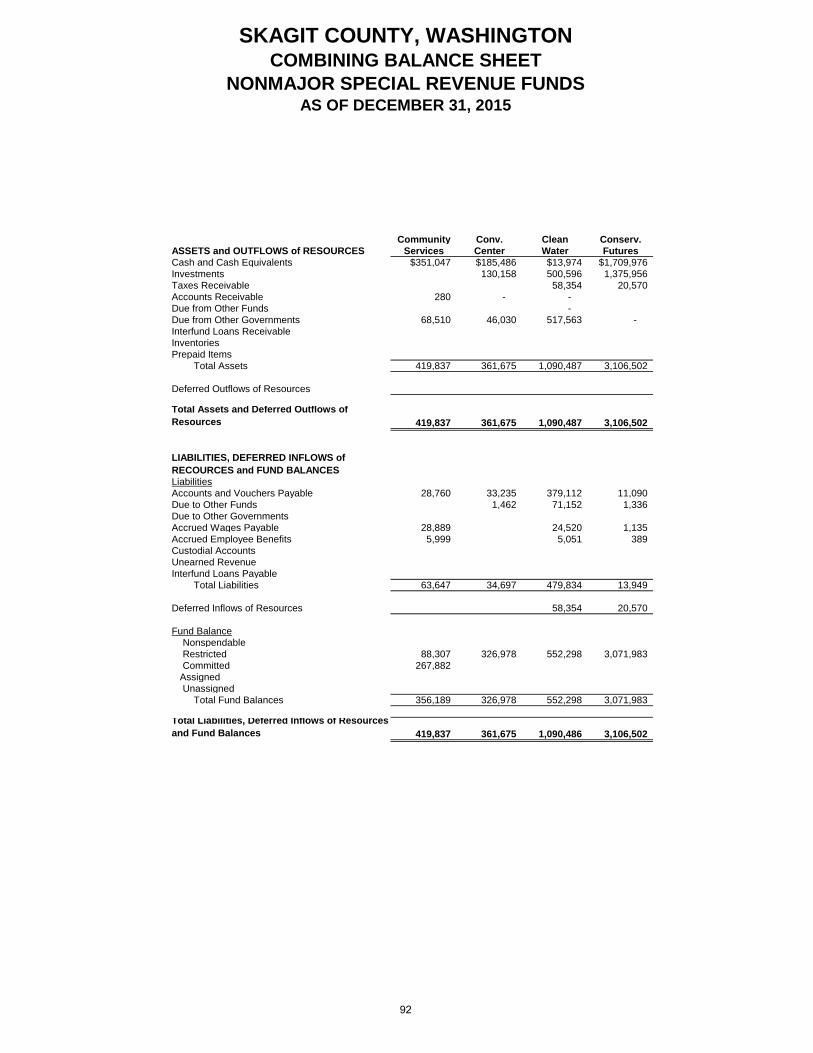
SKAGIT COUNTY, WASHINGTONCOMBINING BALANCE SHEET
NONMAJOR SPECIAL REVENUE FUNDSAS OF DECEMBER 31, 2015
ASSETS and OUTFLOWS of RESOURCESCash and Cash EquivalentsInvestmentsTaxes ReceivableAccounts ReceivableDue from Other FundsDue from Other GovernmentsInterfund Loans ReceivableInventoriesPrepaid Items
Total Assets
Deferred Outflows of Resources
Total Assets and Deferred Outflows of Resources
LIABILITIES, DEFERRED INFLOWS of RECOURCES and FUND BALANCESLiabilitiesAccounts and Vouchers PayableDue to Other FundsDue to Other GovernmentsAccrued Wages PayableAccrued Employee BenefitsCustodial AccountsUnearned RevenueInterfund Loans Payable
Total Liabilities
Deferred Inflows of Resources
Fund BalanceNonspendableRestrictedCommitted
AssignedUnassigned
Total Fund Balances
Total Liabilities, Deferred Inflows of Resources and Fund Balances
Community Conv. Clean Conserv.Services Center Water Futures
$351,047 $185,486 $13,974 $1,709,976130,158 500,596 1,375,956
58,354 20,570 280 - -
- 68,510 46,030 517,563 -
419,837 361,675 1,090,487 3,106,502
419,837 361,675 1,090,487 3,106,502
28,760 33,235 379,112 11,090 1,462 71,152 1,336
28,889 24,520 1,135 5,999 5,051 389
63,647 34,697 479,834 13,949
58,354 20,570
88,307 326,978 552,298 3,071,983 267,882
356,189 326,978 552,298 3,071,983
419,837 361,675 1,090,486 3,106,502
92

SKAGIT COUNTY, WASHINGTONCOMBINING BALANCE SHEET
NONMAJOR SPECIAL REVENUE FUNDSAS OF DECEMBER 31, 2015
ASSETS and OUTFLOWS of RESOURCESCash and Cash EquivalentsInvestmentsTaxes ReceivableAccounts ReceivableDue from Other FundsDue from Other GovernmentsInterfund Loans ReceivableInventoriesPrepaid Items
Total Assets
Deferred Outflows of Resources
Total Assets and Deferred Outflows of Resources
LIABILITIES, DEFERRED INFLOWS of RECOURCES and FUND BALANCESLiabilitiesAccounts and Vouchers PayableDue to Other FundsDue to Other GovernmentsAccrued Wages PayableAccrued Employee BenefitsCustodial AccountsUnearned RevenueInterfund Loans Payable
Total Liabilities
Deferred Inflows of Resources
Fund BalanceNonspendableRestrictedCommitted
AssignedUnassigned
Total Fund Balances
Total Liabilities, Deferred Inflows of Resources and Fund Balances
Crime Comm. WaterMedic 1 Victim System Quality
$3,954,679 $28,766 $2,081 $293,683999,664 118,848 100,000 136,442 5,114
-
662,771 15,149
5,090,785 147,613 664,852 413,946
5,090,785 147,613 664,852 413,946
243,491 - 2,077 (25) 30,837
310,583 23,317 898 940
190 8,034
- -
616,262 1,088 2,077 915
144,442 5,114
146,525 662,775 407,917 4,330,081
4,330,081 146,525 662,775 407,917
5,090,785 147,613 664,852 413,946
93

SKAGIT COUNTY, WASHINGTONCOMBINING BALANCE SHEET
NONMAJOR SPECIAL REVENUE FUNDSAS OF DECEMBER 31, 2015
ASSETS and OUTFLOWS of RESOURCESCash and Cash EquivalentsInvestmentsTaxes ReceivableAccounts ReceivableDue from Other FundsDue from Other GovernmentsInterfund Loans ReceivableInventoriesPrepaid Items
Total Assets
Deferred Outflows of Resources
Total Assets and Deferred Outflows of Resources
LIABILITIES, DEFERRED INFLOWS of RECOURCES and FUND BALANCESLiabilitiesAccounts and Vouchers PayableDue to Other FundsDue to Other GovernmentsAccrued Wages PayableAccrued Employee BenefitsCustodial AccountsUnearned RevenueInterfund Loans Payable
Total Liabilities
Deferred Inflows of Resources
Fund BalanceNonspendableRestrictedCommitted
AssignedUnassigned
Total Fund Balances
Total Liabilities, Deferred Inflows of Resources and Fund Balances
Planning & Lake Mgmt Lake Mgmt Lake MgmtDevelopment Dist. 1 Dist. 2 Dist. 3
$1,294,732 $91,159 $29,511 $34,93550,000 30,000 35,000
2,076 180 49
- 65,336
1,360,068 143,235 59,691 69,984
1,360,068 143,235 59,691 69,984
35,908 39,500 6,713 17,000 2,111
- 63,050 23,418
6,244 - - - -
130,731 39,500 6,713 17,000
- 2,076 180 49
1,229,337 101,659 52,798 52,935
1,229,337 101,659 52,798 52,935
1,360,068 143,235 59,692 69,984
94

SKAGIT COUNTY, WASHINGTONCOMBINING BALANCE SHEET
NONMAJOR SPECIAL REVENUE FUNDSAS OF DECEMBER 31, 2015
ASSETS and OUTFLOWS of RESOURCESCash and Cash EquivalentsInvestmentsTaxes ReceivableAccounts ReceivableDue from Other FundsDue from Other GovernmentsInterfund Loans ReceivableInventoriesPrepaid Items
Total Assets
Deferred Outflows of Resources
Total Assets and Deferred Outflows of Resources
LIABILITIES, DEFERRED INFLOWS of RECOURCES and FUND BALANCESLiabilitiesAccounts and Vouchers PayableDue to Other FundsDue to Other GovernmentsAccrued Wages PayableAccrued Employee BenefitsCustodial AccountsUnearned RevenueInterfund Loans Payable
Total Liabilities
Deferred Inflows of Resources
Fund BalanceNonspendableRestrictedCommitted
AssignedUnassigned
Total Fund Balances
Total Liabilities, Deferred Inflows of Resources and Fund Balances
Lake Mgmt Edison Drug BoatingDist. 4 Clean Wtr Enforce. Safety
$37,206 $138,236 $15,391 $41,04125,000 150,000 199,648 30,042
1,463 318
- - 1,000
63,668 289,554 215,039 71,083
63,668 289,554 215,039 71,083
12,060 5,023 - 10,286 -
-
- -
12,060 5,023 - 10,286
1,463 318
1,000 50,146 215,039 60,797
283,213
50,146 284,213 215,039 60,797
63,668 289,554 215,039 71,083
95

SKAGIT COUNTY, WASHINGTONCOMBINING BALANCE SHEET
NONMAJOR SPECIAL REVENUE FUNDSAS OF DECEMBER 31, 2015
ASSETS and OUTFLOWS of RESOURCESCash and Cash EquivalentsInvestmentsTaxes ReceivableAccounts ReceivableDue from Other FundsDue from Other GovernmentsInterfund Loans ReceivableInventoriesPrepaid Items
Total Assets
Deferred Outflows of Resources
Total Assets and Deferred Outflows of Resources
LIABILITIES, DEFERRED INFLOWS of RECOURCES and FUND BALANCESLiabilitiesAccounts and Vouchers PayableDue to Other FundsDue to Other GovernmentsAccrued Wages PayableAccrued Employee BenefitsCustodial AccountsUnearned RevenueInterfund Loans Payable
Total Liabilities
Deferred Inflows of Resources
Fund BalanceNonspendableRestrictedCommitted
AssignedUnassigned
Total Fund Balances
Total Liabilities, Deferred Inflows of Resources and Fund Balances
Low Inc. Title III Treasurer HousingHousing Projects REET Assistance
$118,342 $21,166 $142,058 $34,289148,423 68,065 228,935
266,765 21,166 210,123 263,224
266,765 21,166 210,123 263,224
32,785 10,452 70,852 3,125
32,785 10,452 - 73,977
233,980 10,715 210,123 189,247
233,980 10,715 210,123 189,247
266,765 21,166 210,123 263,223
96

SKAGIT COUNTY, WASHINGTONCOMBINING BALANCE SHEET
NONMAJOR SPECIAL REVENUE FUNDSAS OF DECEMBER 31, 2015
ASSETS and OUTFLOWS of RESOURCESCash and Cash EquivalentsInvestmentsTaxes ReceivableAccounts ReceivableDue from Other FundsDue from Other GovernmentsInterfund Loans ReceivableInventoriesPrepaid Items
Total Assets
Deferred Outflows of Resources
Total Assets and Deferred Outflows of Resources
LIABILITIES, DEFERRED INFLOWS of RECOURCES and FUND BALANCESLiabilitiesAccounts and Vouchers PayableDue to Other FundsDue to Other GovernmentsAccrued Wages PayableAccrued Employee BenefitsCustodial AccountsUnearned RevenueInterfund Loans Payable
Total Liabilities
Deferred Inflows of Resources
Fund BalanceNonspendableRestrictedCommitted
AssignedUnassigned
Total Fund Balances
Total Liabilities, Deferred Inflows of Resources and Fund Balances
InterlocalInvest. TOTAL$125,681 $12,796,398
83,172 5,469,912 228,705
15,519 - -
38,289 1,894,857 1,000
- 6,232
247,142 20,412,622
247,142 20,412,622
6,438 1,129,322 386,724
- 445,371 2,804 285,127
65,432 22,131 32,746
208,823 -
31,373 2,553,545
236,705
7,232 215,769 10,367,588
7,247,553 - -
215,769 17,622,372
247,142 20,412,622
97

SKAGIT COUNTY, WASHINGTONCOMBINING STATEMENT OF REVENUES, EXPENDITURES, AND
CHANGES IN FUND BALANCENONMAJOR SPECIAL REVENUE FUNDSFOR THE YEAR ENDED DECEMBER 31, 2015
Public Special Emergency CountyREVENUES Health Paths Mgmt FairProperty TaxesSales and Use TaxesOther TaxesLicenses and Permits 483,193 - Intergovernmental 1,703,103 164,202 284,644 22,256Charges for Services 475,961 5,000 232,301Fines and Forfeits 9,082Interest Earnings 412Donations 67,374 20,565 31,141Other Revenue 7,862 - 58,189
Total Revenue 2,746,575 185,179 289,644 343,886
EXPENDITURESCurrent:
General Governmental ServicesPublic Safety 469,513Utilities and EnvironmentTransportation 192,296Economic EnvironmentHealth & Human Services 3,932,132Culture and Recreation 336,658
Debt Service:PrincipalInterest
Capital Outlay 20,565 Total Expenditures 3,932,132 212,861 469,513 336,658
Excess (Deficit) of Revenues Over Expenditures (1,185,557) (27,681) (179,869) 7,229
Other Financing Sources (Uses)Proceeds from Long Term DebtProceeds from Sale of Capital AssetsTransfers In 1,213,313 108,225 20,000Transfers Out
Total Other Financial Sources (Uses) 1,213,313 - 108,225 20,000
Net Change in Fund Balance 27,756 (27,681) (71,644) 27,229
Fund Balance, January 1 347,220 455,992 326,044 537,186Prior Period AdjustmentsFund Balance, January 1, restated 347,220 455,992 326,044 537,186
Fund Balance, December 31 $374,976 $428,311 $254,400 $564,415
98
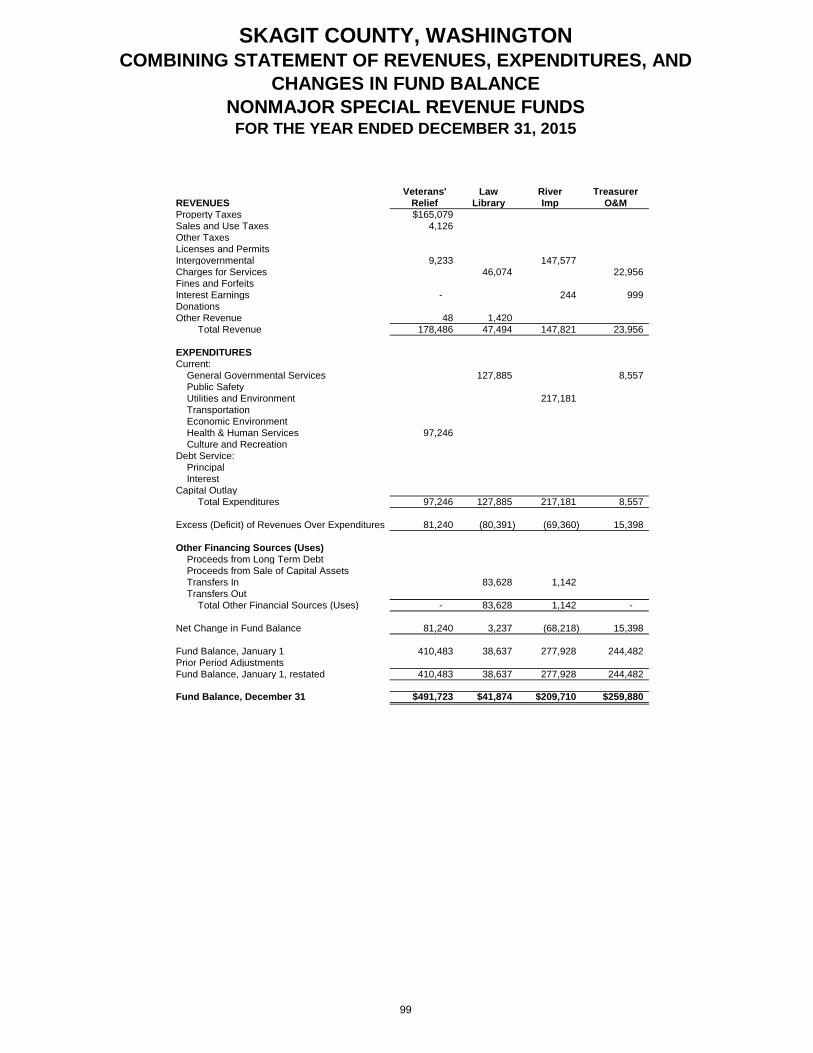
SKAGIT COUNTY, WASHINGTONCOMBINING STATEMENT OF REVENUES, EXPENDITURES, AND
CHANGES IN FUND BALANCENONMAJOR SPECIAL REVENUE FUNDSFOR THE YEAR ENDED DECEMBER 31, 2015
REVENUESProperty TaxesSales and Use TaxesOther TaxesLicenses and PermitsIntergovernmentalCharges for ServicesFines and ForfeitsInterest EarningsDonationsOther Revenue
Total Revenue
EXPENDITURESCurrent:
General Governmental ServicesPublic SafetyUtilities and EnvironmentTransportationEconomic EnvironmentHealth & Human ServicesCulture and Recreation
Debt Service:PrincipalInterest
Capital OutlayTotal Expenditures
Excess (Deficit) of Revenues Over Expenditures
Other Financing Sources (Uses)Proceeds from Long Term DebtProceeds from Sale of Capital AssetsTransfers InTransfers Out
Total Other Financial Sources (Uses)
Net Change in Fund Balance
Fund Balance, January 1Prior Period AdjustmentsFund Balance, January 1, restated
Fund Balance, December 31
Veterans' Law River TreasurerRelief Library Imp O&M$165,079
4,126
9,233 147,57746,074 22,956
- 244 999
48 1,420178,486 47,494 147,821 23,956
127,885 8,557
217,181
97,246
97,246 127,885 217,181 8,557
81,240 (80,391) (69,360) 15,398
83,628 1,142
- 83,628 1,142 -
81,240 3,237 (68,218) 15,398
410,483 38,637 277,928 244,482
410,483 38,637 277,928 244,482
$491,723 $41,874 $209,710 $259,880
99

SKAGIT COUNTY, WASHINGTONCOMBINING STATEMENT OF REVENUES, EXPENDITURES, AND
CHANGES IN FUND BALANCENONMAJOR SPECIAL REVENUE FUNDSFOR THE YEAR ENDED DECEMBER 31, 2015
REVENUESProperty TaxesSales and Use TaxesOther TaxesLicenses and PermitsIntergovernmentalCharges for ServicesFines and ForfeitsInterest EarningsDonationsOther Revenue
Total Revenue
EXPENDITURESCurrent:
General Governmental ServicesPublic SafetyUtilities and EnvironmentTransportationEconomic EnvironmentHealth & Human ServicesCulture and Recreation
Debt Service:PrincipalInterest
Capital OutlayTotal Expenditures
Excess (Deficit) of Revenues Over Expenditures
Other Financing Sources (Uses)Proceeds from Long Term DebtProceeds from Sale of Capital AssetsTransfers InTransfers Out
Total Other Financial Sources (Uses)
Net Change in Fund Balance
Fund Balance, January 1Prior Period AdjustmentsFund Balance, January 1, restated
Fund Balance, December 31
Document SubstancePreserv Election Parks & Rec Abuse
64,004 1,353 928,82160,046 324,299 363,825
1,742 60510,171
217,528125,792 325,652 592,130 928,821
77,711 541,147
956,9261,278,505
8,12277,711 541,147 1,286,627 956,926
48,081 (215,495) (694,497) (28,105)
3,000420,000 715,602 -
- - 420,000 718,602 -
48,081 204,505 24,105 (28,105)
601,744 393,841 564,529 426,880
601,744 393,841 564,529 426,880
$649,825 $598,346 $588,634 $398,775
100
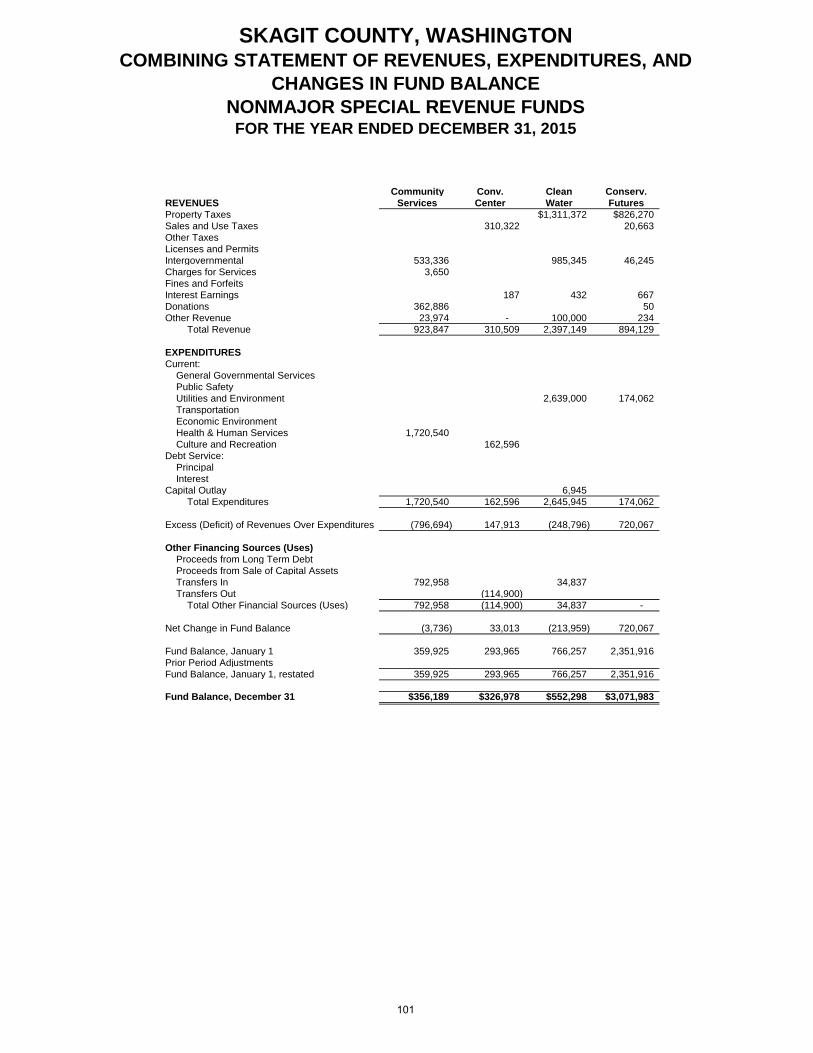
SKAGIT COUNTY, WASHINGTONCOMBINING STATEMENT OF REVENUES, EXPENDITURES, AND
CHANGES IN FUND BALANCENONMAJOR SPECIAL REVENUE FUNDSFOR THE YEAR ENDED DECEMBER 31, 2015
REVENUESProperty TaxesSales and Use TaxesOther TaxesLicenses and PermitsIntergovernmentalCharges for ServicesFines and ForfeitsInterest EarningsDonationsOther Revenue
Total Revenue
EXPENDITURESCurrent:
General Governmental ServicesPublic SafetyUtilities and EnvironmentTransportationEconomic EnvironmentHealth & Human ServicesCulture and Recreation
Debt Service:PrincipalInterest
Capital OutlayTotal Expenditures
Excess (Deficit) of Revenues Over Expenditures
Other Financing Sources (Uses)Proceeds from Long Term DebtProceeds from Sale of Capital AssetsTransfers InTransfers Out
Total Other Financial Sources (Uses)
Net Change in Fund Balance
Fund Balance, January 1Prior Period AdjustmentsFund Balance, January 1, restated
Fund Balance, December 31
Community Conv. Clean Conserv.Services Center Water Futures
$1,311,372 $826,270310,322 20,663
533,336 985,345 46,2453,650
187 432 667362,886 50
23,974 - 100,000 234923,847 310,509 2,397,149 894,129
2,639,000 174,062
1,720,540162,596
6,9451,720,540 162,596 2,645,945 174,062
(796,694) 147,913 (248,796) 720,067
792,958 34,837(114,900)
792,958 (114,900) 34,837 -
(3,736) 33,013 (213,959) 720,067
359,925 293,965 766,257 2,351,916
359,925 293,965 766,257 2,351,916
$356,189 $326,978 $552,298 $3,071,983
101

SKAGIT COUNTY, WASHINGTONCOMBINING STATEMENT OF REVENUES, EXPENDITURES, AND
CHANGES IN FUND BALANCENONMAJOR SPECIAL REVENUE FUNDSFOR THE YEAR ENDED DECEMBER 31, 2015
REVENUESProperty TaxesSales and Use TaxesOther TaxesLicenses and PermitsIntergovernmentalCharges for ServicesFines and ForfeitsInterest EarningsDonationsOther Revenue
Total Revenue
EXPENDITURESCurrent:
General Governmental ServicesPublic SafetyUtilities and EnvironmentTransportationEconomic EnvironmentHealth & Human ServicesCulture and Recreation
Debt Service:PrincipalInterest
Capital OutlayTotal Expenditures
Excess (Deficit) of Revenues Over Expenditures
Other Financing Sources (Uses)Proceeds from Long Term DebtProceeds from Sale of Capital AssetsTransfers InTransfers Out
Total Other Financial Sources (Uses)
Net Change in Fund Balance
Fund Balance, January 1Prior Period AdjustmentsFund Balance, January 1, restated
Fund Balance, December 31
Crime Comm. WaterMedic 1 Victim System Quality
$5,488,839137,066 3,834,162
-
311,300 49,639 33,59364,573 75,245 1,575
7,185 171 570 1,2030
27,6166,036,580 75,416 3,884,370 36,371
78,0565,268,756 3,863,534
217,348
5,268,756 78,056 3,863,534 217,348
767,824 (2,641) 20,836 (180,977)
240,012400
0400 - - 240,012
768,224 (2,641) 20,836 59,035
3,561,857 149,166 641,939 348,882
3,561,857 149,166 641,939 348,882
$4,330,081 $146,525 $662,775 $407,917
102

SKAGIT COUNTY, WASHINGTONCOMBINING STATEMENT OF REVENUES, EXPENDITURES, AND
CHANGES IN FUND BALANCENONMAJOR SPECIAL REVENUE FUNDSFOR THE YEAR ENDED DECEMBER 31, 2015
REVENUESProperty TaxesSales and Use TaxesOther TaxesLicenses and PermitsIntergovernmentalCharges for ServicesFines and ForfeitsInterest EarningsDonationsOther Revenue
Total Revenue
EXPENDITURESCurrent:
General Governmental ServicesPublic SafetyUtilities and EnvironmentTransportationEconomic EnvironmentHealth & Human ServicesCulture and Recreation
Debt Service:PrincipalInterest
Capital OutlayTotal Expenditures
Excess (Deficit) of Revenues Over Expenditures
Other Financing Sources (Uses)Proceeds from Long Term DebtProceeds from Sale of Capital AssetsTransfers InTransfers Out
Total Other Financial Sources (Uses)
Net Change in Fund Balance
Fund Balance, January 1Prior Period AdjustmentsFund Balance, January 1, restated
Fund Balance, December 31
Planning & Lake Mgmt Lake Mgmt Lake MgmtDevelopment Dist. 1 Dist. 2 Dist. 3
57,034 14,910 29,006730,605
86,972629,250
14,8810 156 93 109
1,461,707 57,190 15,003 29,115
43,039 9,204 20,329
2,640,632
2,640,632 43,039 9,204 20,329
(1,178,925) 14,151 5,799 8,786
1,225,094
1,225,094 - - -
46,169 14,151 5,799 8,786
1,183,168 87,508 46,999 44,149
1,183,168 87,508 46,999 44,149
$1,229,337 $101,659 $52,798 $52,935
103

SKAGIT COUNTY, WASHINGTONCOMBINING STATEMENT OF REVENUES, EXPENDITURES, AND
CHANGES IN FUND BALANCENONMAJOR SPECIAL REVENUE FUNDSFOR THE YEAR ENDED DECEMBER 31, 2015
REVENUESProperty TaxesSales and Use TaxesOther TaxesLicenses and PermitsIntergovernmentalCharges for ServicesFines and ForfeitsInterest EarningsDonationsOther Revenue
Total Revenue
EXPENDITURESCurrent:
General Governmental ServicesPublic SafetyUtilities and EnvironmentTransportationEconomic EnvironmentHealth & Human ServicesCulture and Recreation
Debt Service:PrincipalInterest
Capital OutlayTotal Expenditures
Excess (Deficit) of Revenues Over Expenditures
Other Financing Sources (Uses)Proceeds from Long Term DebtProceeds from Sale of Capital AssetsTransfers InTransfers Out
Total Other Financial Sources (Uses)
Net Change in Fund Balance
Fund Balance, January 1Prior Period AdjustmentsFund Balance, January 1, restated
Fund Balance, December 31
Lake Mgmt Edison Drug BoatingDist. 4 Clean Wtr Enforce. Safety
20,085 79,2540
20,000 85,695
78 467 295 42
3,56520,163 79,720 23,861 85,737
39,681 92,29014,874 92,101
14,874 92,101 39,681 92,290
5,289 (12,381) (15,820) (6,553)
- - - -
5,289 (12,381) (15,820) (6,553)
44,857 296,594 230,859 67,350
44,857 296,594 230,859 67,350
$50,146 $284,213 $215,039 $60,797
104

SKAGIT COUNTY, WASHINGTONCOMBINING STATEMENT OF REVENUES, EXPENDITURES, AND
CHANGES IN FUND BALANCENONMAJOR SPECIAL REVENUE FUNDSFOR THE YEAR ENDED DECEMBER 31, 2015
REVENUESProperty TaxesSales and Use TaxesOther TaxesLicenses and PermitsIntergovernmentalCharges for ServicesFines and ForfeitsInterest EarningsDonationsOther Revenue
Total Revenue
EXPENDITURESCurrent:
General Governmental ServicesPublic SafetyUtilities and EnvironmentTransportationEconomic EnvironmentHealth & Human ServicesCulture and Recreation
Debt Service:PrincipalInterest
Capital OutlayTotal Expenditures
Excess (Deficit) of Revenues Over Expenditures
Other Financing Sources (Uses)Proceeds from Long Term DebtProceeds from Sale of Capital AssetsTransfers InTransfers Out
Total Other Financial Sources (Uses)
Net Change in Fund Balance
Fund Balance, January 1Prior Period AdjustmentsFund Balance, January 1, restated
Fund Balance, December 31
Low Inc. Title III Treasurer HousingHousing Projects REET Assistance
41,246 13,936128,230 13,290 653,795
213 545 43
128,443 41,246 27,770 653,838
118,794 42,005659,364
118,794 42,005 0 659,364
9,649 (759) 27,770 (5,526)
- - - -
9,649 (759) 27,770 (5,526)
224,331 11,474 182,353 194,773
224,331 11,474 182,353 194,773
$233,980 $10,715 $210,123 $189,247
105
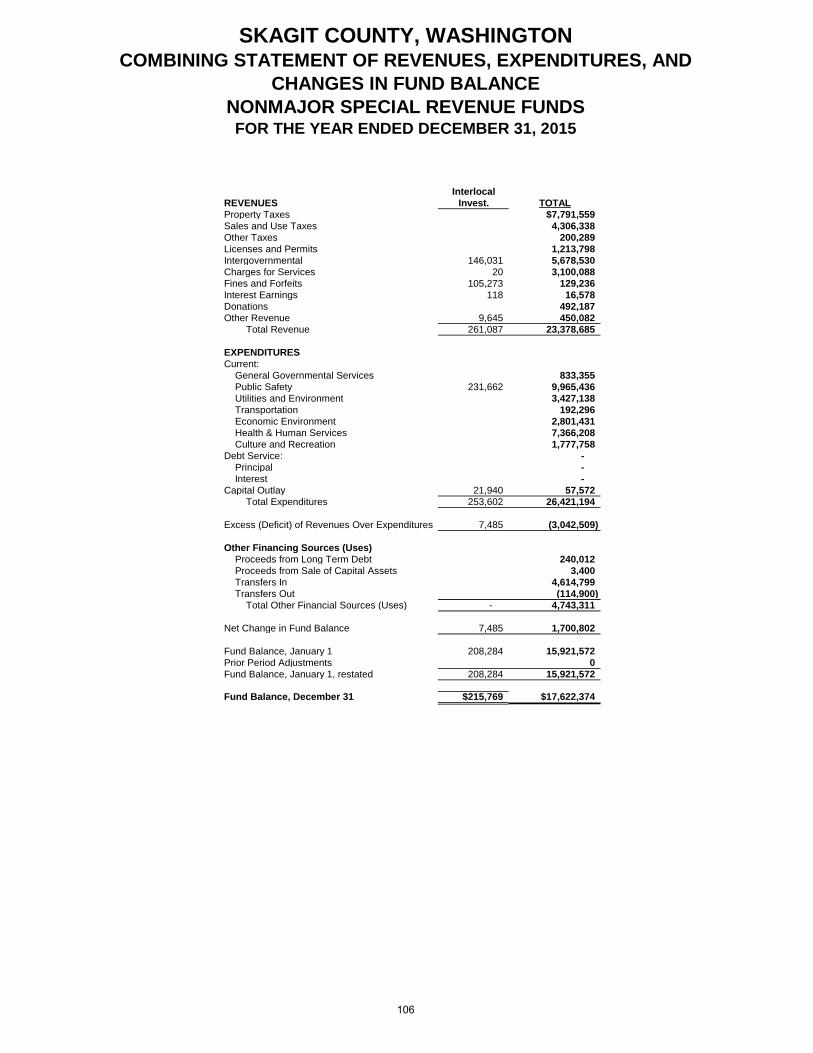
SKAGIT COUNTY, WASHINGTONCOMBINING STATEMENT OF REVENUES, EXPENDITURES, AND
CHANGES IN FUND BALANCENONMAJOR SPECIAL REVENUE FUNDSFOR THE YEAR ENDED DECEMBER 31, 2015
REVENUESProperty TaxesSales and Use TaxesOther TaxesLicenses and PermitsIntergovernmentalCharges for ServicesFines and ForfeitsInterest EarningsDonationsOther Revenue
Total Revenue
EXPENDITURESCurrent:
General Governmental ServicesPublic SafetyUtilities and EnvironmentTransportationEconomic EnvironmentHealth & Human ServicesCulture and Recreation
Debt Service:PrincipalInterest
Capital OutlayTotal Expenditures
Excess (Deficit) of Revenues Over Expenditures
Other Financing Sources (Uses)Proceeds from Long Term DebtProceeds from Sale of Capital AssetsTransfers InTransfers Out
Total Other Financial Sources (Uses)
Net Change in Fund Balance
Fund Balance, January 1Prior Period AdjustmentsFund Balance, January 1, restated
Fund Balance, December 31
InterlocalInvest. TOTAL
$7,791,5594,306,338
200,289 1,213,798
146,031 5,678,530 20 3,100,088
105,273 129,236 118 16,578
492,187 9,645 450,082
261,087 23,378,685
833,355 231,662 9,965,436
3,427,138 192,296
2,801,431 7,366,208 1,777,758
- - -
21,940 57,572 253,602 26,421,194
7,485 (3,042,509)
240,012 3,400
4,614,799 (114,900)
- 4,743,311
7,485 1,700,802
208,284 15,921,5720
208,284 15,921,572
$215,769 $17,622,374
106

Original Budget
Final Budget Actual
Variance with Final Budget
Budgeted Fund Balance, January 1 $ 87 $ 87 $ 347,220
Resources (in-flows)Licenses and Permits 439,750 439,750 483,193 43,443 Intergovernmental Revenue 1,695,882 1,874,882 1,703,103 (171,779) Charges for Goods and Services 658,200 659,700 475,961 (183,739) Fines and Forfeits 6,000 6,000 9,082 3,082 Interest Revenue 150 150 (150) Donations - 75,000 67,374 (7,626) Transfers In 1,290,122 1,263,313 1,213,313 (50,000) Miscellaneous Revenues 250 250 7,862 7,612 Total Resources (in-flows) 4,090,354 4,319,045 3,959,888 (359,157)
Amounts Available for Appropriation 4,090,441 4,319,132 4,307,108
Charges to Appropriations (out-flows)Salaries and Wages 2,231,808 2,199,155 2,179,622 (19,533) Personnel Benefits 1,114,648 1,090,492 1,047,707 (42,785) Supplies 188,523 331,813 203,075 (128,738) Services and Charges 132,378 204,588 109,879 (94,709) Capital Outlays - Interfund Payments for Services 423,084 493,084 391,850 (101,234) Transfers Out - Amount Charged to Appropriations (out-flows) 4,090,441 4,319,132 3,932,133 (386,999)
Budgeted Fund Balance, December 31 -$ -$ 374,975$
Budgeted Amounts
SKAGIT COUNTY, WASHINGTONPublic Health
Schedule of Revenues, Expenditures and Changes in Fund BalanceBudget (GAAP Basis) and Actual
For the Year Ended December 31, 2015
107

Original Budget
Final Budget Actual
Variance with Final Budget
Budgeted Fund Balance, January 1 $ 64,788 $ 64,788 $ 455,992
Resources (in-flows)Intergovernmental Revenue 158,000 158,000 164,202 6,202 Miscellaneous Revenue 3,000 3,000 20,977 17,977 Total Resources (in-flows) 161,000 161,000 185,179 24,179
Amounts Available for Appropriation 225,788 225,788 641,171
Charges to Appropriations (out-flows)Salaries and Wages 72,781 72,781 74,098 1,317 Personnel Benefits 40,407 40,407 38,973 (1,434) Supplies 28,500 28,500 5,201 (23,299) Services and Charges 61,100 61,100 74,023 12,923 Capital Outlays 22,000 22,000 20,565 (1,435) Interfund Payments for Services 1,000 1,000 - (1,000) Transfers Out - - - Amount Charged to Appropriations (out-flows) 225,788 225,788 212,860 (12,928)
Budgeted Fund Balance, December 31 -$ -$ 428,311$
Budgeted Amounts
SKAGIT COUNTY, WASHINGTONSpecial Paths
Schedule of Revenues, Expenditures and Changes in Fund BalanceBudget (GAAP Basis) and Actual
For the Year Ended December 31, 2015
108

Original Budget
Final Budget Actual
Variance with Final Budget
Budgeted Fund Balance, January 1 $ (1,964) $ 66,522 $ 326,044
Resources (in-flows)Licenses and Permits - Intergovernmental Revenue 257,612 297,243 284,644 (12,599) Charges for Goods and Services 2,200 4,700 5,000 300 Transfers In 108,225 108,225 108,225 - Miscellaneous Revenues - - - - Total Resources (in-flows) 368,037 410,168 397,869 (12,299)
Amounts Available for Appropriation 366,073 476,690 723,913
Charges to Appropriations (out-flows)Salaries and Wages 216,515 256,515 239,838 (16,677) Personnel Benefits 95,395 100,695 91,605 (9,090) Supplies 2,400 14,600 15,460 860 Services and Charges 18,100 53,031 63,858 10,827 Capital Outlays 800 18,986 - (18,986) Interfund Payments for Services 32,863 32,863 58,753 25,890 Transfers Out - - - - Amount Charged to Appropriations (out-flows) 366,073 476,690 469,514 (7,176)
Budgeted Fund Balance, December 31 -$ -$ 254,399$
Budgeted Amounts
SKAGIT COUNTY, WASHINGTONEmergency Management
Schedule of Revenues, Expenditures and Changes in Fund BalanceBudget (GAAP Basis) and Actual
For the Year Ended December 31, 2015
109
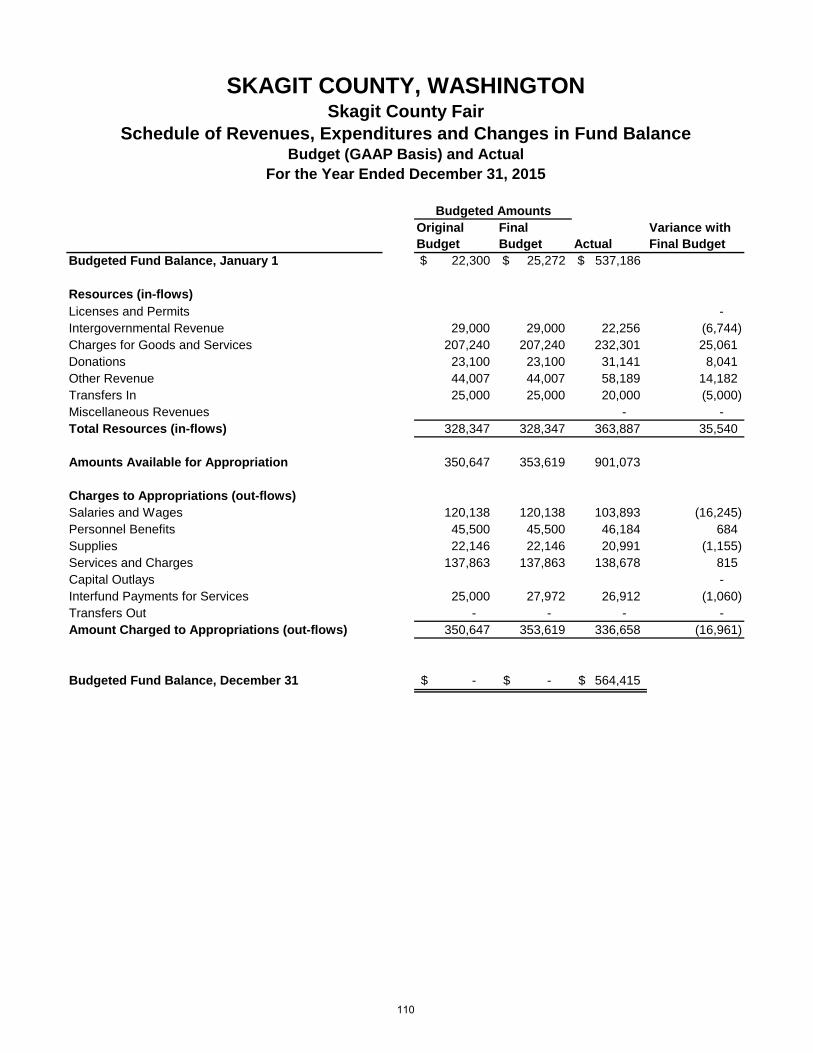
Original Budget
Final Budget Actual
Variance with Final Budget
Budgeted Fund Balance, January 1 $ 22,300 $ 25,272 $ 537,186
Resources (in-flows)Licenses and Permits - Intergovernmental Revenue 29,000 29,000 22,256 (6,744) Charges for Goods and Services 207,240 207,240 232,301 25,061 Donations 23,100 23,100 31,141 8,041 Other Revenue 44,007 44,007 58,189 14,182 Transfers In 25,000 25,000 20,000 (5,000) Miscellaneous Revenues - - Total Resources (in-flows) 328,347 328,347 363,887 35,540
Amounts Available for Appropriation 350,647 353,619 901,073
Charges to Appropriations (out-flows)Salaries and Wages 120,138 120,138 103,893 (16,245) Personnel Benefits 45,500 45,500 46,184 684 Supplies 22,146 22,146 20,991 (1,155) Services and Charges 137,863 137,863 138,678 815 Capital Outlays - Interfund Payments for Services 25,000 27,972 26,912 (1,060) Transfers Out - - - - Amount Charged to Appropriations (out-flows) 350,647 353,619 336,658 (16,961)
Budgeted Fund Balance, December 31 -$ -$ 564,415$
Budgeted Amounts
SKAGIT COUNTY, WASHINGTONSkagit County Fair
Schedule of Revenues, Expenditures and Changes in Fund BalanceBudget (GAAP Basis) and Actual
For the Year Ended December 31, 2015
110
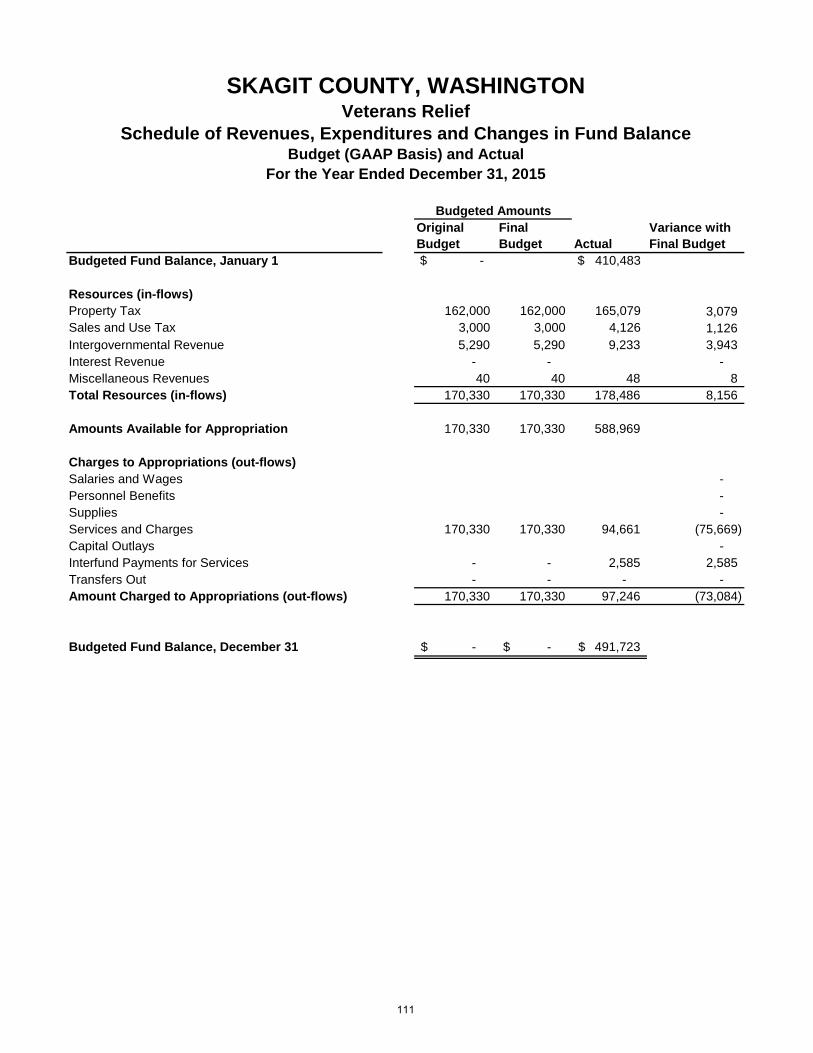
Original Budget
Final Budget Actual
Variance with Final Budget
Budgeted Fund Balance, January 1 $ - $ 410,483
Resources (in-flows)Property Tax 162,000 162,000 165,079 3,079 Sales and Use Tax 3,000 3,000 4,126 1,126 Intergovernmental Revenue 5,290 5,290 9,233 3,943 Interest Revenue - - - Miscellaneous Revenues 40 40 48 8 Total Resources (in-flows) 170,330 170,330 178,486 8,156
Amounts Available for Appropriation 170,330 170,330 588,969
Charges to Appropriations (out-flows)Salaries and Wages - Personnel Benefits - Supplies - Services and Charges 170,330 170,330 94,661 (75,669) Capital Outlays - Interfund Payments for Services - - 2,585 2,585 Transfers Out - - - - Amount Charged to Appropriations (out-flows) 170,330 170,330 97,246 (73,084)
Budgeted Fund Balance, December 31 -$ -$ 491,723$
Budgeted Amounts
SKAGIT COUNTY, WASHINGTONVeterans Relief
Schedule of Revenues, Expenditures and Changes in Fund BalanceBudget (GAAP Basis) and Actual
For the Year Ended December 31, 2015
111

Original Budget
Final Budget Actual
Variance with Final Budget
Budgeted Fund Balance, January 1 $ 38,637
Resources (in-flows)Charges for Goods and Services 48,700 48,700 46,074 (2,626) Donations - - - Transfers In 79,562 83,628 83,628 - Miscellaneous Revenues 2,500 2,500 1,420 (1,080) Total Resources (in-flows) 130,762 134,828 131,122 (3,706)
Amounts Available for Appropriation 130,762 134,828 169,759
Charges to Appropriations (out-flows)Salaries and Wages 50,676 54,317 51,704 (2,613) Personnel Benefits 27,906 28,331 25,341 (2,990) Supplies 7,300 7,300 6,994 (306) Services and Charges 44,880 44,880 43,846 (1,034) Capital Outlays - Interfund Payments for Services - Transfers Out - Amount Charged to Appropriations (out-flows) 130,762 134,828 127,885 (6,943)
Budgeted Fund Balance, December 31 -$ -$ 41,874$
Budgeted Amounts
SKAGIT COUNTY, WASHINGTONLaw Library
Schedule of Revenues, Expenditures and Changes in Fund BalanceBudget (GAAP Basis) and Actual
For the Year Ended December 31, 2015
112

Original Budget
Final Budget Actual
Variance with Final Budget
Budgeted Fund Balance, January 1 $ 106,504 $ 106,504 $ 277,928
Resources (in-flows)Intergovernmental Revenue 1,200,000 1,200,000 147,577 (1,052,423) Charges for Goods and Services - - - - Interest Revenue - - 244 244 Transfers In 10,362 10,362 1,142 (9,220) Miscellaneous Revenues 16,000 16,000 - (16,000) Total Resources (in-flows) 1,226,362 1,226,362 148,963 (1,077,399)
Amounts Available for Appropriation 1,332,866 1,332,866 426,891
Charges to Appropriations (out-flows)Salaries and Wages 138,192 138,192 91,990 (46,202) Personnel Benefits 69,374 69,374 54,716 (14,658) Supplies 300 300 614 314 Services and Charges 1,075,000 1,075,000 27,485 (1,047,515) Capital Outlays - Interfund Payments for Services 50,000 50,000 42,376 (7,624) Transfers Out - - - - Amount Charged to Appropriations (out-flows) 1,332,866 1,332,866 217,181 (1,115,685)
Budgeted Fund Balance, December 31 -$ -$ 209,710$
Budgeted Amounts
SKAGIT COUNTY, WASHINGTONRiver Improvement
Schedule of Revenues, Expenditures and Changes in Fund BalanceBudget (GAAP Basis) and Actual
For the Year Ended December 31, 2015
113

Original Budget
Final Budget Actual
Variance with Final Budget
Budgeted Fund Balance, January 1 $ 52,864 $ 52,864 $ 601,744
Resources (in-flows)Intergovernmental Revenue 65,000 65,000 64,004 (996) Charges for Goods and Services 60,000 60,000 60,046 46 Interest Revenue 3,000 3,000 1,742 (1,258) Total Resources (in-flows) 128,000 128,000 125,792 (2,208)
Amounts Available for Appropriation 180,864 180,864 727,536
Charges to Appropriations (out-flows)Salaries and Wages 44,025 46,025 46,178 153 Personnel Benefits 25,589 27,089 25,891 (1,198) Supplies - - - - Services and Charges 11,250 7,750 5,642 (2,108) Capital Outlays - Interfund Payments for Services 100,000 100,000 - (100,000) Transfers Out - Amount Charged to Appropriations (out-flows) 180,864 180,864 77,711 (103,153)
Budgeted Fund Balance, December 31 -$ -$ 649,825$
Budgeted Amounts
SKAGIT COUNTY, WASHINGTONCentennial Document Preservation
Schedule of Revenues, Expenditures and Changes in Fund BalanceBudget (GAAP Basis) and Actual
For the Year Ended December 31, 2015
114

Original Budget
Final Budget Actual
Variance with Final Budget
Budgeted Fund Balance, January 1 $ (9,574) $ 1,226 $ 393,841
Resources (in-flows)Intergovernmental Revenue 12,000 1,200 1,353 153 Charges for Goods and Services 261,500 261,500 324,299 62,799 Transfers In 420,000 420,000 420,000 - Miscellaneous Revenues 400 400 (400) Total Resources (in-flows) 693,900 683,100 745,652 62,552
Amounts Available for Appropriation 684,326 684,326 1,139,493
Charges to Appropriations (out-flows)Salaries and Wages 214,827 214,827 188,143 (26,684) Personnel Benefits 92,499 92,499 87,885 (4,614) Supplies 4,500 4,500 3,316 (1,184) Services and Charges 295,450 295,450 183,744 (111,706) Capital Outlays - - - Interfund Payments for Services 77,050 77,050 78,059 1,009 Transfers Out - Amount Charged to Appropriations (out-flows) 684,326 684,326 541,147 (143,179)
Budgeted Fund Balance, December 31 -$ -$ 598,346$
Budgeted Amounts
SKAGIT COUNTY, WASHINGTONElection Services
Schedule of Revenues, Expenditures and Changes in Fund BalanceBudget (GAAP Basis) and Actual
For the Year Ended December 31, 2015
115

Original Budget
Final Budget Actual
Variance with Final Budget
Budgeted Fund Balance, January 1 $ 100,001 $ 100,001 $ 564,529
Resources (in-flows)Intergovernmental Revenue 3,000 3,000 - (3,000) Charges for Goods and Services 347,825 347,825 363,825 16,000 Interest Revenue 400 400 605 205 Donations 8,000 8,000 10,171 2,171 Transfers In 735,402 735,402 718,602 (16,800) Miscellaneous Revenues 161,600 161,600 217,529 55,929 Total Resources (in-flows) 1,256,227 1,256,227 1,310,732 54,505
Amounts Available for Appropriation 1,356,228 1,356,228 1,875,261
Charges to Appropriations (out-flows)Salaries and Wages 536,298 536,298 517,966 (18,332) Personnel Benefits 250,130 250,130 249,167 (963) Supplies 87,108 87,108 70,093 (17,015) Services and Charges 336,948 336,948 332,495 (4,453) Capital Outlays 6,300 6,300 8,122 1,822 Interfund Payments for Services 139,444 139,444 108,784 (30,660) Transfers Out - Amount Charged to Appropriations (out-flows) 1,356,228 1,356,228 1,286,627 (69,601)
Budgeted Fund Balance, December 31 -$ -$ 588,634$
Budgeted Amounts
SKAGIT COUNTY, WASHINGTONParks and Recreation
Schedule of Revenues, Expenditures and Changes in Fund BalanceBudget (GAAP Basis) and Actual
For the Year Ended December 31, 2015
116

Original Budget
Final Budget Actual
Variance with Final Budget
Budgeted Fund Balance, January 1 $ 131,097 $ 117,810 $ 426,880
Resources (in-flows)Intergovernmental Revenue 994,063 994,063 928,821 (65,242) Miscellaneous Revenue - - - - Transfers In - - - - Total Resources (in-flows) 994,063 994,063 928,821 (65,242)
Amounts Available for Appropriation 1,125,160 1,111,873 1,355,701
Charges to Appropriations (out-flows)Salaries and Wages 94,734 85,734 76,017 (9,717) Personnel Benefits 45,974 41,687 36,642 (5,045) Supplies 200 200 - (200) Services and Charges 965,152 965,152 825,423 (139,729) Capital Outlays - Interfund Payments for Services 19,100 19,100 18,844 (256) Transfers Out - - - - Amount Charged to Appropriations (out-flows) 1,125,160 1,111,873 956,926 (154,947)
Budgeted Fund Balance, December 31 -$ -$ 398,775$
Budgeted Amounts
SKAGIT COUNTY, WASHINGTONSubstance Abuse
Schedule of Revenues, Expenditures and Changes in Fund BalanceBudget (GAAP Basis) and Actual
For the Year Ended December 31, 2015
117
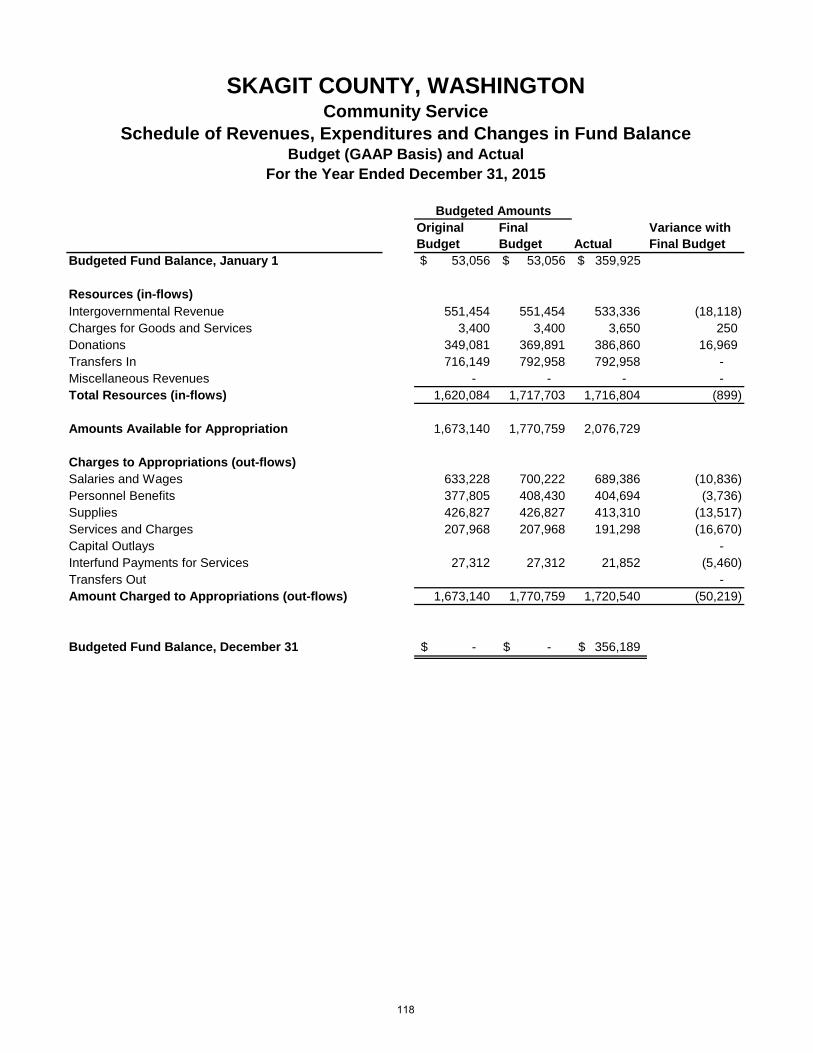
Original Budget
Final Budget Actual
Variance with Final Budget
Budgeted Fund Balance, January 1 $ 53,056 $ 53,056 $ 359,925
Resources (in-flows)Intergovernmental Revenue 551,454 551,454 533,336 (18,118) Charges for Goods and Services 3,400 3,400 3,650 250 Donations 349,081 369,891 386,860 16,969 Transfers In 716,149 792,958 792,958 - Miscellaneous Revenues - - - - Total Resources (in-flows) 1,620,084 1,717,703 1,716,804 (899)
Amounts Available for Appropriation 1,673,140 1,770,759 2,076,729
Charges to Appropriations (out-flows)Salaries and Wages 633,228 700,222 689,386 (10,836) Personnel Benefits 377,805 408,430 404,694 (3,736) Supplies 426,827 426,827 413,310 (13,517) Services and Charges 207,968 207,968 191,298 (16,670) Capital Outlays - Interfund Payments for Services 27,312 27,312 21,852 (5,460) Transfers Out - Amount Charged to Appropriations (out-flows) 1,673,140 1,770,759 1,720,540 (50,219)
Budgeted Fund Balance, December 31 -$ -$ 356,189$
Budgeted Amounts
SKAGIT COUNTY, WASHINGTONCommunity Service
Schedule of Revenues, Expenditures and Changes in Fund BalanceBudget (GAAP Basis) and Actual
For the Year Ended December 31, 2015
118

Original Budget
Final Budget Actual
Variance with Final Budget
Budgeted Fund Balance, January 1 $ 293,965
Resources (in-flows)Sales and Use Tax 300,000 300,000 310,322 10,322 Miscellaneous Revenue - - - Interest Revenue - - 187 187 Total Resources (in-flows) 300,000 300,000 310,509 10,509
Amounts Available for Appropriation 300,000 300,000 604,474
Charges to Appropriations (out-flows)Salaries and Wages - Personnel Benefits - Supplies - Services and Charges 160,700 160,700 161,134 434 Capital Outlays - Interfund Payments for Services 1,500 1,500 1,462 (38) Transfers Out 137,800 137,800 114,900 (22,900) Amount Charged to Appropriations (out-flows) 300,000 300,000 277,496 (22,504)
Budgeted Fund Balance, December 31 -$ -$ 326,978$
Budgeted Amounts
SKAGIT COUNTY, WASHINGTONConvention Center
Schedule of Revenues, Expenditures and Changes in Fund BalanceBudget (GAAP Basis) and Actual
For the Year Ended December 31, 2015
119

Original Budget
Final Budget Actual
Variance with Final Budget
Budgeted Fund Balance, January 1 $ 324,267 $ 425,267 $ 766,257
Resources (in-flows)Property Tax 1,333,077 1,333,077 1,311,372 (21,705) Intergovernmental Revenue 703,563 710,563 985,345 274,782 Charges for Goods and Services 103,576 103,576 (103,576) Interest Revenue 1,200 1,200 432 (768) Miscellaneous Revenues 121,777 121,777 98,825 (22,952) Transfers In 34,837 34,837 34,837 - Total Resources (in-flows) 2,298,030 2,305,030 2,430,811 125,781
Amounts Available for Appropriation 2,622,297 2,730,297 3,197,068
Charges to Appropriations (out-flows)Salaries and Wages 500,522 601,522 563,624 (37,898) Personnel Benefits 244,369 244,369 269,014 24,645 Supplies 56,406 56,406 82,449 26,043 Services and Charges 1,375,765 1,375,765 1,339,664 (36,101) Capital Outlays - 7,000 6,945 (55) Interfund Payments for Services 445,235 445,235 383,074 (62,161) Transfers Out - - - - Amount Charged to Appropriations (out-flows) 2,622,297 2,730,297 2,644,770 (85,527)
Budgeted Fund Balance, December 31 -$ -$ 552,298$
Budgeted Amounts
SKAGIT COUNTY, WASHINGTONClean Water Program
Schedule of Revenues, Expenditures and Changes in Fund BalanceBudget (GAAP Basis) and Actual
For the Year Ended December 31, 2015
120

Original Budget
Final Budget Actual
Variance with Final Budget
Budgeted Fund Balance, January 1 $ 87,287 $ 87,287 $ 2,351,916
Resources (in-flows)Property Tax 819,800 819,800 826,270 6,470 Sales and Use Tax 13,200 13,200 20,663 7,463 Intergovernmental Revenue 1,866,608 1,866,608 46,245 (1,820,363) Interest Revenue - - 667 667 Donations - - 50 50 Miscellaneous Revenues - - 233 233 Total Resources (in-flows) 2,699,608 2,699,608 894,128 (1,805,480)
Amounts Available for Appropriation 2,786,895 2,786,895 3,246,044
Charges to Appropriations (out-flows)Salaries and Wages 43,108 43,108 32,999 (10,109) Personnel Benefits 21,687 21,687 17,673 (4,014) Supplies 500 500 167 (333) Services and Charges 171,600 161,600 115,581 (46,019) Capital Outlays 2,550,000 2,550,000 - (2,550,000) Interfund Payments for Services - 10,000 7,641 (2,359) Transfers Out - Amount Charged to Appropriations (out-flows) 2,786,895 2,786,895 174,061 (2,612,834)
Budgeted Fund Balance, December 31 -$ -$ 3,071,983$
Budgeted Amounts
SKAGIT COUNTY, WASHINGTONConservation Futures
Schedule of Revenues, Expenditures and Changes in Fund BalanceBudget (GAAP Basis) and Actual
For the Year Ended December 31, 2015
121

Original Budget Final Budget Actual
Variance with Final Budget
Budgeted Fund Balance, January 1 $ (680,606) $ (595,213) $ 3,561,857
Resources (in-flows)Property Tax 5,490,816 5,490,816 5,488,839 (1,977) Sales and Use Tax 145,000 145,000 137,067 (7,933) Intergovernmental Revenue 200,000 200,000 311,300 111,300 Charges for Services 13,000 13,000 64,573 51,573 Interest Revenue 3,500 3,500 7,185 3,685 Donations - - - - Miscellaneous Revenues 11,700 11,700 28,016 16,316 Total Resources (in-flows) 5,864,016 5,864,016 6,036,980 172,964
Amounts Available for Appropriation 5,183,410 5,268,803 9,598,837
Charges to Appropriations (out-flows)Salaries and Wages 412,988 471,382 462,821 (8,561) Personnel Benefits 124,300 151,299 151,682 383 Supplies 4,400 4,400 151,085 146,685 Services and Charges 1,279,565 1,279,565 1,142,187 (137,378) Capital Outlays 35,000 35,000 - (35,000) Interfund Payments for Services 3,327,157 3,327,157 3,360,981 33,824 Transfers Out - Amount Charged to Appropriations (out-flows) 5,183,410 5,268,803 5,268,756 (47)
Budgeted Fund Balance, December 31 -$ -$ 4,330,081$
Budgeted Amounts
SKAGIT COUNTY, WASHINGTONMedic I
Schedule of Revenues, Expenditures and Changes in Fund BalanceBudget (GAAP Basis) and Actual
For the Year Ended December 31, 2015
122

Original Budget
Final Budget Actual
Variance with Final Budget
Budgeted Fund Balance, January 1 $ 9,818 $ 9,818 $ 149,166
Resources (in-flows)Charges for Goods and Services 80,000 80,000 75,244 (4,756) Interest Revenue 125 125 171 46 Total Resources (in-flows) 80,125 80,125 75,415 (4,710)
Amounts Available for Appropriation 89,943 89,943 224,581
Charges to Appropriations (out-flows)Salaries and Wages 18,847 18,847 13,729 (5,118) Personnel Benefits 12,496 12,496 10,636 (1,860) Supplies 200 200 110 (90) Services and Charges 8,400 8,400 3,581 (4,819) Capital Outlays - Interfund Payments for Services 50,000 50,000 50,000 - Transfers Out - Amount Charged to Appropriations (out-flows) 89,943 89,943 78,056 (11,887)
Budgeted Fund Balance, December 31 -$ -$ 146,525$
Budgeted Amounts
SKAGIT COUNTY, WASHINGTONCrime Victim Services
Schedule of Revenues, Expenditures and Changes in Fund BalanceBudget (GAAP Basis) and Actual
For the Year Ended December 31, 2015
123

Original Budget
Final Budget Actual
Variance with Final Budget
Budgeted Fund Balance, January 1 $ 641,939
Resources (in-flows)Sales and Use Tax 4,335,000 4,335,000 3,834,098 (500,902) Other Tax - - 64 64 Interest Earnings 570 570 Intergovernmental Revenue 54,500 54,500 49,639 (4,861) Total Resources (in-flows) 4,389,500 4,389,500 3,884,371 (505,129)
Amounts Available for Appropriation 4,389,500 4,389,500 4,526,310
Charges to Appropriations (out-flows)Salaries and Wages - Personnel Benefits - Supplies - Services and Charges 4,389,500 4,389,500 3,863,535 (525,965) Capital Outlays - Interfund Payments for Services - Transfers Out - Amount Charged to Appropriations (out-flows) 4,389,500 4,389,500 3,863,535 (525,965)
Budgeted Fund Balance, December 31 -$ -$ 662,775$
Budgeted Amounts
SKAGIT COUNTY, WASHINGTONCommunication System
Schedule of Revenues, Expenditures and Changes in Fund BalanceBudget (GAAP Basis) and Actual
For the Year Ended December 31, 2015
124

Original Budget
Final Budget Actual
Variance with Final Budget
Budgeted Fund Balance, January 1 $ 26,976 $ 26,976 $ 348,882
Resources (in-flows)Property Tax - - - - Intergovernmental Revenue 12,000 12,000 33,593 21,593 Charges for Goods and Services 2,500 2,500 1,575 (925) Interest Revenue 750 750 1,203 453 Proceeds of Long Term Debt 375,000 375,000 240,012 (134,988) Total Resources (in-flows) 390,250 390,250 276,383 (113,867)
Amounts Available for Appropriation 417,226 417,226 625,265
Charges to Appropriations (out-flows)Salaries and Wages 18,195 23,195 19,431 (3,764) Personnel Benefits 6,531 9,531 8,134 (1,397) Supplies - - - - Services and Charges 352,500 344,500 189,783 (154,717) Capital Outlays - Interfund Payments for Services - - - Transfers Out 40,000 40,000 - (40,000) Amount Charged to Appropriations (out-flows) 417,226 417,226 217,348 (199,878)
Budgeted Fund Balance, December 31 -$ -$ 407,917$
Budgeted Amounts
SKAGIT COUNTY, WASHINGTONWater Quality Fund
Schedule of Revenues, Expenditures and Changes in Fund BalanceBudget (GAAP Basis) and Actual
For the Year Ended December 31, 2015
125
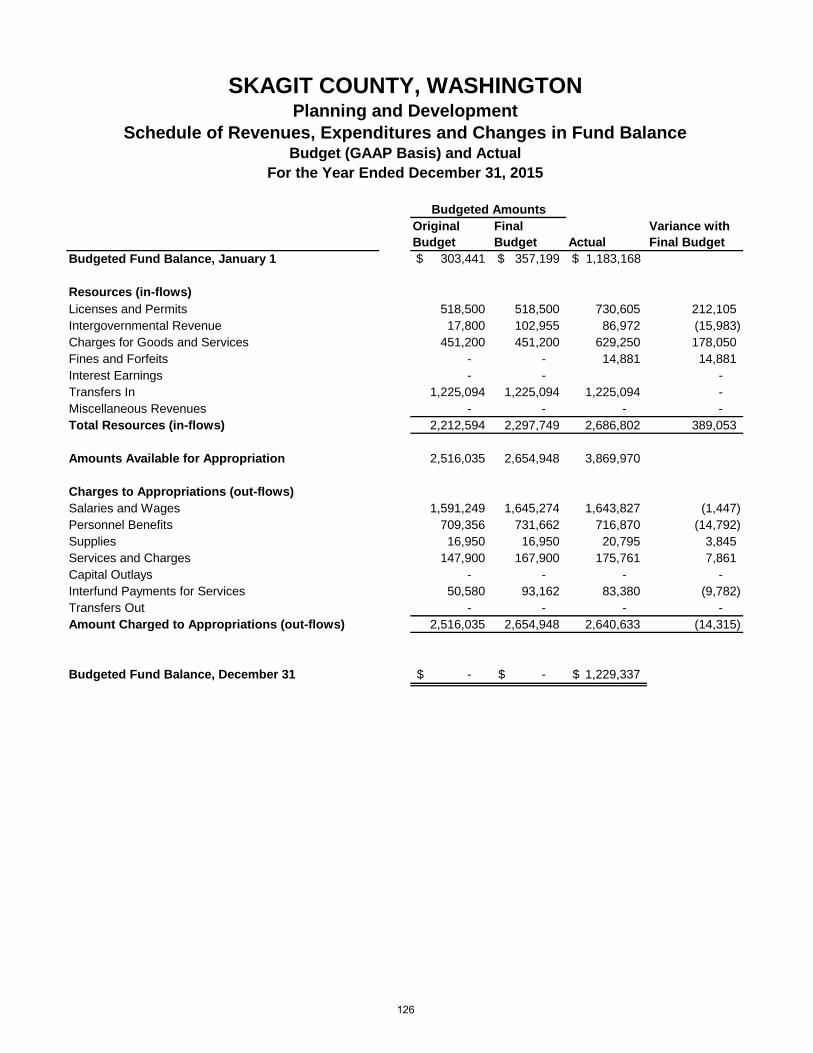
Original Budget
Final Budget Actual
Variance with Final Budget
Budgeted Fund Balance, January 1 $ 303,441 $ 357,199 $ 1,183,168
Resources (in-flows)Licenses and Permits 518,500 518,500 730,605 212,105 Intergovernmental Revenue 17,800 102,955 86,972 (15,983) Charges for Goods and Services 451,200 451,200 629,250 178,050 Fines and Forfeits - - 14,881 14,881 Interest Earnings - - - Transfers In 1,225,094 1,225,094 1,225,094 - Miscellaneous Revenues - - - - Total Resources (in-flows) 2,212,594 2,297,749 2,686,802 389,053
Amounts Available for Appropriation 2,516,035 2,654,948 3,869,970
Charges to Appropriations (out-flows)Salaries and Wages 1,591,249 1,645,274 1,643,827 (1,447) Personnel Benefits 709,356 731,662 716,870 (14,792) Supplies 16,950 16,950 20,795 3,845 Services and Charges 147,900 167,900 175,761 7,861 Capital Outlays - - - - Interfund Payments for Services 50,580 93,162 83,380 (9,782) Transfers Out - - - - Amount Charged to Appropriations (out-flows) 2,516,035 2,654,948 2,640,633 (14,315)
Budgeted Fund Balance, December 31 -$ -$ 1,229,337$
Budgeted Amounts
SKAGIT COUNTY, WASHINGTONPlanning and Development
Schedule of Revenues, Expenditures and Changes in Fund BalanceBudget (GAAP Basis) and Actual
For the Year Ended December 31, 2015
126

Original Budget
Final Budget Actual
Variance with Final Budget
Budgeted Fund Balance, January 1 $ (11,461) $ (11,461) $ 87,508
Resources (in-flows)Other Tax 57,502 57,502 57,034 (468) Interest Earnings - - 156 156 Total Resources (in-flows) 57,502 57,502 57,190 (312)
Amounts Available for Appropriation 46,041 46,041 144,698
Charges to Appropriations (out-flows)Salaries and Wages 4,281 4,281 2,373 (1,908) Personnel Benefits 2,260 2,260 1,166 (1,094) Supplies - - - - Services and Charges 39,500 39,500 39,500 - Capital Outlays - Interfund Payments for Services - - - - Transfers Out - - Amount Charged to Appropriations (out-flows) 46,041 46,041 43,039 (3,002)
Budgeted Fund Balance, December 31 -$ -$ 101,659$
Budgeted Amounts
SKAGIT COUNTY, WASHINGTONLake Management District 1
Schedule of Revenues, Expenditures and Changes in Fund BalanceBudget (GAAP Basis) and Actual
For the Year Ended December 31, 2015
127
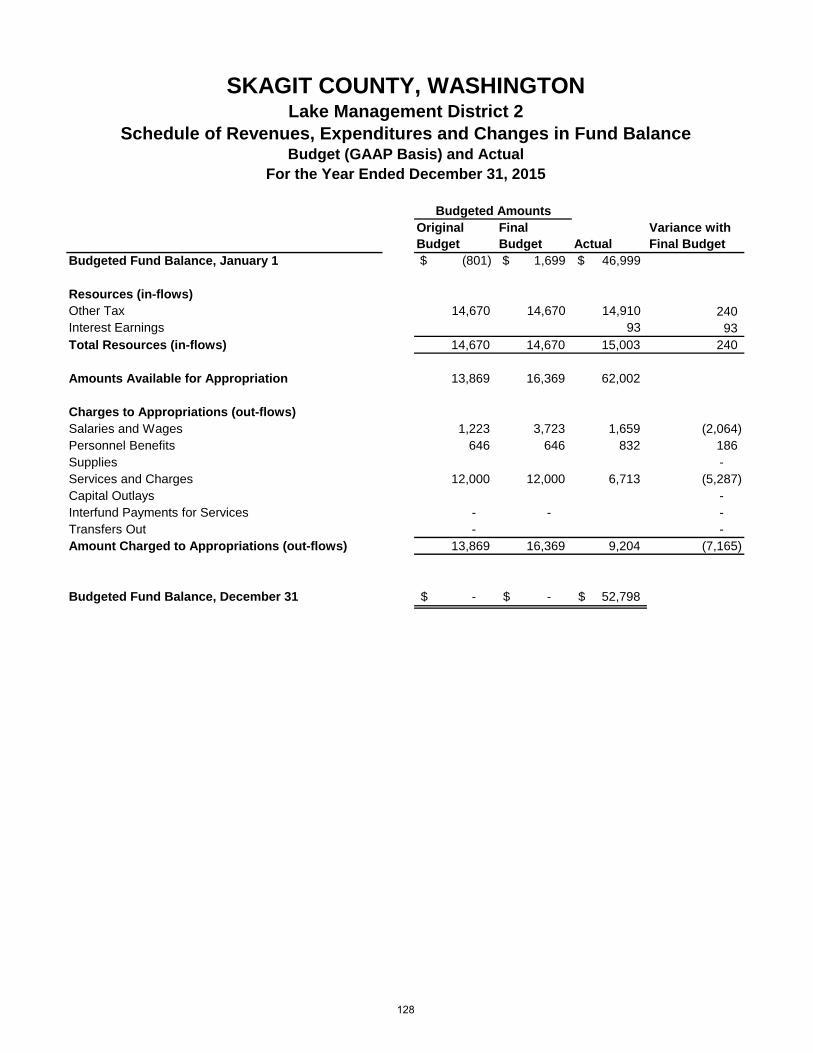
Original Budget
Final Budget Actual
Variance with Final Budget
Budgeted Fund Balance, January 1 $ (801) $ 1,699 $ 46,999
Resources (in-flows)Other Tax 14,670 14,670 14,910 240 Interest Earnings 93 93 Total Resources (in-flows) 14,670 14,670 15,003 240
Amounts Available for Appropriation 13,869 16,369 62,002
Charges to Appropriations (out-flows)Salaries and Wages 1,223 3,723 1,659 (2,064) Personnel Benefits 646 646 832 186 Supplies - Services and Charges 12,000 12,000 6,713 (5,287) Capital Outlays - Interfund Payments for Services - - - Transfers Out - - Amount Charged to Appropriations (out-flows) 13,869 16,369 9,204 (7,165)
Budgeted Fund Balance, December 31 -$ -$ 52,798$
Budgeted Amounts
SKAGIT COUNTY, WASHINGTONLake Management District 2
Schedule of Revenues, Expenditures and Changes in Fund BalanceBudget (GAAP Basis) and Actual
For the Year Ended December 31, 2015
128

Original Budget
Final Budget Actual
Variance with Final Budget
Budgeted Fund Balance, January 1 $ (8,124) $ (7,614) $ 44,149
Resources (in-flows)Other Tax 28,860 28,860 29,006 146 Interest Earnings 109 109 Total Resources (in-flows) 28,860 28,860 29,115 255
Amounts Available for Appropriation 20,736 21,246 73,264
Charges to Appropriations (out-flows)Salaries and Wages 2,446 2,956 2,284 (672) Personnel Benefits 1,290 1,290 1,045 (245) Supplies - - - Services and Charges 17,000 17,000 17,000 - Capital Outlays - Interfund Payments for Services - - - Transfers Out - Amount Charged to Appropriations (out-flows) 20,736 21,246 20,329 (917)
Budgeted Fund Balance, December 31 -$ -$ 52,935$
Budgeted Amounts
SKAGIT COUNTY, WASHINGTONLake Management District 3
Schedule of Revenues, Expenditures and Changes in Fund BalanceBudget (GAAP Basis) and Actual
For the Year Ended December 31, 2015
129

Original Budget
Final Budget Actual
Variance with Final Budget
Budgeted Fund Balance, January 1 $ (867) $ (477) $ 44,857
Resources (in-flows)Other Tax 20,670 20,670 20,085 (585) Interest Earnings 78 78 Total Resources (in-flows) 20,670 20,670 20,163 (507)
Amounts Available for Appropriation 19,803 20,193 65,020
Charges to Appropriations (out-flows)Salaries and Wages 1,835 2,225 1,952 (273) Personnel Benefits 968 968 862 (106) Supplies - Services and Charges 17,000 17,000 12,060 (4,940) Capital Outlays - Interfund Payments for Services - - - Transfers Out - Amount Charged to Appropriations (out-flows) 19,803 20,193 14,874 (5,319)
Budgeted Fund Balance, December 31 -$ -$ 50,146$
Budgeted Amounts
SKAGIT COUNTY, WASHINGTONLake Management District 4
Schedule of Revenues, Expenditures and Changes in Fund BalanceBudget (GAAP Basis) and Actual
For the Year Ended December 31, 2015
130

Original Budget
Final Budget Actual
Variance with Final Budget
Budgeted Fund Balance, January 1 $ 50,000 $ 296,594
Resources (in-flows)Property Tax 43,000 43,000 79,254 36,254 Interest Earnings 467 467 Miscellaneous Revenues - - Total Resources (in-flows) 43,000 43,000 79,721 36,721
Amounts Available for Appropriation 43,000 93,000 376,315
Charges to Appropriations (out-flows)Salaries and Wages - Personnel Benefits - Supplies 1,000 1,000 1,118 118 Services and Charges 42,000 92,000 90,984 (1,016) Capital Outlays - Interfund Payments for Services - Transfers Out - Amount Charged to Appropriations (out-flows) 43,000 93,000 92,102 (898)
Budgeted Fund Balance, December 31 -$ -$ 284,213$
Budgeted Amounts
SKAGIT COUNTY, WASHINGTONEdison Clean Water District
Schedule of Revenues, Expenditures and Changes in Fund BalanceBudget (GAAP Basis) and Actual
For the Year Ended December 31, 2015
131
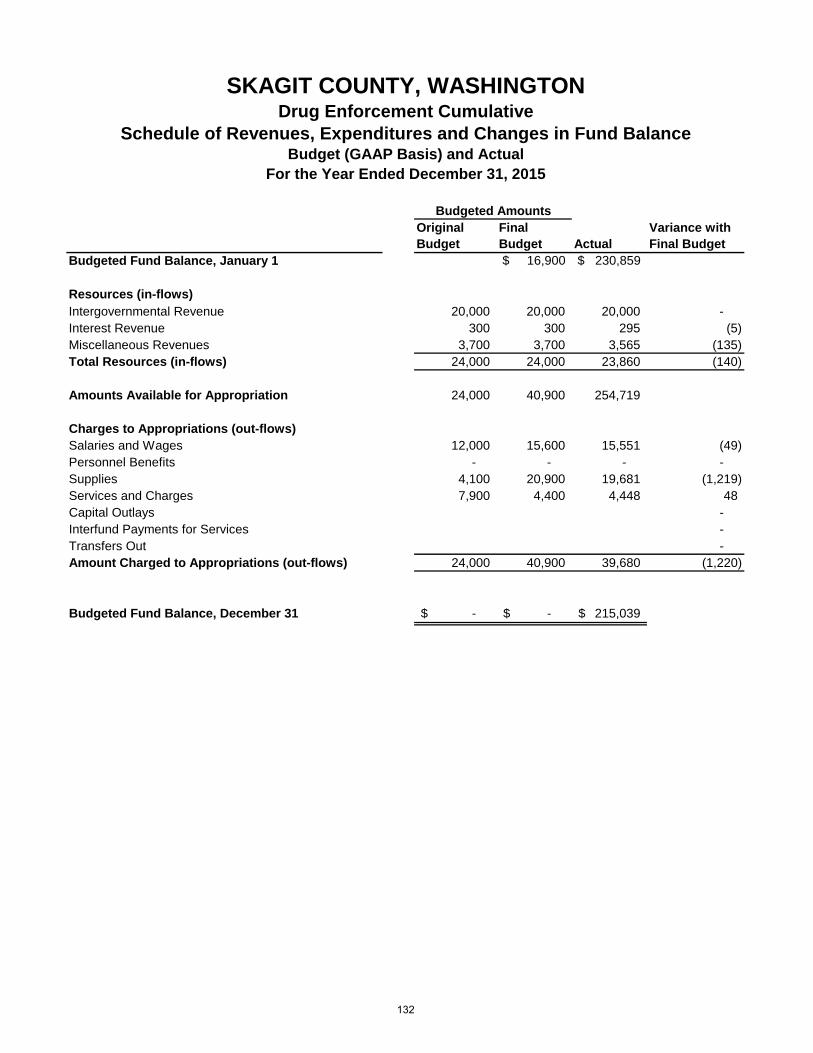
Original Budget
Final Budget Actual
Variance with Final Budget
Budgeted Fund Balance, January 1 $ 16,900 $ 230,859
Resources (in-flows)Intergovernmental Revenue 20,000 20,000 20,000 - Interest Revenue 300 300 295 (5) Miscellaneous Revenues 3,700 3,700 3,565 (135) Total Resources (in-flows) 24,000 24,000 23,860 (140)
Amounts Available for Appropriation 24,000 40,900 254,719
Charges to Appropriations (out-flows)Salaries and Wages 12,000 15,600 15,551 (49) Personnel Benefits - - - - Supplies 4,100 20,900 19,681 (1,219) Services and Charges 7,900 4,400 4,448 48 Capital Outlays - Interfund Payments for Services - Transfers Out - Amount Charged to Appropriations (out-flows) 24,000 40,900 39,680 (1,220)
Budgeted Fund Balance, December 31 -$ -$ 215,039$
Budgeted Amounts
SKAGIT COUNTY, WASHINGTONDrug Enforcement Cumulative
Schedule of Revenues, Expenditures and Changes in Fund BalanceBudget (GAAP Basis) and Actual
For the Year Ended December 31, 2015
132

Original Budget
Final Budget Actual
Variance with Final Budget
Budgeted Fund Balance, January 1 $ 67,350
Resources (in-flows)Intergovernmental Revenue 100,500 100,500 85,695 (14,805) Interest Earnings 100 100 42 (58) Miscellaneous Revenues 2,500 2,500 - (2,500) Total Resources (in-flows) 103,100 103,100 85,737 (17,363)
Amounts Available for Appropriation 103,100 103,100 153,087
Charges to Appropriations (out-flows)Salaries and Wages 46,000 40,015 35,415 (4,600) Personnel Benefits 14,919 12,904 11,917 (987) Supplies 11,306 13,506 11,006 (2,500) Services and Charges 24,400 30,200 33,952 3,752 Capital Outlays 5,000 5,000 - (5,000) Interfund Payments for Services 1,475 1,475 - (1,475) Transfers Out - Amount Charged to Appropriations (out-flows) 103,100 103,100 92,290 (10,810)
Budgeted Fund Balance, December 31 -$ -$ 60,797$
Budgeted Amounts
SKAGIT COUNTY, WASHINGTONBoating Safety
Schedule of Revenues, Expenditures and Changes in Fund BalanceBudget (GAAP Basis) and Actual
For the Year Ended December 31, 2015
133

Original Budget
Final Budget Actual
Variance with Final Budget
Budgeted Fund Balance, January 1 $ 1,000 $ 17,848 $ 224,331
Resources (in-flows)Charges for Goods and Services 104,121 138,000 128,230 (9,770) Interest Revenue 152 152 213 61 Total Resources (in-flows) 104,273 138,152 128,443 (9,709)
Amounts Available for Appropriation 105,273 156,000 352,774
Charges to Appropriations (out-flows)Salaries and Wages - Personnel Benefits - Supplies - Services and Charges 105,273 156,000 118,794 (37,206) Capital Outlays - Interfund Payments for Services - - Transfers Out - Amount Charged to Appropriations (out-flows) 105,273 156,000 118,794 (37,206)
Budgeted Fund Balance, December 31 -$ -$ 233,980$
Budgeted Amounts
SKAGIT COUNTY, WASHINGTONLow-Income Housing Fund
Schedule of Revenues, Expenditures and Changes in Fund BalanceBudget (GAAP Basis) and Actual
For the Year Ended December 31, 2015
134

Original Budget
Final Budget Actual
Variance with Final Budget
Budgeted Fund Balance, January 1 $ 9,104 $ 11,474
Resources (in-flows)Intergovernmental Revenue - 41,246 41,246 - Total Resources (in-flows) - 41,246 41,246 -
Amounts Available for Appropriation - 50,350 52,720
Charges to Appropriations (out-flows)Salaries and Wages - Personnel Benefits - Supplies - Services and Charges - 50,350 42,005 (8,345) Capital Outlays - Interfund Payments for Services - Transfers Out - Amount Charged to Appropriations (out-flows) - 50,350 42,005 (8,345)
Budgeted Fund Balance, December 31 -$ -$ 10,715$
Budgeted Amounts
SKAGIT COUNTY, WASHINGTONTitle III Projects Fund
Schedule of Revenues, Expenditures and Changes in Fund BalanceBudget (GAAP Basis) and Actual
For the Year Ended December 31, 2015
135

Original Budget
Final Budget Actual
Variance with Final Budget
Budgeted Fund Balance, January 1 $ 182,353
Resources (in-flows)Sales and Use Tax - - Intergovernmental 13,935 13,935 Services and Charges 13,290 13,290 Interest Revenue - - 545 545 Total Resources (in-flows) - - 27,770 27,770
Amounts Available for Appropriation - - 210,123
Charges to Appropriations (out-flows)Salaries and Wages - - - - Personnel Benefits - Supplies - Services and Charges - Capital Outlays - Interfund Payments for Services - Transfers Out - Amount Charged to Appropriations (out-flows) - - - -
Budgeted Fund Balance, December 31 -$ -$ 210,123$
Budgeted Amounts
SKAGIT COUNTY, WASHINGTONTreasurer's Reet
Schedule of Revenues, Expenditures and Changes in Fund BalanceBudget (GAAP Basis) and Actual
For the Year Ended December 31, 2015
136

Original Budget
Final Budget Actual
Variance with Final Budget
Budgeted Fund Balance, January 1 $ 51,544 $ 16,560 $ 194,773
Resources (in-flows)Intergovernmental Revenue - 24,825 (24,825) Charges for Goods and Services 517,801 662,000 653,795 (8,205) Interest Revenue 1,440 1,440 43 (1,397) Total Resources (in-flows) 519,241 688,265 653,838 (9,602)
Amounts Available for Appropriation 570,785 704,825 848,611
Charges to Appropriations (out-flows)Salaries and Wages - 16,486 (16,486) Personnel Benefits 8,339 (8,339) Supplies - Services and Charges 570,785 680,000 656,239 (23,761) Capital Outlays - Interfund Payments for Services 3,125 3,125 Transfers Out - Amount Charged to Appropriations (out-flows) 570,785 704,825 659,364 (45,461)
Budgeted Fund Balance, December 31 -$ -$ 189,247$
Budgeted Amounts
SKAGIT COUNTY, WASHINGTONHomeless Housing
Schedule of Revenues, Expenditures and Changes in Fund BalanceBudget (GAAP Basis) and Actual
For the Year Ended December 31, 2015
137

Original Budget
Final Budget Actual
Variance with Final Budget
Budgeted Fund Balance, January 1 $ 208,284
Resources (in-flows)Intergovernmental Revenue 145,761 145,761 146,031 270 Charges for Goods and Services 1,500 1,500 20 (1,480) Fines and Forfeits 270,450 270,450 105,273 (165,177) Interest Revenue 300 300 118 (182) Miscellaneous Revenues 8,000 8,000 9,645 1,645 Total Resources (in-flows) 426,011 426,011 261,087 (164,924)
Amounts Available for Appropriation 426,011 426,011 469,371
Charges to Appropriations (out-flows)Salaries and Wages 50,362 50,362 48,576 (1,786) Personnel Benefits 27,399 27,399 26,664 (735) Supplies 22,500 22,500 10,350 (12,150) Services and Charges 270,750 270,750 115,801 (154,949) Capital Outlays 20,000 20,000 21,940 1,940 Interfund Payments for Services 35,000 35,000 30,271 (4,729) Transfers Out - Amount Charged to Appropriations (out-flows) 426,011 426,011 253,602 (172,409)
Budgeted Fund Balance, December 31 -$ -$ 215,769$
Budgeted Amounts
SKAGIT COUNTY, WASHINGTONInterlocal Investigation
Schedule of Revenues, Expenditures and Changes in Fund BalanceBudget (GAAP Basis) and Actual
For the Year Ended December 31, 2015
138

SKAGIT COUNTY, WASHINGTON
NONMAJOR DEBT SERVICE FUND
The Debt Service Fund is established to account for the accumulation of resources and the payment of expenditures, principal and interest for certain debt service arrangements.
For the Year Ended December 31, 2015
139

SKAGIT COUNTY, WASHINGTON BALANCE SHEET
Combining Nonmajor Debt Service FundAs of December 31, 2015
ASSETS AND OTHER DEBITS: TOTALSASSETS: Cash $302,762 Investments 1,083,184 Accounts Receivable 20 Interfund Loans ReceivableTOTAL ASSETS $1,385,965
LIABILITIES AND FUND BALANCESLIABILITIES Unearned Revenue - Interfund Loans Payable 1,000 TOTAL LIABILITIES 1,000
Deferred Inflow of Resources 20
FUND BALANCESReserved for Debt Service 1,384,945TOTAL FUND BALANCES 1,384,945
TOTAL LIABILITIES AND FUND BALANCES 1,385,965
140

SKAGIT COUNTY, WASHINGTON Combing Statement of Revenues, Expenditures
And Changes in Fund BalancesDEBT SERVICE FUND
For the Year Ended December 31, 2015
REVENUES: TotalInterest Revenue $70,216Miscellaneous Revenues 345,161TOTAL REVENUES 415,377
EXPENDITURES:Debt Service: Principal 1,469,334 Debt Service: Interest and Related Costs 681,870 TOTAL EXPENDITURES 2,151,204
EXCESS (DEFICIENCY) OF REVENUES OVER EXPENDITURES (1,735,827)
OTHER FINANCING SOURCES (USES): Transfers In 1,388,744 Proceeds of Long Term Debt 574,719 TOTAL OTHER FINANCING SOURCES (USES) 1,963,463
EXCESS (DEFICIENCY) OF REVENUES AND OTHER FINANCING SOURCES OVER EXPENDITURES AND OTHER FINANCING USES 227,636
FUND BALANCES:Fund Balance, January 1 1,157,309 FUND BALANCE, DECEMBER 31 1,384,945
141

Original Budget Final Budget Actual
Variance with Final Budget
Budgeted Fund Balance, January 1 $ (61,212) $ (61,212) $ 1,157,309
Resources (in-flows)Intergovernmental Revenues - - Transfers In 1,967,699 1,967,699 1,963,465 (4,234) Interest Revenue 61,796 61,796 70,216 8,420 Other Revenue 313,614 313,614 345,161 31,547 Total Resources (in-flows) 2,343,109 2,343,109 2,378,842 35,733
Amounts Available for Appropriation 2,281,897 2,281,897 3,536,151
Charges to Appropriations (out-flows)Debt Service - Principal 1,552,605 1,552,605 1,469,334 (83,271) Interest 729,292 729,292 681,870 (47,422) Transfers Out - - - - Amount Charged to Appropriations (out-flows) 2,281,897 2,281,897 2,151,204 (130,693)
Budgeted Fund Balance, December 31 -$ -$ 1,384,945$
Budgeted Amounts
SKAGIT COUNTY, WASHINGTONDebt Service
Schedule of Revenues, Expenditures and Changes in Fund BalanceBudget (GAAP Basis) and ActualFor the Year Ended December 31, 2015
142

SKAGIT COUNTY, WASHINGTONNONMAJOR CAPITAL PROJECT FUNDS
Facility Improvement Fund - A fund established in 1978 to account for the expenses incurred ininvestigation, planning, construction, improvement, replacement, repair, acquisition of property, property rights,facilities and equipment of public facilities.
Capital Improvements Fund - A fund established in 1990 to account for the expenses incurred in improvingand maintaining capital facilities.
Distressed County Public Improvement Fund - A fund established to collect the 0.04% distressed Countysales and use tax as authorized by RCW 82.14.370 and authorized by the Board of County Commissioners.The fund will also be utilized for expending proceeds from the tax for financing and construction of publicfacilities.
Park Improvement Fund - A fund established to provide for accounting for the expenses incurred ininvestigation, planning, construction, improvement, replacement, repair, acquisition of property, property rights,facilities, and equipment.
143

SKAGIT COUNTY, WASHINGTONBALANCE SHEET
NONMAJOR CAPITAL PROJECTS FUNDSAs of December 31, 2015
DISTRESSEDFACILITY CAPITAL PUBLIC PARKS 2015
ASSETS: IMPROVEMENTS IMPROVEMENT IMPROVEMENTS IMPROVEMENT TOTALSASSETS: Cash $1,194,469 $1,869,962 $3,613,268 $252,644 $6,930,343 Investments - 1,649,302 3,718,821 - $5,368,123 Due from Other Funds - - - $0 Due from another government unit - 419,828 $419,828 Interfund Loan Receivable - - - - 0TOTAL ASSETS 1,194,469 3,519,264 7,751,917 252,644 $12,718,294
LIABILITIES AND FUND BALANCESLIABILITIES: Accounts/vouchers payable 458,260 - 20,304 15,963 494,528 Due to other funds - - - - Unearned Revenue - - - 0TOTAL LIABILITIES 458,260 - 20,304 15,963 $494,528
FUND BALANCES Fund balances:Nonspendable - - - -
Restricted 736,209 3,519,265 7,731,614 236,681 12,223,768 Committed - Unassigned - - - - - TOTAL FUND BALANCES 736,209 3,519,265 7,731,614 236,681 $12,223,768
TOTAL LIABILITIES AND FUND BALANCES $1,194,469 $3,519,265 $7,751,917 $252,644 $12,718,295
144

SKAGIT COUNTY, WASHINGTONCOMBINING STATEMENT OF REVENUES, EXPENDITURES AND CHANGES
IN FUND BALANCENONMAJOR CAPITAL PROJECTS FUNDS
For the Year Ended December 31, 2015
Facility CAPITAL DISTRESSED PARKIMPROVEMENTS IMPROVEMENTS PUBLIC IMPROVEMENT 2015
REVENUES: FUND FUND IMPROVEMENT FUND TOTALS Property Taxes $0 $1,490,696 $1,490,696 ExciseTaxes $2,413,461 $0 $2,413,461 Intergovernmental Revenue - - - $0 Charges for Goods and Services - - - 13,460 $13,460 Interest Revenue 3,748 5,334 12,479 $21,561 Other Revenue - - - - TOTAL REVENUES 3,748 1,496,030 2,425,940 13,460 3,939,179
EXPENDITURES:Current - - - - - Economic Environment 150,179 - 150,179 Culture and Recreation - 137,371 137,371
- Capital Outlay 1,757,874 - - 326,386 2,084,260 Total Expenditures 1,757,874 - 150,179 463,757 2,371,810
TOTAL EXPENDITURES 1,757,874 - 150,179 463,757 2,371,810
EXCESS (DEFICIENCY) OF REVENUES OVER EXPENDITURES (1,754,126) 1,496,030 2,275,762 (450,297) 1,567,369
OTHER FINANCING SOURCES (USES): Issuance of Long Term Debt - - - - - Proceeds of Capital Assets 325,000 - - - 325,000 Transfers In 300,000 - 291,065 591,065 Transfers Out - (1,588,163) (591,646) - (2,179,809) TOTAL OTHER FINANCING SOURCES (USES) 625,000 (1,588,163) (591,646) 291,065 (1,263,744)
EXCESS (DEFICIENCY) OF REVENUES AND OTHER FINANCING SOURCES OVER EXPENDITURES AND OTHER FINANCING USE (1,129,126) (92,132) 1,684,116 (159,232) 303,625
FUND BALANCES: Fund Balance, January 1 1,865,335 3,611,397 6,047,498 395,913 11,920,143 Prior Period Adjustment - FUND BALANCE, DECEMBER 31 $736,209 $3,519,265 $7,731,614 236,681 12,223,768
145
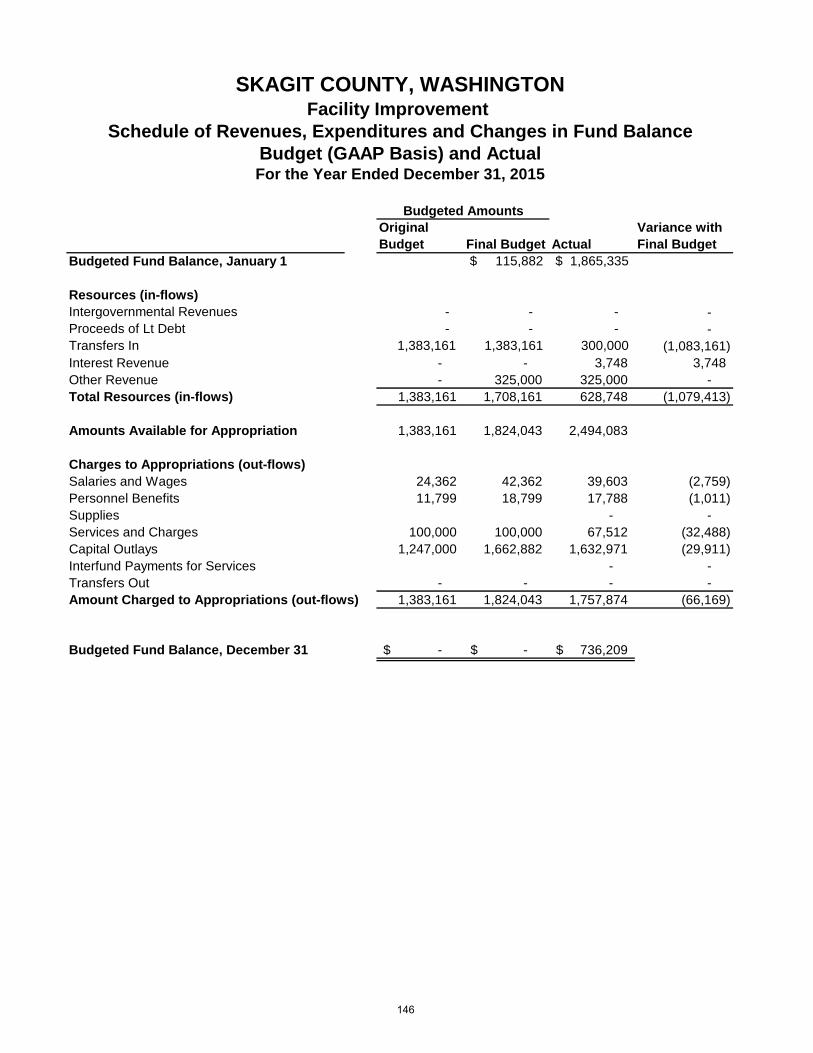
Original Budget Final Budget Actual
Variance with Final Budget
Budgeted Fund Balance, January 1 $ 115,882 $ 1,865,335
Resources (in-flows)Intergovernmental Revenues - - - - Proceeds of Lt Debt - - - - Transfers In 1,383,161 1,383,161 300,000 (1,083,161) Interest Revenue - - 3,748 3,748 Other Revenue - 325,000 325,000 - Total Resources (in-flows) 1,383,161 1,708,161 628,748 (1,079,413)
Amounts Available for Appropriation 1,383,161 1,824,043 2,494,083
Charges to Appropriations (out-flows)Salaries and Wages 24,362 42,362 39,603 (2,759) Personnel Benefits 11,799 18,799 17,788 (1,011) Supplies - - Services and Charges 100,000 100,000 67,512 (32,488) Capital Outlays 1,247,000 1,662,882 1,632,971 (29,911) Interfund Payments for Services - - Transfers Out - - - - Amount Charged to Appropriations (out-flows) 1,383,161 1,824,043 1,757,874 (66,169)
Budgeted Fund Balance, December 31 -$ -$ 736,209$
Budgeted Amounts
SKAGIT COUNTY, WASHINGTONFacility Improvement
Schedule of Revenues, Expenditures and Changes in Fund BalanceBudget (GAAP Basis) and ActualFor the Year Ended December 31, 2015
146
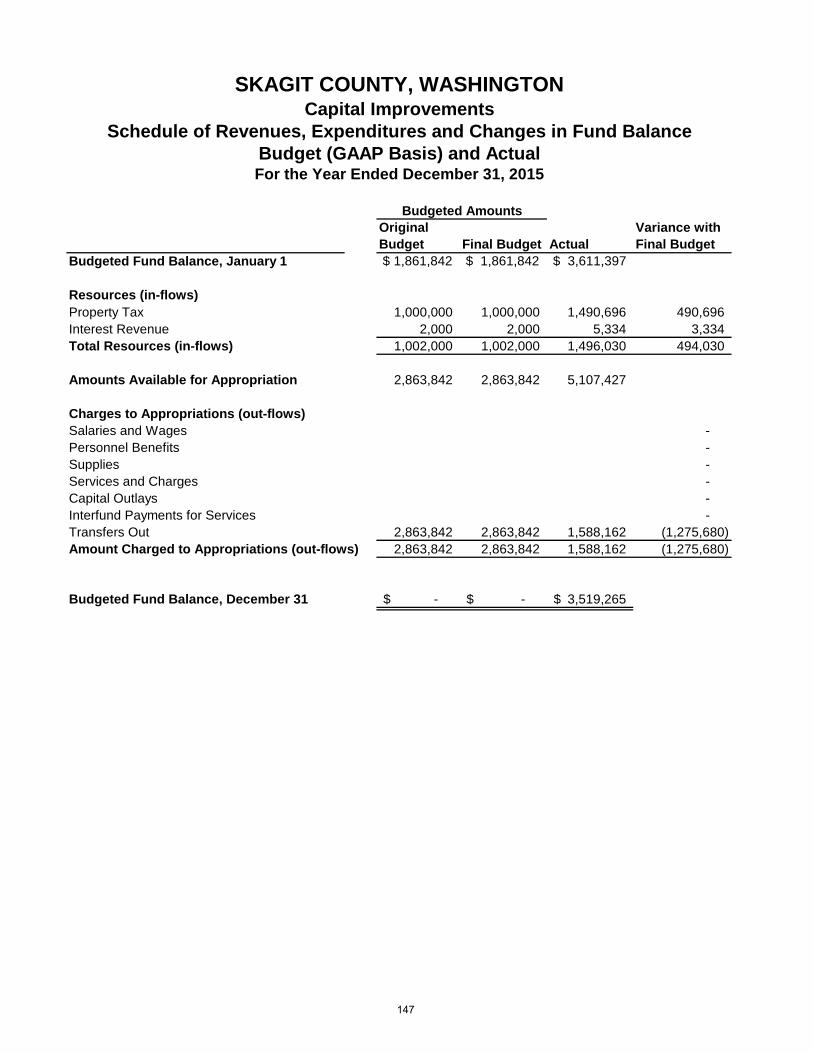
Original Budget Final Budget Actual
Variance with Final Budget
Budgeted Fund Balance, January 1 $ 1,861,842 $ 1,861,842 $ 3,611,397
Resources (in-flows)Property Tax 1,000,000 1,000,000 1,490,696 490,696 Interest Revenue 2,000 2,000 5,334 3,334 Total Resources (in-flows) 1,002,000 1,002,000 1,496,030 494,030
Amounts Available for Appropriation 2,863,842 2,863,842 5,107,427
Charges to Appropriations (out-flows)Salaries and Wages - Personnel Benefits - Supplies - Services and Charges - Capital Outlays - Interfund Payments for Services - Transfers Out 2,863,842 2,863,842 1,588,162 (1,275,680) Amount Charged to Appropriations (out-flows) 2,863,842 2,863,842 1,588,162 (1,275,680)
Budgeted Fund Balance, December 31 -$ -$ 3,519,265$
Budgeted Amounts
SKAGIT COUNTY, WASHINGTONCapital Improvements
Schedule of Revenues, Expenditures and Changes in Fund BalanceBudget (GAAP Basis) and ActualFor the Year Ended December 31, 2015
147

Original Budget Final Budget Actual
Variance with Final Budget
Budgeted Fund Balance, January 1 $(1,425,451) $ (1,425,451) $ 6,047,498
Resources (in-flows)Sales and Use Tax 2,200,000 2,200,000 2,413,462 213,462 Interest Revenue 5,300 5,300 12,479 7,179 Total Resources (in-flows) 2,205,300 2,205,300 2,425,941 220,641
Amounts Available for Appropriation 779,849 779,849 8,473,439
Charges to Appropriations (out-flows)Salaries and Wages - Personnel Benefits - Supplies - Services and Charges 75,002 75,002 75,179 177 Capital Outlays - Interfund Payments for Services 113,200 113,200 75,000 (38,200) Transfers Out 591,647 591,647 591,646 (1) Amount Charged to Appropriations (out-flows) 779,849 779,849 741,825 (38,024)
Budgeted Fund Balance, December 31 -$ -$ 7,731,614$
Budgeted Amounts
SKAGIT COUNTY, WASHINGTONDistressed Public Improvement
Schedule of Revenues, Expenditures and Changes in Fund BalanceBudget (GAAP Basis) and ActualFor the Year Ended December 31, 2015
148
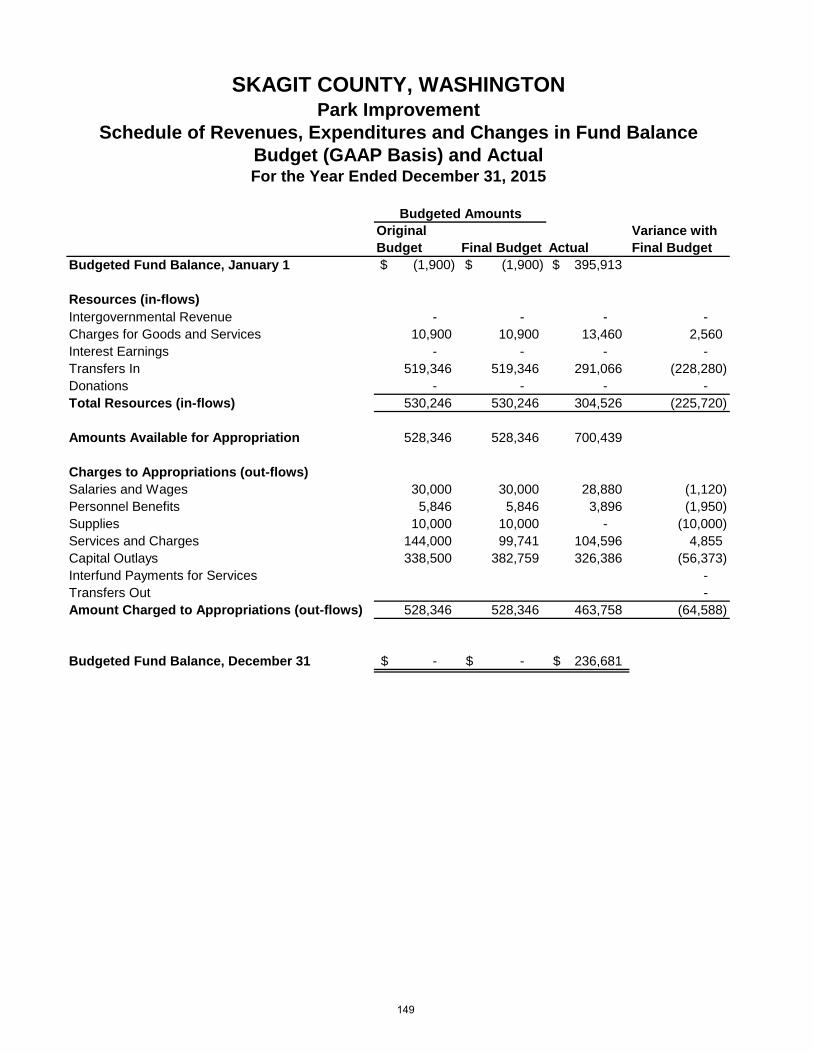
Original Budget Final Budget Actual
Variance with Final Budget
Budgeted Fund Balance, January 1 $ (1,900) $ (1,900) $ 395,913
Resources (in-flows)Intergovernmental Revenue - - - - Charges for Goods and Services 10,900 10,900 13,460 2,560 Interest Earnings - - - - Transfers In 519,346 519,346 291,066 (228,280) Donations - - - - Total Resources (in-flows) 530,246 530,246 304,526 (225,720)
Amounts Available for Appropriation 528,346 528,346 700,439
Charges to Appropriations (out-flows)Salaries and Wages 30,000 30,000 28,880 (1,120) Personnel Benefits 5,846 5,846 3,896 (1,950) Supplies 10,000 10,000 - (10,000) Services and Charges 144,000 99,741 104,596 4,855 Capital Outlays 338,500 382,759 326,386 (56,373) Interfund Payments for Services - Transfers Out - Amount Charged to Appropriations (out-flows) 528,346 528,346 463,758 (64,588)
Budgeted Fund Balance, December 31 -$ -$ 236,681$
Budgeted Amounts
SKAGIT COUNTY, WASHINGTONPark Improvement
Schedule of Revenues, Expenditures and Changes in Fund BalanceBudget (GAAP Basis) and ActualFor the Year Ended December 31, 2015
149

THIS PAGE INTENTIONALLY LEFT BLANK
150

Nonmajor Enterprise Funds
151

SKAGIT COUNTY, WASHINGTON
NONMAJOR ENTERPRISE FUNDS
For the Year ended December 31, 2015, Skagit County has no Nonmajor Enterprise Funds.
152

Internal Service Funds
153

SKAGIT COUNTY, WASHINGTONINTERNAL SERVICE FUNDS
Internal Service Funds are established to account for the financing of goods or services provided by onedepartment, agency, or government to other departments or agencies of Skagit County, or to othergovernments, on a cost reimbursable basis.
Equipment Rental Fund - A fund to finance the maintenance, operations, and acquisition of goods usedby the Public Works Department and other County Funds.
Insurance Services Fund - A fund established for risk management activities, including settlement anddefense of lawsuits and third-party claims to all tortious conduct.
Central Services Fund - A fund established to account for information systems, geographic information systems and records management on a county-wide basis pursuant to RCW 36.92
Unemployment Compensation Fund - A fund established to finance and account for unemploy-ment claims against the County.
154

SKAGIT COUNTY, WASHINGTONCombining Statement of Net Position
Internal Service FundsDecember 31, 2015
Equipment Insurance Central Unemployment Rental Service Services Compensation #
Assets Fund Fund Fund Fund TotalCurrent Assets
Cash and Cash Equivalents $6,047,356 $10,553,490 $1,273,206 $550,589 $18,424,641Accounts Receivable 1,140 - 439 - 1,579 Due From Other Funds # 1,494,156 1,552,935 1,526,518 - 4,573,608 Due From Other Governments 19,699 19,699 Inventories and Prepayments 4,920,342 - - - 4,920,342 Total Current Assets 12,462,994 12,106,425 2,819,862 550,589 27,939,870
Noncurrent AssetsCapital Assets Buildings 180,888 - - - 180,888 Machinery and Equipment 17,360,860 - 1,798,855 - 19,159,715 Less Accumulated Depreciation (8,534,945) - (1,327,218) - (9,862,162) Total noncurrent assets 9,006,803 - 471,637 - 9,478,440
Total Assets 21,469,797 12,106,425 3,291,499 550,589 37,418,311
Deferred Outflows of Resources 49,254 28,925 224,750 302,929
Liabilities and Fund EquityCurrent Liabilities
Accounts/Vouchers Payable 128,815 27,879 160,392 12,100 329,186 Claims and Judgements Payable 2,693,340 2,693,340 Accrue Wages Payable 23,856 12,658 98,155 32,840 167,509 Due to other Funds 1,567,353 60,893 1,628,246 Accrued Employee Benefits 5,446 2,612 20,468 - 28,525 Other Accrued Liabilities 26,997 - 27 - 27,024 Total Current Liabilities 1,752,466 2,797,381 279,042 44,940 4,873,829
Non-Current LiabilitiesCompensated Absences 44,354 17,144 183,857 245,355 Environmental Liability 113,533 113,533 Net Pension Liability 453,842 266,517 2,070,896 - 2,791,255 Total Non-Current Liabilities 611,729 283,661 2,254,754 - 3,150,143
- Total Liabilities 2,364,195 3,081,042 2,533,795 44,940 8,023,972
Deferred Inflows of Resources 68,378 40,155 312,013 420,547
Net Position Net Investment in Capital Assets, 9,006,803 - 471,637 - 9,478,440 Unrestricted 10,079,675 9,014,152 198,804 505,650 19,798,281 Total Net Position 19,086,478$ 9,014,152$ 670,441$ 505,650$ 29,276,721$
155

SKAGIT COUNTY, WASHINGTONCombining Statement of Revenues, Expenses and Changes in Fund Net Position
Internal Service FundsDecember 31, 2015
Equipment Insurance Central UnemploymentRental Services Services Compensation
Operating Revenues: Fund Fund Fund Fund TotalCharges For Services $5,792,536 $1,554,116 $6,458,471 $650,317 14,455,440$ Miscellaneous 56,485 13,124,884 0 13,181,369 Total Operating Revenue 5,849,021 14,679,000 6,458,471 650,317 27,636,809
Operating Expenses:Personal services 884,597 454,589 3,492,860 206,328 5,038,374 Contractural services - 2,162,574 - 2,162,574 Other supplies and expenses 4,028,273 106,514 2,942,141 - 7,076,928 Depreciation 1,015,997 - 176,980 - 1,192,977 Payment to Claimants - 13,099,018 - 63,158 13,162,176 Total Operating Expenses 5,928,867 15,822,694 6,611,981 269,486 28,633,029
Operating Income (Loss) (79,846) (1,143,694) (153,510) 380,831 (996,220)
Non-Operating Revenues (Expenses):Interest Revenue 5,833 6,233 - 12,066 Miscellaneous Revenue 3,586 - 3,586 Gain (Loss) on Fixed Asset Disposal (101,811) (12,364) - (114,175) Miscellaneous Expense 4,818 - - 4,818 Total non-operating revenues (91,161) 6,233 (8,777) - (93,705)
Net Income (Loss) Before Operating Transfers (171,007) (1,137,461) (162,288) 380,831 (1,089,925) Contributions and Special Items
Transfers In 34,500 - - 34,500Transfers Out - - -
Changes in Net Position (136,507) (1,137,461) (162,288) 380,831 (1,055,425)
Net Position as of January 1 19,691,734 10,396,260 2,829,394 124,819 33,042,207Prior Period Correction (468,749) (244,647) (1,996,666) (2,710,061)Net Position as of December 31 19,086,478 9,014,152 670,441 505,650 29,276,721
156

SKAGIT COUNTY, WASHINGTONCombining Statement of Cash Flow
Internal Service FundsDecember 31, 2015
Equipment Insurance Central UnemploymentRental Service Services Compensation
Cash Flows From Operating Activities: Fund Fund Fund Fund TotalReceipts from Customers $206,375 $2,442,661 $595,409 $0 $3,244,445Receipts from interfund services provided 5,585,385 12,511,391 5,506,894 650,316 24,253,986Payments to Employees (890,017) (405,120) (3,313,590) (313,890) (4,922,617)Payments to Suppliers (2,293,153) (1,376,032) (2,870,893) - (6,540,078)Payments to Claimants (13,123,522) - (62,571) (13,186,093)Payments for interfund services used (1,624,782) (96,690) (11,340) - (1,732,812)Miscellaneous receipts(payments) 25,350 (89,935) 3,586 - (60,999) Net cash provided (used) by operating activities 1,009,158 (137,247) (89,934) 273,855 1,055,832
Cash Flows From Non-Capital And Related Financing Activities Transfers to Other Funds - - - - Transfers From Other Funds 34,500 - - - 34,500 Net cash provided (used) by Non-Capital and related financing activities 34,500 - - - 34,500
Cash Flows From Capital And Related Financing ActivitiesCapital Grant Received - - - - Proceeds from sale of capital assets (1,528,656) - (264,086) - (1,792,742) Purchases of capital assets 139,819 - 176,895 - 316,714 Net cash provided (used) by capital and related financing activities (1,388,837) - (87,191) - (1,476,028)
Cash Flows From Investing Activities:Interest Received 5,833 6,233 - - 12,066 Net Cash Provided by Investing Activities 5,833 6,233 - - 12,066
Net Increase in Cash & Cash Equivalents (339,346) (131,014) (177,125) 273,855 (373,630)
Balances as of January 1 6,386,702 10,684,504 1,450,332 276,734 18,798,272 Balances as of December 31 6,047,356 10,553,490 1,273,206 550,589 18,424,642
Operating Income/(Loss) (79,846) (1,143,694) (153,510) 380,831 (996,220)
157

SKAGIT COUNTY, WASHINGTONCombining Reconciliation of Operating Income to Net Cash Provided
Internal Service FundsDecember 31, 2015
Equipment Insurance Central UnemploymentRental Service Services Compensation #Fund Fund Fund Fund Total
Reconciliation of Operating Income (Loss)to Net Cash Provided (Used) by Operating Activities
Operating Income (Loss) ### (79,846)$ (1,143,694)$ (153,510)$ 380,831$ (996,220)
Adjustments to Reconcile Operating Income toNet Cash Provided (Used) by Operating Activities:
Depreciation Expense 1,015,998 176,980 1,192,978 Miscellaneous Receipts 25,192 - 3,586 28,778 Changes in Assets and Liabilities: - Receivables, Net (57,262) 418,534 (356,607) - 4,665 Prepayables - - - - Inventories 89,952 89,952 Accounts and Other Payables 14,966 587,913 239,617 (106,976) 735,520
Net Cash Provided (Used) by Operating Activities 1,009,000$ (137,247)$ (89,934)$ 273,855$ 1,055,674$
158

Agency Funds
159

SKAGIT COUNTY, WASHINGTON
AGENCY FUNDS Agency Funds are established to account for assets Skagit County holds in the capacity of agent. Many independent taxing districts are required by Washington State statutes to process all monies through the county treasurer. These Agency Funds are custodial in nature and do not present results of operations or have a measurement focus. Agency Funds Include: Cemetery Districts Cities & Towns Council of Governments Dike & Drainage Districts Fidalgo Parks & Recreation Fire Districts Hospital Districts Library Districts North Sound Regional Support Network Northwest Clean Aid Agency Payroll/Claims Clearing Port Districts Public Facilities District School Districts Sewer Districts Skagit Community Network Skagit Council of Governments Skagit Emergency Communications Center Skagit Transit & Housing Authority State Trust Treasurer’s Trust Suspense Water Districts
160

SKAGIT COUNTY, WASHINGTONCOMBINING BALANCE SHEET
As of December 31, 2015
ASSETSTRUST FUNDS
CLEARING FUNDS
STATE FUNDS
NW CLEAN AIR AGENCY FUNDS
Cash 345,166$ 3,589,489$ 810,718$ 22,856$ Investments 6,103,278 Taxes Receivable 883,017 Deposits - TOTAL ASSETS 345,166 3,589,489 1,693,735 6,126,134
LIABILITIESWarrants Payable 3,532,771 Custodial Accounts 345,166 56,718 1,693,735 6,126,134 TOTAL LIABILITIES 345,166$ 3,589,489$ 1,693,735$ 6,126,134$
ASSETSLIBRARY FUNDS
SKAGIT HOUSING
FUND
CITIES AND TOWNS FUNDS
PORT OF ANACORTES
FUNDSCash 736,209$ 1,000$ 336,713$ 960,206$ Investments 1,826,011 708,183 9,145,187 Taxes Receivable 48,388 387,550 7,869 DepositsTOTAL ASSETS 2,610,608 709,183 724,263 10,113,262
LIABILITIESWarrants Payable 14,545 182,790 Custodial Accounts 2,596,063 709,183 724,263 9,930,472 TOTAL LIABILITIES 2,610,608$ 709,183$ 724,263$ 10,113,262$
161

SKAGIT COUNTY, WASHINGTONCOMBINING BALANCE SHEET
As of December 31, 2015
ASSETSCashInvestmentsTaxes ReceivableDepositsTOTAL ASSETS
LIABILITIESWarrants PayableCustodial AccountsTOTAL LIABILITIES
ASSETSCashInvestmentsTaxes ReceivableDepositsTOTAL ASSETS
LIABILITIESWarrants PayableCustodial AccountsTOTAL LIABILITIES
COUNCIL OF GOVERNMENTS
FUNDSFIDALGO
PARK FUNDSAFFILIATED HEALTH
SERVICES FUNDS76,627$ 397,224$ 401$
883,007 226,205 46,397 9,134
959,634 632,563 46,798
14,866 - 401 944,768 632,563 46,398 959,634$ 632,563$ 46,799$
PORT OF SKAGIT FUNDS
DIKE DISTRICTS
FUNDS
SKAGIT TRANSPORTATION
FUNDS460,817$ 7,366,310$
6,643,674 6,626,892 8,527,275 61,439 165,077
7,165,930 14,158,279 8,527,275
303,278 66,548 6,862,652 14,091,731 8,527,275 7,165,930$ 14,158,279$ 8,527,275$
162

SKAGIT COUNTY, WASHINGTONCOMBINING BALANCE SHEET
As of December 31, 2015
ASSETSCashInvestmentsTaxes ReceivableDepositsTOTAL ASSETS
LIABILITIESWarrants PayableCustodial AccountsTOTAL LIABILITIES
ASSETSCashInvestmentsTaxes ReceivableDepositsTOTAL ASSETS
LIABILITIESWarrants PayableCustodial AccountsTOTAL LIABILITIES
HOSPITAL DISTRICT 1
FUNDS
HOSPITAL DISTRICT 2
FUNDS
HOSPITAL DISTRICT 304
FUNDS
WATER DISTRICT
FUNDS3,025,016$ 1,600,027$ 517,976$ 52,333$
144,400,109 29,476,500 14,446,402 227,721 99,878 48,455 31,712
147,525,003 31,124,982 14,996,090 280,054
1,859,068 1,227,840 426,267 - 145,665,935 29,897,142 14,569,823 280,054 147,525,003$ 31,124,982$ 14,996,090$ 280,054$
DRAINAGE DISTRICT
FUNDS
SCHOOL DISTRICTS
FUNDS
CEMETARY DISTRICTS
FUNDS
SKAGIT COMMUNITY NETWORK
477,555$ 18,238,368$ 197,569$ 1,801$ 1,150,725 107,607,505 640,047
21,837 1,728,293 5,372
1,650,117 127,574,166 842,988 1,801
20,765 11,458,755 5,141 1,629,352 116,115,411 837,847 1,801 1,650,117$ 127,574,166$ 842,988$ 1,801$
163

SKAGIT COUNTY, WASHINGTONCOMBINING BALANCE SHEET
As of December 31, 2015
ASSETSCashInvestmentsTaxes ReceivableDepositsTOTAL ASSETS
LIABILITIESWarrants PayableCustodial AccountsTOTAL LIABILITIES
ASSETSCashInvestmentsTaxes ReceivableDepositsTOTAL ASSETS
LIABILITIESWarrants PayableCustodial AccountsTOTAL LIABILITIES
SEWER DISTRICT
FUNDSFIRE DISTRICT
FUNDS
NORTH SOUND RSN
FUNDS324,877$ 2,745,555$ 1,879,877$ 466,174 4,067,239 62,245,340
775 160,660
791,826 6,973,454 64,125,217
16,371 143,674 5,289,909 775,455 6,829,780 58,835,308 791,826$ 6,973,454$ 64,125,217$
PUBLIC FACILITIES DISTRICT
SKAGIT EMERGENCY
COMM 2015 TOTALS151,795$ 315,135$ 44,631,620$
1,298,782 805,193 407,567,846 3,659,456
- 1,450,577 1,120,328 455,858,922
- - 24,562,989 1,450,577 1,120,328 431,295,933 1,450,577$ 1,120,328$ 455,858,922$
164

SKAGIT COUNTY, WASHINGTONCOMBINING STATEMENT OF CHANGES IN ASSETS AND LIABILITIES
Fiscal Year Ended December 31, 2015
Balance BalanceTRUST FUNDS December 31, 2014 Additions Deductions December 31, 2015
ASSETSCash 1,107,153$ 8,999,155$ 9,761,142$ 345,166$ Investments - - Taxes Receivable - - Deposits - - TOTAL ASSETS 1,107,153 8,999,155 9,761,142 345,166
LIABILITIESWarrants Payable - - Custodial Accounts 1,107,153 8,998,222 9,760,208 345,166 TOTAL LIABILITIES 1,107,153$ 8,998,222$ 9,760,208$ 345,166$
Balance BalanceCLEARING FUNDS December 31, 2014 Additions Deductions December 31, 2015
ASSETSCash 6,752,749$ 310,178,170$ 313,341,430$ 3,589,489$ Investments - - Taxes Receivable - - Deposits - - - - TOTAL ASSETS 6,752,749 310,178,170 313,341,430 3,589,489
LIABILITIESWarrants Payable 6,670,407 239,676,794 242,814,430 3,532,771 Custodial Accounts 82,342 105,838,318 105,863,942 56,718 TOTAL LIABILITIES 6,752,749$ 345,515,112$ 348,678,372$ 3,589,489$
Balance BalanceSTATE FUNDS December 31, 2014 Additions Deductions December 31, 2015
ASSETSCash 1,100,323$ 50,306,525$ 50,596,129$ 810,719$ Investments - Taxes Receivable 1,029,943 33,898,216 34,045,142 883,017 Deposits - - TOTAL ASSETS 2,130,266 84,204,740 84,641,271 1,693,735
LIABILITIESWarrants Payable - - Custodial Accounts 2,130,266 37,294,685 37,731,216 1,693,735 TOTAL LIABILITIES 2,130,266$ 37,294,685$ 37,731,216$ 1,693,735$
165

SKAGIT COUNTY, WASHINGTONCOMBINING STATEMENT OF CHANGES IN ASSETS AND LIABILITIES
Fiscal Year Ended December 31, 2015
Balance BalanceNW AIR POLLUTION FUNDS December 31, 2014 Additions Deductions December 31, 2015
ASSETSCash 67,926$ 9,829,320$ 9,874,391$ 22,856$ Investments 6,920,899 4,103,379 4,921,000 6,103,278 Taxes Receivable - - Deposits - - TOTAL ASSETS 6,988,825 13,932,699 14,795,391 6,126,134
LIABILITIESWarrants Payable - 5,390,912 5,390,912 - Custodial Accounts 6,988,825 - 862,691 6,126,134 TOTAL LIABILITIES 6,988,825$ 5,390,912$ 6,253,603$ 6,126,134$
Balance BalanceCOUNCIL OF GOV'T FUNDS December 31, 2014 Additions Deductions December 31, 2015
ASSETSCash 67,783$ 842,811$ 833,968$ 76,626$ Investments 801,949 165,025 83,967 883,008 Taxes Receivable - - Deposits - - TOTAL ASSETS 869,732 1,007,836 917,934 959,634
LIABILITIESWarrants Payable 17,544 270,670 273,348 14,866 Custodial Accounts 852,188 249,511 156,932 944,768 TOTAL LIABILITIES 869,732$ 520,181$ 430,281$ 959,634$
Balance BalanceLIBRARY FUNDS December 31, 2014 Additions Deductions December 31, 2015
ASSETSCash 1,223,596$ 2,292,493$ 2,779,880$ 736,209$ Investments 494,165 1,927,258 595,412 1,826,011 Taxes Receivable 43,089 1,210,546 1,205,246 48,388 Deposits - - TOTAL ASSETS 1,760,850 5,430,297 4,580,538 2,610,608
LIABILITIESWarrants Payable 11,079 353,392 349,926 14,545 Custodial Accounts 1,749,771 1,480,897 634,605 2,596,063 TOTAL LIABILITIES 1,760,850$ 1,834,289$ 984,531$ 2,610,608$
166

SKAGIT COUNTY, WASHINGTONCOMBINING STATEMENT OF CHANGES IN ASSETS AND LIABILITIES
Fiscal Year Ended December 31, 2015
Balance BalanceSKAGIT HOUSING December 31, 2014 Additions Deductions December 31, 2015
ASSETSCash 1,000$ 123,933$ 123,933$ 1,000$ Investments 702,690 64,713 59,220 708,183 Taxes Receivable - - Deposits - - TOTAL ASSETS 703,690 188,646 183,153 709,183
LIABILITIESWarrants Payable - - - - Custodial Accounts 703,690 5,493 709,183 TOTAL LIABILITIES 703,690$ 5,493$ -$ 709,183$
Balance BalanceCITIES AND TOWNS FUNDS December 31, 2014 Additions Deductions December 31, 2015
ASSETSCash 405,278$ 20,558,431$ 20,626,997$ 336,713$ Investments - - Taxes Receivable 425,935 17,746,682 17,785,067 387,550 Deposits - - TOTAL ASSETS 831,213 38,305,113 38,412,064 724,263
LIABILITIESWarrants Payable - - Custodial Accounts 831,213 17,746,682 17,853,631 724,263 TOTAL LIABILITIES 831,213$ 17,746,682$ 17,853,631$ 724,263$
Balance BalancePORT OF ANACORTES FUNDS December 31, 2014 Additions Deductions December 31, 2015
ASSETSCash 125,769$ 29,180,285$ 28,345,848$ 960,206$ Investments 8,386,838 5,160,432 4,402,083 9,145,187 Taxes Receivable 10,089 500,136 502,356 7,869 Deposits - - TOTAL ASSETS 8,522,696 34,840,852 33,250,286 10,113,262
LIABILITIESWarrants Payable 20,143 15,918,772 15,756,125 182,790 Custodial Accounts 8,502,553 4,080,274 2,652,356 9,930,471 TOTAL LIABILITIES 8,522,696$ 19,999,046$ 18,408,481$ 10,113,262$
167

SKAGIT COUNTY, WASHINGTONCOMBINING STATEMENT OF CHANGES IN ASSETS AND LIABILITIES
Fiscal Year Ended December 31, 2015
Balance BalancePORT OF SKAGIT FUNDS December 31, 2014 Additions Deductions December 31, 2015
ASSETSCash 593,819$ 18,742,997$ 18,875,998$ 460,817$ Investments 7,874,295 2,313,002 3,543,623 6,643,674 Taxes Receivable 63,987 2,068,942 2,071,490 61,439 Deposits - - TOTAL ASSETS 8,532,101 23,124,941 24,491,112 7,165,930
LIABILITIESWarrants Payable 50,476 8,118,989 7,866,187 303,278 Custodial Accounts 8,481,625 3,886,442 5,505,415 6,862,652 TOTAL LIABILITIES 8,532,101$ 12,005,431$ 13,371,602$ 7,165,930$
Balance BalanceFIDALGO PARK FUNDS December 31, 2014 Additions Deductions December 31, 2015
ASSETSCash 313,643$ 1,365,310$ 1,281,728$ 397,224$ Investments 185,099 226,205 185,099 226,205 Taxes Receivable 10,789 638,384 640,039 9,134 Deposits - - TOTAL ASSETS 509,531 2,229,898 2,106,866 632,563
LIABILITIESWarrants Payable 67,766 848,445 916,211 0 Custodial Accounts 441,765 618,399 427,601 632,563 TOTAL LIABILITIES 509,531$ 1,466,844$ 1,343,812$ 632,563$
Balance BalanceAFFILIATED HEALTH FUNDS December 31, 2014 Additions Deductions December 31, 2015
ASSETSCash 402$ 346,369$ 346,370$ 401$ Investments 383,303 4,732 341,638 46,397 Taxes Receivable - - Deposits - - TOTAL ASSETS 383,705 351,101 688,008 46,798
LIABILITIESWarrants Payable 401 341,638 341,638 401 Custodial Accounts 383,304 336,907 46,397 TOTAL LIABILITIES 383,705$ 341,638$ 678,545$ 46,798$
168

SKAGIT COUNTY, WASHINGTONCOMBINING STATEMENT OF CHANGES IN ASSETS AND LIABILITIES
Fiscal Year Ended December 31, 2015
Balance BalanceHOSPITAL DISTRICT 1 FUNDS December 31, 2014 Additions Deductions December 31, 2015
ASSETSCash 4,365,029$ 943,588,419$ 944,928,432$ 3,025,016$ Investments 137,672,545 476,182,555 469,454,992 144,400,109 Taxes Receivable 113,057 3,667,229 3,680,407 99,878 Deposits - - TOTAL ASSETS 142,150,631 1,423,438,203 1,418,063,831 147,525,003
LIABILITIESWarrants Payable 2,823,401 224,983,555 225,947,889 1,859,068 Custodial Accounts 139,327,230 8,250,214 1,911,509 145,665,935 TOTAL LIABILITIES 142,150,631$ 233,233,770$ 227,859,398$ 147,525,003$
Balance BalanceHOSPITAL DISTRICT 2 FUNDS December 31, 2014 Additions Deductions December 31, 2015
ASSETSCash 1,594,306$ 112,284,833$ 112,279,112$ 1,600,027$ Investments 28,039,916 14,340,077 12,903,493 29,476,500 Taxes Receivable 63,726 3,223,720 3,238,991 48,454 Deposits - - TOTAL ASSETS 29,697,948 129,848,630 128,421,597 31,124,982
LIABILITIESWarrants Payable 1,384,972 50,672,155 50,829,287 1,227,840 Custodial Accounts 28,312,976 13,779,455 12,195,289 29,897,142 TOTAL LIABILITIES 29,697,948$ 64,451,610$ 63,024,576$ 31,124,982$
Balance BalanceHOSPITAL DISTRICT 304 FUNDS December 31, 2014 Additions Deductions December 31, 2015
ASSETSCash 131,307$ 20,015,633$ 19,628,964$ 517,976$ Investments 14,811,013 12,969,622 13,334,233 14,446,402 Taxes Receivable 34,495 949,834 952,617 31,712 Deposits - - TOTAL ASSETS 14,976,815 33,935,089 33,915,814 14,996,090
LIABILITIESWarrants Payable 67,751 3,802,479 3,443,963 426,267 Custodial Accounts 14,909,064 949,835 1,289,075 14,569,824 TOTAL LIABILITIES 14,976,815$ 4,752,314$ 4,733,038$ 14,996,090$
169

SKAGIT COUNTY, WASHINGTONCOMBINING STATEMENT OF CHANGES IN ASSETS AND LIABILITIES
Fiscal Year Ended December 31, 2015
Balance BalanceDIKE FUNDS December 31, 2014 Additions Deductions December 31, 2015
ASSETSCash 6,432,839$ 6,912,906$ 5,979,435$ 7,366,310$ Investments 6,217,365 434,641 25,114 6,626,892 Taxes Receivable 163,483 5,288,703 5,287,109 165,077 Deposits - - TOTAL ASSETS 12,813,687 12,636,250 11,291,658 14,158,279
LIABILITIESWarrants Payable 56,442 3,670,826 3,660,720 66,548 Custodial Accounts 12,757,245 3,014,196 1,679,710 14,091,731 TOTAL LIABILITIES 12,813,687$ 6,685,022$ 5,340,430$ 14,158,279$
Balance BalanceSKAGIT TRANSPORTATION December 31, 2014 Additions Deductions December 31, 2015
ASSETSCash -$ 15,757$ 15,757$ -$ Investments 8,511,518 15,757 8,527,275 Taxes Receivable - - Deposits - - TOTAL ASSETS 8,511,518 31,513 15,757 8,527,275
LIABILITIESWarrants Payable - - Custodial Accounts 8,511,518 15,757 - 8,527,275 TOTAL LIABILITIES 8,511,518$ 15,757$ -$ 8,527,275$
Balance BalanceDRAINAGE DISTRICT FUNDS December 31, 2014 Additions Deductions December 31, 2015
ASSETSCash 357,641$ 1,300,894$ 1,180,981$ 477,555$ Investments 1,143,349 236,323 228,946 1,150,726 Taxes Receivable 21,233 750,044 749,440 21,837 Deposits - - TOTAL ASSETS 1,522,223 2,287,261 2,159,367 1,650,117
LIABILITIESWarrants Payable 12,625 619,052 610,912 20,765 Custodial Accounts 1,509,598 818,569 698,816 1,629,351 TOTAL LIABILITIES 1,522,223$ 1,437,622$ 1,309,728$ 1,650,117$
170

SKAGIT COUNTY, WASHINGTONCOMBINING STATEMENT OF CHANGES IN ASSETS AND LIABILITIES
Fiscal Year Ended December 31, 2015
Balance BalanceSCHOOL DISTRICT FUNDS December 31, 2014 Additions Deductions December 31, 2015
ASSETSCash 16,672,672$ 532,240,987$ 530,675,291$ 18,238,368$ Investments 50,479,358 251,311,521 194,183,374 107,607,505 Taxes Receivable 1,805,987 67,750,335 67,828,029 1,728,293 Deposits - - TOTAL ASSETS 68,958,017 851,302,843 792,686,694 127,574,166
LIABILITIESWarrants Payable 8,700,282 180,498,159 177,739,686 11,458,755 Custodial Accounts 60,257,735 150,278,605 94,420,929 116,115,411 TOTAL LIABILITIES 68,958,017$ 330,776,764$ 272,160,615$ 127,574,166$
Balance BalanceCEMETERY DISTRICT FUNDS December 31, 2014 Additions Deductions December 31, 2015
ASSETSCash 260,183$ 720,568$ 783,182$ 197,569$ Investments 637,218 458,685 455,856 640,047 Taxes Receivable 8,283 202,796 205,707 5,372 Deposits - - TOTAL ASSETS 905,684 1,382,049 1,444,745 842,988
LIABILITIESWarrants Payable 7,558 191,766 194,183 5,141 Custodial Accounts 898,126 244,473 304,752 837,847 TOTAL LIABILITIES 905,684$ 436,239$ 498,935$ 842,988$
Balance BalanceWATER DISTRICT FUNDS December 31, 2014 Additions Deductions December 31, 2015
ASSETSCash 37,014$ 56,624$ 41,306$ 52,333$ Investments 227,394 327 - 227,721 Taxes Receivable - - Deposits - - TOTAL ASSETS 264,408 56,951 41,306 280,054
LIABILITIESWarrants Payable - 38,982 38,982 - Custodial Accounts 264,408 16,146 500 280,054 TOTAL LIABILITIES 264,408$ 55,128$ 39,482$ 280,054$
171

SKAGIT COUNTY, WASHINGTONCOMBINING STATEMENT OF CHANGES IN ASSETS AND LIABILITIES
Fiscal Year Ended December 31, 2015
Balance BalanceSEWER DISTRICT FUNDS December 31, 2014 Additions Deductions December 31, 2015
ASSETSCash 152,603$ 2,049,810$ 1,877,536$ 324,877$ Investments 882,498 163,383 579,707 466,174 Taxes Receivable 3,102 2,327 775 Deposits - - TOTAL ASSETS 1,038,203 2,213,194 2,459,570 791,826
LIABILITIESWarrants Payable 2,958 684,064 670,651 16,371 Custodial Accounts 1,035,245 475,186 734,976 775,455 TOTAL LIABILITIES 1,038,203$ 1,159,250$ 1,405,627$ 791,826$
Balance BalanceFIRE DISTRICT FUNDS December 31, 2014 Additions Deductions December 31, 2015
ASSETSCash 2,886,112$ 9,574,093$ 9,714,651$ 2,745,554$ Investments 3,505,357 1,668,759 1,106,877 4,067,239 Taxes Receivable 178,017 4,932,175 4,949,532 160,660 Deposits - - TOTAL ASSETS 6,569,486 16,175,028 15,771,060 6,973,454
LIABILITIESWarrants Payable 171,085 6,135,210 6,162,621 143,674 Custodial Accounts 6,398,401 7,107,253 6,675,874 6,829,780 TOTAL LIABILITIES 6,569,486$ 13,242,463$ 12,838,495$ 6,973,454$
Balance BalanceNORTH SOUND RSN December 31, 2014 Additions Deductions December 31, 2015
ASSETSCash 638,198$ 136,794,655$ 135,552,976$ 1,879,877$ Investments 54,746,944 34,510,511 27,012,115 62,245,340 Taxes Receivable - - Deposits - - TOTAL ASSETS 55,385,142 171,305,166 162,565,092 64,125,217
LIABILITIESWarrants Payable 5,482,807 97,520,515 97,713,413 5,289,909 Custodial Accounts 49,902,335 9,973,737 1,040,764 58,835,308 TOTAL LIABILITIES 55,385,142$ 107,494,252$ 98,754,177$ 64,125,217$
172

SKAGIT COUNTY, WASHINGTONCOMBINING STATEMENT OF CHANGES IN ASSETS AND LIABILITIES
Fiscal Year Ended December 31, 2015
Balance BalanceSKAGIT EMERGENCY COMM December 31, 2014 Additions Deductions December 31, 2015
ASSETSCash 635,535$ 4,174,643$ 4,495,044$ 315,134$ Investments 444,459 360,734 - 805,193 Taxes Receivable - - Deposits - - TOTAL ASSETS 1,079,994 4,535,378 4,495,044 1,120,328
LIABILITIESWarrants Payable - 14 14 - Custodial Accounts 1,079,994 40,334 1,120,328 TOTAL LIABILITIES 1,079,994$ 40,347$ 14$ 1,120,328$
Balance BalanceSKAGIT COMMUNITY NETWORK December 31, 2014 Additions Deductions December 31, 2015
ASSETSCash 1,801$ -$ -$ 1,801$ Investments - - Taxes Receivable - - Deposits - - TOTAL ASSETS 1,801 - - 1,801
LIABILITIESWarrants Payable - - Custodial Accounts 1,801 1,801 TOTAL LIABILITIES 1,801$ -$ -$ 1,801$
Balance BalancePUBLIC FACILITY DISTRICT December 31, 2014 Additions Deductions December 31, 2015
ASSETSCash 142,149$ 3,933,606$ 3,923,960$ 151,795$ Investments 1,223,793 2,254,282 2,179,293 1,298,782 Taxes Receivable - - Deposits - - TOTAL ASSETS 1,365,942 6,187,888 6,103,253 1,450,577
LIABILITIESWarrants Payable - 221,287 221,287 - Custodial Accounts 1,365,492 455,085 370,000 1,450,577 TOTAL LIABILITIES 1,365,492$ 676,372$ 591,287$ 1,450,577$
173

SKAGIT COUNTY, WASHINGTONCOMBINING STATEMENT OF CHANGES IN ASSETS AND LIABILITIES
Fiscal Year Ended December 31, 2015
Balance BalanceTRUST AGENCY FUNDS December 31, 2014 Additions Deductions December 31, 2015
ASSETSCash 46,066,830$ 2,226,429,227$ 2,227,864,440$ 44,631,617$ Investments 334,291,965 808,871,924$ 735,596,042$ 407,567,851 Taxes Receivable 3,975,215 142,827,740$ 143,143,500$ 3,659,455 Deposits - - TOTAL ASSETS 384,334,010 3,178,128,890 3,106,603,982 455,858,922
LIABILITIESWarrants Payable 25,547,697 839,957,676$ 840,942,387$ 24,562,989 Custodial Accounts 358,786,313 375,618,320$ 303,107,699$ 431,296,933 TOTAL LIABILITIES 384,334,010$ 1,215,575,996$ 1,144,050,086$ 455,859,922$
174

Statistical Section
175

This part of Skagit County's comprehensive annual financial report presents detailed information as a context forunderstanding what the information in the financial statements, note disclosures, and required supplementaryinformation says about the County's overall financial health.
Contents Page
Financial Trends 166These schedules contain trend information to help the reader understand how the County'sfinancial performance has changed over time.
Revenue Capacity 175These schedules contain information to help the reader assess the County's most significantlocal revenue source, property taxes.
Debt Capacity 179These schedules present information to help the reader assess the affordability of the County'scurrent levels of outstanding debt and the County's ability to issue additional debt in the future.
Demographic and Economic Information 184These schedules offer demographic and economic indicators to help the reader understand theenvironment in which the County's financial activities take place.
Operating Information 187These schedules contain service and infrastructure data to help the reader understand how the information in the County's financial statements relate to the services the County provides and the activities it performs.
SKAGIT COUNTY, WASHINGTONStatistical Section
176

SKAG
IT C
OU
NTY
, WAS
HIN
GTO
NN
et P
ositi
on b
y C
ompo
nent
Last
Ten
Fis
cal y
ears
(Acc
rual
Bas
is o
f Acc
ount
ing)
2006
2007
2008
2009
2010
2011
2012
2013
2014
2015
Gov
ernm
ent A
ctiv
ities
Net
Inve
stm
ent i
n C
apita
l Ass
ets
366,
147,
997
$
357,
149,
388
$
348,
749,
188
$
369,
397,
842
$
359,
956,
151
$
327,
995,
991
$
324,
329,
535
$
311,
928,
988
$
291,
628,
047
$
273,
798,
884
$
Res
trict
ed22
,616
,026
31
,094
,299
33
, 205
,191
24
,794
,518
27
,543
,125
29
, 091
,499
28
,152
,145
31
,055
,769
30
, 418
,711
36
, 559
,030
U
nres
trict
ed19
,952
,312
19
,336
,537
14
, 966
,923
14
,514
,433
16
,234
,084
24
, 183
,225
29
,972
,479
11
,722
,089
28
,256
,073
6,
460,
200
To
tal G
over
nmen
tal A
ctiv
ities
Net
Pos
ition
408,
716,
335
407,
580,
224
396,
921,
302
408,
706,
793
403,
733,
360
381,
270,
715
382,
454,
159
354,
706,
846
350,
302,
831
316,
818,
114
Bus
ines
s-Ty
pe A
ctiv
ities
Net
Inve
stm
ent i
n C
apita
l Ass
ets
(488
,175
)
36
7,22
0
1,
183,
845
59
2,02
5
3,
843,
894
4,
669,
373
6,
207,
740
7,
110,
665
14
,405
,733
9,
066,
636
R
estri
cted
-
-
-
-
-
-
-
-
-
-
Unr
estri
cted
5,23
0,23
8
1,76
0,88
5
285,
705
2,29
3,53
7
(2,2
67,0
94)
( 1
,589
,457
)
(1,9
26,6
99)
(2
,810
,762
)
(2,9
63,1
91)
5,
090,
996
To
tal B
usin
ess-
Type
Act
iviti
es N
et P
ositi
on4,
742,
063
2,
128,
105
1,
469,
550
2,
885,
562
1,
576,
800
3,
079,
916
4,
281,
041
4,
299,
903
11
,442
,542
14
,157
,632
Prim
ary
Gov
ernm
ent
Net
Inve
stm
ent i
n C
apita
l Ass
ets
365,
659,
822
357,
516,
608
349,
933,
033
369,
989,
867
363,
800,
045
332,
665,
364
330,
537,
275
319,
039,
653
306,
033,
780
282,
865,
520
Res
trict
ed22
,616
,026
31
,094
,299
33
,205
,191
24
,794
,518
27
,543
,125
29
,091
,499
28
,152
,145
31
,055
,769
30
,418
,711
36
,559
,030
U
nres
trict
ed25
,182
,550
21
,097
,422
15
, 252
,628
16
,807
,970
13
,966
,990
22
, 593
,768
28
,045
,780
8,
911,
327
25
, 292
,882
11
, 551
,196
To
tal P
rimar
y G
over
nmen
t Net
Pos
ition
413,
458,
398
$
409,
708,
329
$
398,
390,
852
$
411,
592,
355
$
405,
310,
160
$
384,
350,
631
$
386,
735,
200
$
359,
006,
749
$
361,
745,
373
$
330,
975,
746
$
Sou
rce:
Fin
anci
al S
tate
men
ts fo
r rel
aven
t yea
rs.
Fisc
al Y
ear
In 2
014,
jail
oper
atio
ns w
ere
rem
oved
from
G
over
nmen
t Act
iviti
es a
nd n
ow re
side
in B
usin
ess-
Type
Act
ivite
s. S
ee N
ote
X
177

SKAGIT COUNTY, WASHINGTONChanges in Net Position by Function
Last Ten Fiscal Years(Accrual Basis of Accounting)
2006 2007 2008 2009 2010ExpensesGovernmental Activities
General Government 22,760,258$ 23,993,651$ 34,187,307$ 32,293,073$ 30,411,707$ Judicial - - 6,385,303 6,786,074 6,281,910 Public Safety 22,496,619 24,872,632 22,665,563 24,713,361 20,015,584 Physical Environment 2,161,454 3,509,248 3,008,208 2,185,797 3,560,748 Transportation 32,499,589 32,079,278 28,136,224 27,080,176 27,144,427 Economic Environment 6,149,970 5,763,176 5,947,702 5,348,995 3,467,987 Health and Human Services 8,409,308 9,293,864 12,606,481 11,340,490 10,134,616 Culture and Recreation 2,809,835 3,020,552 2,782,984 2,573,312 2,566,016 Interest on Long-Term Debt 544,820 708,941 687,761 660,210 559,293
Total Government Activities 97,831,853 103,241,342 116,407,533 112,981,488 104,142,288 Business-Type Activities
Solid Waste 8,548,400 8,775,500 8,216,764 7,723,823 8,705,787 Drainage Utility 644,188 787,587 905,641 1,626,049 1,240,898 Jail Fund - - - - -
Total Business-Type Activities 9,192,588 9,563,087 9,122,405 9,349,872 9,946,685 Total Primary Government 107,024,441 112,804,429 125,529,938 122,331,360 114,088,973
Program RevenuesGovernment Activities
Property Tax 30,847,043 34,519,624 37,192,117 38,020,570 40,839,173 Sales and Other Tax 20,435,624 22,179,773 20,586,592 17,367,314 15,939,206 Interest and Investments 3,183,945 4,578,687 3,040,686 1,432,797 1,104,621 Charges for Services
General Government 5,589,012 6,116,977 10,110,482 7,888,910 8,468,108 Judicial - - 2,515,475 3,931,874 3,922,658 Public Safety 1,384,252 1,449,743 3,408,760 3,577,904 3,268,388 Physical Environment 351,242 440,067 521,983 89,253 113,852 Transportation 3,996,397 3,918,644 7,693,881 6,188,799 6,227,702 Economic Environment 2,768,354 2,576,391 1,788,532 1,424,780 1,195,078 Health and Human Services 838,835 1,691,416 3,999,141 3,555,103 3,057,962 Culture and Recreation 960,501 931,713 935,070 719,082 884,659
Operating Grants and Contributions 16,196,475 22,093,519 9,659,021 11,271,785 10,628,645 Capital Grants and Contributions 6,623,961 2,667,303 1,496,744 3,384,760 3,471,716 Gain (Loss) from Sale of Capital Assets 417,575 (82,021) (59,262) 14,837 Issuance of Long Term Debt - - - - -
Total Governmental Activities Program Revenues 93,593,216 103,163,857 102,866,463 98,793,669 99,136,605
Business-Type ActivitiesInterest and Investments 192,586 266,841 138,581 44,502 21,111 Charges for Services
Solid Waste 8,806,633 9,231,853 8,531,366 7,809,298 8,253,739 Drainage Utility 986,778 1,028,099 1,353,038 1,752,753 1,670,508 Jail Fund - - - - -
Operating Grants and Contributions 246,250 203,909 266,239 485,717 303,245 Capital Grants and ContributionsGain (Loss) from Sale of Capital Assets
Total Business-Type Activities Program Revenues 10,232,247 10,730,702 10,289,224 10,092,270 10,248,603 Total Primary Government Program Revenues 103,825,463 113,894,559 113,155,687 108,885,939 109,385,208
Net (Expense) RevenueGovernmental Activities (4,238,637) (77,485) (13,541,070) (14,187,819) (5,005,683) Business-Type Activities 1,039,659 1,167,615 1,166,819 742,398 301,918 Total Primary Government Net Expense (3,198,978)$ 1,090,131$ (12,374,251)$ (13,445,421)$ (4,703,765)$
Note: The County began separating out Judicial in 2009
In 2014, jail operations were removed from Government Activities and now reside in Business-Type Activities. See Note X
178

SKAGIT COUNTY, WASHINGTONChanges in Net Position by Function
Last Ten Fiscal Years(Accrual Basis of Accounting)
ExpensesGovernmental Activities
General GovernmentJudicialPublic SafetyPhysical EnvironmentTransportationEconomic EnvironmentHealth and Human ServicesCulture and RecreationInterest on Long-Term Debt
Total Government ActivitiesBusiness-Type Activities
Solid WasteDrainage UtilityJail Fund
Total Business-Type ActivitiesTotal Primary Government
Program RevenuesGovernment Activities
Property TaxSales and Other TaxInterest and InvestmentsCharges for Services
General GovernmentJudicialPublic SafetyPhysical EnvironmentTransportationEconomic EnvironmentHealth and Human ServicesCulture and Recreation
Operating Grants and ContributionsCapital Grants and ContributionsGain (Loss) from Sale of Capital AssetsIssuance of Long Term Debt
Total Governmental Activities Program Revenues
Business-Type ActivitiesInterest and InvestmentsCharges for Services
Solid WasteDrainage UtilityJail Fund
Operating Grants and ContributionsCapital Grants and ContributionsGain (Loss) from Sale of Capital Assets
Total Business-Type Activities Program RevenuesTotal Primary Government Program Revenues
Net (Expense) RevenueGovernmental ActivitiesBusiness-Type ActivitiesTotal Primary Government Net Expense
Note: The County began separating out Judicial in 2009
In 2014, jail operations were removed from Government Activities and now reside in Business-Type Activities. See Note X
2011 2012 2013 2014 2015
29,694,591$ 32,996,294$ 31,210,941$ 33,434,058$ 38,988,745$ 6,528,192 6,762,929 7,068,715 6,993,755 7,023,822
20,622,410 19,980,408 22,333,986 21,504,017 22,700,976 2,672,643 2,729,881 2,835,410 2,241,397 2,579,726
29,952,995 29,724,498 32,986,406 32,912,501 25,806,761 3,162,607 3,233,397 3,188,571 2,836,294 2,662,654
10,387,711 10,391,910 11,895,878 11,366,884 10,277,091 1,642,170 2,066,029 1,699,884 2,010,042 2,118,435
516,260 222,519 969,862 2,572,433 1,113,066 105,179,579 108,107,865 114,189,653 115,871,381 113,271,275
7,252,470 6,952,600 8,826,690 8,065,622 8,414,131 1,412,499 1,716,453 1,468,019 2,495,934 2,259,694
- - - 6,944,227 7,351,101 8,664,969 8,669,053 10,294,709 17,505,783 18,024,926
113,844,548 116,776,918 124,484,362 133,377,164 131,296,201
40,612,732 41,460,187 45,491,521 44,659,376 45,164,735 18,124,427 18,898,614 16,716,680 18,060,643 19,255,493
781,032 589,613 2,896,837 1,559,578 1,613,617
9,081,343 7,670,970 7,902,178 8,053,198 11,225,727 3,962,902 3,923,771 4,148,064 4,129,697 4,246,989 3,590,375 2,813,154 3,296,521 1,854,641 2,072,801
125,144 201,726 312,525 527,379 289,242 6,354,529 6,756,935 6,607,346 6,731,733 6,685,090
894,872 1,088,468 1,184,165 1,055,292 1,380,435 3,322,591 3,026,346 3,506,429 3,769,935 4,461,088
894,709 666,661 939,657 917,338 902,599 8,961,787 9,492,002 7,423,603 8,098,345 7,309,333 5,685,601 13,169,596 4,165,511 4,097,331 1,324,956 (118,394) - 1,292,478 (340,575) 114,660
- - - 1,786,614 - 102,273,650 109,758,043 105,883,515 104,960,525 106,046,765
(545,115) (485,298) (504,334) (406,062) (395,829)
8,194,581 8,084,972 8,616,406 9,083,934 9,194,846 1,544,370 1,604,197 1,646,427 1,592,768 1,751,555
- - - 12,121,803 12,357,458 397,974 480,798 446,909 1,044,605 1,004,289
71,451 - 54,414 - - 700 - 8,372 - -
9,663,961 9,684,669 10,268,194 23,437,048 23,912,319 111,937,611 119,442,712 116,151,709 128,397,573 129,959,084
(2,905,929) 1,650,178 (8,306,138) (10,910,856) (7,224,510) 998,992 1,015,616 (26,515) 5,931,265 5,887,393
(1,906,937)$ 2,665,794$ (8,332,653)$ (4,979,591)$ (1,337,117)$
Fiscal Year
179
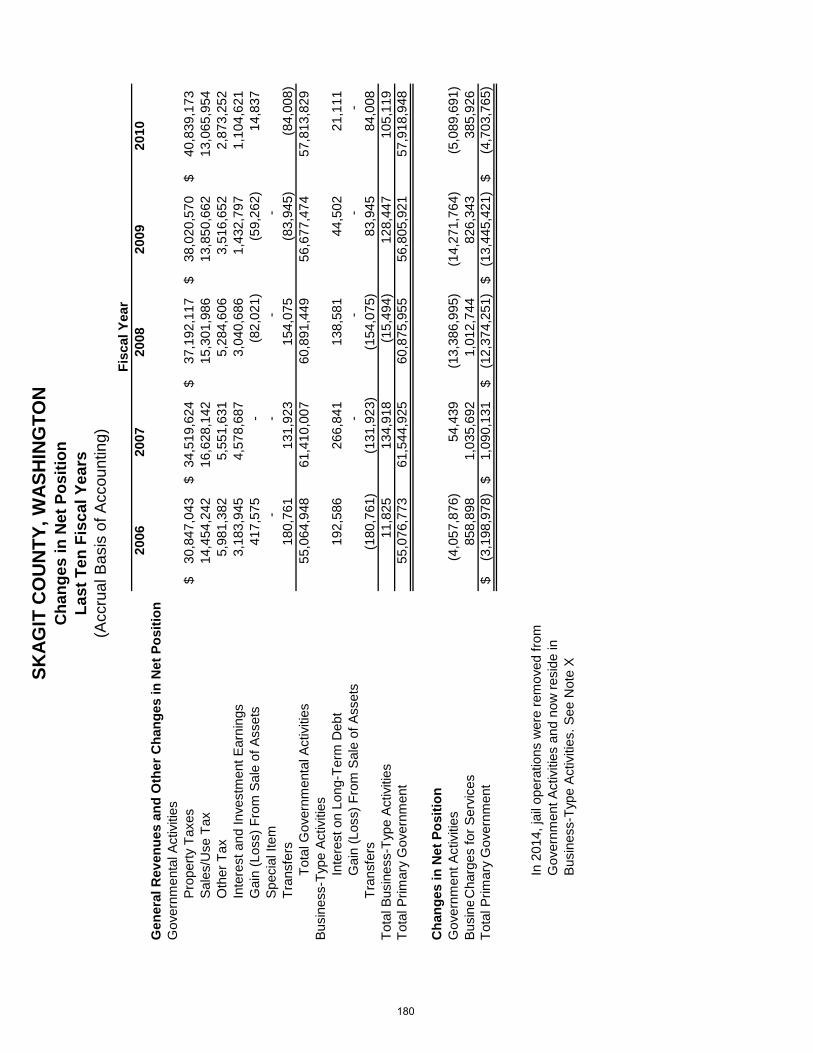
SKAG
IT C
OU
NTY
, WAS
HIN
GTO
NC
hang
es in
Net
Pos
ition
Last
Ten
Fis
cal Y
ears
(Acc
rual
Bas
is o
f Acc
ount
ing)
2006
2007
2008
2009
2010
Gen
eral
Rev
enue
s an
d O
ther
Cha
nges
in N
et P
ositi
onG
over
nmen
tal A
ctiv
ities
Prop
erty
Tax
es30
,847
,043
$
34,5
19,6
24$
37
,192
,117
$
38
,020
,570
$
40
,839
,173
$
Sa
les/
Use
Tax
14,4
54,2
42
16
,628
,142
15,3
01,9
86
13,8
50,6
62
13,0
65,9
54
Oth
er T
ax5,
981,
382
5,
551,
631
5,
284,
606
3,
516,
652
2,
873,
252
In
tere
st a
nd In
vest
men
t Ear
ning
s3,
183,
945
4,
578,
687
3,
040,
686
1,
432,
797
1,
104,
621
G
ain
(Los
s) F
rom
Sal
e of
Ass
ets
417,
575
-
(8
2,02
1)
(59,
262)
14,8
37
Spec
ial I
tem
-
-
-
-
Tr
ansf
ers
180,
761
131,
923
154,
075
(83,
945)
(84,
008)
To
tal G
over
nmen
tal A
ctiv
ities
55,0
64,9
48
61
,410
,007
60,8
91,4
49
56,6
77,4
74
57,8
13,8
29
Busi
ness
-Typ
e Ac
tiviti
esIn
tere
st o
n Lo
ng-T
erm
Deb
t19
2,58
6
26
6,84
1
13
8,58
1
44
,502
21
,111
G
ain
(Los
s) F
rom
Sal
e of
Ass
ets
-
-
-
-
Tr
ansf
ers
(180
,761
)
(1
31,9
23)
(1
54,0
75)
83,9
45
84,0
08
Tota
l Bus
ines
s-Ty
pe A
ctiv
ities
11,8
25
134,
918
(15,
494)
12
8,44
7
10
5,11
9
To
tal P
rimar
y G
over
nmen
t55
,076
,773
61,5
44,9
25
60
,875
,955
56
, 805
,921
57
,918
,948
Cha
nges
in N
et P
ositi
onG
over
nmen
t Act
iviti
es(4
,057
,876
)
54,4
39
(1
3,38
6,99
5)
(1
4,27
1,76
4)
(5
,089
,691
)
Busi
ne
Cha
rges
for S
ervi
ces
858,
898
1,03
5,69
2
1,01
2,74
4
826,
343
385,
926
Tota
l Prim
ary
Gov
ernm
ent
(3,1
98,9
78)
$
1,
090,
131
$
(1
2,37
4,25
1)$
(1
3,44
5,42
1)$
(4
,703
,765
)$
In 2
014,
jail
oper
atio
ns w
ere
rem
oved
from
G
over
nmen
t Act
iviti
es a
nd n
ow re
side
in
Busi
ness
-Typ
e Ac
tiviti
es. S
ee N
ote
X
Fisc
al Y
ear
180

SKAG
IT C
OU
NTY
, WAS
HIN
GTO
NC
hang
es in
Net
Pos
ition
Last
Ten
Fis
cal Y
ears
(Acc
rual
Bas
is o
f Acc
ount
ing)
Gen
eral
Rev
enue
s an
d O
ther
Cha
nges
in N
et P
ositi
onG
over
nmen
tal A
ctiv
ities
Prop
erty
Tax
esSa
les/
Use
Tax
Oth
er T
axIn
tere
st a
nd In
vest
men
t Ear
ning
sG
ain
(Los
s) F
rom
Sal
e of
Ass
ets
Spec
ial I
tem
Tran
sfer
sTo
tal G
over
nmen
tal A
ctiv
ities
Busi
ness
-Typ
e Ac
tiviti
esIn
tere
st o
n Lo
ng-T
erm
Deb
tG
ain
(Los
s) F
rom
Sal
e of
Ass
ets
Tran
sfer
sTo
tal B
usin
ess-
Type
Act
iviti
esTo
tal P
rimar
y G
over
nmen
t
Cha
nges
in N
et P
ositi
onG
over
nmen
t Act
iviti
esBu
sine
C
harg
es fo
r Ser
vice
sTo
tal P
rimar
y G
over
nmen
t
In 2
014,
jail
oper
atio
ns w
ere
rem
oved
from
G
over
nmen
t Act
iviti
es a
nd n
ow re
side
in
Busi
ness
-Typ
e Ac
tiviti
es. S
ee N
ote
X
2011
2012
2013
2014
2015
40,6
12,7
32$
41,4
60,1
87$
45,4
91,5
21$
44,6
59,3
76$
45
,164
,735
$
15,4
78,6
29
16,4
47,9
58
16,7
16,6
80
17,2
63,4
81
18
,421
,647
2,64
5,79
8
2,45
0,65
6
89
5,82
7
797,
162
83
3,84
6
781,
032
589,
613
2,
001,
010
1,55
9,57
8
1,
613,
617
(118
,394
)
-
1,29
2,47
8
(3
40,5
75)
11
4,66
0
1,78
6,61
4
9,
142
(185
,509
)
104,
000
(5
0,84
5)
(58,
858)
59
,408
,939
60
,762
,905
66
,501
,516
65
,674
,791
66,0
89,6
47
(545
,115
)
(4
85,2
98)
(5
04,3
34)
(4
06,0
62)
(3
95,8
29)
70
0
-
8,
372
-
-
(9,1
42)
18
5,50
9
(104
,000
)
50,8
45
58
,858
(553
,557
)
(2
99,7
89)
(5
99,9
62)
(3
55,2
17)
(3
36,9
71)
58
,855
,382
60
,463
,116
65
,901
,554
65
,319
,574
65,7
52,6
76
(2,8
96,7
87)
1,
464,
669
(8,2
02,1
38)
(10,
961,
701)
(7
,283
,369
)
98
9,85
0
1,
201,
125
(130
,515
)
5,98
2,11
0
5,
946,
251
(1,9
06,9
37)
$
2,
665,
794
$
(8,3
32,6
53)
$
(4,9
79,5
91)
$
(1,3
37,1
17)
$
Fisc
al Y
ear
181
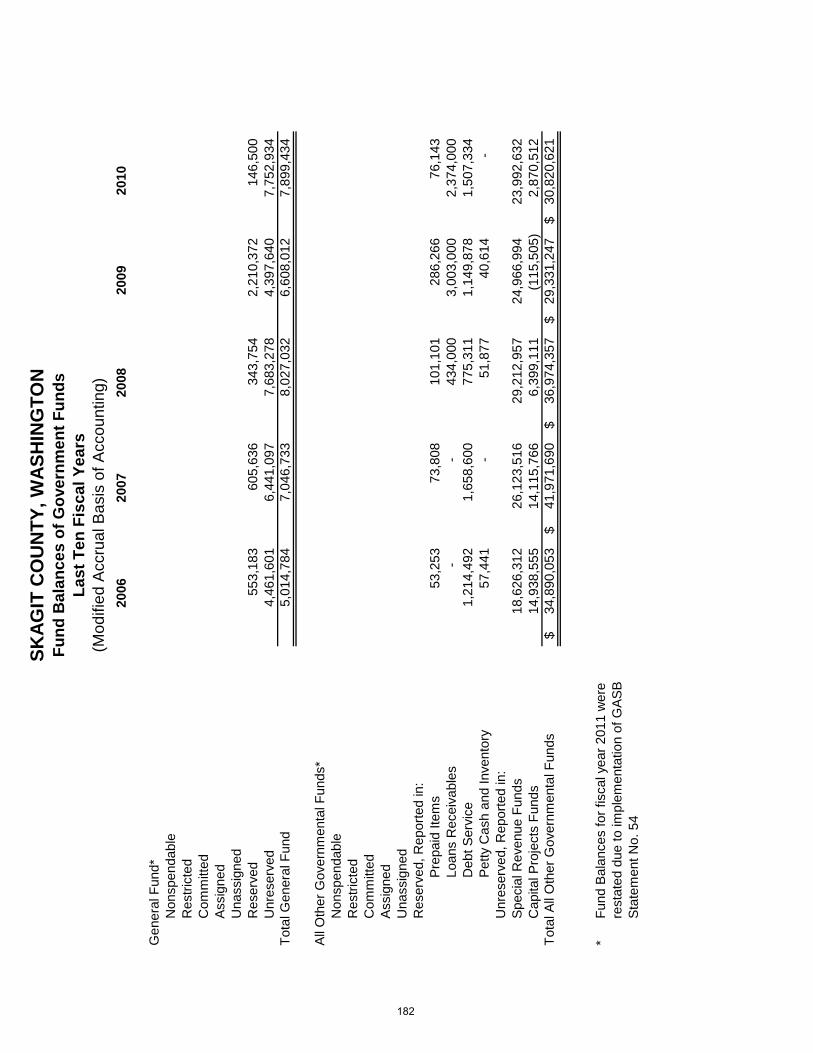
SKAG
IT C
OU
NTY
, WAS
HIN
GTO
NFu
nd B
alan
ces
of G
over
nmen
t Fun
dsLa
st T
en F
isca
l Yea
rs(M
odifi
ed A
ccru
al B
asis
of A
ccou
ntin
g)20
0620
0720
0820
0920
10
Gen
eral
Fun
d*N
onsp
enda
ble
Res
trict
edC
omm
itted
Assi
gned
Una
ssig
ned
Res
erve
d55
3,18
3
60
5,63
6
34
3,75
4
2,
210,
372
14
6,50
0
U
nres
erve
d 4,
461,
601
6,
441,
097
7,
683,
278
4,
397,
640
7,
752,
934
To
tal G
ener
al F
und
5,01
4,78
4
7,04
6,73
3
8,02
7,03
2
6,60
8,01
2
7,89
9,43
4
All O
ther
Gov
ernm
enta
l Fun
ds*
Non
spen
dabl
eR
estri
cted
Com
mitt
edAs
sign
edU
nass
igne
dR
eser
ved,
Rep
orte
d in
:Pr
epai
d Ite
ms
53,2
53
73,8
08
101,
101
286,
266
76,1
43
Loan
s R
ecei
vabl
es-
-
43
4,00
0
3,
003,
000
2,
374,
000
D
ebt S
ervi
ce1,
214,
492
1,
658,
600
77
5,31
1
1,
149,
878
1,
507,
334
Pe
tty C
ash
and
Inve
ntor
y57
,441
-
51
,877
40
,614
-
U
nres
erve
d, R
epor
ted
in:
Spec
ial R
even
ue F
unds
18,6
26,3
12
26,1
23,5
16
29,2
12,9
57
24,9
66,9
94
23
,992
,632
Cap
ital P
roje
cts
Fund
s14
,938
,555
14
,115
,766
6,
399,
111
(1
15,5
05)
2,87
0,51
2
Tota
l All
Oth
er G
over
nmen
tal F
unds
34,8
90,0
53$
41,9
71,6
90$
36,9
74,3
57$
29,3
31,2
47$
30
,820
,621
$
*
Stat
emen
t No.
54
rest
ated
due
to im
plem
enta
tion
of G
ASB
Fund
Bal
ance
s fo
r fis
cal y
ear 2
011
wer
e
182

SKAG
IT C
OU
NTY
, WAS
HIN
GTO
NFu
nd B
alan
ces
of G
over
nmen
t Fun
dsLa
st T
en F
isca
l Yea
rs(M
odifi
ed A
ccru
al B
asis
of A
ccou
ntin
g)
Gen
eral
Fun
d*N
onsp
enda
ble
Res
trict
edC
omm
itted
Assi
gned
Una
ssig
ned
Res
erve
dU
nres
erve
d To
tal G
ener
al F
und
All O
ther
Gov
ernm
enta
l Fun
ds*
Non
spen
dabl
eR
estri
cted
Com
mitt
edAs
sign
edU
nass
igne
dR
eser
ved,
Rep
orte
d in
:Pr
epai
d Ite
ms
Loan
s R
ecei
vabl
esD
ebt S
ervi
cePe
tty C
ash
and
Inve
ntor
yU
nres
erve
d, R
epor
ted
in:
Spec
ial R
even
ue F
unds
Cap
ital P
roje
cts
Fund
sTo
tal A
ll O
ther
Gov
ernm
enta
l Fun
ds
*
Stat
emen
t No.
54
rest
ated
due
to im
plem
enta
tion
of G
ASB
Fund
Bal
ance
s fo
r fis
cal y
ear 2
011
wer
e
2011
2012
2013
2014
2015
350,
000
1,00
0,00
0
10,3
49,3
81
11
,915
,249
13,9
62,0
92
13
,822
,646
13,5
76,0
13
-
-
10,6
99,3
81
11
,915
,249
13,9
62,0
92
13
,822
,646
14,5
76,0
13
60,6
85
45,6
81
12
2,23
5
57
,488
7,23
2
31,3
05,5
95
30
,877
,381
29,2
66,0
09
30
,576
,475
35,1
67,7
46
3,
480,
815
2,
776,
253
3,
102,
611
6,
313,
711
7,
247,
553
10
,349
,381
-
-
-
-
-
-
45
,196
,476
$
33,6
99,3
15$
32
,490
,855
$
36,9
47,6
74$
42
,422
,531
$
183

SKAGIT COUNTY, WASHINGTONChanges in Fund Balance of Government Funds
Last Nine Fiscal Years(Modified Accrual Basis of Accounting)
2007 2008 2009RevenuesProperty Tax 34,665,358$ 37,029,198$ 37,752,796$ Sales/Use Tax 16,628,142 15,301,986 13,850,662 Other Tax 5,551,631 5,284,606 3,516,652 License and Permits 1,754,547 1,390,282 1,173,469 Intergovernmental 24,423,925 24,288,227 24,406,041 Charges for Services 12,391,649 11,052,341 10,705,767 Fines and Forfeits 2,205,135 2,101,195 1,992,299 Interest Earnings 4,340,981 3,140,914 1,405,561 Donations 454,780 431,841 490,959 Other Revenues 1,031,830 1,548,852 1,399,883 Total Revenues 103,447,978 101,569,442 96,694,089
ExpendituresGeneral Government 23,366,301 18,227,332 17,571,572 Judicial - 7,321,077 7,841,920 Public Safety 25,096,699 26,163,388 28,240,870 Physical Environment 3,304,072 3,928,950 3,317,183 Transportation 18,143,040 17,147,101 18,775,959 Economic Environment 5,856,721 6,657,659 6,044,992 Health and Human Services 9,351,952 13,428,834 12,124,090 Culture and Recreation 2,954,850 3,040,439 2,707,825 Debt Service
Principal 960,427 2,308,099 1,017,081 Interest 685,115 679,353 627,364
Capital Outlay 4,961,542 10,469,357 7,673,632 Total Expenditures 94,680,719 109,371,589 105,942,488
Excess (deficiency) of Revenues over(under) Expenditures 8,767,259 (7,802,147) (9,248,399)
Other Financial Sources (Uses)Proceeds of Long Term Debt 430,284 990,768 389,607 Proceeds from Sale of Capital Assets - 3,226 43,988 Transfers In 8,604,266 8,597,666 8,967,747 Transfers Out (8,472,343) (8,656,869) (9,242,081) Total Other Financing Sources (Uses) 562,207 934,791 159,261
Net Change in Fund Balance 9,329,466$ (6,867,356)$ (9,089,138)$
Debt Service as a percentage of noncapital Expenditures 1.2% 1.8% 3.0%
184

SKAGIT COUNTY, WASHINGTONChanges in Fund Balance of Government Funds
Last Nine Fiscal Years(Modified Accrual Basis of Accounting)
RevenuesProperty TaxSales/Use TaxOther TaxLicense and PermitsIntergovernmentalCharges for ServicesFines and ForfeitsInterest EarningsDonationsOther RevenuesTotal Revenues
ExpendituresGeneral GovernmentJudicialPublic SafetyPhysical EnvironmentTransportationEconomic EnvironmentHealth and Human ServicesCulture and RecreationDebt Service
PrincipalInterest
Capital OutlayTotal Expenditures
Excess (deficiency) of Revenues over(under) Expenditures
Other Financial Sources (Uses)Proceeds of Long Term DebtProceeds from Sale of Capital AssetsTransfers InTransfers OutTotal Other Financing Sources (Uses)
Net Change in Fund Balance
Debt Service as a percentage of noncapital Expenditures
2010 2011 2012
39,891,962$ 40,654,187$ 41,270,011$ 13,065,954 15,478,629 16,447,958
2,873,252 2,645,798 2,450,656 1,104,621 970,105 1,039,551
25,397,870 26,894,695 33,469,657 9,757,448 10,019,437 10,309,648 1,957,965 2,285,628 1,852,797
919,121 756,562 584,571 524,932 350,297 574,306
1,707,960 1,299,538 2,019,288 97,201,085 101,354,876 110,018,443
16,556,020 16,633,997 18,111,961 7,479,340 7,823,116 8,192,507
24,420,953 24,533,549 25,249,050 4,394,408 3,467,079 3,583,100
17,027,304 17,585,104 18,953,032 3,949,022 3,606,739 3,602,203
11,261,219 11,617,447 12,060,459 3,209,727 2,016,505 2,536,420
1,058,134 1,116,572 1,213,119 589,480 600,115 565,948
4,704,095 5,750,727 15,023,756 94,649,702 94,750,950 109,091,555
2,551,383 6,603,926 926,888
415,042 201,035 353,939 1,200 8,172
8,622,743 8,588,548 8,808,381 (8,706,751) (8,829,405) (9,398,067)
331,034 (38,622) (227,575)
2,882,417$ 6,565,304$ 699,313$
1.7% 2.0% 1.9%
185

SKAGIT COUNTY, WASHINGTONChanges in Fund Balance of Government Funds
Last Nine Fiscal Years(Modified Accrual Basis of Accounting)
RevenuesProperty TaxSales/Use TaxOther TaxLicense and PermitsIntergovernmentalCharges for ServicesFines and ForfeitsInterest EarningsDonationsOther RevenuesTotal Revenues
ExpendituresGeneral GovernmentJudicialPublic SafetyPhysical EnvironmentTransportationEconomic EnvironmentHealth and Human ServicesCulture and RecreationDebt Service
PrincipalInterest
Capital OutlayTotal Expenditures
Excess (deficiency) of Revenues over(under) Expenditures
Other Financial Sources (Uses)Proceeds of Long Term DebtProceeds from Sale of Capital AssetsTransfers InTransfers OutTotal Other Financing Sources (Uses)
Net Change in Fund Balance
Debt Service as a percentage of noncapital Expenditures
2013 2014 2015
45,950,878$ 44,633,004$ 45,444,886$ 16,716,680 17,263,481 18,421,647
895,827 797,162 833,846 1,363,241 1,403,580 1,572,816
22,187,738 21,210,374 21,943,000 10,580,307 10,351,662 8,834,090
2,606,269 2,420,473 2,212,512 1,995,311 1,549,712 1,601,551
479,642 437,591 536,411 1,786,735 1,652,153 993,365
104,562,628 101,719,192 102,394,124
17,218,893 21,016,835 18,302,815 8,426,095 6,437,688 8,713,544
26,727,069 26,225,434 27,005,041 3,605,198 3,000,198 3,446,955
18,872,864 17,771,654 17,493,644 3,736,169 3,369,706 3,314,408
13,163,601 12,630,363 11,594,828 2,108,744 2,353,191 2,361,129
- - 2,084,813 2,772,142 1,469,334
667,297 693,958 681,870 8,960,070 7,052,054 2,832,109
105,570,813 103,323,223 97,215,677
(1,008,185) (1,604,031) 5,178,447
715,416 1,786,614 814,731 1,414,600 58,072 328,400 7,058,643 7,551,869 7,007,509
(7,342,090) (7,643,603) (7,100,867) 1,846,569 1,752,952 1,049,773
838,384$ 148,921$ 6,228,220$
2.9% 3.7% 2.3%
186

STATISTICAL TABLESASSESSED VALUE OF TAXABLE PROPERTY
For a Twelve Year Period
Real PersonalProperty Property Total TotalAssessed Assessed Assessed Direct Tax
Year Value Value Value Rate
2004 8,271,017,360 838,169,892 9,109,187,252 3.83 2005 8,735,243,216 900,051,468 9,635,294,684 3.84 2006 9,255,714,763 965,923,623 10,221,638,386 3.78 2007 10,622,301,046 972,398,736 11,594,699,782 3.51 2008 12,954,570,410 1,049,853,451 14,004,423,861 3.24 2009 15,019,067,448 1,147,615,059 16,166,682,507 2.98 2010 15,696,268,675 1,171,931,494 16,868,200,169 2.90 2011 14,123,251,945 1,087,219,836 15,210,471,781 3.32 2012 13,630,153,404 864,518,340 14,494,671,744 3.52 2013 13,010,191,978 1,153,862,901 14,164,054,879 3.81 2014 13,150,792,759 1,219,229,512 14,370,022,271 3.80 2015 13,310,324,042 1,360,098,135 14,670,422,177 3.95
Source: Skagit County Assessors Office
Skagit County does not estimate actual value. Re-evaluations occur on a market resale base.The County is revalued in each four year period by area, and statistically updated annually.Valuation data of assessed property may not coincide with fiscal year end.
SKAGIT COUNTY, WASHINGTON
-
2,000,000,000
4,000,000,000
6,000,000,000
8,000,000,000
10,000,000,000
12,000,000,000
14,000,000,000
16,000,000,000
18,000,000,000
2004 2005 2006 2007 2008 2009 2010 2011 2012 2013 2014 2015
Valu
e ($
)
Year
Total Assessed Value 12 year trend
187
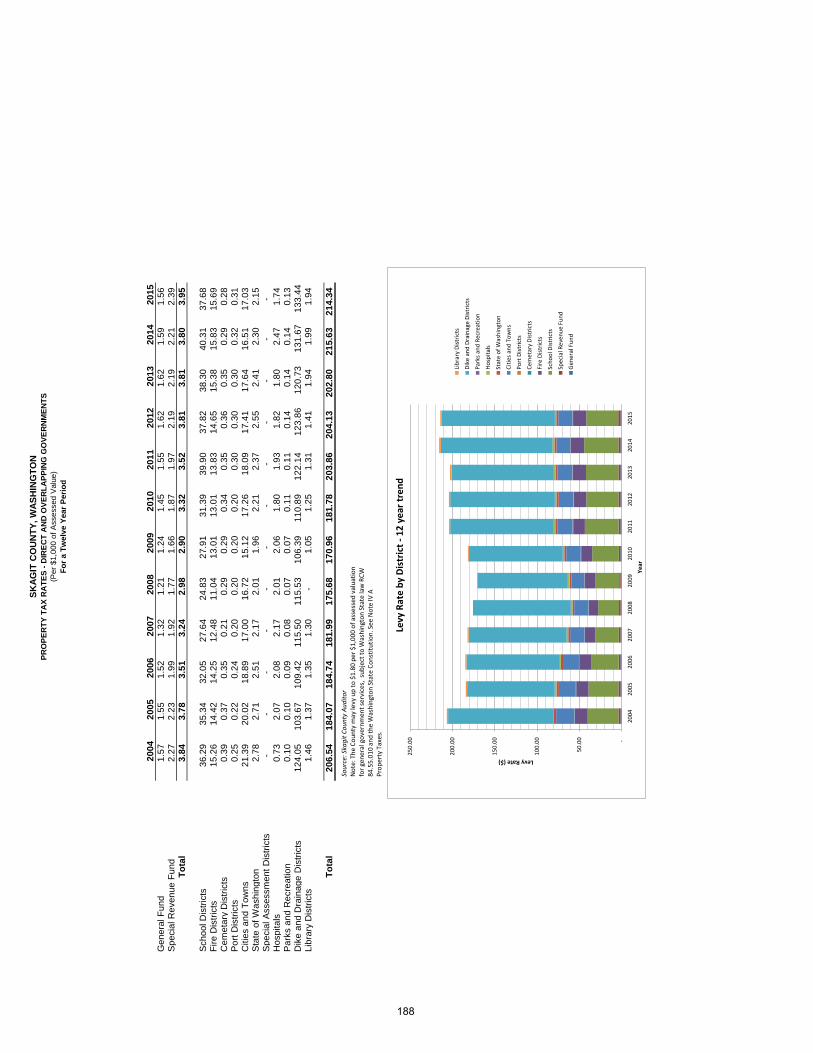
SKAG
IT C
OU
NTY
, WAS
HIN
GTO
NPR
OPE
RTY
TA
X R
ATE
S - D
IREC
T A
ND
OVE
RLA
PPIN
G G
OVE
RN
MEN
TS(P
er $
1,00
0 of
Ass
esse
d V
alue
)Fo
r a T
wel
ve Y
ear P
erio
d
2004
2005
2006
2007
2008
2009
2010
2011
2012
2013
2014
2015
Gen
eral
Fun
d1.
57
1.
55
1.
52
1.
32
1.
21
1.
24
1.
45
1.
55
1.
62
1.
62
1.
59
1.
56
S
peci
al R
even
ue F
und
2.27
2.23
1.99
1.92
1.77
1.66
1.87
1.97
2.19
2.19
2.21
2.39
Tota
l3.
84
3.
78
3.
51
3.
24
2.
98
2.
90
3.
32
3.
52
3.
81
3.
81
3.
80
3.
95
Sch
ool D
istri
cts
36.2
9
35
.34
32.0
5
27
. 64
24. 8
3
27
.91
31.3
9
39
.90
37.8
2
38
. 30
40.3
1
37
.68
Fi
re D
istri
cts
15.2
6
14
.42
14.2
5
12
.48
11.0
4
13
.01
13.0
1
13
.83
14.6
5
15
.38
15.8
3
15
.69
C
emet
ary
Dis
trict
s0.
39
0.
37
0.
35
0.
21
0.
29
0.
29
0.
34
0.
35
0.
36
0.
35
0.
29
0.
28
P
ort D
istri
cts
0.25
0.22
0.24
0.20
0.20
0.20
0.20
0.30
0.30
0.30
0.32
0.31
Citi
es a
nd T
owns
21.3
9
20
.02
18. 8
9
17
. 00
16.7
2
15
.12
17.2
6
18
.09
17.4
1
17
.64
16.5
1
17
.03
S
tate
of W
ashi
ngto
n2.
78
2.
71
2.
51
2.
17
2.
01
1.
96
2.
21
2.
37
2.
55
2.
41
2.
30
2.
15
S
peci
al A
sses
smen
t Dis
trict
s-
-
-
-
-
-
-
-
-
-
-
-
H
ospi
tals
0.73
2.07
2.08
2.17
2.01
2.06
1.80
1.93
1.82
1.80
2.47
1.74
Par
ks a
nd R
ecre
atio
n0.
10
0.
10
0.
09
0.
08
0.
07
0.
07
0.
11
0.
11
0.
14
0.
14
0.
14
0.
13
D
ike
and
Dra
inag
e D
istri
cts
124.
05
103.
67
109.
42
115.
50
115.
53
106.
39
110.
89
122.
14
123.
8612
0.73
131.
6713
3.44
Libr
ary
Dis
trict
s1.
46
1.
37
1.
35
1.
30
-
1.
05
1.
25
1.
31
1.
41
1.
94
1.
99
1.
94
Tota
l20
6.54
18
4.07
18
4.74
18
1.99
17
5.68
17
0.96
18
1.78
20
3.86
20
4.13
20
2.80
21
5.63
21
4.34
So
urce
: Ska
git C
ount
y Au
dito
r N
ote:
The
Cou
nty
may
levy
up
to $
1.80
per
$1,
000
of a
sses
sed
valu
atio
n fo
r gen
eral
gov
ernm
ent s
ervi
ces,
sub
ject
to W
ashi
ngto
n St
ate
law
RCW
84
.55.
010
and
the
Was
hing
ton
Stat
e Co
nstit
utio
n. S
ee N
ote
IV A
Pr
oper
ty T
axes
.
-
50.
00
100
.00
150
.00
200
.00
250
.00
2004
2005
2006
2007
2008
2009
2010
2011
2012
2013
2014
2015
Levy Rate ($)
Year
Libr
ary
Dist
ricts
Dike
and
Dra
inag
e Di
stric
ts
Park
s and
Rec
reat
ion
Hosp
itals
Stat
e of
Was
hing
ton
Citie
s and
Tow
ns
Port
Dist
ricts
Cem
etar
y Di
stric
ts
Fire
Dist
ricts
Scho
ol D
istric
ts
Spec
ial R
even
ue F
und
Gen
eral
Fun
d
Levy
Rat
e by
Dis
tric
t - 1
2 ye
ar tr
end
188

STATISTICAL TABLESPROPERTY TAX LEVIES AND COLLECTIONS
For a Eighteen Year Period
(2) (1) Percent of (3) Percent ofPercent Delinquent Total Tax Outstanding Delinquent
Fiscal Total Tax Current Tax of Levy Tax Total Tax Collection Delinquent Taxes toYear Levy Collections Collected Collections Collections To Tax Levy Taxes Tax Levy
1998 $89,352,163 $86,952,100 97.31% $1,787,294 $88,739,394 99.31% $4,283,922 4.79%
1999 $94,362,332 $91,893,670 97.38% $2,343,855 $94,237,525 99.87% $4,326,870 4.59%
2000 $98,880,092 $96,467,052 97.56% $2,396,797 $98,863,849 99.98% $4,315,398 4.36%
2001 $103,218,485 $100,455,501 97.32% $2,327,907 $102,783,408 99.58% $4,711,147 4.56%
2002 $109,439,758 $106,712,231 97.51% $2,730,428 $109,442,659 100.00% $4,522,951 4.13%
2003 $114,559,571 $111,458,177 97.29% $2,642,949 $114,101,126 99.60% $4,744,271 4.14%
2004 $120,305,571 $118,243,328 98.29% $3,450,438 $121,693,766 101.15% $4,316,208 3.59%
2005 $128,295,473 $126,114,741 98.30% $2,837,863 $128,952,604 100.51% $3,539,485 2.76%
2006 135,462,007 133,783,316 98.76% 2,143,734 135,297,050 99.88% 3,255,603 2.40%
2007 145,773,155 144,360,528 99.03% 1,654,424 146,284,952 100.35% 3,952,926 2.71%
2008 154,061,268 150,977,621 98.00% 2,196,014 153,173,635 99.42% 4,475,235 2.90%
2009 161,166,776 156,767,949 97.27% 2,317,327 159,085,276 98.71% 6,518,704 4.04%
2010 164,971,138 159,652,294 96.78% 3,093,710 162,746,004 98.65% 8,118,042 4.92%
2011 168,555,708 163,942,409 97.26% 4,594,609 168,537,018 99.99% 7,664,747 4.55%
2012 171,985,718 167,991,026 97.67% 4,165,855 172,156,881 100.00% 7,966,597 4.63%
2013 182,248,613 179,129,124 98.29% 5,165,263 184,294,387 100.00% 5,654,739 3.10%
2014 182,581,205 179,125,895 98.11% 2,677,312 181,803,207 99.57% 5,386,231 2.95%
2015 188,233,865 185,179,581 98.38% 2,817,772 187,997,353 99.87% 4,910,855 2.60%
(1) Includes prior years delinquent tax collections, the County is in process of calculating the delinquent taxes by levy year.(2) Percent computed on current year's levy(3) Includes omissions, supplements, and cancellations
SKAGIT COUNTY, WASHINGTON
189

Assessment AssessmentReceivable Receivable
Year January 1 Additions Collections December 31
1998 2,909 141,833 139,667 5,075
1999 5,075 146,300 144,389 6,986
2000 6,986 145,544 143,754 8,776
2001 8,776 161,939 162,270 8,445
2002 8,445 168,455 169,158 7,742
2003 7,742 211,488 207,749 11,481
2004 11,481 202,269 199,281 14,469
2005 14,469 202,605 211,243 5,831
2006 5,831 205,152 205,576 5,407
2007 5,407 214,877 210,808 9,476
2008 9,476 1,292,246 1,270,652 31,070
2009 31,070 1,238,778 1,224,388 45,460
2010 45,460 1,492,343 1,463,845 73,958
2011 73,958 1,459,849 1,430,920 102,887
2012 102,887 1,470,508 1,471,216 102,179
2013 102,179 1,524,402 1,566,780 59,801
2014 59,801 1,535,589 1,529,046 66,344
2015 66,344 1,507,674 1,511,571 62,447
SOURCE: Skagit County Treasurer
SKAGIT COUNTY, WASHINGTONSTATISTICAL TABLES
SPECIAL ASSESSMENT COLLECTIONSFor a Eighteen Year Period
190

Ratio ofNet Bonded Debt Per
Assessed Net Bonded Debt to CapitaYear Population Value Debt Assessed Value (restated)
2004 106,700 9,109,187,252 12,015,000 0.1862% 159
2005 108,800 9,635,294,684 14,740,000 0.1247% 110
2006 110,900 10,221,638,386 21,690,000 0.1442% 133
2007 113,100 11,594,699,782 21,025,000 0.1871% 192
2008 115,300 14,004,423,861 19,485,000 0.1501% 182
2009 117,500 16,166,682,507 17,880,000 0.1205% 166
2010 118,900 16,868,200,169 25,945,000 0.1060% 150
2011 116,901 15,210,471,781 24,210,000 0.1706% 222
2012 117,400 14,494,671,744 22,415,000 0.1670% 206
2013 118,837 14,164,054,879 27,790,000 0.1583% 189
2014 120,365 14,370,022,271 78,730,000 0.1934% 231
2015 121,846 14,670,422,177 76,890,000 0.5367% 646
SKAGIT COUNTY, WASHINGTONSTATISTICAL TABLES
RATIO OF NET GENERAL BONDED DEBT TO ASSESSED VALUEAND NET BONDED DEBT PER CAPITA
For a Twelve Year Period
0.1862%
0.1247% 0.1442%
0.1871%
0.1501% 0.1205%
0.1060%
0.1706% 0.1670% 0.1583% 0.1934%
0.5367%
0.0000%
0.1000%
0.2000%
0.3000%
0.4000%
0.5000%
0.6000%
2004 2005 2006 2007 2008 2009 2010 2011 2012 2013 2014 2015
Perc
enta
ge (%
)
Year
Ratio of Net Bonded Debt to Assessed Value 10 Year Trend
191

SKAG
IT C
OU
NTY
, WAS
HIN
GTO
NLi
mita
tion
of In
debt
edne
ssLa
st T
en F
isca
l Yea
rs20
0620
0720
0820
0920
1020
1120
1220
1320
1420
15
Tota
l Tax
able
Pro
pert
y Va
lue
11,5
94,6
99,7
82$
14,0
04,4
23,8
61$
16,1
66,6
82,5
07$
16,8
68,2
00,1
69$
15,2
10,4
71,7
81$
14
,494
,671
,744
$
14
,164
,054
,879
$
14
,370
,022
,271
$
14
,670
,422
,177
$
15,4
46,1
13,6
86$
Inde
bted
ness
for G
ener
al P
urpo
se W
ithou
t a V
ote
Deb
t Lim
it - 1
.5%
of T
otal
Ass
esse
d V
alue
173,
920,
497
210,
066,
358
242,
500,
238
253,
023,
003
228,
157,
077
217,
420,
076
212,
460,
823
215,
550,
334
220,
056,
333
23
1,69
1,70
5
Deb
t App
licab
le to
Lim
it: O
utst
andi
ng D
ebt
22,2
65,0
00
21,0
25,0
00
19,4
85,0
00
17,8
80,0
00
25,9
45,0
00
24
,210
,000
30
,400
,000
27
,790
,000
78
,730
,000
76,8
90,0
00
A
dd A
sset
s A
vaila
ble
9,16
3,48
1
9,
145,
795
9,63
6,10
4
6,
735,
282
11,3
24,2
48
16
,395
,142
13
,861
,676
16
,550
,695
16
,040
,207
19,3
33,0
88
To
tal D
ebt A
pplic
able
to L
imit
13,1
01,5
19
11,8
79,2
05
9,84
8,89
6
11
,144
,718
14
,620
,752
7,81
4,85
8
16
,538
,324
11
,239
,305
62
,689
,793
57,5
56,9
12
Rem
aini
ng D
ebt C
apac
ity W
ithou
t a V
ote
160,
818,
978
198,
187,
153
232,
651,
342
241,
878,
285
213,
536,
325
209,
605,
218
195,
922,
499
204,
311,
029
157,
366,
540
17
4,13
4,79
3
Inde
bted
ness
for G
ener
al P
urpo
se W
ith a
Vot
e
Deb
t Lim
it - 2
.5%
of T
otal
Ass
esse
d V
alue
350,
110,
597
404,
167,
063
421,
705,
004
421,
705,
004
380,
261,
795
362,
366,
794
354,
101,
372
359,
250,
557
366,
760,
554
38
6,15
2,84
2
Rem
aini
ng D
ebt C
apac
ity In
clud
ing
Vot
ed D
ebt
176,
190,
100
$
194,
100,
705
$
17
9,20
4,76
7$
1 68,
682,
002
$
15
2,10
4,71
8$
14
4,94
6,71
7$
1 41,
640,
549
$
143,
700,
223
$
146,
704,
222
$
1 54,
461,
137
$
Tota
l net
deb
t app
licab
le to
the
limit
as a
pe
rcen
tage
of d
ebt l
imit
7.53
%5.
65%
4.06
%4.
40%
6.41
%3.
59%
7.78
%5.
21%
28.4
9%24
.84%
192

Business-Type Activities
Fiscal Year
General Obligation Bonds Loans Payable
General Obligation Bonds
Total Primary Government
Percentage of Personal
Income Per Capita
2005 12,121,474 2,466,474 6,450,000 21,037,948 0.52% 1672006 19,660,153 2,875,153 5,480,000 28,015,306 0.63% 2222007 20,479,969 4,124,969 4,670,000 29,274,938 0.58% 2182008 19,162,639 3,637,639 3,960,000 26,760,278 0.52% 1972009 18,535,164 3,880,164 3,225,000 25,640,328 0.49% 1832010 17,892,073 4,147,073 12,200,000 34,239,146 0.96% 2572011 16,886,503 4,086,503 11,410,000 32,383,006 0.63% 2412012 11,825,000 3,848,383 10,590,000 26,263,383 0.69% 1902013 18,050,000 3,153,698 9,740,000 30,943,698 0.85% 2342014 17,550,000 2,802,125 61,180,000 81,532,125 2.42% 6542015 16,205,000 2,677,791 60,685,000 79,567,791 2.29% 631
SKAGIT COUNTY, WASHINGTONRatios of Outstanding Debt by Type
Last Eleven Fiscal Years
Governmental Activities
193

STATISTICAL TABLESCOMPUTATION OF DIRECT & OVERLAPPING DEBT
FOR THE YEAR ENDED DECEMBER 31, 2015
PERCENTAGE AMOUNTNET DEBT APPLICABLE TO APPLICABLE TO
JURISDICTION OUTSTANDING SKAGIT COUNTY SKAGIT COUNTY
Direct Debt Skagit County $19,471,662 100% $19,471,662Total Direct Debt 19,471,662 19,471,662
Overlapping debt Port Districts 22,460,000 100% 22,460,000 Hospital Districts 87,225,000 100% 87,225,000 School Districts 131,713,500 100% 131,713,500 Sewer Districts 6,050,023 100% 6,050,023 Dike Districts - 100% - Fire Districts 4,798,933 100% 4,798,933 Fidalgo Parks 471,971 100% 471,971
Total Overlapping Debt 252,719,427 252,719,427
Total Direct & Overlapping Debt $272,191,089 $272,191,089
Source: Skagit County Treasurer and appropriate city finance offices
SKAGIT COUNTY, WASHINGTON
Skagit County
7%
Port Districts 8%
Hospital Districts 32%
School Districts 49%
Sewer Districts 2%
Dike Districts 0%
Fire Districts
2% Fidalgo Parks
0%
Net Outstanding Debt per Entity
194

Ratio ofInterest Total* Total** Net Bonded
and Fiscal Debt General Debt toYear Principal Charges Service Expenditures Assessed Value
2003 795,158 519,350 1,314,508 71,338,939 1.84%
2004 780,879 506,051 1,286,930 76,086,592 1.69%
2005 556,609 520,792 1,077,401 82,341,301 1.31%
2006 574,151 503,345 1,077,496 86,487,275 1.25%
2007 960,427 685,115 1,645,542 88,073,635 1.87%
2008 2,308,099 679,353 2,987,452 95,914,780 3.11%
2009 1,017,081 627,364 1,644,445 96,624,411 1.70%
2010 1,058,134 589,480 1,647,614 88,297,993 1.87%
2011 1,116,572 600,115 1,716,687 87,283,536 1.97%
2012 1,213,119 565,948 1,779,067 92,288,732 1.93%
2013 2,084,813 667,297 2,752,110 93,858,633 2.93%
2014 2,772,142 693,958 3,466,100 92,805,069 3.73%
2015 1,469,334 681,870 2,151,204 92,232,364 2.33%
* Does not include Enterprise Funds `
** Includes General, Special Revenue, Capital Projects, and Debt Service funds
TO TOTAL GENERAL EXPENDITURES FOR A THIRTEEN YEAR PERIOD
SKAGIT COUNTY, WASHINGTONRATIO OF ANNUAL DEBT SERVICE EXPENDITURES FOR GENERAL BONDED DEBT
195

SKAG
IT C
OU
NTY
, WAS
HIN
GTO
ND
emog
raph
ic S
tatis
tics
For a
Tw
elve
Yea
r Per
iod
as o
f Apr
il
2004
2005
2006
2007
2008
2009
2010
2011
2012
2013
2014
2015
Uni
ncor
pora
ted
46,4
5547
,250
47,8
86
48
,640
49,7
20
49
,915
48,1
12
48
,255
48,3
45
48
,411
48
,720
49
,220
In
corp
orat
ed62
,345
63,6
5065
,214
66,6
60
67
,780
68,9
85
68
,789
69,1
45
69
,605
70,1
89
70,7
80
71,4
00
Tota
ls10
8,80
011
0,90
011
3,10
011
5,30
011
7,50
011
8,90
011
6,90
111
7,40
011
7,95
011
8,60
011
9,50
012
0,62
0
Inco
me
Per C
apita
30,9
47$
32
,288
$
35,4
22$
37
,289
$
37,9
89$
37
,076
$
$26,
925
$38,
225
$27,
447
$27,
395
$27,
065
$27,
598
Une
mpl
oym
ent
Rat
e7.
9%6.
4%5.
5%4.
8%5.
6%10
.2%
10.7
%10
.2%
9.2%
8.7%
5.8%
6.6%
Scho
olEn
rollm
ent
18,9
3219
,332
19,2
33
19
,249
19, 2
96
18
,723
18,8
7818
,668
18,9
2018
,678
18,8
6918
,920
SOU
RCE:
Offi
ce o
f Fin
anci
al M
anag
emen
t, Fo
reca
stin
g Di
visio
n, S
tate
of W
ashi
ngto
n Em
ploy
men
t Sec
urity
Dep
artm
ent,
Stat
e of
W
ashi
ngto
n, E
duca
tiona
l Ser
vice
Dist
rict #
189,
Sta
te o
f Was
hing
ton,
Offi
ce o
f Sup
erin
tend
ent o
f Pub
lic In
stru
ctio
n
$-
$5,
000
$10
,000
$15
,000
$20
,000
$25
,000
$30
,000
$35
,000
$40
,000
$45
,000
2004
2005
2006
2007
2008
2009
2010
2011
2012
2013
2014
2015
Income per Capita ($)
Year
Inco
me
Per C
apita
10
Year
Tre
nd
196

TaxpayerTaxable Assessed
Value Rank
Percentage of Total Taxable
Assessed ValueTaxable Assessed
Value Rank
Percentage of Total Taxable
Assessed Value
Equilon Enterprises LLC $517,129,300 1 3.52% 299,539,613$ 1 2.58%
Tesoro Refining and Marketing Corp 364,923,000 2 2.49% 213,364,380 2 1.84%
Puget Sound Energy/Electric 361,193,453 3 2.46% 205,682,135 3 1.77%
Tesoro Logistics Operations LLC 73,320,000 4 0.50%
Sierra Pacific Industries 69,542,300 5 0.47%
PACCAR Inc Truck Testing 69,471,000 6 0.47% 26,741,812 10 0.23%
Pacific Woodtech Corporation 59,105,900 7 0.40% 39,829,500 7 0.34%
Frontier Property Tax Dept NCA 43,686,173 8 0.30%
NW Pipeline GP 37,581,060 9 0.26% 40,855,918 6 0.35%
Health Care Reit Inc 32,349,000 10 0.22%
1,628,301,186 11.10% 7.12%
Total County Assessed Value 14,670,422,177$ 11,594,699,782$
Source: Skagit County Assessor
2015 2005
SKAGIT COUNTY, WASHINGTONSTATISTICAL TABLES
Principal Property Tax PayersCurrent and Ten Years Ago
197

EmployerNumber of Employees Rank
Percentage of Total Labor Force
Number of Employees Rank
Percentage of Total Labor Force
Skagit Regional Health 2,000 1 3.52% 1,030 2 1.84%
Mount Vernon School District 815 2 1.43%
Shell Puget Sound Refinery 726 3 1.28% 413 7 0.74%
Island Hospital 718 4 1.26% 508 4 0.91%
Janicki Industries 695 5 1.22%
Skagit County Government 636 6 1.12% 846 3 1.51%
Swinomish Casino 499 7 0.88% 299 11 0.53%
Walmart 425 8 0.75% 271 14 0.48%
Tesoro Refinery 400 9 0.70% 356 8 0.64%
Sedro-Woolley School District 366 10 0.64%
Total Top Ten Employees 7,280 12.80% 3,723 6.65%
Total County Labor Force 56,855 55,990
Source: Employment Security Port of Skagit
SKAGIT COUNTY, WASHINGTONSTATISTICAL TABLES
Principal EmployersCurrent and Ten Years Ago
2015 2005
198
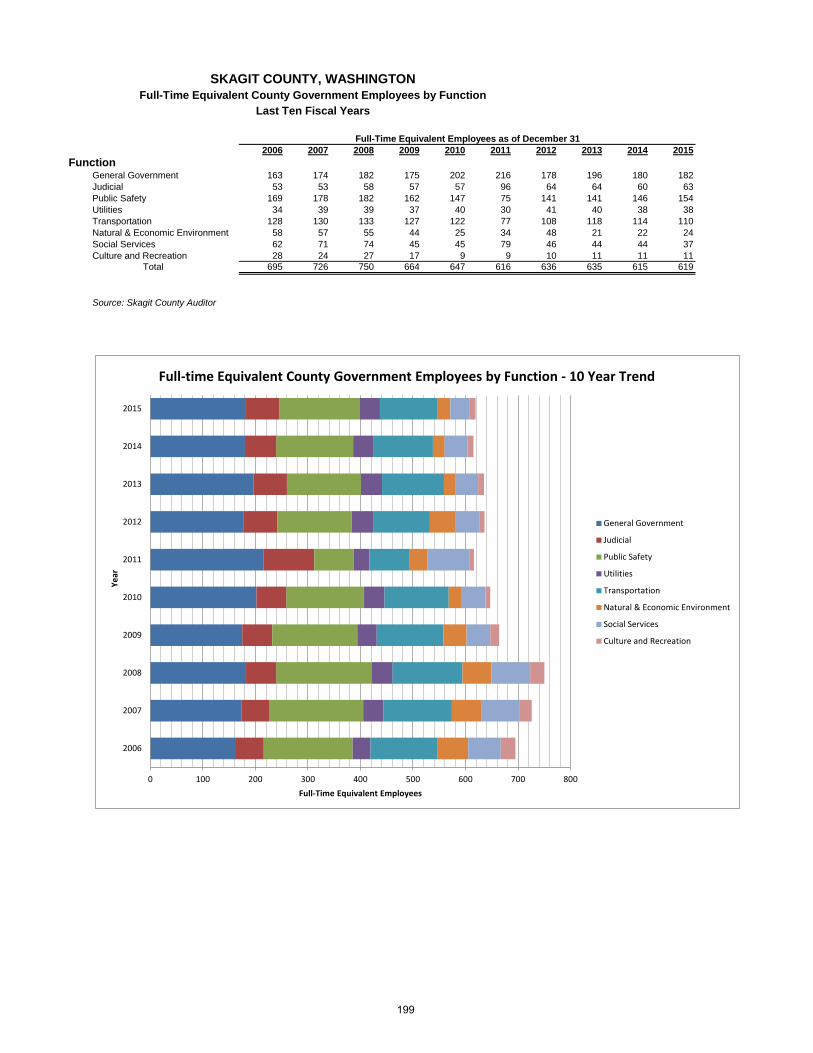
2006 2007 2008 2009 2010 2011 2012 2013 2014 2015Function
General Government 163 174 182 175 202 216 178 196 180 182Judicial 53 53 58 57 57 96 64 64 60 63Public Safety 169 178 182 162 147 75 141 141 146 154Utilities 34 39 39 37 40 30 41 40 38 38Transportation 128 130 133 127 122 77 108 118 114 110Natural & Economic Environment 58 57 55 44 25 34 48 21 22 24Social Services 62 71 74 45 45 79 46 44 44 37Culture and Recreation 28 24 27 17 9 9 10 11 11 11
695 726 750 664 647 616 636 635 615 619
Source: Skagit County Auditor
Total
SKAGIT COUNTY, WASHINGTONFull-Time Equivalent County Government Employees by Function
Last Ten Fiscal Years
Full-Time Equivalent Employees as of December 31
0 100 200 300 400 500 600 700 800
2006
2007
2008
2009
2010
2011
2012
2013
2014
2015
Full-Time Equivalent Employees
Year
General Government
Judicial
Public Safety
Utilities
Transportation
Natural & Economic Environment
Social Services
Culture and Recreation
Full-time Equivalent County Government Employees by Function - 10 Year Trend
199
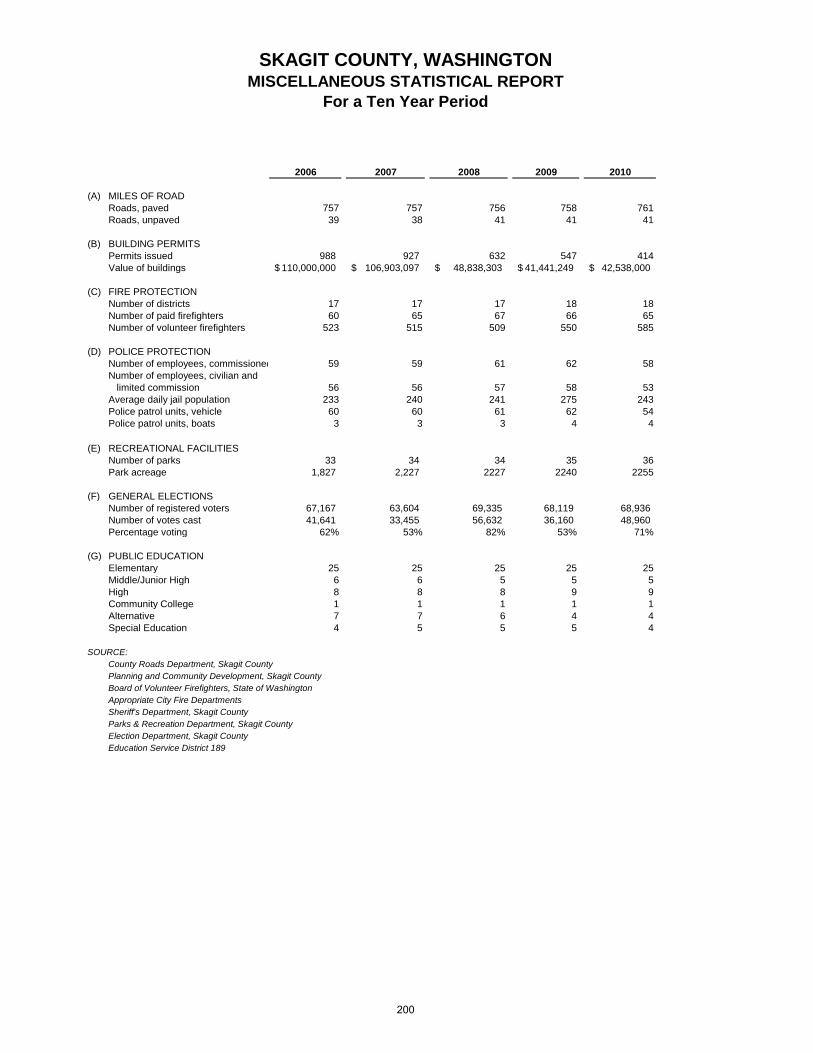
SKAGIT COUNTY, WASHINGTONMISCELLANEOUS STATISTICAL REPORT
For a Ten Year Period
2006 2007 2008 2009 2010
(A) MILES OF ROADRoads, paved 757 757 756 758 761Roads, unpaved 39 38 41 41 41
(B) BUILDING PERMITSPermits issued 988 927 632 547 414Value of buildings 110,000,000$ 106,903,097$ 48,838,303$ 41,441,249$ 42,538,000$
(C) FIRE PROTECTIONNumber of districts 17 17 17 18 18Number of paid firefighters 60 65 67 66 65Number of volunteer firefighters 523 515 509 550 585
(D) POLICE PROTECTIONNumber of employees, commissioned 59 59 61 62 58Number of employees, civilian and limited commission 56 56 57 58 53Average daily jail population 233 240 241 275 243Police patrol units, vehicle 60 60 61 62 54Police patrol units, boats 3 3 3 4 4
(E) RECREATIONAL FACILITIESNumber of parks 33 34 34 35 36Park acreage 1,827 2,227 2227 2240 2255
(F) GENERAL ELECTIONSNumber of registered voters 67,167 63,604 69,335 68,119 68,936 Number of votes cast 41,641 33,455 56,632 36,160 48,960 Percentage voting 62% 53% 82% 53% 71%
(G) PUBLIC EDUCATIONElementary 25 25 25 25 25Middle/Junior High 6 6 5 5 5High 8 8 8 9 9Community College 1 1 1 1 1Alternative 7 7 6 4 4Special Education 4 5 5 5 4
SOURCE:County Roads Department, Skagit CountyPlanning and Community Development, Skagit CountyBoard of Volunteer Firefighters, State of WashingtonAppropriate City Fire DepartmentsSheriff's Department, Skagit CountyParks & Recreation Department, Skagit CountyElection Department, Skagit CountyEducation Service District 189
200

SKAGIT COUNTY, WASHINGTONMISCELLANEOUS STATISTICAL REPORT
For a Ten Year Period
(A) MILES OF ROADRoads, pavedRoads, unpaved
(B) BUILDING PERMITSPermits issuedValue of buildings
(C) FIRE PROTECTIONNumber of districtsNumber of paid firefightersNumber of volunteer firefighters
(D) POLICE PROTECTIONNumber of employees, commissioneNumber of employees, civilian and limited commissionAverage daily jail populationPolice patrol units, vehiclePolice patrol units, boats
(E) RECREATIONAL FACILITIESNumber of parksPark acreage
(F) GENERAL ELECTIONSNumber of registered votersNumber of votes castPercentage voting
(G) PUBLIC EDUCATIONElementaryMiddle/Junior HighHighCommunity CollegeAlternativeSpecial Education
SOURCE:County Roads Department, Skagit CounPlanning and Community Development, Board of Volunteer Firefighters, State of Appropriate City Fire DepartmentsSheriff's Department, Skagit CountyParks & Recreation Department, Skagit Election Department, Skagit CountyEducation Service District 189
2011 2012 2013 2014 2015
761 760 761 761 76141 41 40 40 40
416 424 445 392 59138,893,281$ 40,588,568$ 58,051,285$ 57,696,373$ 62,443,127$
18 18 18 18 1865 65 65 65 65
568 561 559 572 589
46 44 50 52 51
53 59 55 56 65196 226.3 247.7 235 205
49 71 55 56 555 5 5 4 4
26 32 29 29 292300 2153.5 2054.5 2054.5 2058.05
68,996$ 72,966 74,075 75,774 74,282 38,256$ 56,262 35,847 40,825 29,784
59% 83% 53% 61% 43%
25 25 26 26 265 5 5 5 56 6 6 6 61 1 1 1 16 8 8 8 84 5 5 4 4
201

Compliance Section
202

Fede
ral A
genc
y (P
ass-
Thro
ugh
Age
ncy)
Fede
ral P
rogr
amC
FDA
N
umbe
rO
ther
Aw
ard
Num
ber
Expe
nditu
res
Pass
ed th
roug
h to
Su
brec
ipie
nts
Not
e
From
Pas
s-Th
roug
h A
war
dsFr
om D
irect
A
war
dsTo
tal
Farm
Ser
vice
Age
ncy,
D
epar
tmen
t Of A
gric
ultu
reC
onse
rvat
ion
Res
erve
Pr
ogra
m10
.069
CR
EP 2
003
0055
Day
Cre
ek-
274
274
-1,
2
Farm
Ser
vice
Age
ncy,
D
epar
tmen
t Of A
gric
ultu
reC
onse
rvat
ion
Res
erve
Pr
ogra
m10
.069
CR
EP 2
005
0072
Mar
tin
Slou
gh-
Roc
kpor
t
-6,
519
6,51
9-
1, 2
Tota
l CFD
A 1
0.06
9:
-6,
793
6,79
3-
Chi
ld N
utrit
ion
Clu
ster
Food
And
Nut
ritio
n Se
rvic
e,
Dep
artm
ent O
f Agr
icul
ture
(via
O
ffice
of S
uper
inte
nden
t of P
ublic
In
stru
ctio
n)
Scho
ol B
reak
fast
Pr
ogra
m10
.553
29-3
20-9
788
2,93
4-
2,93
4-
1
Food
And
Nut
ritio
n Se
rvic
e,
Dep
artm
ent O
f Agr
icul
ture
(via
O
ffice
of S
uper
inte
nden
t of P
ublic
In
stru
ctio
n)
Scho
ol B
reak
fast
Pr
ogra
m10
.553
29-3
20-9
788
4,40
1-
4,40
1-
1
Tota
l CFD
A 1
0.55
3:
7,33
4-
7,33
4-
Food
And
Nut
ritio
n Se
rvic
e,
Dep
artm
ent O
f Agr
icul
ture
(via
O
ffice
of S
uper
inte
nden
t of P
ublic
In
stru
ctio
n)
Nat
iona
l Sch
ool L
unch
Pr
ogra
m10
.555
29-3
20-9
788
4,60
5-
4,60
5-
1
Food
And
Nut
ritio
n Se
rvic
e,
Dep
artm
ent O
f Agr
icul
ture
(via
O
ffice
of S
uper
inte
nden
t of P
ublic
In
stru
ctio
n)
Nat
iona
l Sch
ool L
unch
Pr
ogra
m10
.555
29-3
20-9
788
2,81
8-
2,81
8-
1
Tota
l CFD
A 1
0.55
5:
7,42
3-
7,42
3-
Tota
l Chi
ld N
utrit
ion
Clu
ster
: 14
,757
-14
,757
-
Skag
it C
ount
ySc
hedu
le o
f Exp
endi
ture
s of
Fed
eral
Aw
ards
For t
he Y
ear E
nded
Dec
embe
r 31,
201
5
The
acco
mpa
nyin
g no
tes
are
an in
tegr
al p
art o
f thi
s sc
hedu
le.
203

Fede
ral A
genc
y (P
ass-
Thro
ugh
Age
ncy)
Fede
ral P
rogr
amC
FDA
N
umbe
rO
ther
Aw
ard
Num
ber
Expe
nditu
res
Pass
ed th
roug
h to
Su
brec
ipie
nts
Not
e
From
Pas
s-Th
roug
h A
war
dsFr
om D
irect
A
war
dsTo
tal
Food
And
Nut
ritio
n Se
rvic
e,
Dep
artm
ent O
f Agr
icul
ture
(via
W
ashi
ngto
n St
ate
Dep
artm
ent o
f H
ealth
)
Spec
ial S
uppl
emen
tal
Nut
ritio
n Pr
ogra
m fo
r W
omen
, Inf
ants
, and
C
hild
ren
10.5
57C
1712
491
,065
-91
,065
18,9
251,
4 (d)
Food
And
Nut
ritio
n Se
rvic
e,
Dep
artm
ent O
f Agr
icul
ture
(via
W
ashi
ngto
n St
ate
Dep
artm
ent o
f H
ealth
)
WIC
Far
mer
s' M
arke
t N
utrit
ion
Prog
ram
(F
MN
P)
10.5
72C
1712
424
0-
240
-1,
4 (d)
Food
And
Nut
ritio
n Se
rvic
e,
Dep
artm
ent O
f Agr
icul
ture
(via
N
orth
wes
t Reg
iona
l Cou
ncil)
Seni
or F
arm
ers
Mar
ket
Nut
ritio
n Pr
ogra
m10
.576
1630
09-N
UTR
5,68
4-
5,68
4-
1
Food
And
Nut
ritio
n Se
rvic
e,
Dep
artm
ent O
f Agr
icul
ture
(via
N
orth
wes
t Reg
iona
l Cou
ncil)
Seni
or F
arm
ers
Mar
ket
Nut
ritio
n Pr
ogra
m10
.576
1630
09-N
UTR
Vo
uche
rs4,
262
-4,
262
-1,
6
Tota
l CFD
A 1
0.57
6:
9,94
6-
9,94
6-
Fore
st S
ervi
ce S
choo
ls a
nd R
oads
Clu
ster
Fore
st S
ervi
ce, D
epar
tmen
t Of
Agric
ultu
reSc
hool
s an
d R
oads
- G
rant
s to
Sta
tes
10.6
65Ti
tle I
Fore
st
Yiel
d-
250,
498
250,
498
-1
Fore
st S
ervi
ce, D
epar
tmen
t Of
Agric
ultu
reSc
hool
s an
d R
oads
- G
rant
s to
Sta
tes
10.6
65Ti
tle II
I For
est
Yiel
d-
41,2
4641
,246
-1
Tota
l For
est S
ervi
ce S
choo
ls a
nd R
oads
Clu
ster
: -
291,
744
291,
744
-
Nat
iona
l Oce
anic
And
At
mos
pher
ic A
dmin
istra
tion
(noa
a), D
epar
tmen
t Of
Com
mer
ce (v
ia N
orth
wes
t Stra
its
Com
mis
sion
)
Coa
stal
Zon
e M
anag
emen
t Ad
min
istra
tion
Awar
ds
11.4
19SE
ANW
A-20
14-
SkC
oPW
-000
034,
407
-4,
407
2,91
21
Skag
it C
ount
ySc
hedu
le o
f Exp
endi
ture
s of
Fed
eral
Aw
ards
For t
he Y
ear E
nded
Dec
embe
r 31,
201
5
The
acco
mpa
nyin
g no
tes
are
an in
tegr
al p
art o
f thi
s sc
hedu
le.
204

Fede
ral A
genc
y (P
ass-
Thro
ugh
Age
ncy)
Fede
ral P
rogr
amC
FDA
N
umbe
rO
ther
Aw
ard
Num
ber
Expe
nditu
res
Pass
ed th
roug
h to
Su
brec
ipie
nts
Not
e
From
Pas
s-Th
roug
h A
war
dsFr
om D
irect
A
war
dsTo
tal
Nat
iona
l Oce
anic
And
At
mos
pher
ic A
dmin
istra
tion
(noa
a), D
epar
tmen
t Of
Com
mer
ce (v
ia W
ashi
ngto
n R
ecre
atio
n an
d C
onse
rvat
ion
Offi
ce)
Paci
fic C
oast
Sal
mon
R
ecov
ery_
Paci
fic
Salm
on T
reat
y Pr
ogra
m
11.4
3813
-105
2R D
avid
Sl
ough
Fis
h Pa
ssag
e
39,8
20-
39,8
20-
1, 2
Nat
iona
l Oce
anic
And
At
mos
pher
ic A
dmin
istra
tion
(noa
a), D
epar
tmen
t Of
Com
mer
ce (v
ia W
ashi
ngto
n R
ecre
atio
n an
d C
onse
rvat
ion
Offi
ce)
Paci
fic C
oast
Sal
mon
R
ecov
ery_
Paci
fic
Salm
on T
reat
y Pr
ogra
m
11.4
38R
CO
#14-
1264
P28
,324
-28
,324
-1,
2
Nat
iona
l Oce
anic
And
At
mos
pher
ic A
dmin
istra
tion
(noa
a), D
epar
tmen
t Of
Com
mer
ce (v
ia W
ashi
ngto
n R
ecre
atio
n an
d C
onse
rvat
ion
Offi
ce)
Paci
fic C
oast
Sal
mon
R
ecov
ery_
Paci
fic
Salm
on T
reat
y Pr
ogra
m
11.4
38R
CO
#14-
1263
R78
,648
-78
,648
-1,
2
Tota
l CFD
A 1
1.43
8:
146,
792
-14
6,79
2-
CD
BG
- St
ate-
Adm
inis
tere
d C
DB
G C
lust
er
Offi
ce O
f Com
mun
ity P
lann
ing
And
Dev
elop
men
t, D
epar
tmen
t O
f Hou
sing
And
Urb
an
Dev
elop
men
t (vi
a St
ate
of
Was
hing
ton
Dep
artm
ent o
f C
omm
erce
)
Com
mun
ity
Dev
elop
men
t Blo
ck
Gra
nts/
Stat
e's
prog
ram
an
d N
on-E
ntitl
emen
t G
rant
s in
Haw
aii
14.2
2814
-654
00-0
1219
,513
-19
,513
19,5
131
Offi
ce O
f Com
mun
ity P
lann
ing
And
Dev
elop
men
t, D
epar
tmen
t O
f Hou
sing
And
Urb
an
Dev
elop
men
t (vi
a St
ate
of
Was
hing
ton
Dep
artm
ent o
f C
omm
erce
)
Com
mun
ity
Dev
elop
men
t Blo
ck
Gra
nts/
Stat
e's
prog
ram
an
d N
on-E
ntitl
emen
t G
rant
s in
Haw
aii
14.2
2815
-622
10-0
1225
,090
-25
,090
25,0
901
Tota
l CD
BG
- St
ate-
Adm
inis
tere
d C
DB
G C
lust
er:
44,6
03-
44,6
0344
,603
Skag
it C
ount
ySc
hedu
le o
f Exp
endi
ture
s of
Fed
eral
Aw
ards
For t
he Y
ear E
nded
Dec
embe
r 31,
201
5
The
acco
mpa
nyin
g no
tes
are
an in
tegr
al p
art o
f thi
s sc
hedu
le.
205

Fede
ral A
genc
y (P
ass-
Thro
ugh
Age
ncy)
Fede
ral P
rogr
amC
FDA
N
umbe
rO
ther
Aw
ard
Num
ber
Expe
nditu
res
Pass
ed th
roug
h to
Su
brec
ipie
nts
Not
e
From
Pas
s-Th
roug
h A
war
dsFr
om D
irect
A
war
dsTo
tal
Bure
au O
f Rec
lam
atio
n,
Dep
artm
ent O
f The
Inte
rior (
via
Sam
ish
Indi
an N
atio
n)
Indi
an T
ribal
Wat
er
Res
ourc
es
Dev
elop
men
t, M
anag
emen
t, an
d Pr
otec
tion
15.5
19Va
ldov
ino
Fish
H
abita
t En
hanc
emen
t Pr
ojec
t #R
12AP
1300
3/52
010-
2015
-01
9,50
0-
9,50
0-
1
Dru
g En
forc
emen
t Adm
inis
tratio
n,
Dep
artm
ent O
f Jus
tice
(via
W
ashi
ngto
n St
ate
Patro
l)
Law
Enf
orce
men
t As
sist
ance
_Nar
cotic
s an
d D
ange
rous
D
rugs
_Lab
orat
ory
Anal
ysis
16.0
01D
omes
tic
Can
nabi
s Er
adic
atio
n/Su
pre
ssio
n K1
1067
20,0
00-
20,0
00-
1
Offi
ce O
f Juv
enile
Jus
tice
And
Del
inqu
ency
Pre
vent
ion,
D
epar
tmen
t Of J
ustic
e (v
ia
Was
hing
ton
Stat
e D
epar
tmen
t of
Hea
lth &
Soc
ial S
ervi
ces)
Juve
nile
Acc
ount
abilit
y Bl
ock
Gra
nts
16.5
2314
63-1
7297
3,48
6-
3,48
6-
1, 2
Viol
ence
Aga
inst
Wom
en O
ffice
, D
epar
tmen
t Of J
ustic
e (v
ia
Was
hing
ton
Stat
e D
epar
tmen
t of
Com
mer
ce)
Viol
ence
Aga
inst
W
omen
For
mul
a G
rant
s16
.588
F14-
3110
3-05
613
,694
-13
,694
-1,
2
Bure
au O
f Jus
tice
Assi
stan
ce,
Dep
artm
ent O
f Jus
tice
(via
W
ashi
ngto
n St
ate
Dep
artm
ent o
f So
cial
& H
ealth
Ser
vice
s-R
esid
entia
l Sub
stan
ce A
buse
Tr
eatm
ent)
Res
iden
tial S
ubst
ance
Ab
use
Trea
tmen
t for
St
ate
Pris
oner
s
16.5
9311
63-3
8470
59,5
72-
59,5
7259
,572
1, 2
Bure
au O
f Jus
tice
Assi
stan
ce,
Dep
artm
ent O
f Jus
tice
(via
W
ashi
ngto
n St
ate
Dep
artm
ent o
f So
cial
& H
ealth
Ser
vice
s-R
esid
entia
l Sub
stan
ce A
buse
Tr
eatm
ent)
Res
iden
tial S
ubst
ance
Ab
use
Trea
tmen
t for
St
ate
Pris
oner
s
16.5
9315
63-5
3486
23,1
00-
23,1
0023
,100
1, 2
Tota
l CFD
A 1
6.59
3:
82,6
72-
82,6
7282
,672
Skag
it C
ount
ySc
hedu
le o
f Exp
endi
ture
s of
Fed
eral
Aw
ards
For t
he Y
ear E
nded
Dec
embe
r 31,
201
5
The
acco
mpa
nyin
g no
tes
are
an in
tegr
al p
art o
f thi
s sc
hedu
le.
206

Fede
ral A
genc
y (P
ass-
Thro
ugh
Age
ncy)
Fede
ral P
rogr
amC
FDA
N
umbe
rO
ther
Aw
ard
Num
ber
Expe
nditu
res
Pass
ed th
roug
h to
Su
brec
ipie
nts
Not
e
From
Pas
s-Th
roug
h A
war
dsFr
om D
irect
A
war
dsTo
tal
Bure
au O
f Jus
tice
Assi
stan
ce,
Dep
artm
ent O
f Jus
tice
Stat
e C
rimin
al A
lien
Assi
stan
ce P
rogr
am16
.606
2015
-H07
23-
WA-
AP-
20,9
8420
,984
-1
Offi
ce O
f Com
mun
ity O
rient
ed
Polic
ing
Serv
ices
, Dep
artm
ent O
f Ju
stic
e
Publ
ic S
afet
y Pa
rtner
ship
and
C
omm
unity
Pol
icin
g G
rant
s
16.7
1020
14U
MW
X007
7-
62,4
4662
,446
-1,
2
JAG
Pro
gram
Clu
ster
Bure
au O
f Jus
tice
Assi
stan
ce,
Dep
artm
ent O
f Jus
tice
Edw
ard
Byrn
e M
emor
ial
Just
ice
Assi
stan
ce
Gra
nt P
rogr
am
16.7
3820
13-D
J-BX
-03
74-
1,66
41,
664
1,66
41
Bure
au O
f Jus
tice
Assi
stan
ce,
Dep
artm
ent O
f Jus
tice
Edw
ard
Byrn
e M
emor
ial
Just
ice
Assi
stan
ce
Gra
nt P
rogr
am
16.7
3820
14-D
J-BX
-00
76-
10,0
5010
,050
10,0
501
Bure
au O
f Jus
tice
Assi
stan
ce,
Dep
artm
ent O
f Jus
tice
(via
W
ashi
ngto
n St
ate
Dep
artm
ent o
f C
omm
erce
)
Edw
ard
Byrn
e M
emor
ial
Just
ice
Assi
stan
ce
Gra
nt P
rogr
am
16.7
38M
14-3
1440
-014
80,3
97-
80,3
97-
1
Bure
au O
f Jus
tice
Assi
stan
ce,
Dep
artm
ent O
f Jus
tice
(via
W
ashi
ngto
n St
ate
Dep
artm
ent o
f C
omm
erce
)
Edw
ard
Byrn
e M
emor
ial
Just
ice
Assi
stan
ce
Gra
nt P
rogr
am
16.7
38F1
5-31
440-
014
65,6
34-
65,6
34-
1
Tota
l JA
G P
rogr
am C
lust
er:
146,
031
11,7
1415
7,74
511
,714
Hig
hway
Pla
nnin
g an
d C
onst
ruct
ion
Clu
ster
Fede
ral H
ighw
ay A
dmin
istra
tion
(fhw
a), D
epar
tmen
t Of
Tran
spor
tatio
n (v
ia W
ashi
ngto
n St
ate
Dep
artm
ent o
f Tr
ansp
orta
tion)
Hig
hway
Pla
nnin
g an
d C
onst
ruct
ion
20.2
05Sk
agit
Riv
er
Brid
ge
Mod
ifica
tion
& In
ters
tate
H
ighw
ay
LA64
52
147,
577
-14
7,57
7-
1
Skag
it C
ount
ySc
hedu
le o
f Exp
endi
ture
s of
Fed
eral
Aw
ards
For t
he Y
ear E
nded
Dec
embe
r 31,
201
5
The
acco
mpa
nyin
g no
tes
are
an in
tegr
al p
art o
f thi
s sc
hedu
le.
207

Fede
ral A
genc
y (P
ass-
Thro
ugh
Age
ncy)
Fede
ral P
rogr
amC
FDA
N
umbe
rO
ther
Aw
ard
Num
ber
Expe
nditu
res
Pass
ed th
roug
h to
Su
brec
ipie
nts
Not
e
From
Pas
s-Th
roug
h A
war
dsFr
om D
irect
A
war
dsTo
tal
Fede
ral H
ighw
ay A
dmin
istra
tion
(fhw
a), D
epar
tmen
t Of
Tran
spor
tatio
n (v
ia W
ashi
ngto
n St
ate
Dep
artm
ent o
f Tr
ansp
orta
tion)
Hig
hway
Pla
nnin
g an
d C
onst
ruct
ion
20.2
05Pi
onee
r H
ighw
ay/F
ir Is
land
Roa
d In
ters
ectio
n LA
8199
2,71
0-
2,71
0-
1
Fede
ral H
ighw
ay A
dmin
istra
tion
(fhw
a), D
epar
tmen
t Of
Tran
spor
tatio
n (v
ia W
ashi
ngto
n St
ate
Dep
artm
ent o
f Tr
ansp
orta
tion)
Hig
hway
Pla
nnin
g an
d C
onst
ruct
ion
20.2
05Bu
rling
ton
Nor
ther
n O
verp
ass
LA80
75
347,
295
-34
7,29
5-
1, 2
Fede
ral H
ighw
ay A
dmin
istra
tion
(fhw
a), D
epar
tmen
t Of
Tran
spor
tatio
n (v
ia W
ashi
ngto
n St
ate
Dep
artm
ent o
f Tr
ansp
orta
tion)
Hig
hway
Pla
nnin
g an
d C
onst
ruct
ion
20.2
05Bo
w H
ill R
econ
stru
ctio
n LA
8076
56,5
27-
56,5
27-
1, 2
Fede
ral H
ighw
ay A
dmin
istra
tion
(fhw
a), D
epar
tmen
t Of
Tran
spor
tatio
n (v
ia W
ashi
ngto
n St
ate
Dep
artm
ent o
f Tr
ansp
orta
tion)
Hig
hway
Pla
nnin
g an
d C
onst
ruct
ion
20.2
05C
ente
nnia
l Tra
il (B
ig R
ock
to
Cle
ar L
ake)
LA
8425
10,2
38-
10,2
38-
1, 2
Fede
ral H
ighw
ay A
dmin
istra
tion
(fhw
a), D
epar
tmen
t Of
Tran
spor
tatio
n (v
ia W
ashi
ngto
n St
ate
Dep
artm
ent o
f Tr
ansp
orta
tion)
Hig
hway
Pla
nnin
g an
d C
onst
ruct
ion
20.2
05Jo
sh W
ilson
R
oad
Phas
e 1
LA 8
426
17,0
40-
17,0
40-
1, 2
Fede
ral H
ighw
ay A
dmin
istra
tion
(fhw
a), D
epar
tmen
t Of
Tran
spor
tatio
n (v
ia W
ashi
ngto
n St
ate
Dep
artm
ent o
f Tr
ansp
orta
tion)
Hig
hway
Pla
nnin
g an
d C
onst
ruct
ion
20.2
05Fr
iday
Cre
ek
Brid
ge R
epai
r (O
ld H
wy
99)
LA 8
746
344
-34
4-
1, 2
Fede
ral H
ighw
ay A
dmin
istra
tion
(fhw
a), D
epar
tmen
t Of
Tran
spor
tatio
n (v
ia W
ashi
ngto
n St
ate
Dep
artm
ent o
f Tr
ansp
orta
tion)
Hig
hway
Pla
nnin
g an
d C
onst
ruct
ion
20.2
05O
ld H
wy
99
Nor
th
Illum
inat
ion
Proj
ect L
A 87
45
3,75
9-
3,75
9-
1, 2
Skag
it C
ount
ySc
hedu
le o
f Exp
endi
ture
s of
Fed
eral
Aw
ards
For t
he Y
ear E
nded
Dec
embe
r 31,
201
5
The
acco
mpa
nyin
g no
tes
are
an in
tegr
al p
art o
f thi
s sc
hedu
le.
208

Fede
ral A
genc
y (P
ass-
Thro
ugh
Age
ncy)
Fede
ral P
rogr
amC
FDA
N
umbe
rO
ther
Aw
ard
Num
ber
Expe
nditu
res
Pass
ed th
roug
h to
Su
brec
ipie
nts
Not
e
From
Pas
s-Th
roug
h A
war
dsFr
om D
irect
A
war
dsTo
tal
Fede
ral H
ighw
ay A
dmin
istra
tion
(fhw
a), D
epar
tmen
t Of
Tran
spor
tatio
n (v
ia W
ashi
ngto
n St
ate
Dep
artm
ent o
f Tr
ansp
orta
tion)
Hig
hway
Pla
nnin
g an
d C
onst
ruct
ion
20.2
05C
ook
Roa
d Si
gnal
Adv
ance
W
arni
ng L
A 87
44
704
-70
4-
1, 2
Fede
ral H
ighw
ay A
dmin
istra
tion
(fhw
a), D
epar
tmen
t Of
Tran
spor
tatio
n (v
ia W
ashi
ngto
n St
ate
Dep
artm
ent o
f Tr
ansp
orta
tion)
Hig
hway
Pla
nnin
g an
d C
onst
ruct
ion
20.2
05Lo
wer
Fin
ney
Cre
ek B
ridge
R
epai
rs L
A 87
33
508
-50
8-
1, 2
Fede
ral H
ighw
ay A
dmin
istra
tion
(fhw
a), D
epar
tmen
t Of
Tran
spor
tatio
n (v
ia W
ashi
ngto
n St
ate
Dep
artm
ent o
f Tr
ansp
orta
tion)
Hig
hway
Pla
nnin
g an
d C
onst
ruct
ion
20.2
05D
odge
Val
ley
Roa
d Ba
rrier
Pr
otec
tion
Proj
ect L
A 87
24
13,2
15-
13,2
15-
1, 2
Fede
ral H
ighw
ay A
dmin
istra
tion
(fhw
a), D
epar
tmen
t Of
Tran
spor
tatio
n (v
ia W
ashi
ngto
n St
ate
Dep
artm
ent o
f Tr
ansp
orta
tion)
Hig
hway
Pla
nnin
g an
d C
onst
ruct
ion
20.2
05Sa
mis
h R
iver
Br
idge
Rep
air
(Old
Hw
y 99
) LA
870
2
1,27
8-
1,27
8-
1, 2
Fede
ral H
ighw
ay A
dmin
istra
tion
(fhw
a), D
epar
tmen
t Of
Tran
spor
tatio
n (v
ia W
ashi
ngto
n St
ate
Dep
artm
ent o
f Tr
ansp
orta
tion)
Hig
hway
Pla
nnin
g an
d C
onst
ruct
ion
20.2
05G
uem
es F
erry
Br
eakw
ater
Se
ctio
n R
epla
cem
ent
LA 8
521
67,5
14-
67,5
14-
1, 2
Tota
l Hig
hway
Pla
nnin
g an
d C
onst
ruct
ion
Clu
ster
: 66
8,71
1-
668,
711
-
Hig
hway
Saf
ety
Clu
ster
Nat
iona
l Hig
hway
Tra
ffic
Safe
ty
Adm
inis
tratio
n (n
htsa
), D
epar
tmen
t Of T
rans
porta
tion
(via
Was
hing
ton
Traf
fic S
afet
y C
omm
issi
on)
Stat
e an
d C
omm
unity
H
ighw
ay S
afet
y20
.600
Targ
et Z
ero
Cor
ridor
Pro
ject
11,4
66-
11,4
66-
1
Skag
it C
ount
ySc
hedu
le o
f Exp
endi
ture
s of
Fed
eral
Aw
ards
For t
he Y
ear E
nded
Dec
embe
r 31,
201
5
The
acco
mpa
nyin
g no
tes
are
an in
tegr
al p
art o
f thi
s sc
hedu
le.
209

Fede
ral A
genc
y (P
ass-
Thro
ugh
Age
ncy)
Fede
ral P
rogr
amC
FDA
N
umbe
rO
ther
Aw
ard
Num
ber
Expe
nditu
res
Pass
ed th
roug
h to
Su
brec
ipie
nts
Not
e
From
Pas
s-Th
roug
h A
war
dsFr
om D
irect
A
war
dsTo
tal
Nat
iona
l Hig
hway
Tra
ffic
Safe
ty
Adm
inis
tratio
n (n
htsa
), D
epar
tmen
t Of T
rans
porta
tion
(via
Was
hing
ton
Traf
fic S
afet
y C
omm
issi
on)
Stat
e an
d C
omm
unity
H
ighw
ay S
afet
y20
.600
Traf
fic S
afet
y Eq
uipm
ent
Gra
nt
17,7
78-
17,7
78-
1
Tota
l Hig
hway
Saf
ety
Clu
ster
: 29
,244
-29
,244
-
Reg
ion
10, E
nviro
nmen
tal
Prot
ectio
n Ag
ency
(via
W
ashi
ngto
n St
ate
Dep
artm
ent o
f H
ealth
)
Puge
t Sou
nd A
ctio
n Ag
enda
: Tec
hnic
al
Inve
stig
atio
ns a
nd
Impl
emen
tatio
n As
sist
ance
Pro
gram
66.1
23C
1712
4 N
EP
Ons
ite S
ewag
e M
anag
emen
t
46,4
57-
46,4
57-
1, 4 (d)
Reg
ion
10, E
nviro
nmen
tal
Prot
ectio
n Ag
ency
(via
W
ashi
ngto
n St
ate
Dep
artm
ent o
f H
ealth
)
Puge
t Sou
nd A
ctio
n Ag
enda
: Tec
hnic
al
Inve
stig
atio
ns a
nd
Impl
emen
tatio
n As
sist
ance
Pro
gram
66.1
23PC
-00J
2760
1-0
450
-45
0-
1
Reg
ion
10, E
nviro
nmen
tal
Prot
ectio
n Ag
ency
(via
W
ashi
ngto
n St
ate
Dep
artm
ent o
f H
ealth
)
Puge
t Sou
nd A
ctio
n Ag
enda
: Tec
hnic
al
Inve
stig
atio
ns a
nd
Impl
emen
tatio
n As
sist
ance
Pro
gram
66.1
23D
OH
Con
tract
N
2068
9 / P
C-
00J3
2601
259,
470
-25
9,47
037
,294
1
Reg
ion
10, E
nviro
nmen
tal
Prot
ectio
n Ag
ency
(via
Sta
te o
f W
ashi
ngto
n D
epar
tmen
t of
Ecol
ogy)
Puge
t Sou
nd A
ctio
n Ag
enda
: Tec
hnic
al
Inve
stig
atio
ns a
nd
Impl
emen
tatio
n As
sist
ance
Pro
gram
66.1
23SE
ANW
S-20
150S
kCoP
W-
0000
1
8,29
7-
8,29
7-
1
Reg
ion
10, E
nviro
nmen
tal
Prot
ectio
n Ag
ency
(via
W
ashi
ngto
n St
ate
Dep
artm
ent o
f C
omm
erce
)
Puge
t Sou
nd A
ctio
n Ag
enda
: Tec
hnic
al
Inve
stig
atio
ns a
nd
Impl
emen
tatio
n As
sist
ance
Pro
gram
66.1
2312
-634
01-0
0576
,096
-76
,096
-1,
2
Tota
l CFD
A 6
6.12
3:
390,
771
-39
0,77
137
,294
Skag
it C
ount
ySc
hedu
le o
f Exp
endi
ture
s of
Fed
eral
Aw
ards
For t
he Y
ear E
nded
Dec
embe
r 31,
201
5
The
acco
mpa
nyin
g no
tes
are
an in
tegr
al p
art o
f thi
s sc
hedu
le.
210

Fede
ral A
genc
y (P
ass-
Thro
ugh
Age
ncy)
Fede
ral P
rogr
amC
FDA
N
umbe
rO
ther
Aw
ard
Num
ber
Expe
nditu
res
Pass
ed th
roug
h to
Su
brec
ipie
nts
Not
e
From
Pas
s-Th
roug
h A
war
dsFr
om D
irect
A
war
dsTo
tal
Offi
ce O
f Wat
er, E
nviro
nmen
tal
Prot
ectio
n Ag
ency
Nat
iona
l Est
uary
Pr
ogra
m66
.456
SEAN
WA-
2014
-Sk
CoP
W-0
0003
-58
,555
58,5
5538
,688
1
U.s
. Ele
ctio
n As
sist
ance
C
omm
issi
on (v
ia S
tate
of
Was
hing
ton,
Offi
ce o
f the
Se
cret
ary
of S
tate
, Ele
ctio
ns
Div
isio
n)
Hel
p Am
eric
a Vo
te A
ct
Req
uire
men
ts
Paym
ents
90.4
01O
SOS
No.
G-
2855
1,35
3-
1,35
3-
1
Offi
ce O
f The
Sec
reta
ry,
Dep
artm
ent O
f Hea
lth A
nd
Hum
an S
ervi
ces
(via
Nat
iona
l As
soci
atio
n of
Cou
nty
and
City
H
ealth
Offi
cial
s)
Med
ical
Res
erve
Cor
ps
Smal
l Gra
nt P
rogr
am93
.008
MR
C 1
5-10
273,
500
-3,
500
-1
Adm
inis
tratio
n Fo
r Com
mun
ity
Livi
ng, D
epar
tmen
t Of H
ealth
And
H
uman
Ser
vice
s (v
ia N
orth
wes
t R
egio
nal C
ounc
il)
Spec
ial P
rogr
ams
for
the
Agin
g_Ti
tle II
I, Pa
rt D
_Dis
ease
Pre
vent
ion
and
Hea
lth P
rom
otio
n Se
rvic
es
93.0
43C
DSM
P C
HR
ON
IC
DIS
EASE
SEL
F M
ANAG
EMEN
T PR
OG
RAM
16
3009
-NU
TR
4,00
0-
4,00
0-
1
Agi
ng C
lust
er
Adm
inis
tratio
n Fo
r Com
mun
ity
Livi
ng, D
epar
tmen
t Of H
ealth
And
H
uman
Ser
vice
s (v
ia N
orth
wes
t R
egio
nal C
ounc
il)
Spec
ial P
rogr
ams
for
the
Agin
g_Ti
tle II
I, Pa
rt C
_Nut
ritio
n Se
rvic
es
93.0
4516
3009
-NU
TR
C1
93,0
74-
93,0
74-
1, 2
Adm
inis
tratio
n Fo
r Com
mun
ity
Livi
ng, D
epar
tmen
t Of H
ealth
And
H
uman
Ser
vice
s (v
ia N
orth
wes
t R
egio
nal C
ounc
il)
Spec
ial P
rogr
ams
for
the
Agin
g_Ti
tle II
I, Pa
rt C
_Nut
ritio
n Se
rvic
es
93.0
4516
3009
-NU
TR
C2
93,0
73-
93,0
73-
1, 2
Tota
l CFD
A 9
3.04
5:
186,
147
-18
6,14
7-
Adm
inis
tratio
n Fo
r Com
mun
ity
Livi
ng, D
epar
tmen
t Of H
ealth
And
H
uman
Ser
vice
s (v
ia N
orth
wes
t R
egio
nal C
ounc
il)
Nut
ritio
n Se
rvic
es
Ince
ntiv
e Pr
ogra
m
93.0
5316
3009
-NU
TR
NSI
P97
,630
-97
,630
-1
Skag
it C
ount
ySc
hedu
le o
f Exp
endi
ture
s of
Fed
eral
Aw
ards
For t
he Y
ear E
nded
Dec
embe
r 31,
201
5
The
acco
mpa
nyin
g no
tes
are
an in
tegr
al p
art o
f thi
s sc
hedu
le.
211

Fede
ral A
genc
y (P
ass-
Thro
ugh
Age
ncy)
Fede
ral P
rogr
amC
FDA
N
umbe
rO
ther
Aw
ard
Num
ber
Expe
nditu
res
Pass
ed th
roug
h to
Su
brec
ipie
nts
Not
e
From
Pas
s-Th
roug
h A
war
dsFr
om D
irect
A
war
dsTo
tal
Tota
l Agi
ng C
lust
er:
283,
777
-28
3,77
7-
Cen
ters
For
Dis
ease
Con
trol A
nd
Prev
entio
n, D
epar
tmen
t Of
Hea
lth A
nd H
uman
Ser
vice
s (v
ia
Was
hing
ton
Stat
e D
epar
tmen
t of
Hea
lth)
Publ
ic H
ealth
Em
erge
ncy
Prep
ared
ness
93.0
69C
1712
4 EP
R
LHJ
Fund
ing
15,3
08-
15,3
08-
1, 4 (d)
Cen
ters
For
Dis
ease
Con
trol A
nd
Prev
entio
n, D
epar
tmen
t Of
Hea
lth A
nd H
uman
Ser
vice
s (v
ia
Was
hing
ton
Stat
e D
epar
tmen
t of
Hea
lth)
Publ
ic H
ealth
Em
erge
ncy
Prep
ared
ness
93.0
69C
1712
4 EP
R
PHEP
BP4
LH
J Fu
ndin
g
18,0
38-
18,0
38-
1, 4 (d)
Tota
l CFD
A 9
3.06
9:
33,3
46-
33,3
46-
Subs
tanc
e Ab
use
And
Men
tal
Hea
lth S
ervi
ces
Adm
inis
tratio
n,
Dep
artm
ent O
f Hea
lth A
nd
Hum
an S
ervi
ces
(via
Sta
te o
f W
ashi
ngto
n D
epar
tmen
t of S
ocia
l an
d H
ealth
Ser
vice
s-R
ecov
ery
Supp
ort)
Subs
tanc
e Ab
use
and
Men
tal H
ealth
Se
rvic
es_P
roje
cts
of
Reg
iona
l and
Nat
iona
l Si
gnifi
canc
e
93.2
43Pa
rtner
ship
s fo
r Su
cces
s G
rant
13
63-9
0042
13,2
63-
13,2
6313
,263
1, 7
Subs
tanc
e Ab
use
And
Men
tal
Hea
lth S
ervi
ces
Adm
inis
tratio
n,
Dep
artm
ent O
f Hea
lth A
nd
Hum
an S
ervi
ces
(via
Sta
te o
f W
ashi
ngto
n D
epar
tmen
t of S
ocia
l an
d H
ealth
Ser
vice
s-R
ecov
ery
Supp
ort)
Subs
tanc
e Ab
use
and
Men
tal H
ealth
Se
rvic
es_P
roje
cts
of
Reg
iona
l and
Nat
iona
l Si
gnifi
canc
e
93.2
43Pa
rtner
ship
s fo
r Su
cces
s G
rant
15
63-4
2494
17,6
16-
17,6
1617
,616
1
Tota
l CFD
A 9
3.24
3:
30,8
79-
30,8
7930
,879
Cen
ters
For
Dis
ease
Con
trol A
nd
Prev
entio
n, D
epar
tmen
t Of
Hea
lth A
nd H
uman
Ser
vice
s (v
ia
Was
hing
ton
Stat
e D
epar
tmen
t of
Hea
lth)
Imm
uniz
atio
n C
oope
rativ
e Ag
reem
ents
93.2
68C
1712
4 VF
C
OPS
5,26
7-
5,26
7-
1, 4 (d)
Skag
it C
ount
ySc
hedu
le o
f Exp
endi
ture
s of
Fed
eral
Aw
ards
For t
he Y
ear E
nded
Dec
embe
r 31,
201
5
The
acco
mpa
nyin
g no
tes
are
an in
tegr
al p
art o
f thi
s sc
hedu
le.
212

Fede
ral A
genc
y (P
ass-
Thro
ugh
Age
ncy)
Fede
ral P
rogr
amC
FDA
N
umbe
rO
ther
Aw
ard
Num
ber
Expe
nditu
res
Pass
ed th
roug
h to
Su
brec
ipie
nts
Not
e
From
Pas
s-Th
roug
h A
war
dsFr
om D
irect
A
war
dsTo
tal
Cen
ters
For
Dis
ease
Con
trol A
nd
Prev
entio
n, D
epar
tmen
t Of
Hea
lth A
nd H
uman
Ser
vice
s (v
ia
Was
hing
ton
Stat
e D
epar
tmen
t of
Hea
lth)
Imm
uniz
atio
n C
oope
rativ
e Ag
reem
ents
93.2
68C
1712
4 AF
IX24
,251
-24
,251
-1,
4 (d)
Cen
ters
For
Dis
ease
Con
trol A
nd
Prev
entio
n, D
epar
tmen
t Of
Hea
lth A
nd H
uman
Ser
vice
s (v
ia
Was
hing
ton
Stat
e D
epar
tmen
t of
Hea
lth)
Imm
uniz
atio
n C
oope
rativ
e Ag
reem
ents
93.2
68C
1712
4 31
7 VF
C
OR
DER
ING
5,38
4-
5,38
4-
1, 4 (d)
Cen
ters
For
Dis
ease
Con
trol A
nd
Prev
entio
n, D
epar
tmen
t Of
Hea
lth A
nd H
uman
Ser
vice
s (v
ia
Was
hing
ton
Stat
e D
epar
tmen
t of
Hea
lth)
Imm
uniz
atio
n C
oope
rativ
e Ag
reem
ents
93.2
68C
1712
4 31
7 O
PS6,
416
-6,
416
-1,
4 (d)
Cen
ters
For
Dis
ease
Con
trol A
nd
Prev
entio
n, D
epar
tmen
t Of
Hea
lth A
nd H
uman
Ser
vice
s (v
ia
Was
hing
ton
Stat
e D
epar
tmen
t of
Hea
lth)
Imm
uniz
atio
n C
oope
rativ
e Ag
reem
ents
93.2
68Va
ccin
es in
Lie
u of
Cas
h 20
15
C17
124
70,0
34-
70,0
34-
1, 3
, 5
Cen
ters
For
Dis
ease
Con
trol A
nd
Prev
entio
n, D
epar
tmen
t Of
Hea
lth A
nd H
uman
Ser
vice
s (v
ia
Was
hing
ton
Stat
e D
epar
tmen
t of
Hea
lth)
Imm
uniz
atio
n C
oope
rativ
e Ag
reem
ents
93.2
68Pr
ogra
m
Inco
me
C17
124
1,55
7-
1,55
7-
1, 5
Tota
l CFD
A 9
3.26
8:
112,
909
-11
2,90
9-
Hea
lth R
esou
rces
And
Ser
vice
s Ad
min
istra
tion,
Dep
artm
ent O
f H
ealth
And
Hum
an S
ervi
ces
(via
Th
rive
By 5
Was
hing
ton)
Affo
rdab
le C
are
Act
(AC
A) M
ater
nal,
Infa
nt,
and
Early
Chi
ldho
od
Hom
e Vi
sitin
g Pr
ogra
m
93.5
05FY
15-H
VSA
MIE
CH
V27
8,64
3-
278,
643
-1,
4 (d)
Hea
lth R
esou
rces
And
Ser
vice
s Ad
min
istra
tion,
Dep
artm
ent O
f H
ealth
And
Hum
an S
ervi
ces
(via
Th
rive
By 5
Was
hing
ton)
Affo
rdab
le C
are
Act
(AC
A) M
ater
nal,
Infa
nt,
and
Early
Chi
ldho
od
Hom
e Vi
sitin
g Pr
ogra
m
93.5
05FY
15-H
VSA
MIE
CH
V86
,133
-86
,133
-1,
4 (d)
Skag
it C
ount
ySc
hedu
le o
f Exp
endi
ture
s of
Fed
eral
Aw
ards
For t
he Y
ear E
nded
Dec
embe
r 31,
201
5
The
acco
mpa
nyin
g no
tes
are
an in
tegr
al p
art o
f thi
s sc
hedu
le.
213

Fede
ral A
genc
y (P
ass-
Thro
ugh
Age
ncy)
Fede
ral P
rogr
amC
FDA
N
umbe
rO
ther
Aw
ard
Num
ber
Expe
nditu
res
Pass
ed th
roug
h to
Su
brec
ipie
nts
Not
e
From
Pas
s-Th
roug
h A
war
dsFr
om D
irect
A
war
dsTo
tal
Tota
l CFD
A 9
3.50
5:
364,
776
-36
4,77
6-
Adm
inis
tratio
n Fo
r Chi
ldre
n An
d Fa
milie
s, D
epar
tmen
t Of H
ealth
An
d H
uman
Ser
vice
s (v
ia
Was
hing
ton
Stat
e D
epar
tmen
t of
Hea
lth &
Soc
ial S
ervi
ces)
Chi
ld S
uppo
rt En
forc
emen
t93
.563
75-1
501-
0-1-
609/
2110
-806
0815
0,73
7-
150,
737
-1,
2, 4 (b)
Adm
inis
tratio
n Fo
r Chi
ldre
n An
d Fa
milie
s, D
epar
tmen
t Of H
ealth
An
d H
uman
Ser
vice
s (v
ia
Was
hing
ton
Stat
e D
epar
tmen
t of
Soci
al &
Hea
lth S
ervi
ces)
Chi
ld S
uppo
rt En
forc
emen
t93
.563
75-1
501-
0-1-
609/
2110
-806
0841
2,49
0-
412,
490
-1,
2, 4
(a),
4 (b)
Adm
inis
tratio
n Fo
r Chi
ldre
n An
d Fa
milie
s, D
epar
tmen
t Of H
ealth
An
d H
uman
Ser
vice
s (v
ia T
he
Div
isio
n of
Chi
ld S
uppo
rt)
Chi
ld S
uppo
rt En
forc
emen
t93
.563
75-1
501-
0-1-
609
37,2
62-
37,2
62-
1, 4
(c)
Tota
l CFD
A 9
3.56
3:
600,
489
-60
0,48
9-
Med
icai
d C
lust
er
Cen
ters
For
Med
icar
e An
d M
edic
aid
Serv
ices
, Dep
artm
ent
Of H
ealth
And
Hum
an S
ervi
ces
(via
Was
hing
ton
Stat
e H
ealth
C
are
Auth
ority
)
Med
ical
Ass
ista
nce
Prog
ram
93.7
78M
edic
al A
dmin
M
atch
116
3-35
474
71,3
30-
71,3
30-
1,2
Cen
ters
For
Med
icar
e An
d M
edic
aid
Serv
ices
, Dep
artm
ent
Of H
ealth
And
Hum
an S
ervi
ces
(via
Was
hing
ton
Stat
e H
ealth
C
are
Auth
ority
)
Med
ical
Ass
ista
nce
Prog
ram
93.7
78M
edic
al A
dmin
M
atch
K14
1624
,338
-24
,338
-1
Cen
ters
For
Med
icar
e An
d M
edic
aid
Serv
ices
, Dep
artm
ent
Of H
ealth
And
Hum
an S
ervi
ces
(via
Nor
th S
ound
Men
tal H
ealth
Ad
min
istra
tion)
Med
ical
Ass
ista
nce
Prog
ram
93.7
78N
SMH
A Sk
agit
Adm
in 1
511
5,47
9-
115,
479
18,7
021
Tota
l Med
icai
d C
lust
er:
211,
148
-21
1,14
818
,702
Skag
it C
ount
ySc
hedu
le o
f Exp
endi
ture
s of
Fed
eral
Aw
ards
For t
he Y
ear E
nded
Dec
embe
r 31,
201
5
The
acco
mpa
nyin
g no
tes
are
an in
tegr
al p
art o
f thi
s sc
hedu
le.
214

Fede
ral A
genc
y (P
ass-
Thro
ugh
Age
ncy)
Fede
ral P
rogr
amC
FDA
N
umbe
rO
ther
Aw
ard
Num
ber
Expe
nditu
res
Pass
ed th
roug
h to
Su
brec
ipie
nts
Not
e
From
Pas
s-Th
roug
h A
war
dsFr
om D
irect
A
war
dsTo
tal
Subs
tanc
e Ab
use
And
Men
tal
Hea
lth S
ervi
ces
Adm
inis
tratio
n,
Dep
artm
ent O
f Hea
lth A
nd
Hum
an S
ervi
ces
(via
Nor
th
Soun
d M
enta
l Hea
lth
Adm
inis
tratio
n)
Bloc
k G
rant
s fo
r C
omm
unity
Men
tal
Hea
lth S
ervi
ces
93.9
58N
SMH
A M
HBG
15
1674
,147
-74
,147
74,1
471
Subs
tanc
e Ab
use
And
Men
tal
Hea
lth S
ervi
ces
Adm
inis
tratio
n,
Dep
artm
ent O
f Hea
lth A
nd
Hum
an S
ervi
ces
(via
Was
hing
ton
Stat
e D
epar
tmen
t of S
ocia
l &
Hea
lth S
ervi
ces-
Subs
tanc
e Ab
use
Prev
entio
n-D
ASA)
Bloc
k G
rant
s fo
r Pr
even
tion
and
Trea
tmen
t of S
ubst
ance
Ab
use
93.9
5911
63-2
7323
44,1
09-
44,1
0944
,109
1
Subs
tanc
e Ab
use
And
Men
tal
Hea
lth S
ervi
ces
Adm
inis
tratio
n,
Dep
artm
ent O
f Hea
lth A
nd
Hum
an S
ervi
ces
(via
Sta
te o
f W
ashi
ngto
n D
epar
tmen
t of S
ocia
l an
d H
ealth
Ser
vice
s-R
ecov
ery
Supp
ort)
Bloc
k G
rant
s fo
r Pr
even
tion
and
Trea
tmen
t of S
ubst
ance
Ab
use
93.9
5915
63-4
3877
82,8
36-
82,8
36-
1
Subs
tanc
e Ab
use
And
Men
tal
Hea
lth S
ervi
ces
Adm
inis
tratio
n,
Dep
artm
ent O
f Hea
lth A
nd
Hum
an S
ervi
ces
(via
Was
hing
ton
Stat
e D
epar
tmen
t of S
ocia
l &
Hea
lth S
ervi
ces-
Subs
tanc
e Ab
use
Prev
entio
n-D
ASA)
Bloc
k G
rant
s fo
r Pr
even
tion
and
Trea
tmen
t of S
ubst
ance
Ab
use
93.9
5915
63-4
2494
23,8
88-
23,8
88-
1
Tota
l CFD
A 9
3.95
9:
150,
833
-15
0,83
344
,109
Hea
lth R
esou
rces
And
Ser
vice
s Ad
min
istra
tion,
Dep
artm
ent O
f H
ealth
And
Hum
an S
ervi
ces
(via
W
ashi
ngto
n St
ate
Dep
artm
ent o
f H
ealth
)
Mat
erna
l and
Chi
ld
Hea
lth S
ervi
ces
Bloc
k G
rant
to th
e St
ates
93.9
94C
1712
4 FF
Y16
MC
HBG
LH
J13
8,89
9-
138,
899
-1,
4 (d)
Skag
it C
ount
ySc
hedu
le o
f Exp
endi
ture
s of
Fed
eral
Aw
ards
For t
he Y
ear E
nded
Dec
embe
r 31,
201
5
The
acco
mpa
nyin
g no
tes
are
an in
tegr
al p
art o
f thi
s sc
hedu
le.
215

Fede
ral A
genc
y (P
ass-
Thro
ugh
Age
ncy)
Fede
ral P
rogr
amC
FDA
N
umbe
rO
ther
Aw
ard
Num
ber
Expe
nditu
res
Pass
ed th
roug
h to
Su
brec
ipie
nts
Not
e
From
Pas
s-Th
roug
h A
war
dsFr
om D
irect
A
war
dsTo
tal
Dep
artm
ent O
f Hom
elan
d Se
curit
y (v
ia W
ashi
ngto
n St
ate
Park
s an
d R
ecre
atio
n C
omm
issi
on)
Boat
ing
Safe
ty F
inan
cial
As
sist
ance
97.0
1233
14FA
S140
153
25,1
06-
25,1
06-
1, 2
Dep
artm
ent O
f Hom
elan
d Se
curit
y (v
ia W
ashi
ngto
n St
ate
Milit
ary
Dep
artm
ent/S
noho
mis
h C
ount
y)
Haz
ard
Miti
gatio
n G
rant
97.0
39E1
4-02
65,
559
-5,
559
-1,
2
Dep
artm
ent O
f Hom
elan
d Se
curit
y (v
ia W
ashi
ngto
n St
ate
Milit
ary
Dep
artm
ent/S
noho
mis
h C
ount
y)
Emer
genc
y M
anag
emen
t Pe
rform
ance
Gra
nts
97.0
42E1
5-13
210
,000
-10
,000
-1,
2
Dep
artm
ent O
f Hom
elan
d Se
curit
y (v
ia W
ashi
ngto
n St
ate
Milit
ary
Dep
artm
ent/S
noho
mis
h C
ount
y)
Hom
elan
d Se
curit
y G
rant
Pro
gram
97.0
67E1
4-07
529
,421
-29
,421
18,6
311
Dep
artm
ent O
f Hom
elan
d Se
curit
y (v
ia W
ashi
ngto
n St
ate
Milit
ary
Dep
artm
ent/S
noho
mis
h C
ount
y)
Hom
elan
d Se
curit
y G
rant
Pro
gram
97.0
67E1
5-08
217
,588
-17
,588
-1
Tota
l CFD
A 9
7.06
7:
47,0
09-
47,0
0918
,631
Tota
l Fed
eral
Aw
ards
Exp
ende
d:3,
773,
646
452,
236
4,22
5,88
742
3,27
6
Skag
it C
ount
ySc
hedu
le o
f Exp
endi
ture
s of
Fed
eral
Aw
ards
For t
he Y
ear E
nded
Dec
embe
r 31,
201
5
The
acco
mpa
nyin
g no
tes
are
an in
tegr
al p
art o
f thi
s sc
hedu
le.
216

SKAGIT COUNTY, WASHINGTON
NOTES TO THE SCHEDULE OF EXPENDITURES OF FEDERAL AWARDS
For the year ended December 31, 2015
NOTE 1 – BASIS OF ACCOUNTING This schedule is prepared on the same basis of accounting as Skagit County’s financial statements. Skagit County, in compliance with generally accepted accounting practices, uses modified accrual accounting for government funds and accrual accounting for proprietary funds.
NOTE 2 – PROGRAM COSTS The amounts shown as current year expenditures represent only the federal grant portion of the program costs. Entire program costs, including Skagit County’s portion, are more than shown. Such expenditures are recognized following, as applicable, either the cost principles in the OMB Circular A-87, Cost Principles for State, Local, and Indian Tribal Governments, or the cost principles contained in Title 2 U.S. Code of Federal Regulations Part 200, Uniform Administrative Requirements, Cost Principles, and Audit Requirements for Federal Awards, wherein certain types of expenditures are not allowable or are limited as to reimbursement.
NOTE 3 – NONCASH AWARDS - VACCINATIONS The amount of vaccines reported on the schedule is the value of vaccine received by Skagit County during 2015 and priced as prescribed by the Department of Health.
NOTE 4 – INDIRECT COST RATE The amount expended includes a percentage claimed as an indirect cost recovery using an approved indirect cost rate. These rates are as shown below: (a) 17.11%, (b) 18.61%, (c) 18.80%, (d) 25.00%
Skagit County has not elected to use the 10-percent de minimis indirect cost rate allowed under Uniform Guidance.
NOTE 5 – PROGRAM INCOME The amount reported is net of $71,590.92 received as program income.
NOTE 6 – NONCASH AWARDS - VOUCHERS The amount of vouchers reported on the schedule is the value of food vouchers received by Skagit County during 2015 and priced as prescribed by the Department of Agriculture.
NOTE 7 – PRIOR YEAR EXPENSE The total amount expended for this program includes $8,599.10 for 2014.
217

For F
isca
l Yea
r end
ed D
ecem
ber 3
1, 2
015
SCH
EDU
LE O
F ST
ATE
FIN
ANCI
AL A
SSIS
TAN
CE (
unau
dite
d)
Skag
it Co
unty
Gra
ntor
Prog
ram
Titl
eId
entif
icat
on
Num
ber
Amou
nt
Stat
e Gr
ant f
rom
Oth
er J
udici
al A
genc
ies
Witn
ess
Fees
RCW
10.
46.2
301,
341
Inte
rpre
ter F
ees
IAA1
6209
4,61
6
Becc
a Bi
llIA
A150
3314
8,46
4
Becc
a Bi
llIA
A162
1015
1,45
7
Becc
a Bi
llIA
A150
3310
,669
Inte
rpre
ter F
ees
IAA1
5216
998
Becc
a Bi
llIA
A162
109,
265
Pare
nt's
Repr
esen
tatio
n Pr
ogra
mCS
V150
4462
,118
Pare
nt's
Repr
esen
tatio
n Pr
ogra
mCS
V150
4462
,697
Sub-
tota
l:45
1,62
4
Stat
e Gr
ant f
rom
Cou
nty
Road
Adm
inist
ratio
n Bo
ard
Coun
ty R
oads
- Ar
teria
l Pre
serv
atio
nNA
572,
859
Bow
Hill
Road
2913
-01
62,2
97
Sub-
tota
l:63
5,15
6
Stat
e Gr
ant f
rom
Dep
artm
ent o
f Agr
icultu
re
Spar
tina
Prog
ram
K114
54,
934
Spar
tina
Prog
ram
K171
019
,712
Knot
wee
d Co
ntro
l (Gr
andy
Cre
ek)
K123
144
0
Repo
rt ba
sed
on u
naud
ited
annu
al re
port
subm
issio
ns a
s of
4/8
/201
6
218

Gra
ntor
Prog
ram
Titl
eId
entif
icat
on
Num
ber
Amou
nt
Knot
wee
d Co
ntro
l (Sa
mish
Rive
r)K1
750
8,49
6
Sub-
tota
l:33
,581
Stat
e Gr
ant f
rom
Dep
artm
ent o
f Com
mer
ce
Adva
nced
Env
ironm
enta
l Per
mitt
ing
Gran
t Pro
gram
AP 1
5-68
610-
003
212,
500
Vict
im/W
itnes
s As
istan
ce G
rant
Pro
gram
S15-
3110
2526
16,8
69
Vict
im/W
itnes
s As
istan
ce G
rant
Pro
gram
S16-
3110
2-52
67,
795
Sub-
tota
l:23
7,16
4
Stat
e Gr
ant f
rom
Dep
artm
ent o
f Hea
lth
Hom
e Vi
sitin
g Se
rvice
Acc
ount
(HVS
A)20
1208
013
11,8
59
Hom
e Vi
sitin
g Se
rvice
Acc
ount
(HVS
A)20
1507
015
8,97
7
Imm
uniza
tion
Coop
erat
ive A
gree
men
tsVa
ccin
es in
Lie
u of
Cas
h 20
15 C
1712
429
,722
Puge
t Sou
nd O
SS L
MP
Impl
emen
tatio
nC1
7124
55,8
24
Rec
Shel
lfish
/Bio
toxin
(PSA
A)C1
7124
4,45
9
Sub-
tota
l:11
0,84
1
Stat
e Gr
ant f
rom
Dep
artm
ent o
f Eco
logy
Site
Haz
ard
Asse
ssm
ent
G140
0046
28,5
92
Loca
l Sou
rce
Cont
ol P
artn
ersh
ipIA
AC14
0003
451
,078
Loca
l Sou
rce
Cont
ol P
artn
ersh
ipIA
AC16
0003
049
,596
Loca
l Tox
ins
Cont
rol C
oord
inat
ed
Prev
entio
n Gr
ant
G140
0016
729
,563
Loca
l Tox
ins
Cont
rol C
oord
inat
ed
Prev
entio
n Gr
ant
W2R
CPG-
1517
-SkC
oHD-
0002
827
,328
Repo
rt ba
sed
on u
naud
ited
annu
al re
port
subm
issio
ns a
s of
4/8
/201
6
219
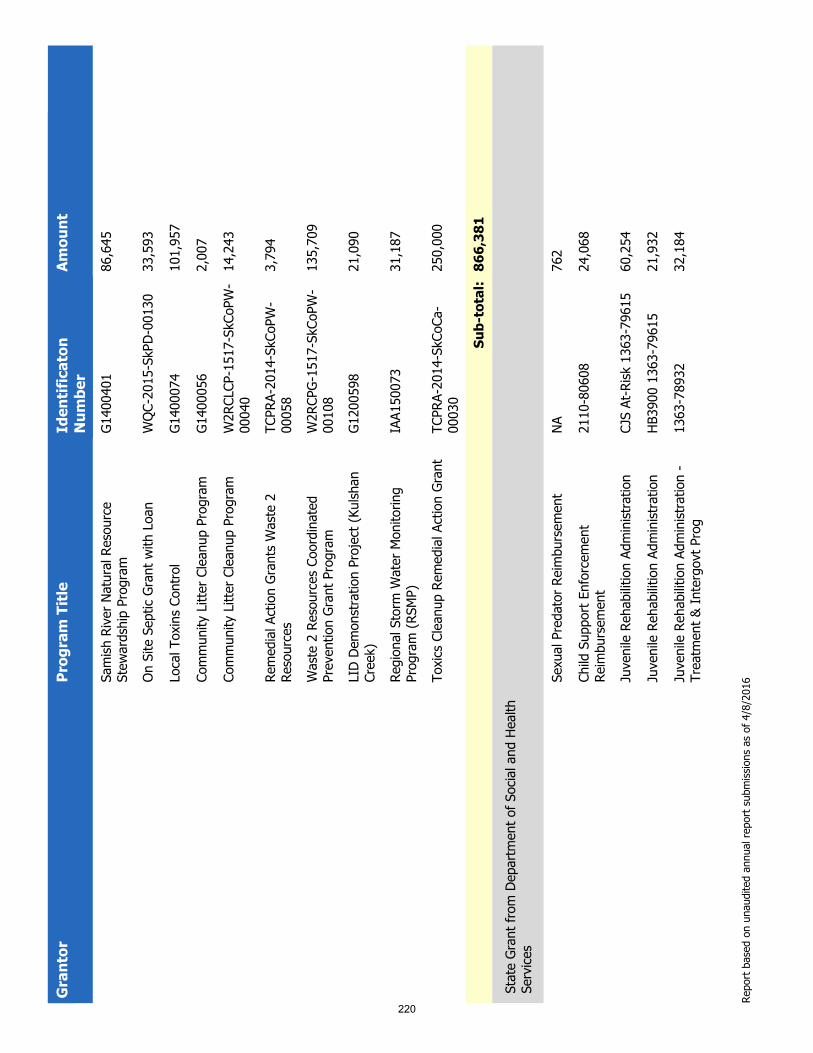
Gra
ntor
Prog
ram
Titl
eId
entif
icat
on
Num
ber
Amou
nt
Sam
ish R
iver N
atur
al R
esou
rce
Stew
ards
hip
Prog
ram
G140
0401
86,6
45
On S
ite S
eptic
Gra
nt w
ith L
oan
WQC
-201
5-Sk
PD-0
0130
33,5
93
Loca
l Tox
ins
Cont
rol
G140
0074
101,
957
Com
mun
ity L
itter
Cle
anup
Pro
gram
G140
0056
2,00
7
Com
mun
ity L
itter
Cle
anup
Pro
gram
W2R
CLCP
-151
7-Sk
CoPW
-00
040
14,2
43
Rem
edia
l Act
ion
Gran
ts W
aste
2
Reso
urce
sTC
PRA-
2014
-SkC
oPW
-00
058
3,79
4
Was
te 2
Res
ourc
es C
oord
inat
ed
Prev
entio
n Gr
ant P
rogr
amW
2RCP
G-15
17-S
kCoP
W-
0010
813
5,70
9
LID
Dem
onst
ratio
n Pr
ojec
t (Ku
lshan
Cr
eek)
G120
0598
21,0
90
Regi
onal
Sto
rm W
ater
Mon
itorin
g Pr
ogra
m (R
SMP)
IAA1
5007
331
,187
Toxic
s Cl
eanu
p Re
med
ial A
ctio
n Gr
ant
TCPR
A-20
14-S
kCoC
a-00
030
250,
000
Sub-
tota
l:86
6,38
1
Stat
e Gr
ant f
rom
Dep
artm
ent o
f Soc
ial a
nd H
ealth
Se
rvice
s
Sexu
al P
reda
tor R
eim
burs
emen
tNA
762
Child
Sup
port
Enfo
rcem
ent
Reim
burs
emen
t21
10-8
0608
24,0
68
Juve
nile
Reh
abilit
ion
Adm
inist
ratio
nCJ
S At
-Risk
136
3-79
615
60,2
54
Juve
nile
Reh
abilit
ion
Adm
inist
ratio
nHB
3900
136
3-79
615
21,9
32
Juve
nile
Reh
abilit
ion
Adm
inist
ratio
n -
Trea
tmen
t & In
terg
ovt P
rog
1363
-789
3232
,184
Repo
rt ba
sed
on u
naud
ited
annu
al re
port
subm
issio
ns a
s of
4/8
/201
6
220

Gra
ntor
Prog
ram
Titl
eId
entif
icat
on
Num
ber
Amou
nt
Juve
nile
Reh
abilit
ion
Adm
inist
ratio
nIn
tens
ive D
ivers
ion
1363
-79
615
14,9
31
Juve
nile
Reh
abilit
ion
Adm
inist
ratio
nSS
ODA
1363
-796
154,
255
Juve
nile
Reh
abilit
ion
Adm
inist
ratio
nCJ
AA F
FT 1
363-
7961
53,
873
Juve
nile
Reh
abilit
ion
Adm
inist
ratio
nCJ
S At
-Risk
156
3-43
117
62,6
72
Juve
nile
Reh
abilit
ion
Adm
inist
ratio
nIn
tens
ive D
ivers
ion
1563
-43
117
18,2
85
Juve
nile
Reh
abilit
ion
Adm
inist
ratio
nCD
DA 1
563-
4311
742
6
Juve
nile
Reh
abilit
ion
Adm
inist
ratio
n -
Trea
tmen
t & In
terg
ovt P
rog
1563
-431
1727
,414
Juve
nile
Reh
abilit
ion
Adm
inist
ratio
nSS
ODA
1563
-431
179,
580
Child
Sup
port
Enfo
rcem
ent
75-1
501-
0-1-
609
5,95
2
Subs
tanc
e Ab
use
Serv
ice T
reat
men
t11
63-2
7323
306,
223
NSM
HA J
ail S
ervic
esJa
il Se
rvice
s 13
-15
40,1
87
NSM
HA S
kagi
t Adm
in 1
5Pe
er C
ente
r37
,500
NSM
HA S
kagi
t Adm
in 1
5HA
RPS
51,4
80
Chem
ical D
epen
denc
y Tr
eatm
ent
1563
-438
7725
9,14
3
Subs
tanc
e Ab
use
and
Men
tal H
ealth
Se
rvice
s Ad
min
istra
tion
1563
-424
942,
407
Seni
or F
arm
ers
Mar
ket N
utrit
ion
Prog
ram
1630
09-N
UTR
Vouc
hers
12,0
98
Child
Sup
port
Enfo
rcem
ent
75-1
501-
0-1-
609/
2110
-80
608
179,
887
Sub-
tota
l:1,
175,
512
Stat
e Gr
ant f
rom
Leg
islat
ure
and
its C
omm
ittee
s
Repo
rt ba
sed
on u
naud
ited
annu
al re
port
subm
issio
ns a
s of
4/8
/201
6
221

Gra
ntor
Prog
ram
Titl
eId
entif
icat
on
Num
ber
Amou
nt
40%
Aut
opsy
Rei
mbu
rsem
ent
RCW
68.
08.1
0443
,867
Elec
ted
Offic
ial S
alar
y M
atch
RCW
36.
17.0
2079
,224
Sub-
tota
l:12
3,09
1
Stat
e Gr
ant f
rom
Crim
inal
Jus
tice
Trai
ning
Co
mm
issio
n
Regi
ster
ed S
ex O
ffend
er A
ddre
ss &
Re
siden
cy V
erifi
catio
n Pr
ogra
mRS
O 14
-15
Skag
it80
,973
Sub-
tota
l:80
,973
Stat
e Gr
ant f
rom
Rec
reat
ion
and
Cons
erva
tion
Offic
e
DD#
3 De
lta C
hann
el D
esig
nRC
O#13
-105
7P10
3,97
3
Hans
en C
reek
- Re
ach
5 Re
stor
atio
nRC
O#13
-106
0P79
,266
North
For
k Sk
agit
Acqu
isitio
n an
d Fe
asib
ility
RCO#
13-1
059C
260,
787
Hans
en C
reek
- Re
ach
5 Re
stor
atio
nRC
O#13
-106
0P19
2,91
8
Sub-
tota
l:63
6,94
4
Stat
e Gr
ant f
rom
Agr
icultu
ral C
omm
issio
ns
Spec
ial A
ssist
ance
Gra
nt F
unds
K136
65,
000
Sub-
tota
l:5,
000
Stat
e Gr
ant f
rom
Milit
ary
Depa
rtmen
t
Prof
essio
nal D
evel
opm
ent &
Ope
ratio
nal
E911
E15-
048
18,8
70
Prof
essio
nal D
evel
opm
ent &
Ope
ratio
nal
E911
E16-
033
30,7
69
Repo
rt ba
sed
on u
naud
ited
annu
al re
port
subm
issio
ns a
s of
4/8
/201
6
222

Gra
ntor
Prog
ram
Titl
eId
entif
icat
on
Num
ber
Amou
nt
Sub-
tota
l:49
,639
Gra
nd to
tal:
4,40
5,90
4
Repo
rt ba
sed
on u
naud
ited
annu
al re
port
subm
issio
ns a
s of
4/8
/201
6
223

SKAGIT COUNTY, WASHINGTON
NOTES TO THE SCHEDULE OF STATE FINANCIAL ASSISTANCE
For the year ended December 31, 2015
NOTE 1 – PRIOR YEAR EXPENSE The total amount expended for this program includes $180,094.91 for 2014.
224

THIS PAGE INTENTIONALLY LEFT BLANK