Embed Size (px)
Citation preview

Size Spectrum of Suspended Particulate Matter in the Bohai Sea
Zhipeng Sun
Harvard University Department of Molecular and Cellular Biology
Cambridge, Massachusetts, USA 02138 Email: [email protected]
Wensheng Jiang
Ocean University of China Department of Physical Oceanography
Qingdao, China 266003 Email: [email protected]
Abstract- We investigate the distribution and dynamics of suspended particulate matter (SPM) concentration in the Bohai Sea in China. Previous research in the area was limited to sampling analyzed in the laboratory, distorting the SPM size spectrum as smaller particles are cohesive and larger particles dissociate. The LISST-100B, an advanced optical device, allows for in-situ measurement of the SPM size spectrum. These measurements are analyzed during a period of low Yellow River discharge, including a size spectrum analysis of SPM distribution and a time-series analysis. Areas of high SPM concentration are found in the western Laizhou Bay and in the western Bohai Sea. SPM in the region is determined to be due to resuspension of particulate matter from the Yellow River before 1996. Unlike previously thought, the present-day Yellow River delta does not significantly affect SPM concentration levels as the water output contains low SPM and as resuspension is local in nature. The majority of SPM are particles smaller than 6 microns in volume-equivalent diameter (VED). Areas further from the Yellow River have a greater percentage of larger particles. For the first time, the size limit of resuspension is determined to be around 210 microns in VED. This provides a basis for finding the relationship between tidal currents and the critical velocity for resuspension with respect to particle size.
I. INTRODUCTION
Research into the distribution and dynamics of suspended particulate matter (SPM) concentration is integral to understanding sediment dynamics in waterways. Such research is important, for over time sediments can disrupt waterways, block deltas, and transport pollutants. High sedimentation also affects industrial output and city water supply, as is the case near Dongying (a coastal industrial city) by the Yellow River delta [1]. SPM is also indicative of erosion, either of coastlines or of areas inland. This research expands on previous study of SPM distribution and dynamics around the Laizhou Bay area of the Bohai Sea by introducing a method to collect data in-situ, thereby allowing accurate determination of SPM size distribution.
A. Study Location and Conditions The Bohai Sea is a flat continental shelf located in
northeastern China, with an average water depth of only 18 m. It is composed of the Bohai Strait, Bohai Bay, Liaodong Bay, and Laizhou Bay. Due to its shallow nature, wind is a dominant force of kinetic energy to invoke tidal currents which range from 0.7 to 2.0 m/s. There is no vertical stratification except for in summer. Tides are semi-diurnal [2].
Sediment deposition results from organic matter, river runoff, erosion, and/or atmospheric material. The primary source of sediment in the Bohai Sea is from the sand-heavy Yellow River, which empties north of the Laizhou Bay. The sediment released is fine particles, composed mainly of clay and silt less than 16 microns (here the size of an irregularly shaped particle is measured by the volume-equivalent diameter (VED) which is defined as the diameter of a spehere with the same volume as the particle. All the particle sizes to be discussed in the paper will be in the VED form.) SPM concentration in the Bohai Sea is controlled by deposition due to gravity and resuspension due to wind and tide-induced turbulence [2].
The Yellow River has high SPM due to erosion of the Loess Plateau in Central China. Resulting SPM concentrations can exceed 1000 kg/m3 during flood periods. Water deposited in the Bohai Sea is filtered through the Yellow River delta, reducing SPM concentration to around 100 kg/m3 [1]. The high amount of SPM has resulted in the world’s most dynamic coastline by the Yellow River. It has also caused the mouth of the Yellow River to change location – the most recent change was in 1996, when it moved from emptying into the Laizhou Bay to emptying northwards. Today, to prevent flooding the Yellow River is artificially controlled by dams. During the time of the research, the Yellow River had an average discharge of 109 m3/s. This discharge was relatively low compared to discharge during flooding periods from July to September. For example, on July 3, 2005 the discharge was 3070 m3/s.
B. Previous Research SPM distribution in the Bohai Sea has been explored
previously [3] [4]. Most notably, a numerical SPM transport model based on the Hamburg Shelf Ocean Model (HANSOM) was developed to predict SPM dynamics [5]. This model has been continually refined with field-collected data. Such data analyzed at the laboratory along with LANDSAT images serve to classify SPM concentration and size and to approximate SPM distribution and fluctuation [6]. However, these studies are limited in their ability to identify SPM size distribution or depth relations, and have small sample sizes. It was first identified that samples analyzed in a laboratory distort SPM size distributions as larger particles dissociate into smaller particles while particles smaller than 2 microns are cohesive due to electrical and chemical forces [7]. This

highlights the importance of using in-situ data to accurately determine SPM size distribution.
C. Instrumentation and Theory To collect in-situ data, a Laser In-Situ Scattering and
Transmissometry version B (LISST-100B) is utilized. This optical device measures the scattering from a 5 cm laser beam through thirty-two ring-detectors logarithmically spaced from 0.0017 to 0.34 radians in size. The resulting value, a power vector E
&, allows for the determination of area distribution
aN&
,
][ zscataNKCE +=&&
! (1) Where! is beam attenuation relative to clear water, C is a calibration constant, K is a calculated scattering kernel matrix, and zscat is background light relative to clear water [8]. The area distribution can be converted into a volume distribution iaV , for each size class i ,
CidiaNiaV /],[, = (2)
Where id is the median sediment size [9]. The unit of volume
distribution iaV , can be (uL/L) or other convenient units such
as (particles/L). Studies have been done on the accuracy of the LISST-100B.
This device measures SPM size with 10 percent error which increases with particle size [9]. Problems also exist with measuring flocculation. In order to negate variation in volume concentration of up to 23 percent [10], time series in the LISST-100B data have been averaged over a period of one minute. Although LISST-100B is clearly imperfect, its ability to analyze data in-situ allows for much more accuracy than post-collection analysis.
II. DATA
Data from fifteen stations were measured by the Ocean University of China during a cruise from May 9 through 16, 2005 in the Laizhou Bay area of the Bohai Sea. A LISST-100B, Acoustic Doppler Current Profiler (ADCP), CTD, and Anemometer were utilized for data collection. The sampling rates of LISST-100B and the CTD, respectively, were 1Hz and 6Hz, respectively. Sediment concentration, wind speed, salinity, temperature, depth, and chlorophyll were collected at every location. ADCP data were collected for Station 7. Water discharge data from the Yellow River was obtained from the Yellow River Conservancy Commission.
Fig. 1 shows the positions of data collection. All recorded stations except for Station 7 are grid stations – the cruise stopped at these stations to collect one profile. Station 7 is a special anchored station where 24 profiles were collected on the hour. Station 0 is a dock, and data for Station 9 were not recorded. Raw data collected by LISST-100B needed to be manually processed, as data was downloaded after several deployments.
III. METHODS
To accurately describe SPM distribution, additional information besides LISST-100B SPM concentration data is needed. High variability occurs in the data due to the different locations, times, and conditions at which each data set was taken. The effects of each variable have been studied. We have found that the most prominent variables are wind and tides, both of which cause turbulence and resuspension of sediment on the ocean floor, thereby positively skewing SPM concentrations. Additionally, variables such as salinity can shed light on the sources of SPM or on the tidal cycle at which data was collected, and chlorophyll data can be used to determine organic matter composition.
Two methods of analysis have been utilized: a size spectrum analysis of SPM distribution and a time-series analysis. The first is focused on determining distribution and size relationships, whereas the second is for determining trends in the area. The time-series analysis provides determination of the size limit of resuspension. Data is analyzed and processed through custom written programs and a commercial software package Surfer (Golden Software).
A. Size Spectrum Analysis of SPM Distribution Two methods of size spectrum analysis of SPM distribution
are used: one of SPM volume concentration and one of SPM particle amount. SPM volume distribution over the Laizhou Bay provides information on areas of high concentration relative to other areas. The volume distribution is measured in uL/L, and is iaV , in (2). This allows for identification of high
SPM zones and possible sources of the SPM. It also allows for total SPM concentration by volume distribution; however the concentration by volume for smaller particles is significantly smaller than the concentration by volume for larger particles.
Analysis of SPM particle amount distribution allows for identification of the percent of SPM determined by a certain size class. As it compares the size classes relative to each other at any given location, this analysis provides
Figure 1. Location of data collection.
118 118.5 119 119.5 120 120.5 121 121.5 122 122.5
37.5
38
38.5
39
39.5
40
40.5
41
13 12 11
521
3 4
876141510
Anchored Station
Grid Station
identification of the influence of certain sources on the SPM size spectrum at a given area. It also shows the average size of particles in suspension. It is measured similarly to iaN , in (2),
but assumes particles occupy volume and are round and closely-packed. The equation for the calculation of the SPM particle amount distribution, referred to as iaP , , is:
3)
2(3
4
*,,
id
conviaViaP
"
= (3)
In (3), conv is a conversion factor. The units of iaP , are in
particles/L. Although (3) does not allow for space between particles, it should not affect results as it is applied to all size classes and the amount of packing is proportional to particle volume. Possible error, however, occurs from a lack of representation of calibration factor C . Although C is defined as a constant, in practice its value may be allowed to vary with particle size [9].
B. Time-Series Analysis The time-series analysis, conducted at the anchored Station
7, allows for insight into the general dynamics of the Bohai Sea. By comparing 24 profiles collected per-hour of LISST-100B, CTD, and ADCP data, the effect of variables over time can be observed. The most prominent of these variables are tidal currents, volume concentration, and salinity. These three can be easily compared using a surface map overlayed with a colored contour map, put beside a diagram of tidal currents. The analysis is with respect to depth and increasing time.
An additional advantage of the time-series analysis is the ability for the first time to determine the size limit of resuspension in the Bohai Sea. The theory of the critical velocity of resuspension states that every particle, there is a critical velocity at which it will be suspended. If the tidal current is greater than the critical velocity for the particle, then
resuspension will take place. By comparing time-series volume concentration contour maps for SPM of different sizes, the effect of 1.5 tidal cycles can be seen on resuspension. The size at which the influence of tidal currents cannot be seen is the theoretical size limit of resuspension.
IV. RESULTS AND DISCUSSION
We are interested in an in-situ analysis of the distribution and dynamics of SPM concentration in the Bohai Sea through a size-spectrum analysis of distribution and a time-series analysis at a stationary site. We hypothesize that SPM is due to resuspension of pre-1996 particulate matter from the Yellow River mouth. Local resuspension of particles under 6 microns in size compose most SPM. Importantly, the size limit to resuspension is experimentally determined to be 210 microns in VED.
A. Size Spectrum Analysis of SPM Distribution
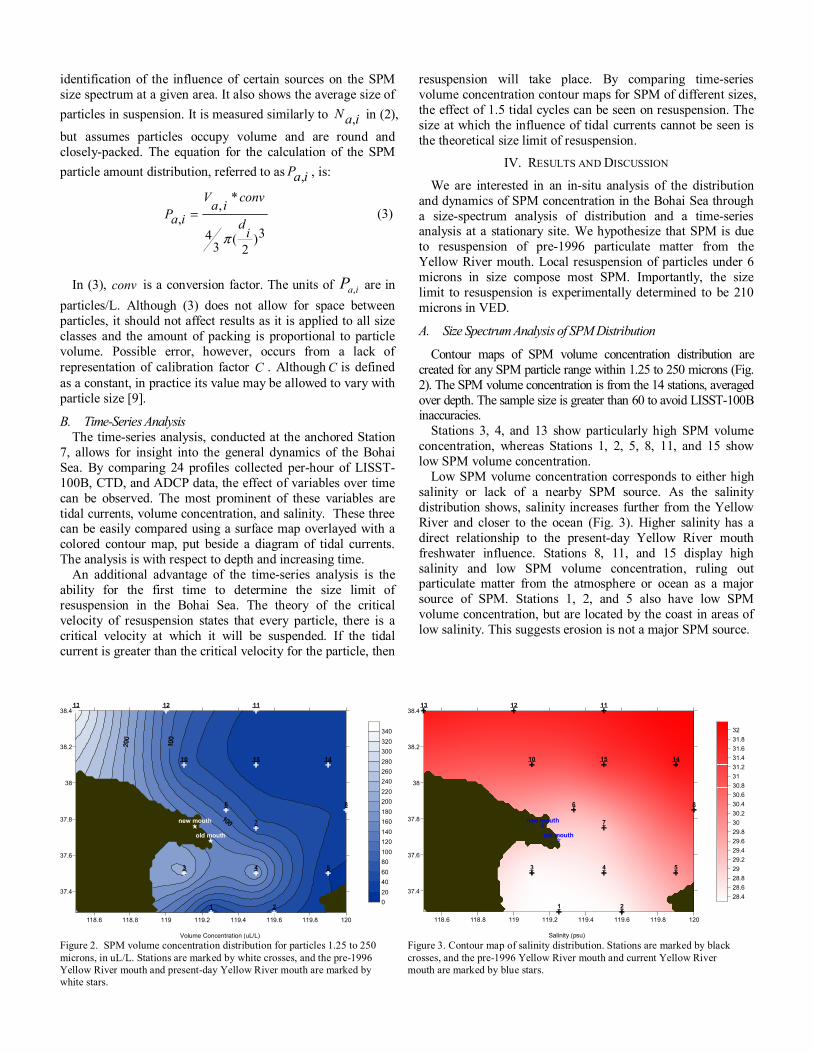
Contour maps of SPM volume concentration distribution are created for any SPM particle range within 1.25 to 250 microns (Fig. 2). The SPM volume concentration is from the 14 stations, averaged over depth. The sample size is greater than 60 to avoid LISST-100B inaccuracies.
Stations 3, 4, and 13 show particularly high SPM volume concentration, whereas Stations 1, 2, 5, 8, 11, and 15 show low SPM volume concentration.
Low SPM volume concentration corresponds to either high salinity or lack of a nearby SPM source. As the salinity distribution shows, salinity increases further from the Yellow River and closer to the ocean (Fig. 3). Higher salinity has a direct relationship to the present-day Yellow River mouth freshwater influence. Stations 8, 11, and 15 display high salinity and low SPM volume concentration, ruling out particulate matter from the atmosphere or ocean as a major source of SPM. Stations 1, 2, and 5 also have low SPM volume concentration, but are located by the coast in areas of low salinity. This suggests erosion is not a major SPM source.
118.6 118.8 119 119.2 119.4 119.6 119.8 120
37.4
37.6
37.8
38
38.2
38.4
1 2
3 4 5
6
7
8
10
111213
1415
old mouth
new mouth
Volume Concentration (uL/L)
0
20
40
60
80
100
120
140
160
180
200
220
240
260
280
300
320
340
118.6 118.8 119 119.2 119.4 119.6 119.8 120
37.4
37.6
37.8
38
38.2
38.4
1 2
3 4 5
6
7
8
10
111213
1415
old mouth
new mouth
28.428.628.82929.229.429.629.83030.230.430.630.83131.231.431.631.832
Salinity (psu) Figure 2. SPM volume concentration distribution for particles 1.25 to 250 microns, in uL/L. Stations are marked by white crosses, and the pre-1996 Yellow River mouth and present-day Yellow River mouth are marked by white stars.
Figure 3. Contour map of salinity distribution. Stations are marked by black crosses, and the pre-1996 Yellow River mouth and current Yellow River mouth are marked by blue stars.

Stations 1, 2, and 5 also suggest that freshwater from the
Yellow River is low in SPM. Freshwater from the Yellow River decreases the salinity inside the bay, yet keeps SPM concentration low. Fig. 4 shows the salinity depth profile for Station 6, the closest station to the present-day Yellow River mouth, and a typical salinity depth profile represented by Station 2. Notice how Station 6 has salinity stratification from 0-5 m and from 8-13 m, whereas salinity at Station 2 is uniform. The layer of lower salinity is hypothesized to be due to Yellow River freshwater influence. Although it was raining at the time, rainfall is hypothesized not to be the source as Station 7 shows similar salinity layering. The corresponding low salinity layer in the volume concentration depth profile from 0-5m shows low SPM concentration. However, below 5m salinity varies directly with concentration. This relationship indicates the lack of SPM in the current Yellow River water. As there was low Yellow River discharge during the period of data collection, the velocity of the water was most likely low, causing low turbidity and SPM suspension. Note, however that these results do not hold during the historical flood season.
The high SPM volume concentrations at Stations 13, 3, and 4 can be explained by two possibilities – either there was turbulence at that time in the area causing resuspension, or the SPM is naturally occurring in the area. Turbulence can be seen
through volume concentration depth profiles (Fig. 5). Sloped lines indicate turbulence – either high wind or tidal currents – which cause sediment on the ocean floor to undergo advection towards the ocean surface. We have found that the time of this advection in the Bohai Sea is approximately one hour due to high winds [2]. The profiles for Stations 4 and 13 show turbulence, whereas the profile for Station 3 is constant. The leveling off of SPM volume concentration at depths less than 4 m in the Station 13 volume concentration depth profile reflects the recent nature of the turbulence. Meteorological data shows low winds at the time for all three stations, ruling out wind as a source of turbulence. Although tidal currents are able to induce the turbulence at Station 4, they cannot explain the seven-fold increase of volume concentration at Station 13. Fig. 6 shows the fluctuation of SPM volume concentration by SPM size. For all three stations, there is a high concentration of particles less than 1.5 microns despite larger particle sizes being biased towards higher concentration. This shows the dominance of smaller SPM in the region, possibly from the Yellow River. Notice how the trend for Station 3 and Station 4 is relatively similar, whereas Station 13 shows a trend of SPM volume concentration at its maximum around 40 microns. This suggests Station 13 could be a different source of turbulence than Stations 3 and 4. One possible explanation for Station 13 is a gyre of high-SPM water from the Yellow River at the time of analysis.
As the volume concentration depth profile for Station 3 is constant, the high SPM volume concentration is naturally occurring in the area. Due to its vicinity to the pre-1996 Yellow River mouth and lack of other possible SPM sources, it is hypothesized that the pre-1996 Yellow River mouth is the driving force behind SPM in the areas. It is known that the pre-1996 Yellow River mouth delivered high amounts of SPM into the Laizhou Bay, which eventually caused the delta to be blockaded [1]. Although most of the SPM is not less than 16 microns, the size cited as the median output of the Yellow River, the larger median sizes are due to flocculation of smaller particles as well as a volume distribution analysis. This can explain why the trend between Stations 3 and 4 in is similar, as the resuspension is of sediment from the same source (Fig. 6).
At Station 3, Fig. 6 shows an unusually high concentration, above 15 uL/L, of SPM between 180 and 250 microns. In-situ chlorophyll data from the CTD shows that Station 3 had high chlorophyll content, averaging 1.2 ug/L. In comparison, chlorophyll averaged 0.4 ug/L at Station 4 and 0.3 ug/L at Station 13. The particles greater than 180 microns are most likely phytoplankton or algae.
Vol
ume
Con
cent
ratio
n (u
L/L)
Depth (m) (a) (b) (c)
Figure 5. (a) Volume Concentration depth profile for Station 4. (b) Profile for Station 13. (c) Profile for Station 3.
(a)
(b)
Figure 4. (a) Salinity depth profile for Stations 6 and 2. (b) Volume concentration depth profile for Station 6.

Figure 6. SPM volume concentration with respect to size. SPM size increases logarithmically due to LISST-100B size classes. The SPM size is the median of the size class. Data shown is for the three stations with overall high SPM concentration
Figure 7. Size spectrum analysis of SPM particle amount distribution by percent composition LISST-100B size classes. Both scales are lograithmic. The SPM size is the median of the size class.
To find the average size of particles and to determine their source, one can look at a size spectrum analysis of SPM particle amount distribution, in particles/L, by percent composition (Fig. 7). Above 6 microns, percent composition approaches zero. Although the stations generally follow similar patterns, it can be seen that Stations 2, 5, 8, and 14 have a higher percent composition of larger particles. These stations are also situated the furthest from the Yellow River mouth, at the opposite end of the bay. This is evidence that SPM is caused by local resuspension of particles deposited beforehand, not from freshwater output from the Yellow River. Furthermore, Station 3 has a high percent composition of smaller particles, supporting the belief that resuspension in that area is of small-sized SPM deposited by the pre-1996 Yellow River.
B. Time-Series Analysis The time-series analysis is of the anchored Station 7, where
24 hours’ worth of data is collected. Fig. 8 shows the culmination of this analysis. Three variables are portrayed: volume concentration of SPM from 1.25 to 250 microns in size, salinity, and current. These are taken with respect to depth and time, where hour 0 corresponds to 16:20 Beijing Standard Time on May 15th, 2005.
The salinity profile is similar to one at Station 6 between the hours of 0-8 and 16-23, as two distinct layers can be seen. As volume concentration is likewise low at these areas, this is more evidence of present-day low SPM Yellow River freshwater content. Station 7’s proximity to Station 6 supports this conclusion.
When salinity and volume concentration are compared to the tidal current, however, evidence of local resuspension of
SPM can be seen. High tide occurs around hour 12 as there is advection of high salinity ocean water. Low tide is around hours 5 and 18. SPM volume concentration, however, does not increase with advection of ocean water. Instead, it varies directly with tidal current velocity, reaching a peak at hours 9 and 16. This indicates that tidal currents play a primary role in SPM concentration, and it is well documented that the turbulence caused by tidal currents cause local resuspension of ground sediment.
Furthermore, the advection of sediment towards the surface can be seen through the positive gradient of volume concentration with respect to decreasing depth at any given hour. Although the influence of tidal currents on SPM resuspension varies slightly depending on location, at Station 7 the SPM volume concentration increases two-fold.
0 mm/s
300 mm/s
Salinity(psu)
28.55
28.9
29.25
29.6
Time (hours)
Figure 8. Volume concentration, salinity, and tidal current with respect to depth and time.

Figure 9. Four time-series graphs of volume concentration from Station 7, by size range.
0 2 4 6 8 10 12 14 16 18 20 22
Time (hours)
-14
-12-10
-8-6
-4-2
Dep
th (m
)5203550658095110125140
1.25 - 78.2 microns
0 2 4 6 8 10 12 14 16 18 20 22
Time (hours)
-14-12-10
-8-6
-4-2
Dep
th (m
)
0246810121416
151 - 180 microns
0 2 4 6 8 10 12 14 16 18 20 22
Time (hours)
-14
-12-10
-8-6-4
-2
Dep
th (m
)
0481216202428323640
180 - 210 microns
0 2 4 6 8 10 12 14 16 18 20 22
Time (hours)
-14-12
-10
-8
-6-4
-2
Dep
th (m
)
0
10
20
30
40
50
60
70210 - 250 microns
This relationship can be applied to identify the influence of the tidal currents on SPM resuspension at other stations.
Four time-series graphs of volume concentration for different size ranges from Station 7 can identify the particle size at which tidal currents breach the critical velocity of resuspension (Fig. 9). The critical velocity of resuspension occurs when the tidal current does not effect SPM volume concentration. For sediment of size 180 microns or less, tidal current-induced resuspension is seen from hours 8-12 and 14-18. The effect of tidal currents can also be seen, though to a lesser extent, for sediment of size 180-210 microns. For sediment of size 210-250 microns, however, the effect of tidal currents is indiscernible when compared to volume concentration over the entire depth profile and time-series. This indicates the tidal currents at the time reached the critical velocity of resuspension for particles less than approximately 210 microns. In other words, the size limit of resuspension is around 210 microns. This conclusion holds for tidal currents ranging from 0-6 m/s, the speed at the time of data collection. Additional time-series data and more exact instrumentation are needed to identify the precise size limit of resuspension.
V. CONCLUSION
In the Bohai Sea during a period of low Yellow River discharge, particulate matter from the pre-1996 Yellow River mouth is the primary source of SPM. The resuspension is local in nature and induced by tidal currents which cause around two-fold increases in volume concentration. The present-day Yellow River mouth does not contribute significantly to SPM concentration, as water output is low in SPM. Erosion, atmospheric sources, and oceanic sources also do not significantly affect SPM. The source of SPM greater than 180 microns, however, is attributed in part to organic matter such as phytoplankton or algae. Two areas of high SPM concentration are found – one in the western section of the
Laizhou Bay (Stations 3 and 4) and one outside of the bay in the western Bohai Sea (Station 13). Of these, the high concentration at Station 13 needs to be investigated further.
From the analysis on SPM particle amount concentration, the majority of SPM is less than 6 microns in size, with a high concentration of SPM less than 1.5 microns. The stations further away from the Yellow River, at the western side of the Laizhou Bay and at the central Bohai Sea, have on average larger particles than those closer to the Yellow River.
A time-series analysis reveals that the size limit for resuspension in the Bohai Sea is around 210 microns. This assumes tidal currents ranging from 0-6 m/s and uniform particle composition. With future research, the relationship between tidal currents and the critical velocity of resuspension with respect to particle size can be discerned.
ACKNOWLEDGMENT
This material is based upon work supported by the National Science Foundation under Grant No. OISE-0229657. Any opinions, findings, and conclusions of recommendations expressed in this material are those of the author(s) and do not necessarily reflect the views of the National Science Foundation. The authors thank Yue Yuan for his invaluable support and guidance during the project. We also thank Prof. Hung Tao Shen and Prof. Hayley Shen, for it is due to their dedication that this research is possible.
REFERENCES [1] G Li, H Wei, Y Han and Y Chen, “Sedimentation in the Yellow River
Delta, Part I: Flow and Suspended Sediment Structure in the Upper Distributary and the Esturary,” Mar. Geol. vol. 149, pp. 93-111, 1998.
[2] WS Jiang, T Pohlmann, J Sun, and A Starke, “SPM Transport in the Bohai Sea: Field Experiments and Numerical Modeling,” J. Mar. Syst. vol. 44, pp. 175-188, 2004.
[3] YSH Qin and F Li, “The Study of the SPM in the Bohai Sea,” Acta Oceanol. Sin. vol. 4, pp. 191-2000, 1982. (in Chinese).

[4] JM Martin, J Zhang, MC Shi, and Q Zhou, “Actual Flux of the Huanghe (Yellow River) Sediment to the Western Pacific Ocean,” Neth. J. Sea Res. vol. 31, pp. 243-254, 1993.
[5] WS Jiang, “A Three Dimensional Modeling of Suspended Particulate Matter Dynamics of the Bohai Sea,” Ber. Zent. Meeres- Klimaforsch. Univ. Hambg., B. vol. 34, pp. 1-104, 1999.
[6] WS Jiang and HJ Wang, “Distribution of Suspended Matter and its Relationship with Sediment Particle Size in Laizhou Bay,” Oceanol. Limnol. Sin. vol. 36, pp. 97-103, 2004. (in Chinese).
[7] AJ Bale and AW Morris, “In Situ Measurement of Particle Size in Estuarine Waters,” Estuar. Coast. Shelf Sci. vol. 24, pp. 253-263, 1987.
[8] YC Agrawal and P Traykovski, “Particles in the Bottom Boundary Layer: Concentration and Size Dynamics through Events,” J. Geophys. Res. vol. 106, pp. 9533-9542, 2001.
[9] JW Gartner, RT Cheng, PF Wang, and K Richter, “Laboratory and Field Evaluations of the LISST-100 Instrument for Suspended Particle Size Determinations,” Mar. Geol. vol. 175, pp. 199-219, 2001.
[10] QA Mikkelsen and M Perjup, “The Use of a LISST-100 Laser Particle Sizer for In-Situ Measurements of Floc Size, Density and Settling Velocity,” Geo-Mar. Lett. vol. 20, pp. 187-195, 2001.