Embed Size (px)
Citation preview

TECHNICAL REPORT
Sixth external quality assessment scheme for Salmonella typing
www.ecdc.europa.eu

ECDC TECHNICAL REPORT
Sixth external quality assessment scheme for Salmonella typing
ii
This report was commissioned by the European Centre for Disease Prevention and Control (ECDC), coordinated by Taina Niskanen (ECDC Food- and Waterborne Diseases and Zoonoses Programme), and produced by Eva Litrup, Mia Torpdahl, Susanne Schjørring and Eva Møller Nielsen (Unit of foodborne infections, Statens Serum Institut, Artillerivej 5, DK-2300 Copenhagen S, Denmark).
Suggested citation: European Centre for Disease Prevention and Control. Sixth external quality assessment scheme for Salmonella typing. Stockholm: ECDC; 2015.
Stockholm, November 2015
ISBN 978-92-9193-725-7
doi 10.2900/43053
Catalogue number TQ-02-15-847-EN-N
© European Centre for Disease Prevention and Control, 2015
Reproduction is authorised, provided the source is acknowledged

TECHNICAL REPORT Sixth EQA scheme for Salmonella typing
iii
Contents
Abbreviations ............................................................................................................................................... iv Executive summary ........................................................................................................................................ 1 1. Introduction .............................................................................................................................................. 2 2. Study design .............................................................................................................................................. 4 3. Results ...................................................................................................................................................... 6 4. Conclusions ............................................................................................................................................. 11 5. Discussion ............................................................................................................................................... 12 6. Recommendations .................................................................................................................................... 14 References .................................................................................................................................................. 15 Annex 1. List of participants .......................................................................................................................... 16 Annex 2. Examples of PFGE profiles ............................................................................................................... 17 Annex 3. TIFF quality grading guidelines (2014) ............................................................................................. 18 Annex 4. BioNumerics Gel Analysis Quality Guidelines 2014 ............................................................................. 19 Annex 5. Scores of the PFGE results .............................................................................................................. 20 Annex 6. MLVA results .................................................................................................................................. 21 Annex 7. Reference strains ........................................................................................................................... 22 Annex 8. Guide to BN database ..................................................................................................................... 23 Annex 9. Guide image acquisition .................................................................................................................. 28 Annex 10. Guide to exporting from BN database ............................................................................................. 30
Figures
Figure 1. A gel scoring ‘Poor’ in ‘Image acquisition and Running Conditions’ and ´Bands´ .................................... 7 Figure 2. A gel scoring ‘Poor’ in the parameter ‘Bands’ and ‘Restriction´.............................................................. 7 Figure 3. A gel scoring ‘Poor’ in both ‘DNA Degradation’ and ‘Bands’ ................................................................... 7 Figure 4. Gel with high scores in six out of seven parameters. ........................................................................... 8 Figure 5. Results of MLVA typing of 10 S. Typhimurium strains by 14 laboratories. .............................................. 9 Figure 6. Comparing EQA-4, EQA-5 and EQA-6 recurrent strains ...................................................................... 10
Tables
Table 1. Number and serotypes of the EQA-6 test strains. ................................................................................. 4 Table 2. Number of FWD-Net laboratories submitting results for each method ..................................................... 6 Table 3. Results of PFGE gel quality for 25 participating laboratories .................................................................. 6 Table 4. Results of the BN analysis obtained by 17 laboratories. ......................................................................... 8 Table 5. Results of the MLVA analysis (14 laboratories). .................................................................................... 9

Sixth EQA scheme for Salmonella typing TECHNICAL REPORT
iv
Abbreviations
BN BioNumerics EQA External Quality Assessment EU/EEA European Union/European Economic Area FWD Food- and Waterborne Diseases and Zoonoses MLVA Multiple-Locus Variable number of tandem repeats Analysis NA Not amplified PFGE Pulsed Field Gel Electrophoresis SSI Statens Serum Institut TESSy The European Surveillance System TESSy-MSS TESSy molecular surveillance system
TECHNICAL REPORT Sixth EQA scheme for Salmonella typing
1
Executive summary
This report presents the results of the sixth round of the Salmonella External Quality Assessment (EQA) scheme for typing of Salmonella enterica spp. enterica (further EQA-6). The EQA covers the methods Pulsed Field Gel Electrophoresis (PFGE) and Multiple Locus Variable number of tandem repeat Analysis (MLVA). A total of 29 laboratories signed up for the EQA-6 that took place in October 2014–March 2015, however three laboratories did not submit any results.
Salmonellosis is the second most commonly reported zoonotic disease with an EU notification rate of 20.4 cases per 100 000 population, and Salmonella is a common cause of foodborne outbreaks. Since 2007, ECDC’s Programme on Food- and Waterborne Diseases and Zoonoses (FWD) has been responsible for the EU-wide surveillance of salmonellosis, including the facilitation of the detection and investigation of foodborne outbreaks. Surveillance data, including some basic typing parameters for the isolated pathogen, are reported by the Member States to the European Surveillance System (TESSy). Besides this basic characterisation of the pathogens, there is a public health value of using more advanced and more discriminatory typing techniques for surveillance of foodborne infections.
The objectives of this EQA-6 are to assess the quality of PFGE and MLVA, and the comparability of the collected
test results between participating public health national reference laboratories in EU/EEA and EU candidate countries. Strains for the EQA were selected to cover strains of current public health relevance in Europe. Sets of ten strains were selected for each method, i.e. a mixture of Salmonella serovars for PFGE and Salmonella Typhimurium strains for MLVA.
A total of 26 laboratories submitted results for at least one part of the EQA-6: 25 laboratories (96%) produced PFGE results, 14 laboratories (54%) produced MLVA results. Thirteen laboratories (50%) completed both PFGE and MLVA.
The majority (72%) of the laboratories were able to produce a PFGE gel of sufficiently high quality to allow for the profiles to be compared with profiles obtained by other laboratories. The subsequent normalisation and interpretation of the profiles was performed using specialised software (BioNumerics). Seventeen laboratories completed the gel analysis and this was generally done in good accordance with the guidelines. Eighty-two percent of the participants obtained a score above 1 from fair to excellent in all parameters. Eleven laboratories (79%) reported correct MLVA profiles for all 10 strains and thirteen laboratories (93%) found the correct profile for at least nine of the ten strains. The results indicate that the majority of the participating laboratories were able to perform the critical calibration of raw data and use the agreed nomenclature.
This EQA-6 scheme for typing of Salmonella is the third EQA specifically organised for laboratories participating in the European Food- and Waterborne Diseases and Zoonoses Network (FWD-Net) that includes molecular typing methods. The large number of participating laboratories as well as their performance in the EQA is encouraging. Comparing EQA-5 and EQA-6 there was a small increase of three participants in the number of participating laboratories in the PFGE part (from 22 to 25 laboratories), but the number of gels which were not useful in an inter-laboratory comparison increased from four to seven (one gel send per participant/laboratory). Two of seven participants were ‘new’ in the PFGE part and an additional three of the seven also achieved results which were not useful for inter-laboratory comparison in EQA-5. The molecular surveillance system that has been implemented as part of TESSy (TESSy-MSS) relies on the capacity of the FWD-Net laboratories to produce comparable typing results. At the moment, the molecular typing methods used for EU-wide surveillance are PFGE for all serovars and MLVA for Typhimurium. This EQA demonstrates that a majority of the participating laboratories were able to produce good typing results. One third of the laboratories produced results (in one or both methods) that need to be improved before inter-laboratory exchange of data; however, for the majority of the identified technical issues an acceptable quality is within reach by optimisation of procedures within laboratories, trouble-shooting assistance, and training.
Sixth EQA scheme for Salmonella typing TECHNICAL REPORT
2
1. Introduction
1.1 Background
The European Centre for Disease Prevention and Control (ECDC) is a European Union (EU) agency with a mandate to operate dedicated surveillance networks and to identify, assess, and communicate current and emerging threats to human health from communicable diseases. Within its mission, ECDC shall foster the development of sufficient capacity within the Community for the diagnosis, detection, identification and characterisation of infectious agents which may threaten public health. The Centre shall maintain and extend such cooperation and support the implementation of quality assessment schemes [1].
External quality assessment (EQA) is a part of quality management systems and evaluates performance of laboratories by an external evaluator on material that is supplied specifically for the purpose.
ECDC's disease-specific networks organise a series of EQAs for EU/EEA countries. The aim of an EQA is to identify needs of improvement in laboratory diagnostic capacities relevant to epidemiological surveillance of communicable diseases as in the Decision No 1082/2013/EU [2], and to ensure the reliability and comparability of results in laboratories from all EU/EEA countries.
The main objectives of EQA schemes include:
assessment of the general standard of performance (‘state of the art’) assessment of the effects of analytical procedures (method principle, instruments, reagents, calibration) evaluation of individual laboratory performance identification and justification of problem areas providing continuing education identification of needs for training activities.
In 2012, a framework service contract on ‘Microbiological characterisation services to support surveillance of Salmonella, STEC/VTEC and Listeria infections’ for the period 2012–2016 was put out to tender by ECDC. The unit of Foodborne Infections at Statens Serum Institut in Denmark won the three lots covering Salmonella, Shiga toxin/verocytotoxin-producing Escherichia coli (STEC/VTEC) and Listeria monocytogenes. The contract for lot 1 (Salmonella) covers the organisation of an EQA exercise for PFGE and MLVA of Salmonella spp., reference material service for MLVA-typing of S. Typhimurium, and molecular typing services. The present report presents the results of the third EQA-exercise of this contract (Salmonella EQA-6).
1.2 Surveillance of salmonellosis
Salmonellosis is the second most commonly reported zoonotic disease in EU with a total of 82 694 salmonellosis cases reported by the 27 EU Member States in 2013 (EU notification rate 20.4 cases per 100 000 population). Salmonella is a common cause of foodborne outbreaks and in the EU, Salmonella is the most frequently detected causative agent in foodborne outbreaks reported to ECDC and the European Food Safety Authority (EFSA) (22.5 % of outbreaks in 2013, corresponding to 1 168 outbreaks. [3]
Since 2007, ECDC’s Programme on Food- and Waterborne Diseases and Zoonoses (FWD) has been responsible for the EU-wide surveillance of salmonellosis, including the facilitation of the detection and investigation of foodborne outbreaks. One of the key objectives for the FWD programme is improving and harmonising the surveillance system in the EU in order to increase the scientific knowledge regarding aetiology, risk factors and burden of food- and waterborne diseases and zoonoses. The surveillance data, including some basic typing parameters for the isolated pathogen, are reported by the Member States to TESSy. Besides this basic characterisation of the pathogens isolated from infections, there is a public health value of using more advanced and more discriminatory typing techniques for surveillance of foodborne infections. Therefore, in 2012, ECDC initiated a pilot project on enhanced surveillance through incorporation of molecular typing data (‘molecular surveillance’) with three selected FWD pathogens: Salmonella, Listeria monocytogenes, and Shiga toxin/verocytotoxin-producing Escherichia coli (STEC/VTEC). The overall goals of integrating molecular typing in EU level surveillance are:
to foster rapid detection of dispersed international clusters/outbreaks to facilitate the detection and investigation of transmission chains and relatedness of strains across Member
States and contribution to global investigations to detect emergence of new evolving pathogenic strains to support investigations to trace-back the source of an outbreak and to identify new risk factors to aid in studying the characteristics of a particular pathogen and its behaviour in a community of hosts.

TECHNICAL REPORT Sixth EQA scheme for Salmonella typing
3
The molecular typing surveillance gives Member State users access to EU-wide molecular typing data for the included pathogens. It also gives the opportunity to perform cluster searches and analyses of the EU level data to
determine whether isolates characterised by molecular typing at the national level(s) are part of a multinational cluster that may require cross-border response collaboration.
Since 2009, the ECDC Food- and Waterborne Programme has supported EQA schemes for serotyping and antimicrobial resistance testing for Salmonella and VTEC. These EQA schemes have contributed to strengthen the laboratory capacity in Member States and EEA countries to provide reliable and valid data for surveillance and research. As mentioned above, ECDC is now extending its centralised data collection capabilities to include detailed molecular typing data for surveillance of selected pathogens. The technical platform to support this will be molecular typing databases within TESSy. To ascertain that the molecular typing data entered into the surveillance databases is of sufficiently high quality, expert support and EQA schemes covering these methods are needed. Therefore, from 2012, ECDC FWD Programme supported EQA schemes will focus on expert support for molecular typing, namely Pulsed Field Gel Electrophoresis (PFGE) and Multiple-Locus Variable-number tandem repeat analysis (MLVA) of Salmonella, PFGE of Shiga toxin/verocytotoxin -producing Escherichia coli (STEC/VTEC) and L. monocytogenes, and also includes quality assurance activities for virulence gene detection, phage typing and serotyping of the selected pathogens. The EQA schemes were targeted to the national reference level laboratories that were expected to already be performing the molecular surveillance at the national level.
1.3 Objectives of the EQA-6 scheme
1.3.1 Pulsed Field Gel Electrophoresis typing
The objective of the EQA-6 was to assess the quality of the standard PFGE molecular typing and comparability of the collected test results between participating laboratories and countries. The exercise focused on the production of raw PFGE gels of high quality, normalisation of PFGE images and interpretation of the final results.
1.3.2 Multiple-Locus Variable number of tandem repeats Analysis typing of Salmonella Typhimurium
The aim of the EQA-6 was to determine and ensure the quality and integrity of the S. Typhimurium MLVA results in each participating laboratory. The EQA covers both the laboratory procedure and the correct data analysis (calibration of raw data into MLVA profiles according to the nomenclature).
Sixth EQA scheme for Salmonella typing TECHNICAL REPORT
4
2. Study design
2.1 Organisation
The Salmonella EQA-6 was funded by ECDC and arranged by Statens Serum Institut (SSI) according to the International Standard ISO/IEC 17043:2010 [4]. The EQA-6 was conducted from October 2014 through March 2015. The EQA-6 included PFGE (different serotypes) and MLVA (Typhimurium).
Invitations were emailed to the ECDC contact points in the FWD-Net (31 countries) on the 3 September 2014. In addition, invitations were circulated to EU candidate countries; Albania, Serbia, Montenegro, the former Yugoslav Republic of Macedonia, and Turkey by the ECDC coordinator.
Twenty–nine public health national reference laboratories in EU/EEA and EU candidate countries accepted the invitation to participate, however three laboratories later communicated that they were not able to perform the tests. Therefore, a total of 26 laboratories are included in the result tables. The list of participants is presented in Annex 1. The EQA test-strains were sent to the participating laboratories on the 9 of October 2014. The participants were asked to submit their results through e-mail and/or online submission in google docs forms by the 14 of January 2015.
2.2 Selection of strains
Strains were selected for the EQA-6 programme based on the following criteria: a) they should represent commonly reported strains in Europe; b) they should remain stable during the preliminary testing period in the organising laboratory. SSI tested 38 strains and 20 of these were selected. The 10 strains for the PFGE part were selected based on their PFGE profiles, both ‘easy’ strains without difficult double bands and strains which were very similar were chosen. A variety of different serotypes relevant for the epidemiological situation in Europe were selected, including three recent outbreak strains of serovars Typimurium, Mikawasima and Agona (Table 1). For the MLVA part, 10 S. Typhimurium strains were selected to cover common MLVA profiles. Five strains from the EQA-5 were included in this year’s EQA (see comment in Table 1). The characteristics of the 20 Salmonella test-strains used in the EQA-6 are listed as ‘original’ together with the participants’ results in the tables (Annex 2, 5, and 6).
Table 1. Number and serotypes of the EQA-6 test strains
Method No of test strains Serotypes
PFGE 10 Poona, Infantis, Enteritidis, Mikawasima, O:4,5,12;H:i:-, Typhimurium, Agona, Hadar, Stanley, Manhattan*
MLVA 10 Typhimurium *
*Included strains from EQA-4 and EQA-5.Two strains (serovars Infantis and Poona) in the PFGE part, strain 1 and 10 identically with strain 2 and 8 EQA-5 and three strains in the MLVA part, strain 15,16 and 18 same allelic profiles as strain 16, 14 and 20 EQA-5.
In addition to the 20 test strains, laboratories participating in the EQA for MLVA could request the set of 33 reference strains used for normalisation of the MLVA analysis (Annex 7) and the PFGE reference strain S. Branderup H9812.
2.3 Carriage of strains
By the beginning of October, all strains were blinded and packed according to the International Standard ISO/IEC 17043:2010 [4] ‘Conformity assessment – General requirements for proficiency testing’. The parcels were shipped from SSI labelled as UN 3373 Biological Substance, Category B.
The participants received their specific blinded strain numbers by e-mail as an extra control. No participant reported damage to the shipment or errors in the specific strain numbers.
On the 20 October 2014, instructions on how to submit results were e-mailed to participants. This included an Excel sheet for calculating the MLVA alleles, and links to the online submission form1. Zip files for the BioNumerics (BN) database including correct experiment settings (PFGE part) and protocol including guidelines on how to export XML files from BN version 6.0 and 7.1 (Annex 8 and 9) were also included. In addition, both protocol and BN databases were placed in google documents and a Dropbox account for the participants to download.
1 Submission of results EQA-6 Salmonella 2014-2015 online form. Available here:
https://docs.google.com/forms/d/1Efmx5pV6UGJBdt6uZmcsppwYy72t9vcyffnKEAsRDJU/viewform?c=0&w=1&usp=mail_form_link.

TECHNICAL REPORT Sixth EQA scheme for Salmonella typing
5
2.4 Testing
In the PFGE part, 10 Salmonella strains representing a variety of serotypes were tested and participants could either take part in the laboratory part only (submit the PFGE gel) or also take part in the additional analysis of the gel (submit normalised profiles with assigned bands). For the laboratory procedures, the participants were instructed to use the protocol Standard PulseNet Salmonella PFGE -One-Day (24-28 h) Standardised Laboratory Protocol for Molecular Subtyping of Escherichia coli O157:H7, Salmonella serotypes, Shigella sonnei, and Shigella flexneri by Pulsed Field Gel Electrophoresis (PFGE) [5].
For the gel analysis, laboratories were instructed to use the distributed database and analyse the PFGE gel in BN, including normalisation and band assignment. Submission of results involved emailing the PFGE image either as TIFF file alone or as XML export files of the BN analysis.
In the MLVA part, 10 S. Typhimurium strains were tested to assess the participants’ ability to obtain the true number of repeats in each of the five MLVA loci. The participants were instructed to use the Standard protocol for S. Typhimurium MLVA Laboratory standard operating procedure for MLVA of Salmonella enterica serotype Typhimurium (ECDC, 2011) [6]. An attached Excel sheet could be used to convert obtained fragment sizes to true allele numbers based on the results obtained for the 33 reference strains. The MLVA profiles (alleles) were submitted in the online submission form or included in the XML-export file (with the PFGE analysis).
2.5 Data analysis
When the results from the laboratories were received, the PFGE and MLVA results were added to a dedicated Salmonella EQA-6 BN database at SSI. In the case of PFGE gel quality, the gel was evaluated according to a modified version of the ECDC Food and Waterborne Disease MolSurv Pilot - SOPs 1.0 - Annex 6 - PulseNet US protocol PFGE Image Quality Assessment (TIFF Quality Grading Guidelines 2014 - Annex 3) by scoring the gel according to seven parameters (scores in the range 1–4, 4 being the top score). The score of 1 - ‘Poor’ – is a category which clearly shows that the gel is not usable for inter-laboratory comparison. The BN analysis was evaluated according to BioNumerics Gel Analysis Quality Guidelines 2014 (Annex 4). BN analysis was graded with respect to five parameters (scores in the range 1–3, 3 being the top score). The MLVA results were scored as correct/accepted or incorrect for each strain and the percentage of correct answers was used as the score for each participant.

Sixth EQA scheme for Salmonella typing TECHNICAL REPORT
6
3. Results
3.1 Participation
The laboratories could choose to take part in the full scheme or only participate in one part. Of the 26 participants, 25 laboratories (96%) participated in the PFGE part and 54% performed MLVA typing. Thirteen laboratories (50%)
completed both parts of the EQA (Table 2).
Table 2. Number of FWD-Net laboratories submitting results for each method†
Methods PFGE MLVA PFGE and MLVA
TIFF XML
Number of participants 25 17 14 13
% of participants 96 68* 54 50
†Twenty-five laboratories participated in at least one method. *out of the 25 participants in the TIFF
3.2 Pulsed Field Gel Electrophoresis Twenty-five laboratories participated in the PFGE by submitting raw gel images (TIFF files). Seventeen of these laboratories had also analysed the gel by using the BN software and submitted the results as an XML-file.
3.2.1 Gel quality
The average score and the percentage of laboratories obtaining scores 1–4 in the seven TIFF Quality Grading Guidelines parameters is presented in Table 3. All the participant’s Gel Quality scores are listed in Annex 5.
The gels were graded according to the TIFF Quality Grading Guidelines (Annex 3), where seven parameters are used for the grading. A sufficient quality that enabled profile detection and inter-laboratory comparison requires the score of at least 2- ‘Fair’ for each parameter. A low quality score 1 (‘Poor’) in just one category has a high impact on the ability to further analyse the image and makes it impossible to compare the profiles with those obtained in other laboratories.
For four parameters, ‘Cell suspension’, ‘Lanes’, ‘Restriction’ and ‘DNA degradation,’ a high average score above 3.5, (from ‘Good’ to ‘Excellent’) was obtained, and more than 80% of the participating laboratories scored 4 (‘Excellent’) to ‘Cell suspension’, ‘Lanes’ and ‘Restriction’. A parameter ‘Image acquisition and running conditions’ had an average score of 3 (‘Good’) (Table 3).
The two parameters ‘Bands’ and ‘Gel background’ had an average score below 3 (from ‘Fair’ to ‘Good’).
Table 3. Results of PFGE gel quality for 25 participating laboratories
Parameters 1 - Poor 2 - Fair 3 - Good 4 - Excellent Average
Image acquisition and running conditions 8% 32% 16% 44% 3.0
Cell suspension 0% 0% 4% 96% 4.0
Bands 28% 24% 20% 28% 2.5
Lanes 0% 8% 12% 80% 3.7
Restriction 8% 4% 0% 88% 3.7
Gel background 0% 44% 20% 36% 2.9
DNA degradation 8% 12% 4% 76% 3.5
Particularly for the parameter ‘Bands,’ participating laboratories obtained very diverse scores (Table 3). Seven laboratories (28 %) obtained the score 4 (‘Excellent’) but other seven laboratories scored 1 (‘Poor’). Five of the participants with the lowest score for the parameter ‘Bands’ were also scored 1 (‘Poor’) in at least one other parameter.
TECHNICAL REPORT Sixth EQA scheme for Salmonella typing
7
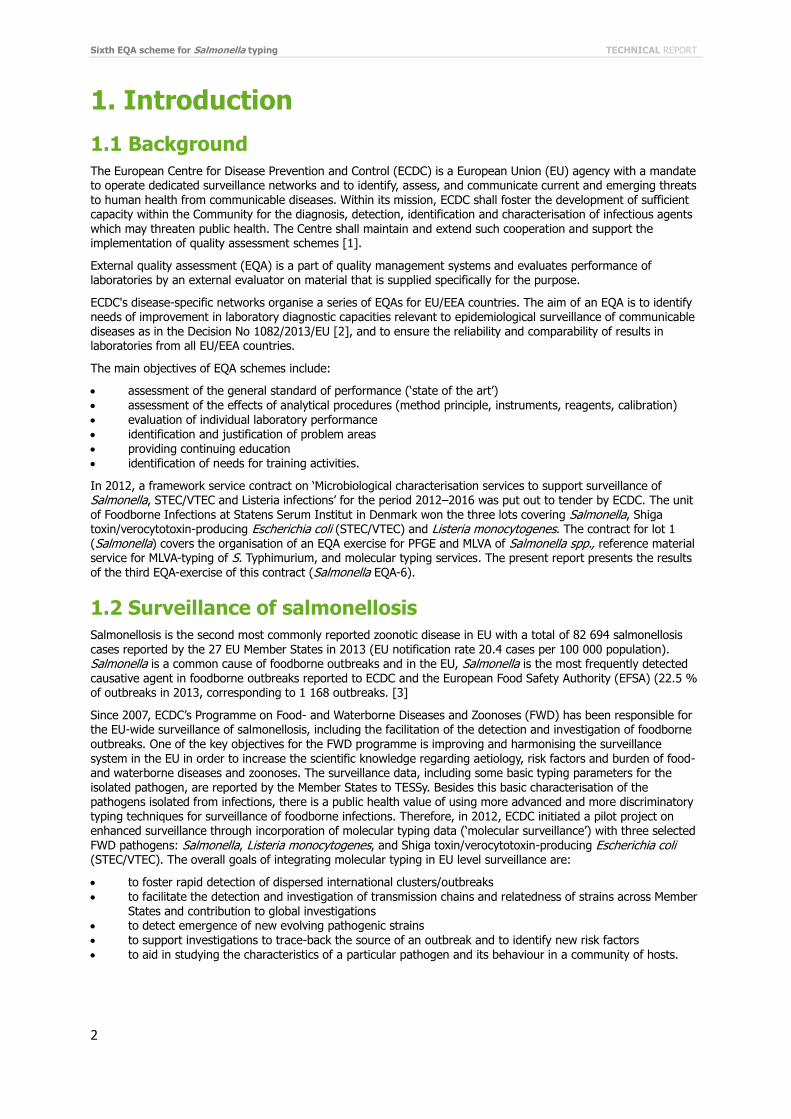
Figure 1. A gel scoring ‘Poor’ in ‘Image acquisition and Running Conditions’ and ´Bands´
A B
Figure 1A shows the actual gel image and Figure 1B is a view of the normalisation in BioNumerics. The gel is scored as ‘Poor’ (1) in the parameter ‘Image acquisition and Running Conditions’ due to the difficulties when normalising the gel in BioNumerics. This is caused by incorrect running conditions compared to the PulseNet International protocol. The very fuzzy bands make it difficult to assign bands correctly in BN and compare with the reference band position which also makes normalisation difficult. The bad normalisation leads to the inability to compare results with other laboratories.
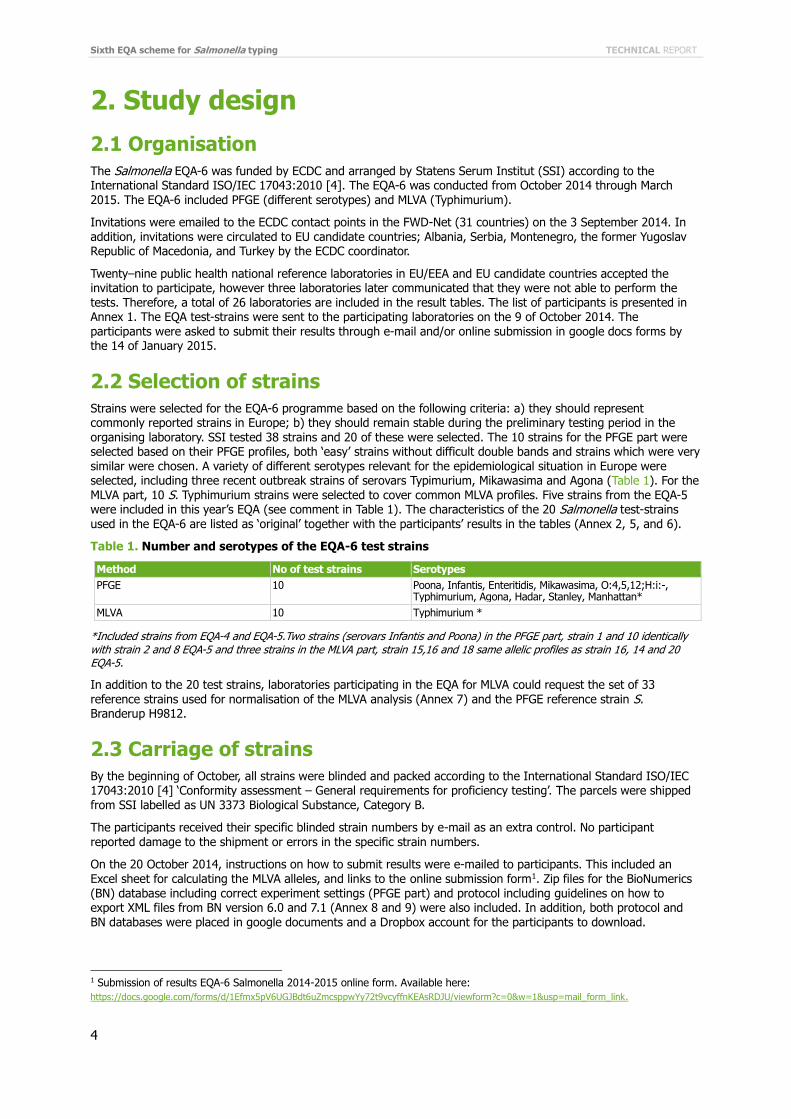
Figure 2. A gel scoring ‘Poor’ in the parameter ‘Bands’ and ‘Restriction´
The gel shown in Figure 2 scored ‘Poor’ (1) in the parameter ‘Bands’ and ‘Restriction’. The low score is due to thick and fuzzy bands and many shadow bands in a several lanes, making the separation and analysis of bands difficult.
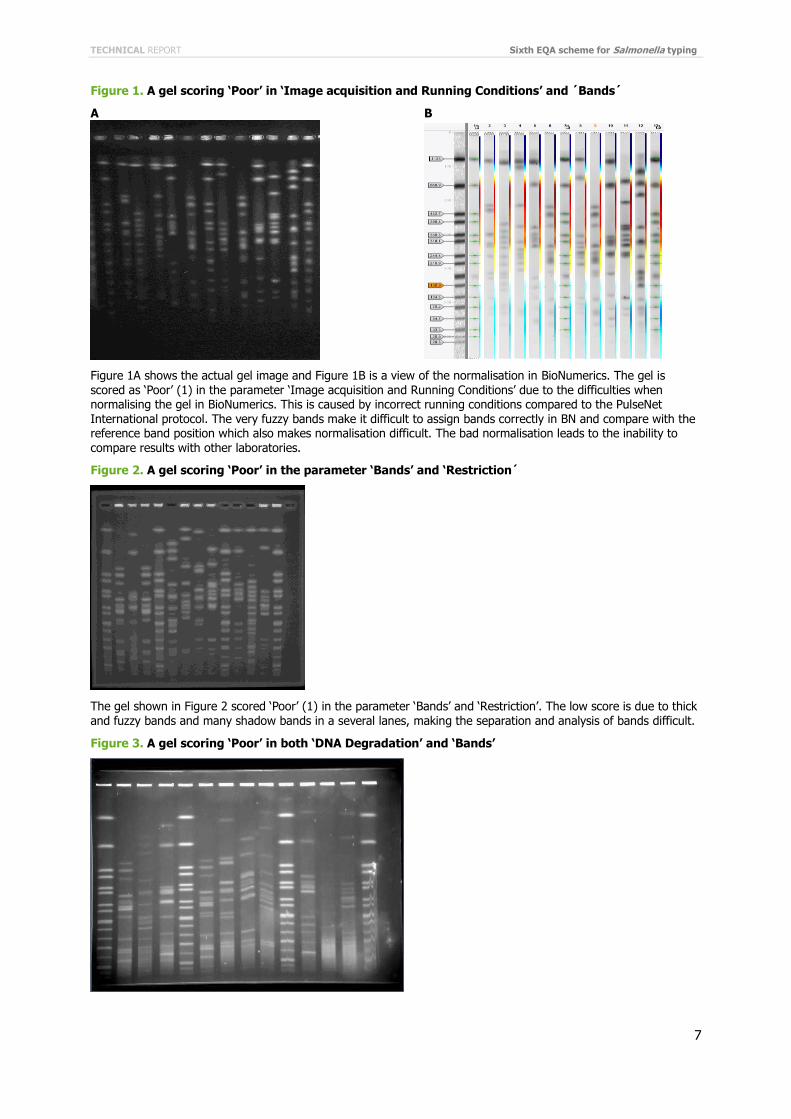
Figure 3. A gel scoring ‘Poor’ in both ‘DNA Degradation’ and ‘Bands’
Sixth EQA scheme for Salmonella typing TECHNICAL REPORT
8
The gel shown in Figure 3 scored ‘Poor’ (1) in the parameters ‘DNA Degradation’ and ‘Bands’. The score ‘Poor’ in the parameter ‘DNA Degradation’ is due to smearing in serval lanes. This makes bands difficult or impossible to
define. The score ‘Poor’ in the parameter ‘Bands’ is due to band distortion in many lanes. This could result in incorrect band assignment.
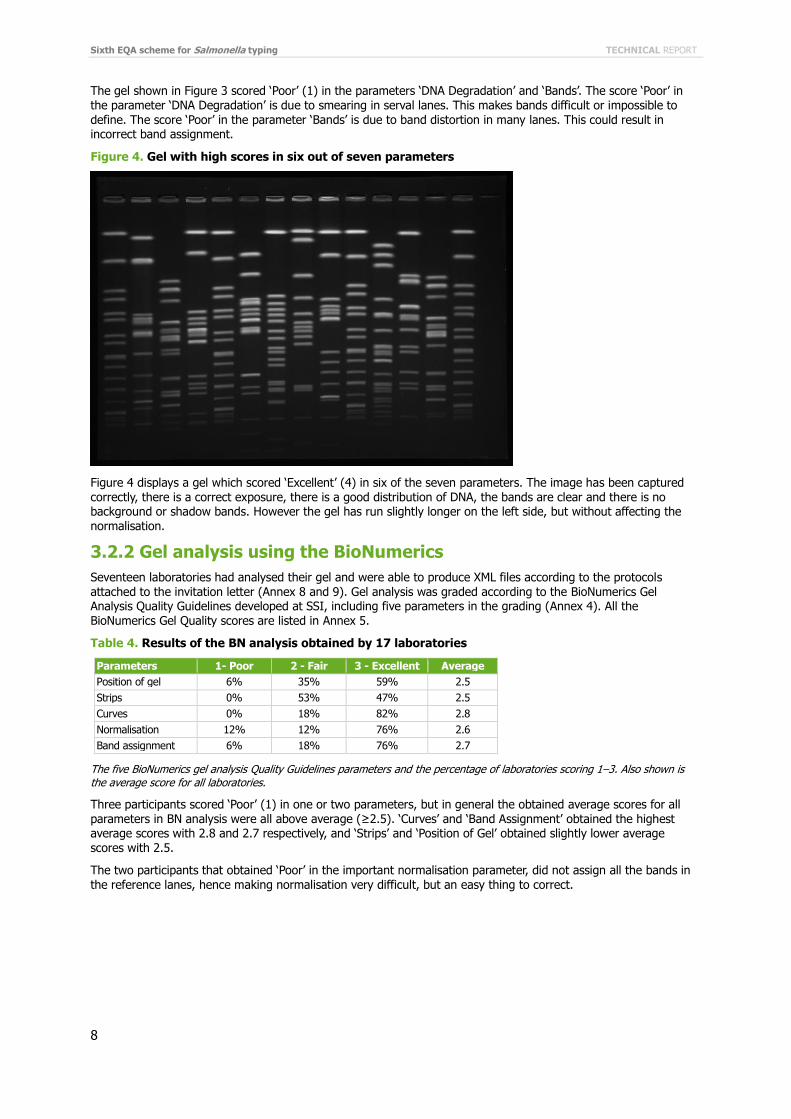
Figure 4. Gel with high scores in six out of seven parameters
Figure 4 displays a gel which scored ‘Excellent’ (4) in six of the seven parameters. The image has been captured correctly, there is a correct exposure, there is a good distribution of DNA, the bands are clear and there is no background or shadow bands. However the gel has run slightly longer on the left side, but without affecting the normalisation.
3.2.2 Gel analysis using the BioNumerics
Seventeen laboratories had analysed their gel and were able to produce XML files according to the protocols
attached to the invitation letter (Annex 8 and 9). Gel analysis was graded according to the BioNumerics Gel Analysis Quality Guidelines developed at SSI, including five parameters in the grading (Annex 4). All the BioNumerics Gel Quality scores are listed in Annex 5.
Table 4. Results of the BN analysis obtained by 17 laboratories
Parameters 1- Poor 2 - Fair 3 - Excellent Average
Position of gel 6% 35% 59% 2.5
Strips 0% 53% 47% 2.5
Curves 0% 18% 82% 2.8
Normalisation 12% 12% 76% 2.6
Band assignment 6% 18% 76% 2.7
The five BioNumerics gel analysis Quality Guidelines parameters and the percentage of laboratories scoring 1–3. Also shown is the average score for all laboratories.
Three participants scored ‘Poor’ (1) in one or two parameters, but in general the obtained average scores for all parameters in BN analysis were all above average (≥2.5). ‘Curves’ and ‘Band Assignment’ obtained the highest average scores with 2.8 and 2.7 respectively, and ‘Strips’ and ‘Position of Gel’ obtained slightly lower average scores with 2.5.
The two participants that obtained ‘Poor’ in the important normalisation parameter, did not assign all the bands in the reference lanes, hence making normalisation very difficult, but an easy thing to correct.
TECHNICAL REPORT Sixth EQA scheme for Salmonella typing
9
3.3 Multiple-Locus Variable number of tandem repeats Analysis
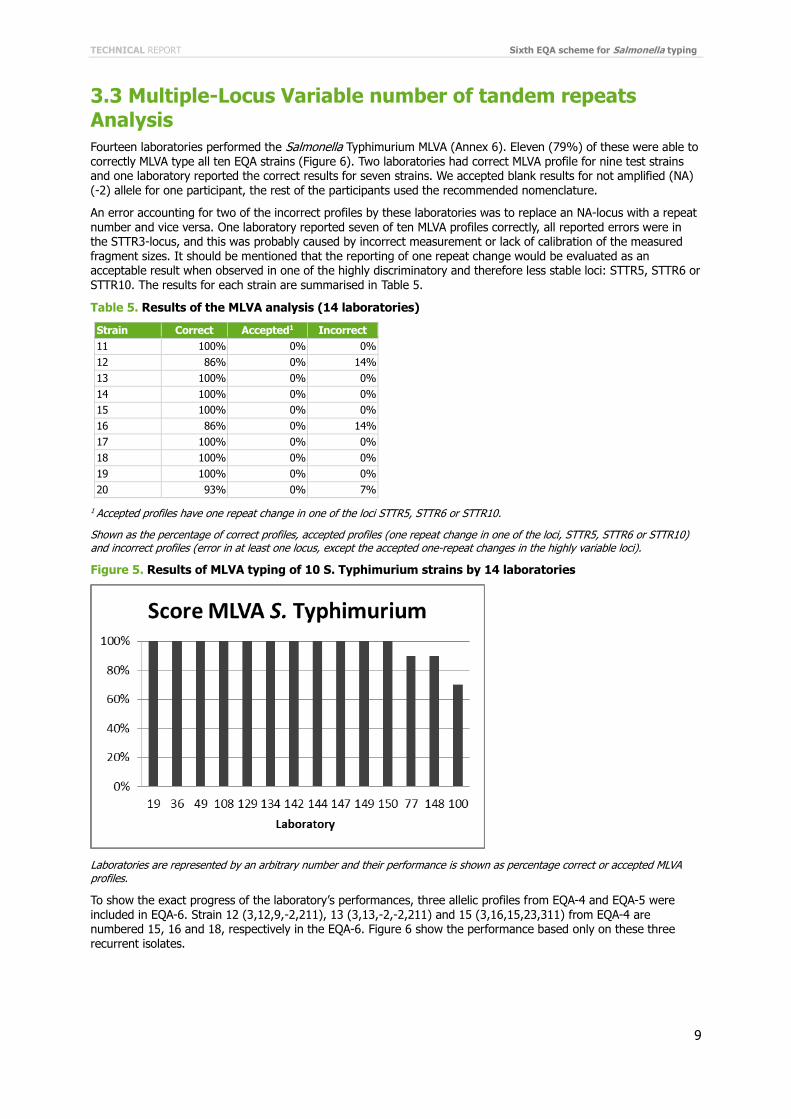
Fourteen laboratories performed the Salmonella Typhimurium MLVA (Annex 6). Eleven (79%) of these were able to correctly MLVA type all ten EQA strains (Figure 6). Two laboratories had correct MLVA profile for nine test strains and one laboratory reported the correct results for seven strains. We accepted blank results for not amplified (NA) (-2) allele for one participant, the rest of the participants used the recommended nomenclature.
An error accounting for two of the incorrect profiles by these laboratories was to replace an NA-locus with a repeat number and vice versa. One laboratory reported seven of ten MLVA profiles correctly, all reported errors were in the STTR3-locus, and this was probably caused by incorrect measurement or lack of calibration of the measured fragment sizes. It should be mentioned that the reporting of one repeat change would be evaluated as an acceptable result when observed in one of the highly discriminatory and therefore less stable loci: STTR5, STTR6 or STTR10. The results for each strain are summarised in Table 5.
Table 5. Results of the MLVA analysis (14 laboratories)
Strain Correct Accepted1 Incorrect
11 100% 0% 0%
12 86% 0% 14%
13 100% 0% 0%
14 100% 0% 0%
15 100% 0% 0%
16 86% 0% 14%
17 100% 0% 0%
18 100% 0% 0%
19 100% 0% 0%
20 93% 0% 7%
1 Accepted profiles have one repeat change in one of the loci STTR5, STTR6 or STTR10.
Shown as the percentage of correct profiles, accepted profiles (one repeat change in one of the loci, STTR5, STTR6 or STTR10) and incorrect profiles (error in at least one locus, except the accepted one-repeat changes in the highly variable loci).
Figure 5. Results of MLVA typing of 10 S. Typhimurium strains by 14 laboratories
Laboratories are represented by an arbitrary number and their performance is shown as percentage correct or accepted MLVA profiles.
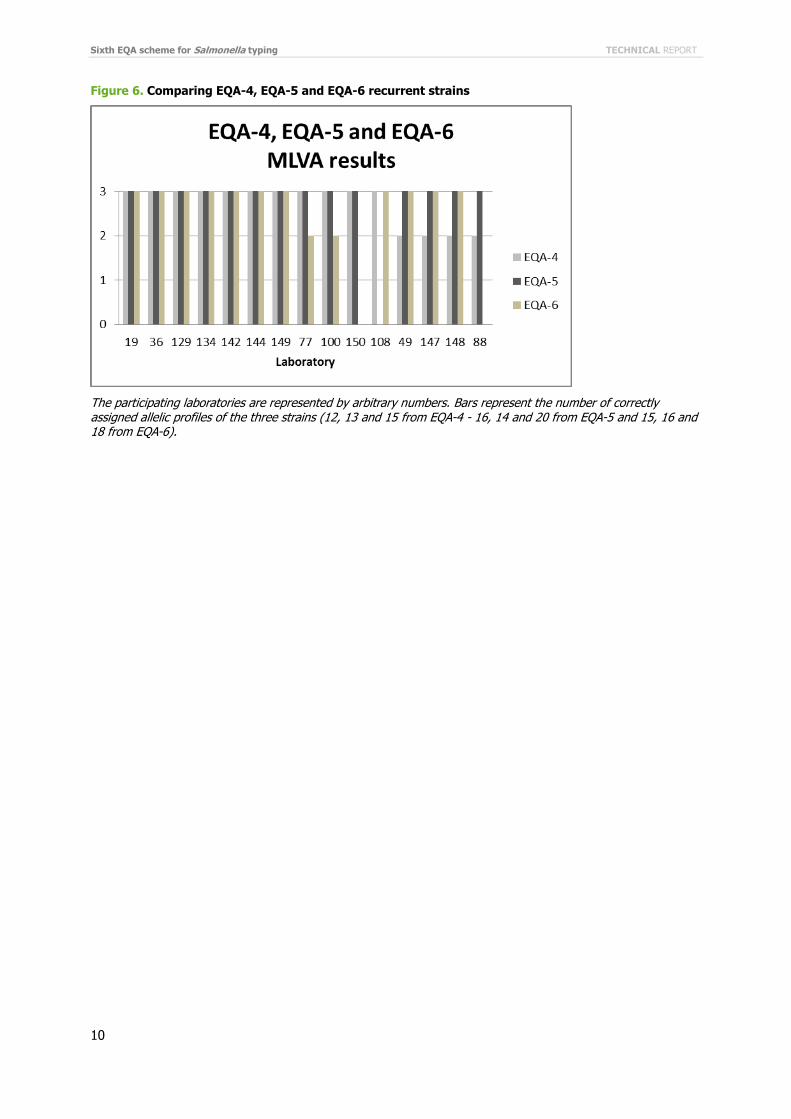
To show the exact progress of the laboratory’s performances, three allelic profiles from EQA-4 and EQA-5 were included in EQA-6. Strain 12 (3,12,9,-2,211), 13 (3,13,-2,-2,211) and 15 (3,16,15,23,311) from EQA-4 are numbered 15, 16 and 18, respectively in the EQA-6. Figure 6 show the performance based only on these three recurrent isolates.
Sixth EQA scheme for Salmonella typing TECHNICAL REPORT
10
Figure 6. Comparing EQA-4, EQA-5 and EQA-6 recurrent strains
The participating laboratories are represented by arbitrary numbers. Bars represent the number of correctly assigned allelic profiles of the three strains (12, 13 and 15 from EQA-4 - 16, 14 and 20 from EQA-5 and 15, 16 and 18 from EQA-6).
TECHNICAL REPORT Sixth EQA scheme for Salmonella typing
11
4. Conclusions
A total of 26 laboratories participated in at least one part of the EQA-6: 25 laboratories (96%) produced PFGE (TIFF) results, 17 laboratories (65%) performed the BioNumerics analysis in addition, and 14 laboratories (54%) produced MLVA results. Thirteen laboratories (50%) completed both parts of the EQA.
PFGE is still the gold standard for high discriminatory typing of Salmonella and the only generic molecular method for typing of all Salmonella serovars. The majority (72%) of the laboratories were able to produce a PFGE gel of sufficiently high quality to allow the profiles to be compared with profiles obtained by other laboratories. The comparability of profiles between laboratories primarily relies on the use of correct running conditions, good quality image acquisition, and distinct bands. The subsequent normalisation and interpretation of the profiles were performed using the specialised software BioNumerics. Seventeen laboratories (68% of the participants in PFGE part) did this analysis of their gel and generally this was performed in accordance with the guidelines.
MLVA for typing of S. Typhimurium is a fairly new method that has been increasingly used over the last decade as it is a fast, low-cost method that gives a high discrimination within one of the most prevalent Salmonella serovars. Considering MLVA has been an internationally recognised method for only a few years, and the need for access to specialised equipment (capillary electrophoresis), it is promising that almost half of the laboratories choose to participate in the MLVA EQA. Although the interpretation of MLVA data is simpler and less prone to subjective interpretation than the band-based PFGE profiles, it is important to calibrate (‘normalise’) the measured fragment sizes to obtain inter-laboratory comparability of MLVA results. The results indicate that all but one of the 14 participants (93%) had calibrated the raw data correctly. Only one participant did not use the agreed nomenclature; we believe the reminder in the online form and in the protocol helped. Eleven laboratories (79%) reported correct MLVA profiles for all strains and 13 (93%) found the correct profile for at least nine of the ten strains. The errors were probably due to minor problems with the laboratory procedures, which should be possible to overcome by optimising the procedure in each laboratory.
This EQA-6 scheme for typing of Salmonella is the third EQA specifically organised for laboratories participating in FWD-Net that includes molecular typing methods. The large number of participating laboratories as well as their performance in the EQA is encouraging. The molecular surveillance system that has been implemented as part of TESSy (TESSy-MSS) relies on the capacity of the FWD-Net laboratories to produce comparable typing results. At the moment, the molecular typing methods used for EU-wide surveillance are PFGE for all serovars and MLVA for Typhimurium. This third EQA for molecular typing demonstrates that the majority of participating laboratories were able to produce good and comparable typing results. In the PFGE part, only 28% (TIFF) and 18% (BN) of the laboratories produced results that need to be improved for inter-laboratory exchange of data; in the MLVA part only three laboratories produced results that need to be improved for inter-laboratory exchange. However, for the majority of the identified issues, an acceptable quality is within reach by optimisation of procedures in laboratories, trouble-shooting assistance, and training.

Sixth EQA scheme for Salmonella typing TECHNICAL REPORT
12
5. Discussion
5.1 Pulsed Field Gel Electrophoresis
Twenty-five laboratories participated in the PFGE part of the EQA-6. All laboratories were able to produce a PFGE gel and generate an image of the gel (TIFF file). The gel quality was assessed according to the TIFF Quality Grading Guidelines which involve evaluation of a gel by seven parameters. The majority of the laboratories (72%) were able to produce gels with sufficiently high quality for all seven parameters. In the four parameters ‘Image Acquisition and Running Conditions’, ‘Bands’, ‘Restriction’ and ‘DNA Degradation’ a few laboratories were given the lowest score of ‘Poor’ (1). In general, capturing the image of the gel is a critical step in obtaining a good TIFF image, and this parameter ‘Image Acquisition and Running Conditions’ increased in average score from 2.5 to 3.0 compared to EQA-5. Unfortunately, there were a relatively high number of participants (28%), compared with last year (14%), that scored ‘Poor’ (1) in the parameter ‘Bands’. Two of the laboratories scoring ‘Poor’ in the parameter ‘Bands’ were new participants in this EQA compared with EQA-5. The low scores obtained this year were primarily due to fuzzy bands on the gels. This problem can be caused by mistakes in almost every step in the protocol, and so the participants are encouraged to go through the protocol minutely and evaluate the individual steps. Furthermore, it is important to use running conditions as described for the relevant organism as these vary significantly between species. It is also important to have equipment that is running properly as well as making sure that the running temperature is as described in protocol. Other common deviations from protocol were seen in image acquisition, where some laboratories did not fill the whole image with the gel, did not include wells and did not leave 1 to 1.5 cm below the smallest band on the gel. This is less critical than using incorrect running conditions, but can still have major impact on the ability to assign bands correctly.
Sixty-eight percent of the laboratories that performed PFGE did the subsequent gel analysis, i.e. the normalisation and band assignment that provides the actual PFGE profiles for comparison. This analysis has to be done by the use of specialised software, BioNumerics, and some laboratories might not have access to it or limited experience in using BN databases for PFGE analysis. However, to be able to perform national surveillance as well as to submit profiles to the EU-wide TESSy-MSS, it is important to have the capacity to analyse and interpret the PFGE gels. Most of the 17 laboratories (82%) that submitted gel analysis data had performed this in accordance with the guidelines, and the increase observed last year (from 71% in EQA-4 to 82% in EQA-5) has levelled in this EQA-6.
5.2 Multiple-Locus Variable number of tandem repeats Analysis Fourteen laboratories participated in the MLVA part of the EQA, which consisted of ten strains of S. Typhimurium monophasic variants of this serovar. Of the 14 laboratories, 79% MLVA typed all strains correctly and 93% reported correct MLVA profiles for at least nine strains. There is a slight increase of participants typing all the strains correctly from 71% in EQA-5 to 79% in EQA-6.
Two of the five errors were related to missing the presence of a locus (reporting as absent allele (NA) where a fragment should have been detected) or vice versa, i.e. a false positive allele number for an absent locus. This can be due to the use of unbalanced primer mix resulting in very different peak heights and thereby either missing a peak or identifying background noise as a signal. Another explanation can be that the samples for capillary electrophoresis were overloaded, which can cause large peaks to pick up other primer dyes used in the mix and thereby be mistaken for a peak representing another locus. A common laboratory mistake is failure to add primers to one tube and therefore fail to detect a locus.
One laboratory accounted for the remaining three errors, however the laboratory did not have any errors in the EQA-5 so maybe they changed procedures. The problems with the MLVA analysis at this laboratory should be solved before continuing to use MLVA for external comparisons. In general, the number of errors decreased when
comparing EQA-4 to EQA-5 and even fewer errors were detected in EQA-6. Ninety-three percent of the participants were able to correctly assign 9 strains out of 10 in both EQA-5 and EQA-6, and this is an improvement compared with 87% in EQA-4. A comparison (Figure 7) of the three recurrent strains that were included in EQA-4, EQA-5 and EQA-6 shows the increase in correctly assigned strains from EQA-4 to EQA-5 (73% to 100%), and then a decrease to 86% in EQA-6. However, it should be kept in mind that the overall quality of all MLVA strains was highest in this EQA-6.

TECHNICAL REPORT Sixth EQA scheme for Salmonella typing
13
None of the MLVA EQA test strains had changed this year, however changes in the fast changing loci are unfortunately impossible to avoid and it is not possible to foresee when such changes will appear. The test strains
were passaged ten times and re-tested to check for stability before sending out. However, for a highly discriminatory method as MLVA, there is always a risk of changes in the profile during the transport and culturing taking place in the laboratories before testing. In general, changes only occur in the fast changing loci, STTR5, STTR6 and STTR10, and changes in these loci were therefore accepted when evaluating the results of this EQA. This implies a risk for higher scores than justified as some of the reported one-locus variants could be due to sub-optimal calibration of measured fragment sizes. However, no one locus variants were reported by the participants this year and so the high scores are real.
Sixth EQA scheme for Salmonella typing TECHNICAL REPORT
14
6. Recommendations
6.1 Laboratories
When evaluating the results obtained by the FWD-Net laboratories in this EQA, a number of technical issues that have an impact on the quality of typing results were identified. For each method, improvements of the performance can be expected to be achieved by a range of measures.
The quality of PFGE profiles is highly dependent on application of very controlled laboratory procedures. Therefore, laboratories should optimise their performance by strictly adhering to the detailed protocol. It might be tempting to make a few shortcuts in some steps, but high quality is dependent upon small details such as using the described temperatures, times, number of repeated washing steps, etc. Deviations from the protocol should be avoided unless thoroughly evaluated in each laboratory and certain elements have to be exactly as described in the protocol, especially the electrophoresis conditions including temperature and switch times. It should be noted that, although many steps are similar for different organisms, important species specific differences occur. Several laboratories probably produced a high quality gel, but failed to document this due to sub-optimal staining, de-staining and image capturing. It is therefore highly recommended to take the time to get familiar with the image
acquisition equipment and ensure maintenance check of this as well as the electrophoresis equipment. There were still some laboratories had difficulties in creating and sending XML files of the PFGE results and keeping track on numbering.
Fifty-four percent of the laboratories participated in the MLVA exercise, and the results indicate that a few of these laboratories are probably not using this method routinely and they could benefit from getting more experience by regular use of the method. Most of the rather minor mistakes made can probably be attributed to lack of optimisation of the procedures in each laboratory, e.g. primer mix for the multiplex PCR reaction and the load of DNA in samples for capillary electrophoresis.
6.2 ECDC and FWD-Net
The PFGE part of the EQA-6 had a high participation rate and many laboratories were able to produce fairly good gels. However, only 68% of these laboratories were capable of performing the data analysis part, which indicates that there is still a need for capacity building in the area of gel analysis and interpretation by the use of BioNumerics.
Half of the participants in the EQA-6 took part in the MLVA exercise and some of them have probably not implemented this method as a routine, so there is a potential for much more use of MLVA for typing of Typhimurium, the second most common serovar after Enteritidis in Europe. To further support the Salmonella surveillance at EU level, validation and the preparation of the laboratory standard operating procedure for the MLVA of S. Enteritidis is ongoing. For new laboratories wishing to take up this method as well as some of the less experienced laboratories, a training course might be the way to increase the capacity across Europe. No training courses specifically for MLVA typing have previously been provided for the FWD-Net laboratories.
6.3 The EQA provider
The separation of the deadlines in the EQA-6 gave the EQA provider more time to finish the evaluation reports which is important since the evaluation of results needs to be done individually and cannot be automated due to the visual evaluation of the PFGE gels and analysis. Furthermore, individual feedback and trouble-shooting regarding the molecular methods are part of the task for the organiser of this EQA. This can be quite time consuming and therefore the organisers should reserve time for this.

TECHNICAL REPORT Sixth EQA scheme for Salmonella typing
15
References
1. Regulation (EC) no 851/2004 of the European Parliament and of the Council of 21 April 2004 establishing a European
Centre for Disease Prevention and Control, Article 5.3. Available at:
http://ecdc.europa.eu/en/aboutus/Key%20Documents/0404_KD_Regulation_establishing_ECDC.pdf
2. Decision No 1082/2013/EU of the European Parliament and the Council 22 October 2013 on serious cross-border
threats to health. Available at:
http://ec.europa.eu/health/preparedness_response/docs/decision_serious_crossborder_threats_22102013_en.pdf
3. EFSA and ECDC (European Food Safety Authority and European Centre for Disease Prevention and Control), 2015. The
European Union Summary Report on Trends and Sources of Zoonoses, Zoonotic Agents and Food-borne Outbreaks in
2013. EFSA Journal 2015;13(1):3991, 162 pp. doi:10.2903/j.efsa.2015.3991
4. International Organisation for Standardization. Conformity assessment – General requirements for proficiency testing.
ISO/IEC 17043:2010. http://www.iso.org/iso/catalogue_detail.htm?csnumber=29366.
5. Standard PulseNet Salmonella PFGE -One-Day (24-28 h) Standardized Laboratory Protocol for Molecular Subtyping of
Escherichia coli O157:H7, Salmonella serotypes, Shigella sonnei, and Shigella flexneri by Pulsed Field Gel
Electrophoresis (PFGE). Available at: http://www.pulsenetinternational.org/assets/PulseNet/uploads/pfge/PNL05_Ec-Sal-
ShigPFGEprotocol.pdf
6. European Centre for Disease Prevention and Control. Laboratory standard operating procedure for MLVA of Salmonella enterica serotype Typhimurium. Stockholm: ECDC; 2011. Available at:
http://ecdc.europa.eu/en/publications/Publications/1109_SOP_Salmonella_Typhimurium_MLVA.pdf
Sixth EQA scheme for Salmonella typing TECHNICAL REPORT
16
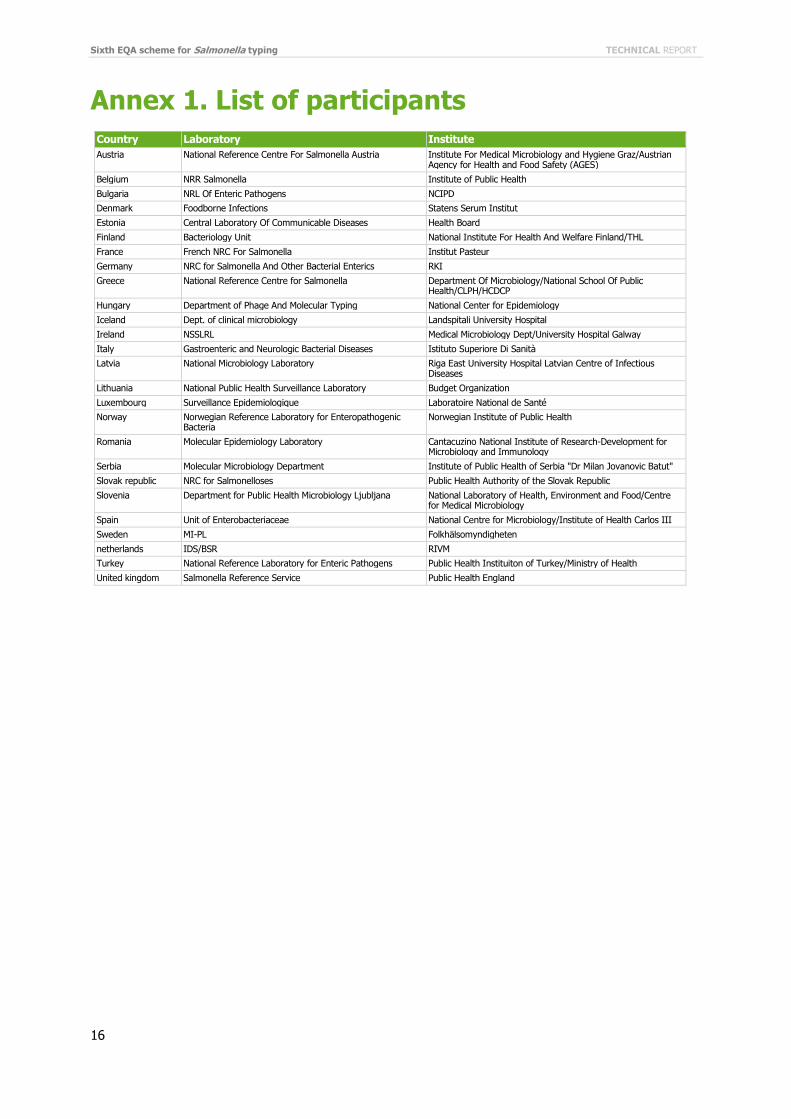
Annex 1. List of participants
Country Laboratory Institute
Austria National Reference Centre For Salmonella Austria Institute For Medical Microbiology and Hygiene Graz/Austrian Agency for Health and Food Safety (AGES)
Belgium NRR Salmonella Institute of Public Health
Bulgaria NRL Of Enteric Pathogens NCIPD
Denmark Foodborne Infections Statens Serum Institut
Estonia Central Laboratory Of Communicable Diseases Health Board
Finland Bacteriology Unit National Institute For Health And Welfare Finland/THL
France French NRC For Salmonella Institut Pasteur
Germany NRC for Salmonella And Other Bacterial Enterics RKI
Greece National Reference Centre for Salmonella Department Of Microbiology/National School Of Public Health/CLPH/HCDCP
Hungary Department of Phage And Molecular Typing National Center for Epidemiology
Iceland Dept. of clinical microbiology Landspitali University Hospital
Ireland NSSLRL Medical Microbiology Dept/University Hospital Galway
Italy Gastroenteric and Neurologic Bacterial Diseases Istituto Superiore Di Sanità
Latvia National Microbiology Laboratory Riga East University Hospital Latvian Centre of Infectious Diseases
Lithuania National Public Health Surveillance Laboratory Budget Organization
Luxembourg Surveillance Epidemiologique Laboratoire National de Santé
Norway Norwegian Reference Laboratory for Enteropathogenic Bacteria
Norwegian Institute of Public Health
Romania Molecular Epidemiology Laboratory Cantacuzino National Institute of Research-Development for Microbiology and Immunology
Serbia Molecular Microbiology Department Institute of Public Health of Serbia "Dr Milan Jovanovic Batut"
Slovak republic NRC for Salmonelloses Public Health Authority of the Slovak Republic
Slovenia Department for Public Health Microbiology Ljubljana National Laboratory of Health, Environment and Food/Centre for Medical Microbiology
Spain Unit of Enterobacteriaceae National Centre for Microbiology/Institute of Health Carlos III
Sweden MI-PL Folkhälsomyndigheten
netherlands IDS/BSR RIVM
Turkey National Reference Laboratory for Enteric Pathogens Public Health Instituiton of Turkey/Ministry of Health
United kingdom Salmonella Reference Service Public Health England

TECHNICAL REPORT Sixth EQA scheme for Salmonella typing
17
Annex 2. Examples of PFGE profiles
Profiles from the 25 participants in random order.
10
.00
20
.00
30
.00
40
.00
60
.00
80
.00
10
0.0
0
12
0.0
0
14
0.0
0
16
0.0
0
20
0.0
0
22
0.0
0
25
0.0
0
30
0.0
0
35
0.0
0
40
0.0
0
45
0.0
0
50
0.0
0
55
0.0
0
60
0.0
0
70
0.0
0
80
0.0
0
10
00
12
00
14
00
16
00
20
00
Salm 9
10
.00
20
.00
30
.00
40
.00
60
.00
80
.00
10
0.0
0
12
0.0
0
14
0.0
0
16
0.0
0
20
0.0
0
22
0.0
0
25
0.0
0
30
0.0
0
35
0.0
0
40
0.0
0
45
0.0
0
50
0.0
0
55
0.0
0
60
0.0
0
70
0.0
0
80
0.0
0
10
00
12
00
14
00
16
00
20
00
Salm 4
Sixth EQA scheme for Salmonella typing TECHNICAL REPORT
18
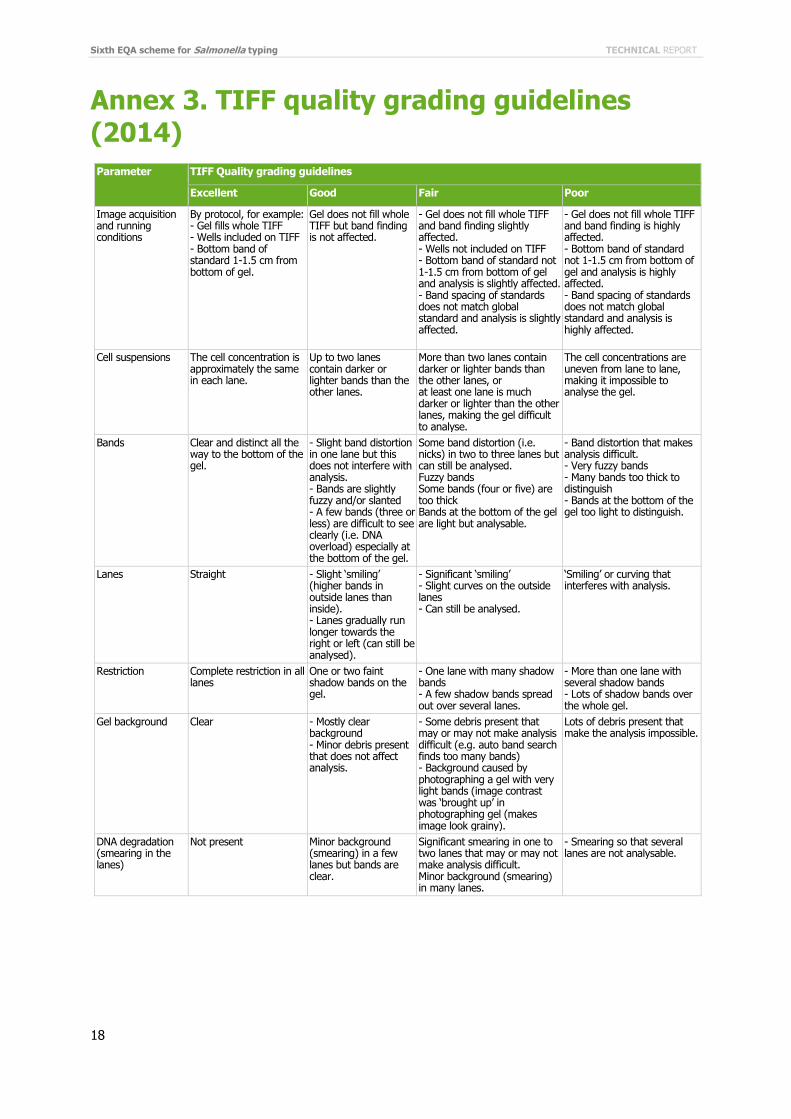
Annex 3. TIFF quality grading guidelines (2014)
Parameter TIFF Quality grading guidelines
Excellent Good Fair Poor
Image acquisition and running conditions
By protocol, for example: - Gel fills whole TIFF - Wells included on TIFF - Bottom band of standard 1-1.5 cm from bottom of gel.
Gel does not fill whole TIFF but band finding is not affected.
- Gel does not fill whole TIFF and band finding slightly affected. - Wells not included on TIFF - Bottom band of standard not 1-1.5 cm from bottom of gel and analysis is slightly affected. - Band spacing of standards does not match global standard and analysis is slightly affected.
- Gel does not fill whole TIFF and band finding is highly affected. - Bottom band of standard not 1-1.5 cm from bottom of gel and analysis is highly affected. - Band spacing of standards does not match global standard and analysis is highly affected.
Cell suspensions The cell concentration is approximately the same in each lane.
Up to two lanes contain darker or lighter bands than the other lanes.
More than two lanes contain darker or lighter bands than the other lanes, or at least one lane is much darker or lighter than the other lanes, making the gel difficult to analyse.
The cell concentrations are uneven from lane to lane, making it impossible to analyse the gel.
Bands Clear and distinct all the way to the bottom of the gel.
- Slight band distortion in one lane but this does not interfere with analysis. - Bands are slightly fuzzy and/or slanted - A few bands (three or less) are difficult to see clearly (i.e. DNA overload) especially at the bottom of the gel.
Some band distortion (i.e. nicks) in two to three lanes but can still be analysed. Fuzzy bands Some bands (four or five) are too thick Bands at the bottom of the gel are light but analysable.
- Band distortion that makes analysis difficult. - Very fuzzy bands - Many bands too thick to distinguish - Bands at the bottom of the gel too light to distinguish.
Lanes Straight - Slight ‘smiling’ (higher bands in outside lanes than inside). - Lanes gradually run longer towards the right or left (can still be analysed).
- Significant ‘smiling’ - Slight curves on the outside lanes - Can still be analysed.
‘Smiling’ or curving that interferes with analysis.
Restriction Complete restriction in all lanes
One or two faint shadow bands on the gel.
- One lane with many shadow bands - A few shadow bands spread out over several lanes.
- More than one lane with several shadow bands - Lots of shadow bands over the whole gel.
Gel background Clear - Mostly clear background - Minor debris present that does not affect analysis.
- Some debris present that may or may not make analysis difficult (e.g. auto band search finds too many bands) - Background caused by photographing a gel with very light bands (image contrast was ‘brought up’ in photographing gel (makes image look grainy).
Lots of debris present that make the analysis impossible.
DNA degradation (smearing in the lanes)
Not present Minor background (smearing) in a few lanes but bands are clear.
Significant smearing in one to two lanes that may or may not make analysis difficult. Minor background (smearing) in many lanes.
- Smearing so that several lanes are not analysable.

TECHNICAL REPORT Sixth EQA scheme for Salmonella typing
19
Annex 4. BioNumerics Gel Analysis Quality Guidelines 2014
Parameters/scores Excellent Fair Poor
Position of gel Excellent placement of frame and gel inverted.
The image frame is positioned too low. Too much space framed at the bottom of the gel. Too much space framed on the sides of the gel.
Wells wrongly included when placing the frame. Gel is not inverted.
Strips All lanes correctly defined.
Lanes are defined to narrow (or wide). Lanes are defined outside profile. A single lane is not correctly defined.
Lanes not defined correctly.
Curves 1/3 or more of the lane is used for averaging curve thickness.
Curve extraction defined either to narrow or including almost the whole lane.
Curve set so that artefacts will cause wrong band assignment.
Normalisation All bands assigned correctly in all reference lanes.
Bottom bands <33kb were not assigned in some or all of the reference lanes.
Many bands not assigned in the reference lanes. The references were not included when submitting the XML-file.
Band assignment Excellent band assignment with regard to the quality of the gel.
Few double bands assigned as single bands or single bands assigned as double bands. Few shadow bands are assigned.
Band assignment not done correctly, making it impossible to make an inter-laboratory comparison.

Sixth EQA scheme for Salmonella typing TECHNICAL REPORT
20
Annex 5. Scores of the PFGE results
Gel Quality Parameters \laboratory
147 142 130 36 19 106 129 148 144 55 77 132 49 134 138 140 92 114 150 128 125 145 108 160 100
Image acquisition and running conditions
4 4 3 4 4 4 4 2 2 2 4 1 4 3 2 2 4 4 2 4 3 2 2 1 3
Cell suspension 4 4 4 4 4 4 4 3 4 4 4 4 4 4 4 4 4 4 4 4 4 4 4 4 4
Bands 4 1 2 4 4 3 3 1 2 2 3 1 3 4 1 4 4 2 3 1 2 1 2 1 4
Lanes 3 4 4 4 4 4 4 3 4 4 4 4 4 4 4 4 4 2 2 4 3 4 4 4 4
Restriction 4 1 4 4 4 4 4 2 4 4 4 4 4 4 4 4 4 4 4 4 4 1 4 4 4
Gel background 4 2 2 3 4 4 3 2 2 4 2 3 2 4 2 4 4 2 2 2 3 4 2 4 3
DNA degradation 4 2 4 4 4 4 4 2 4 4 4 1 4 4 1 4 4 4 4 4 2 4 4 4 3
Total quality 27 18 23 27 28 27 26 15 22 24 25 18 25 27 18 26 28 22 21 23 21 20 22 22 25
Scored by Annex 3 (TIFF Quality Grading Guidelines)
BN analysis
Parameters\Laboratory 147 142 130 36 19 106 129 148 55 77 49 134 92 150 128 108 100
Position of Gel 3 3 1 3 3 2 3 2 2 3 3 2 2 3 2 3 3
Strips 3 2 2 2 3 2 2 2 3 3 2 3 2 2 3 3 3
Curves 3 3 3 3 3 3 3 2 3 2 3 3 3 3 2 3 3
Normalization 3 3 2 3 3 3 3 1 3 3 3 3 3 2 1 3 3
Band Assignment 2 3 2 3 3 3 3 1 3 3 3 3 3 3 2 3 3
Total BN 14 14 10 14 15 13 14 8 14 14 14 14 13 13 10 15 15
Scored by Annex 4 (BioNumerics Gel Analysis Quality Guidelines)
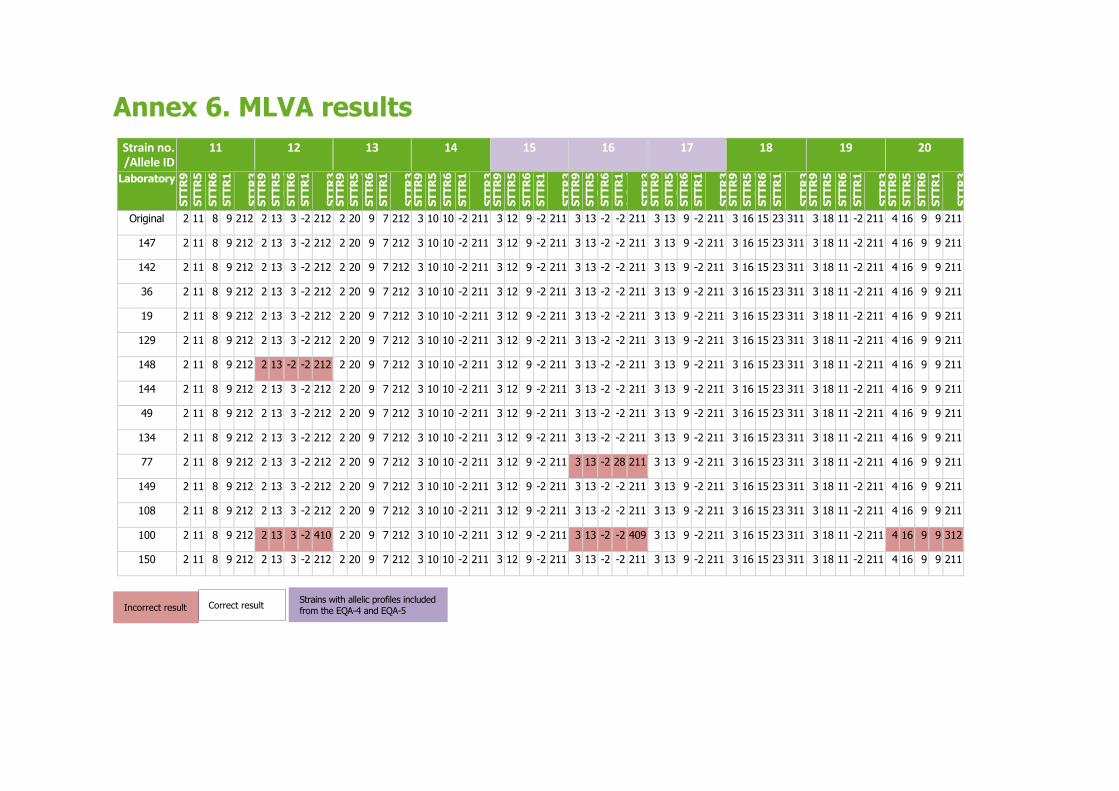
Annex 6. MLVA results
Strain no. /Allele ID
11 12 13 14 15 16 17 18 19 20
Laboratory S
TT
R9
-Real
ST
TR
5-R
eal
ST
TR
6-R
eal
ST
TR
10
-Real
ST
TR
3-R
eal
ST
TR
9-R
eal
ST
TR
5-R
eal
ST
TR
6-R
eal
ST
TR
10
-Real
ST
TR
3-R
eal
ST
TR
9-R
eal
ST
TR
5-R
eal
ST
TR
6-R
eal
ST
TR
10
-Real
ST
TR
3-R
eal
ST
TR
9-R
eal
ST
TR
5-R
eal
ST
TR
6-R
eal
ST
TR
10
-Real
ST
TR
3-R
eal
ST
TR
9-R
eal
ST
TR
5-R
eal
ST
TR
6-R
eal
ST
TR
10
-Real
ST
TR
3-R
eal
ST
TR
9-R
eal
ST
TR
5-R
eal
ST
TR
6-R
eal
ST
TR
10
-Real
ST
TR
3-R
eal
ST
TR
9-R
eal
ST
TR
5-R
eal
ST
TR
6-R
eal
ST
TR
10
-Real
ST
TR
3-R
eal
ST
TR
9-R
eal
ST
TR
5-R
eal
ST
TR
6-R
eal
ST
TR
10
-Real
ST
TR
3-R
eal
ST
TR
9-R
eal
ST
TR
5-R
eal
ST
TR
6-R
eal
ST
TR
10
-Real
ST
TR
3-R
eal
ST
TR
9-R
eal
ST
TR
5-R
eal
ST
TR
6-R
eal
ST
TR
10
-Real
ST
TR
3-R
eal
Original 2 11 8 9 212 2 13 3 -2 212 2 20 9 7 212 3 10 10 -2 211 3 12 9 -2 211 3 13 -2 -2 211 3 13 9 -2 211 3 16 15 23 311 3 18 11 -2 211 4 16 9 9 211
147 2 11 8 9 212 2 13 3 -2 212 2 20 9 7 212 3 10 10 -2 211 3 12 9 -2 211 3 13 -2 -2 211 3 13 9 -2 211 3 16 15 23 311 3 18 11 -2 211 4 16 9 9 211
142 2 11 8 9 212 2 13 3 -2 212 2 20 9 7 212 3 10 10 -2 211 3 12 9 -2 211 3 13 -2 -2 211 3 13 9 -2 211 3 16 15 23 311 3 18 11 -2 211 4 16 9 9 211
36 2 11 8 9 212 2 13 3 -2 212 2 20 9 7 212 3 10 10 -2 211 3 12 9 -2 211 3 13 -2 -2 211 3 13 9 -2 211 3 16 15 23 311 3 18 11 -2 211 4 16 9 9 211
19 2 11 8 9 212 2 13 3 -2 212 2 20 9 7 212 3 10 10 -2 211 3 12 9 -2 211 3 13 -2 -2 211 3 13 9 -2 211 3 16 15 23 311 3 18 11 -2 211 4 16 9 9 211
129 2 11 8 9 212 2 13 3 -2 212 2 20 9 7 212 3 10 10 -2 211 3 12 9 -2 211 3 13 -2 -2 211 3 13 9 -2 211 3 16 15 23 311 3 18 11 -2 211 4 16 9 9 211
148 2 11 8 9 212 2 13 -2 -2 212 2 20 9 7 212 3 10 10 -2 211 3 12 9 -2 211 3 13 -2 -2 211 3 13 9 -2 211 3 16 15 23 311 3 18 11 -2 211 4 16 9 9 211
144 2 11 8 9 212 2 13 3 -2 212 2 20 9 7 212 3 10 10 -2 211 3 12 9 -2 211 3 13 -2 -2 211 3 13 9 -2 211 3 16 15 23 311 3 18 11 -2 211 4 16 9 9 211
49 2 11 8 9 212 2 13 3 -2 212 2 20 9 7 212 3 10 10 -2 211 3 12 9 -2 211 3 13 -2 -2 211 3 13 9 -2 211 3 16 15 23 311 3 18 11 -2 211 4 16 9 9 211
134 2 11 8 9 212 2 13 3 -2 212 2 20 9 7 212 3 10 10 -2 211 3 12 9 -2 211 3 13 -2 -2 211 3 13 9 -2 211 3 16 15 23 311 3 18 11 -2 211 4 16 9 9 211
77 2 11 8 9 212 2 13 3 -2 212 2 20 9 7 212 3 10 10 -2 211 3 12 9 -2 211 3 13 -2 28 211 3 13 9 -2 211 3 16 15 23 311 3 18 11 -2 211 4 16 9 9 211
149 2 11 8 9 212 2 13 3 -2 212 2 20 9 7 212 3 10 10 -2 211 3 12 9 -2 211 3 13 -2 -2 211 3 13 9 -2 211 3 16 15 23 311 3 18 11 -2 211 4 16 9 9 211
108 2 11 8 9 212 2 13 3 -2 212 2 20 9 7 212 3 10 10 -2 211 3 12 9 -2 211 3 13 -2 -2 211 3 13 9 -2 211 3 16 15 23 311 3 18 11 -2 211 4 16 9 9 211
100 2 11 8 9 212 2 13 3 -2 410 2 20 9 7 212 3 10 10 -2 211 3 12 9 -2 211 3 13 -2 -2 409 3 13 9 -2 211 3 16 15 23 311 3 18 11 -2 211 4 16 9 9 312
150 2 11 8 9 212 2 13 3 -2 212 2 20 9 7 212 3 10 10 -2 211 3 12 9 -2 211 3 13 -2 -2 211 3 13 9 -2 211 3 16 15 23 311 3 18 11 -2 211 4 16 9 9 211
Incorrect result Correct result Strains with allelic profiles included from the EQA-4 and EQA-5

Sixth EQA scheme for Salmonella typing TECHNICAL REPORT
22
Annex 7. Reference strains
Reference strains for the MLVA part STTR9-Allele STTR5-Allele STTR6-Allele STTR10-Allele STTR3-Allele
STm-SSI001 6 9 13 10 211
STm-SSI002 7 15 12 12 311
STm-SSI003 8 11 NA NA 211
STm-SSI004 9 14 NA NA 211
STm-SSI005 3 12 11 21 311
STm-SSI006 3 16 13 24 311
STm-SSI007 3 19 10 NA 211
STm-SSI008 3 21 11 NA 211
STm-SSI009 2 23 22 13 212
STm-SSI010 2 24 NA NA 111
STm-SSI011 2 26 7 8 212
STm-SSI012 2 11 13 9 212
STm-SSI013 3 15 14 11 311
STm-SSI014 3 14 15 23 311
STm-SSI015 2 12 24 8 212
STm-SSI016 2 10 25 8 312
STm-SSI017 3 14 29 NA 311
STm-SSI018 2 11 13 4 212
STm-SSI019 2 9 12 5 212
STm-SSI020 3 16 13 29 311
STm-SSI021 4 9 6 8 314
STm-SSI022 2 20 13 11 12
STm-SSI023 2 16 9 14 310
STm-SSI024 4 17 8 6 105
STm-SSI025 2 12 13 6 106
STm-SSI026 3 17 19 16 311
STm-SSI027 5 12 8 10 11
STm-SSI028 5 13 6 7 8
STm-SSI029 3 7 16 31 311
STm-SSI030 2 5 4 13 9
STm-SSI031 3 12 7 NA 511
STm-SSI032 3 17 21 18 311
STm-SSI033 2 13 9 11 112

TECHNICAL REPORT Sixth EQA scheme for Salmonella typing
23
Annex 8. Guide to BN database
Guide for setting up your EQA database
There are two possibilities for setting up an EQA database. If you have BioNumerics version 6 or 7 you can just use the ready-made database(s) that have been sent out together with this instruction.
Two important things:
YOU NEED TO SET UP A NEW database; do not use any of your existing databases not even the previous EQA´s. This is important in order to be able to submit correctly formatted results – use guide (A).
If (and only if) you have a BioNumerics version prior to 6.0, use the instruction on setting up a database from scratch (B).
A) Setting up a database if you have BioNumerics 6.0 – 7.x
1. The database is packaged in the zip archive called "Listeria EQA-3 BN<6/7>.zip" "E coli EQA-6 BN<6/7>.zip" or "salmonella EQA-6 BN<6/7>.zip". Note that there are two versions of each, one for
version 6 and one for version 7 of BioNumerics. 2. Please choose the correct file and download the files from links found in the e-mail containing the
submission details to your own PC 3. Unzip the files into the folder “XX” where you would like to have your database 4. The archive contains the complete ready-made database (one file and one folder) 5. Open the BioNumerics program and change the home directory to where you placed your database
6. Press the third button from the left (look at the picture above) and choose the first option “change home
directory” 7. Browse – to find the pre-configured database (desktop or the “XX” folder where you saved the files) 8. In the open pre-configured database - the only visible is the STD_H9812Ec 9. Then import your TIFF, and use the 4 digit strain no as KEY (USE the guide to change the TIFF from a 16
bit to an 8 bit file correctly) 10. Fill in LAB ID = for example “DK_SSI” 11. Make the BN analysis 12. Afterwards follow the XML export guide below - it is important that you select your strains, before making
the export
B) Set up a database from scratch
All the images in this instruction refer to E. coli so just exchange “E coli” for either “Salmonella” or “Listeria” when setting up these databases.
The screen shots are from version 6 of BioNumerics so things may look slightly different in your version.
Set up the database by first creating an empty database. Then make an import of an XML file containing experiment settings and field definitions.

Sixth EQA scheme for Salmonella typing TECHNICAL REPORT
24
Set up the empty database
1. Choose to “Create a new database”
Enter a database name
2. Use default values
Remember to enter a database name,
“Salmonella EQA” or “Listeria EQA” or “E coli EQA”
TECHNICAL REPORT Sixth EQA scheme for Salmonella typing
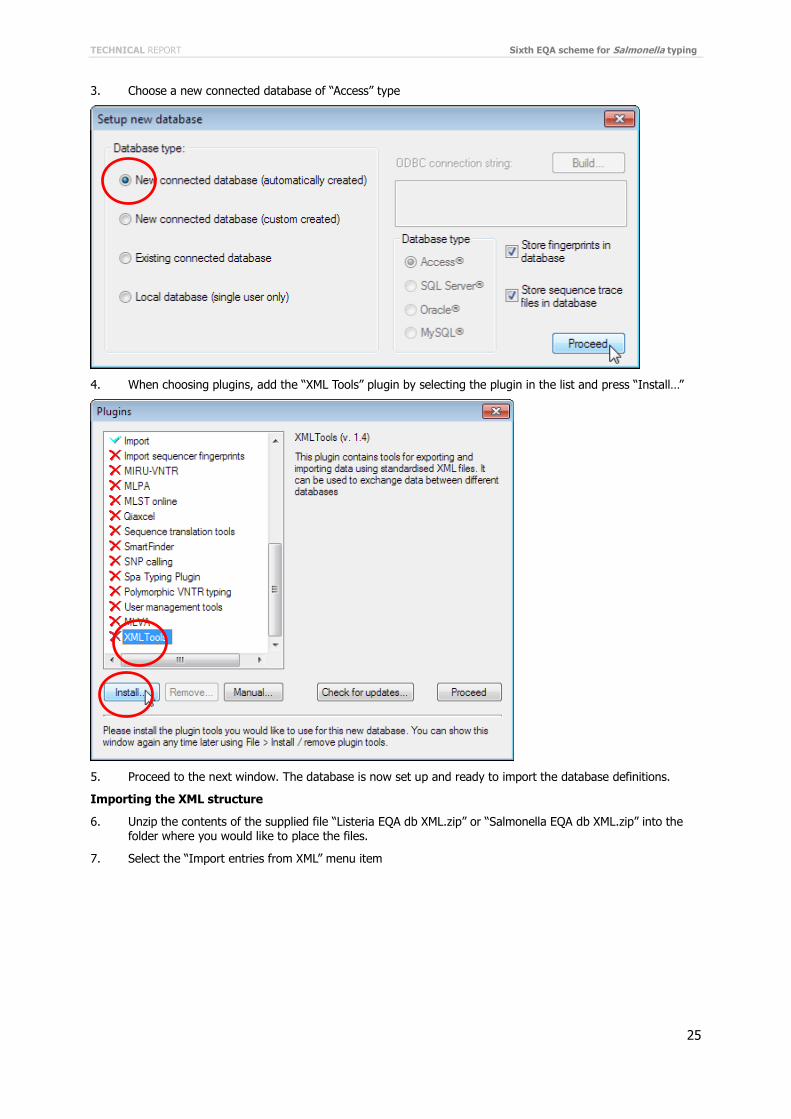
25
3. Choose a new connected database of “Access” type
4. When choosing plugins, add the “XML Tools” plugin by selecting the plugin in the list and press “Install…”
5. Proceed to the next window. The database is now set up and ready to import the database definitions.
Importing the XML structure
6. Unzip the contents of the supplied file “Listeria EQA db XML.zip” or “Salmonella EQA db XML.zip” into the folder where you would like to place the files.
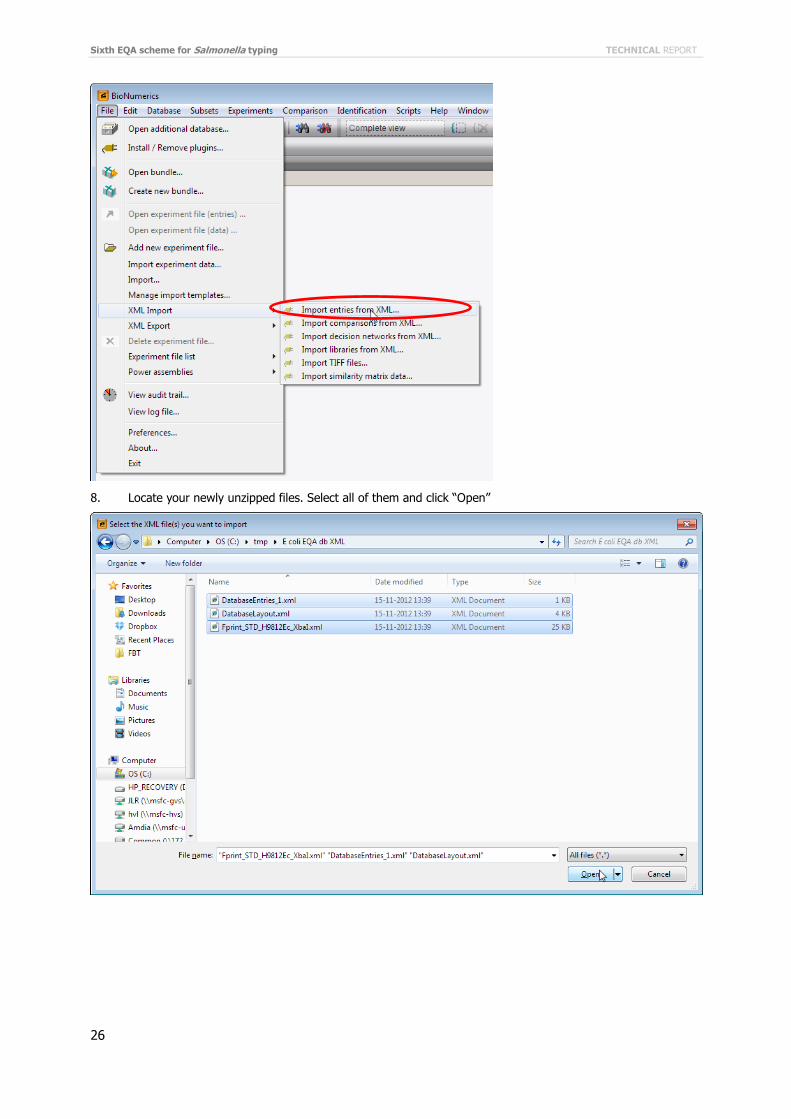
7. Select the “Import entries from XML” menu item
Sixth EQA scheme for Salmonella typing TECHNICAL REPORT
26
8. Locate your newly unzipped files. Select all of them and click “Open”

TECHNICAL REPORT Sixth EQA scheme for Salmonella typing
27
9. Mark the box “Overwrite experiment settings” and click “OK”
10. Restart the database

Sixth EQA scheme for Salmonella typing TECHNICAL REPORT
28
Annex 9. Guide image acquisition
Image acquisition and production of TIFF files
The following SOP is written in general terms since various laboratories are using different equipment. Use your image acquisition software per the manufacturers’ instruction.
1. After adequate staining and de-staining of the agarose gel
2. Carefully remove the gel from the appropriate container with gloved hands or gel scoop; drain excess liquid from gel and place the gel in your imaging equipment.
3. Turn on the white light and using the computer monitor to visualize the gel, center the gel on screen with the wells parallel to the top of the screen so that the wells are still visible.
4. A vital point in getting high quality Gel profiles is minimizing the possibility of blur/fussiness
Adjust the aperture (f-stop) of your camera (either directly on the camera or though the software) so that you never use a wide open aperture (very low f-stop).
A wide open aperture gives you soft/blurry images with focusing problems in the corners of your image.
E.g. if your instruments wide open aperture (minimum f-stop) is: f:1.8, make sure to close the
aperture by increasing the value (stopping down) to at least f:4.
5. Zoom in or out until the image completely fills the imaging window making sure that the wells are included on the top of the screen.
6. Using a flat ruler or grid, focus the image until it is sharp.
If necessary, once the image is in focus make minor adjustments by zooming in or out to ensure that the image size is appropriate. Minor adjustments to the image size should not change the focus.
7. Turn off the white light, and turn on the UV light. If you have the option use a weaker UV intensity. This might be named such things as “Analytical” (weak) and “Preparative.”
8. Adjust the exposure time until a satisfactory image is obtained.
This might mean integration of several images or a single exposure, consult your machines manuals. Bands on every lane should be visible without excessive brightness. NOTE: Optimize the exposure time by showing use the “saturation view” of the image, this is usually
shown as false color (red) overlaying the image.

TECHNICAL REPORT Sixth EQA scheme for Salmonella typing
29
Adjusting the exposure time of the camera so that the strongest sample band (DNA) is just below
the point of saturation (no red showing). Saturation in the gel wells may be present and is acceptable. If the image is not visible, increase the
exposure times or check the aperture on the camera (top ring).
9. Adjust the aperture to the appropriate level of brightness by opening it up to the maximum setting. If the image is still not visible, the gel may have to be re-stained.
10. Once the desired image has been captured, turn off the UV light to avoid quenching the DNA in the gel.
11. Save captured image, as a TIFF file in its original size. Do not resize or change dpi of the image
12. If you have images in 12 bit (n.b. these might appear as 16-bit images) format you can find some guidelines in the next Appendix.
TL:DR
Let the gel fill the whole image. Capture images at your instruments highest resolution Be careful to focus your camera properly “Stop down” your aperture a bit Expose so that the strongest sample band is just below saturation Do not resize or change dpi of the image. Do not perform any post processing of the image, neither in the image capture software, nor with any
external image editing tools, such as Photoshop etc.

Sixth EQA scheme for Salmonella typing TECHNICAL REPORT
30
Annex 10. Guide to exporting from BN database
Exporting XML data from BioNumerics
After analysing you data, you export all your results in XML format. The procedure looks slightly different in BioNumerics version 6 (A) and 7 (B).
A) BioNumerics version 6
In BioNumerics version 6 and earlier, you need to export TIFF files separately from the analysed data. Follow all steps of the guide below.
1. Select all isolates that you would like to export
2. Export selection as “XML”
3. De-select the check box “Only export selected fingerprint lanes” and make sure all experiments and all fields are marked
= Unique strain number Lab ID

TECHNICAL REPORT Sixth EQA scheme for Salmonella typing
31
4. Now export the TIFF file(s)
5. Select which experiments to export; in the case of Listeria you can export both enzymes at the same time
6. Now locate the EXPORT directory in your database directory. Remember to check that the TIFF file is included
7. Send all XML and TIFF files located via e-mail.
8. Please compress the files into a zip archive. One way of creating the zip archive is to mark all the XML and TIFF files, right click on them and choose “Send to Compressed (zipped) folder”

Sixth EQA scheme for Salmonella typing TECHNICAL REPORT
32
B) BioNumerics version 7
In BioNumerics 7 all data is exported in a single step.
1. Select all isolates that you would like to export
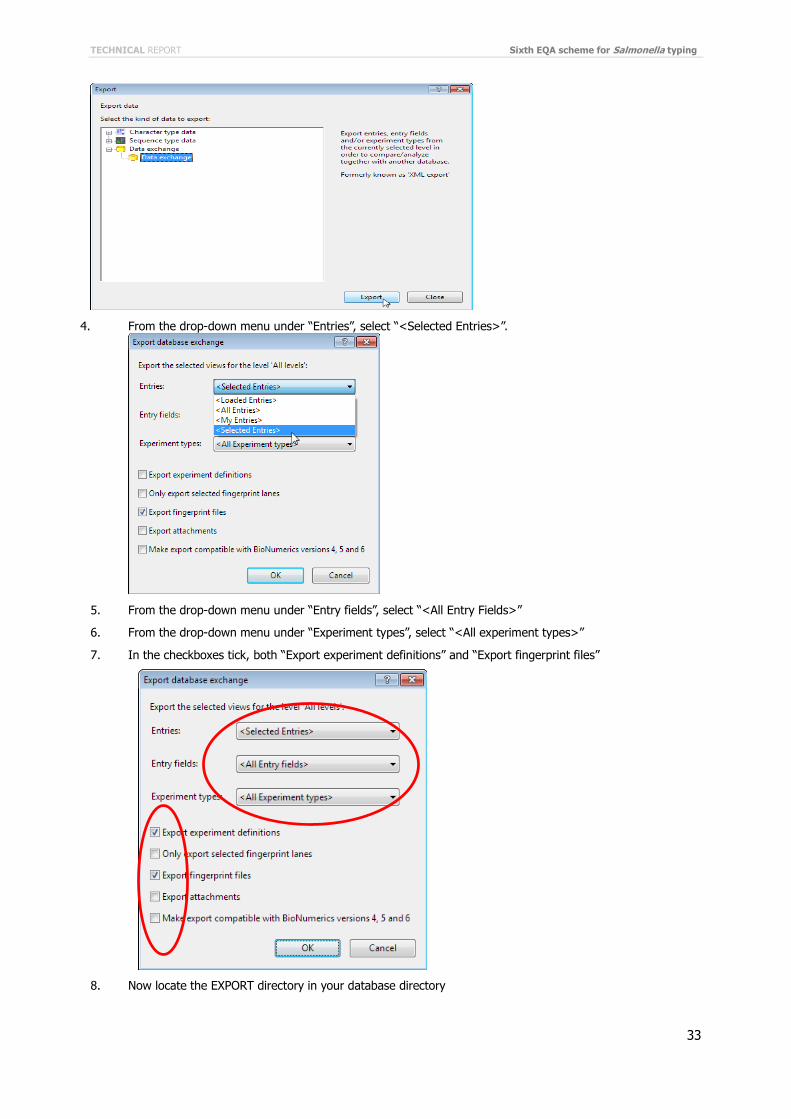
2. Click “File” “Export”, choose “Data exchange” -
3. and click “Export”
= Unique strain
TECHNICAL REPORT Sixth EQA scheme for Salmonella typing
33
4. From the drop-down menu under “Entries”, select “<Selected Entries>”.
5. From the drop-down menu under “Entry fields”, select “<All Entry Fields>”
6. From the drop-down menu under “Experiment types”, select “<All experiment types>”
7. In the checkboxes tick, both “Export experiment definitions” and “Export fingerprint files”
8. Now locate the EXPORT directory in your database directory

Sixth EQA scheme for Salmonella typing TECHNICAL REPORT
34
9. The export described will yield a file called “export.zip” that contains all data
10. Rename the file with your Lab_ID (e.g. DK_SSI)
11. Submit the file to the EQA providers by email

ECDC is committed to ensuring the transparency and independence of its work
In accordance with the Staff Regulations for Officials and Conditions of Employment of Other Servants of the European Union and the ECDC Independence Policy, ECDC staff members shall not, in the performance of their duties, deal with a matter in which, directly or indirectly, they have any personal interest such as to impair their independence. Declarations of interest must be received from any prospective contractor(s) before any contract can be awarded.www.ecdc.europa.eu/en/aboutus/transparency
HOW TO OBTAIN EU PUBLICATIONSFree publications:• onecopy: viaEUBookshop(http://bookshop.europa.eu);
• morethanonecopyorposters/maps: fromtheEuropeanUnion’srepresentations(http://ec.europa.eu/represent_en.htm); fromthedelegationsinnon-EUcountries(http://eeas.europa.eu/delegations/index_en.htm); bycontactingtheEuropeDirectservice(http://europa.eu/europedirect/index_en.htm)or calling 00 800 6 7 8 9 10 11 (freephone number from anywhere in the EU) (*).
(*)Theinformationgivenisfree,asaremostcalls(thoughsomeoperators,phoneboxesorhotelsmaychargeyou).
Priced publications:• viaEUBookshop(http://bookshop.europa.eu).
European Centre for Disease Prevention and Control (ECDC)
Postaladdress: Granits väg 8, SE-171 65 Solna, Sweden
Visitingaddress: Tomtebodavägen 11a, SE-171 65 Solna, Sweden
Tel. +46 858601000Fax+46858601001www.ecdc.europa.eu
An agency of the European Unionwww.europa.eu
Subscribe to our publications www.ecdc.europa.eu/en/publications
Contact us [email protected]
Follow us on Twitter @ECDC_EU
Like our Facebook page www.facebook.com/ECDC.EU