Embed Size (px)
Citation preview

Six Sigma Quality

1. Understand total quality management.2. Describe how quality is measured and be
aware of the different dimensions of quality.
3. Understand the meaning of six sigma and be able to explain the define, measure, analyze, improve, and control (DMAIC) quality improvement process.
4. Understand what ISO certification means.

Critical to quality: attributes most important to the customer
Defect: failing to deliver what customer wants Process capability: what your process can
deliver Variation: what customer sees and feels Stable operations: ensuring consistent,
predictable processes to improve what the customer sees and feels
Design for six-sigma: designing to meet customer needs and process capability
LO 1LO 1

Total quality management: managing the entire organization so that it excels on all dimensions of products and services that are important to the customer
Two fundamental operational goals:1. Careful design of the product or service2. Ensuring that the organization’s systems can
consistently produce the design TQM was a response to the Japanese
superiority in quality
LO 1LO 1

Established in 1987 by Department of Commerce
Goal is to help companies review and structure their quality programs
Has requirement that suppliers demonstrate they are measuring and documenting their quality practices
LO 1LO 1

Three Quality Gurus Define Quality
Crosby: conformance to requirementsDeming: A predictable degree of
uniformity and dependability at low cost and suited to the market
Juran: fitness for use (satisfies customer’s needs)
LO 1LO 1

Create consistency of purpose Lead to promote change Build quality into the products Build long term relationships Continuously improve product, quality,
and service Start training Emphasize leadership
LO 1LO 1
Drive out fear Break down barriers between
departments Stop haranguing workers Support, help, improve Remove barriers to pride in work Institute a vigorous program of education
and self-improvement Put everybody in the company to work on
the transformation
LO 1LO 1

Design quality: inherent value of the product in the marketplace
Conformance quality: degree to which the product or service design specifications are met
Quality at the source: the person who does the work takes responsibility for making sure it meets specifications
LO 1LO 1

Performance: primary product or service characteristics
Features: added touches, bells and whistles, secondary characteristics
Reliability/durability: consistency of performance over time
Serviceability: ease of repair Aesthetics: sensory characteristics Perceived quality: past performance and
reputation
LO 2LO 2
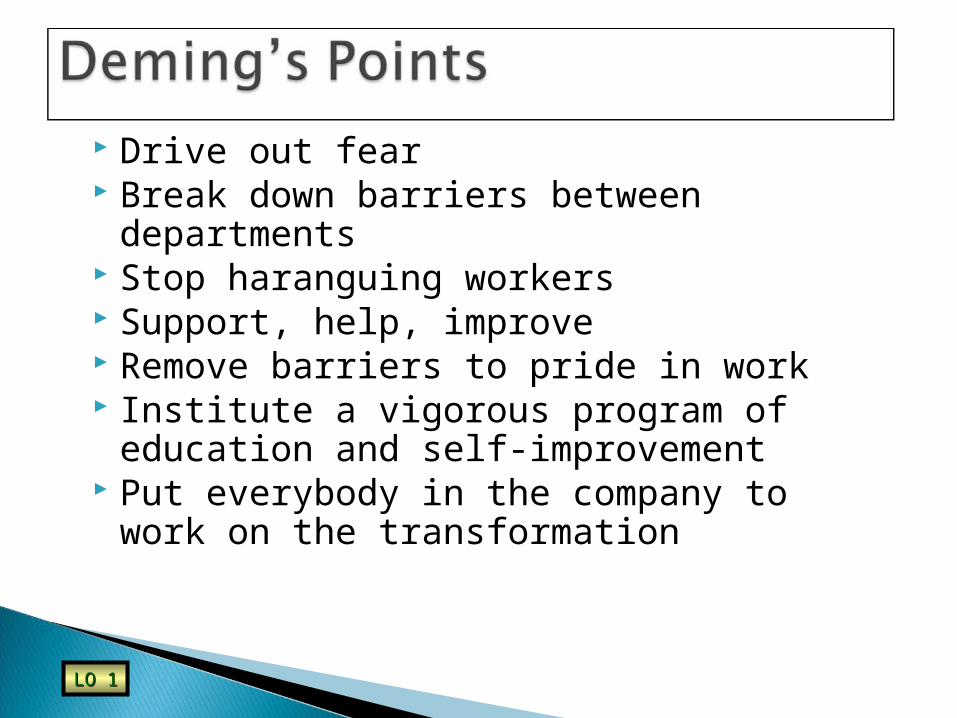
Basic cost assumptions1. Failures are caused2. Prevention is cheaper3. Performance can be measured
Cost of quality1. Appraisal cost2. Prevention cost3. Internal failure cost4. External failure cost
LO 2LO 2

4.Act 1.Plan
3.Check 2.Do
Identify the improvement and make a plan
Test the planIs the plan working
Implement the plan
LO 3LO 3

A philosophy and set of methods companies use to eliminate defects in their products and processes
Seeks to reduce variation in the processes that lead to product defects
The name, “six sigma” refers to the variation that exists within plus or minus three standard deviations of the process outputsLO 3LO 3
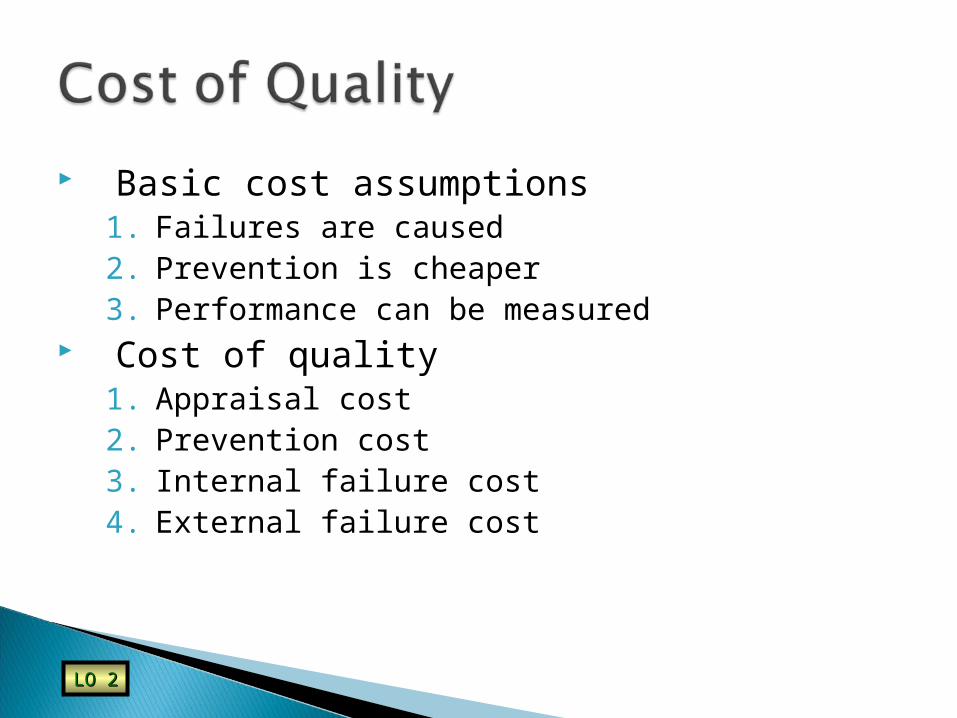
Six Sigma allows managers to readily describe process performance using a common metric: Defects Per Million Opportunities (DPMO)
1,000,000 x
units of No. x
unit per error for
iesopportunit ofNumber
defects ofNumber
DPMO 1,000,000 x
units of No. x
unit per error for
iesopportunit ofNumber
defects ofNumber
DPMO
LO 3LO 3

Example of Defects Per Million Opportunities (DPMO) calculation. Suppose we observe 200 letters delivered incorrectly to the wrong addresses in a small city during a single day when a total of 200,000 letters were delivered. What is the DPMO in this situation?
Example of Defects Per Million Opportunities (DPMO) calculation. Suppose we observe 200 letters delivered incorrectly to the wrong addresses in a small city during a single day when a total of 200,000 letters were delivered. What is the DPMO in this situation?
000,1 1,000,000 x
200,000 x 1
200DPMO
000,1 1,000,000 x
200,000 x 1
200DPMO
So, for every one million letters delivered this city’s postal managers can expect to have 1,000 letters incorrectly sent to the wrong
address.
So, for every one million letters delivered this city’s postal managers can expect to have 1,000 letters incorrectly sent to the wrong
address.
Cost of Quality: What might that DPMO mean in terms of over-time employment to correct the errors?
Cost of Quality: What might that DPMO mean in terms of over-time employment to correct the errors?
LO 3LO 3

Define, Measure, Analyze, Improve, and Control (DMAIC)
Developed by General Electric as a means of focusing effort on quality using a methodological approach
Overall focus of the methodology is to understand and achieve what the customer wants
A 6-sigma program seeks to reduce the variation in the processes that lead to these defects
DMAIC consists of five steps….LO 3LO 3

1. Define◦ Identify customers and their priorities◦ Identify a project◦ Identify critical-to-quality characteristics
2. Measure◦ Determine how to measure the process◦ Identify key internal processes
3. Analyze◦ Determine most likely causes of defects◦ Understand why key defects are generated
LO 3LO 3

4. Improve◦ Identify means to remove causes of defects◦ Confirm the key variables◦ Identify the maximum acceptance ranges◦ Modify process to stay within acceptable range
5. Control◦ Determine how to maintain improvements◦ Put tools in place to track key variables
LO 3LO 3
Uses many of the same statistical tools as other quality movements◦ Used in a systematic project-oriented fashion
through define, measure, analyze, improve, and control (DMAIC) cycle More detailed version of Deming PDCA cycle
Continuous improvement: seeks continual improvement in all aspects of operations◦ Also uses scientific method
LO 2LO 2

We are the maker of this cereal. Consumer Reports has just published an article that shows that we frequently have less than 15 ounces of cereal in a box.
What should we do?
LO 3LO 3

What is the critical-to-quality characteristic?
The CTQ (critical-to-quality) characteristic in this case is the weight of the cereal in the box.
LO 3LO 3

How would we measure to evaluate the extent of the problem?
What are acceptable limits on this measure?
LO 3LO 3

Let’s assume that the government says that we must be within ± 5 percent of the weight advertised on the box.
Upper Tolerance Limit = 16 + .05(16) = 16.8 ounces
Lower Tolerance Limit = 16 – .05(16) = 15.2 ounces
LO 3LO 3

We go out and buy 1,000 boxes of cereal and find that they weight an average of 15.875 ounces with a standard deviation of .529 ounces.
What percentage of boxes are outside the tolerance limits?
LO 3LO 3
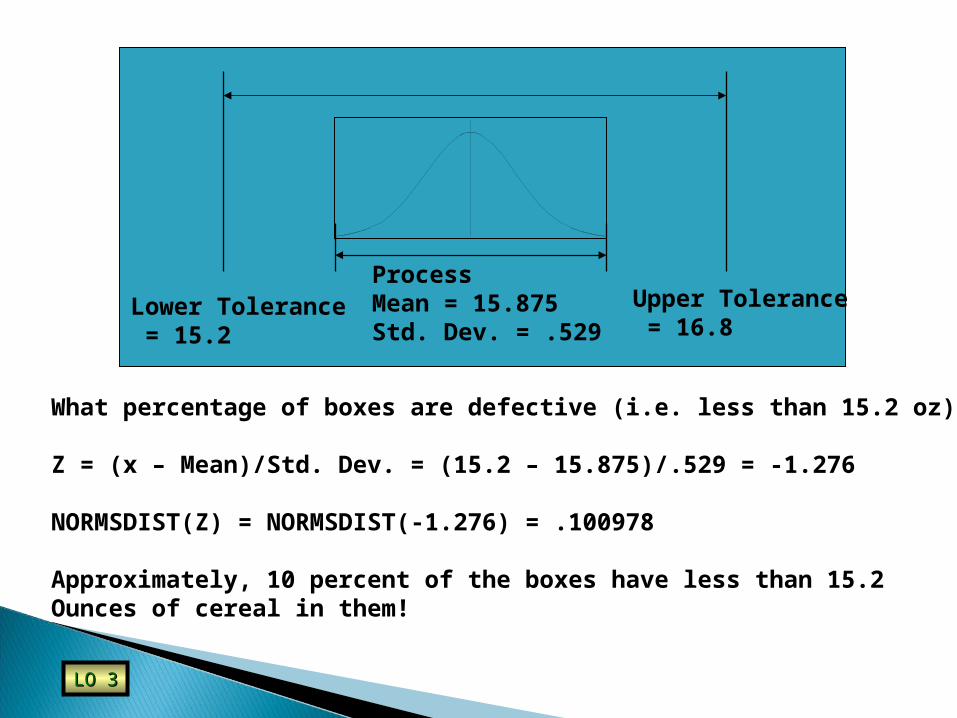
Upper Tolerance = 16.8
Lower Tolerance = 15.2
ProcessMean = 15.875Std. Dev. = .529
What percentage of boxes are defective (i.e. less than 15.2 oz)?
Z = (x – Mean)/Std. Dev. = (15.2 – 15.875)/.529 = -1.276
NORMSDIST(Z) = NORMSDIST(-1.276) = .100978
Approximately, 10 percent of the boxes have less than 15.2 Ounces of cereal in them!
LO 3LO 3

◦Worker error◦Machine issues◦Raw material mix◦. . .
LO 3LO 3

◦6 minimum from process center to nearest spec
1 23 1 02 3
12
6
LO 3LO 3

Implies 2 ppB “bad” with no process shift With 1.5 shift in either direction from center (process
will move), implies 3.4 ppm “bad”.
1 23 1 02 3
12
LO 3LO 3
What changes are to be made to reduce variation?
Center process Change process specifications
LO 3LO 3

Statistical Process Control (SPC)◦Use data from the actual process
◦Estimate distributions◦Look at capability - is good quality possible
◦Statistically monitor the process over time
LO 3LO 3
Flowcharts Run charts Pareto charts Checksheets Cause-and-effect diagrams Opportunity flow diagrams Control charts
LO 2LO 2

LO 2LO 2

LO 2LO 2

LO 2LO 2

LO 2LO 2

LO 2LO 2

LO 2LO 2

LO 2LO 2

Failure mode and effect analysis (DMEA): a structured approach to identify, estimate, prioritize, and evaluate risk of possible failures at each stage in the process
Design of experiments (DOE): a statistical test to determine cause-and-effect relationships between process variables and output
LO 3LO 3

1. Executive leaders must champion the process of improvement
2. Corporation-wide training in Six Sigma concepts and tools
3. Setting stretch objectives for improvement4. Continuous reinforcement and rewards
LO 3LO 3

Shingo’s argument:◦ SQC methods do not prevent defects◦ Defects arise when people make errors◦ Defects can be prevented by providing workers with
feedback on errors1. Successive check2. Self-check3. Source inspection
Poka-Yoke includes:◦ Checklists◦ Special tooling that prevents workers from making
errors
LO 3LO 3

Series of standards agreed upon by the International Organization for Standardization (ISO)◦ Adopted in 1987◦ More than 160 countries
A prerequisite for global competition? ISO 9000 an international reference for
quality, ISO 14000 is primarily concerned with environmental management
LO 4LO 4
1. First party: A firm audits itself against ISO 9000 standards
2. Second party: A customer audits its supplier
3. Third party: A "qualified" national or international standards or certifying agency serves as auditor
LO 4LO 4

1. Identify those processes needing improvement
2. Identify a firm that is the world leader in performing the process
3. Contact the managers of that company and make a personal visit to interview managers and workers
4. Analyze data
LO 4LO 4